Article

Introducing an Artificial Neural Network for Virtually Increasing the Sample Size of Bioequivalence Studies

by
Dimitris Papadopoulos
1 and
Vangelis D. Karalis
1,2,*
1
Department of Pharmacy, School of Health Sciences, National and Kapodistrian University of Athens, 15784 Athens, Greece
2
Institute of Applied and Computational Mathematics, Foundation for Research and Technology Hellas (FORTH), 70013 Heraklion, Greece
*
Author to whom correspondence should be addressed.
Appl. Sci. 2024, 14(7), 2970; https://doi.org/10.3390/app14072970
Submission received: 8 February 2024 / Revised: 30 March 2024 / Accepted: 30 March 2024 / Published: 31 March 2024
(This article belongs to the Section Computing and Artificial Intelligence)

Abstract

:
Sample size is a key factor in bioequivalence and clinical trials. An appropriately large sample is necessary to gain valuable insights into a designated population. However, large sample sizes lead to increased human exposure, costs, and a longer time for completion. In a previous study, we introduced the idea of using variational autoencoders (VAEs), a type of artificial neural network, to synthetically create in clinical studies. In this work, we further elaborate on this idea and expand it in the field of bioequivalence (BE) studies. A computational methodology was developed, combining Monte Carlo simulations of 2 × 2 crossover BE trials with deep learning algorithms, specifically VAEs. Various scenarios, including variability levels, the actual sample size, the VAE-generated sample size, and the difference in performance between the two pharmaceutical products under comparison, were explored. All simulations showed that incorporating AI generative algorithms for creating virtual populations in BE trials has many advantages, as less actual human data can be used to achieve similar, and even better, results. Overall, this work shows how the application of generative AI algorithms, like VAEs, in clinical/bioequivalence studies can be a modern tool to significantly reduce human exposure, costs, and trial completion time.

1. Introduction

Sample size estimation in clinical trials is a critical step which requires special attention, since any negligence in its calculation may result into misleading conclusions and can compromise the safety and the efficacy of the clinical trial [1,2]. A sufficiently large representative sample allows the derivation of robust insights for a given population. Although, collecting substantial amounts of data can be difficult, expensive, and long-lasting. Moreover, it is mandatory that a protocol is developed, which is followed by the clinical trial, in which the objectives, the primary and secondary endpoints, and all other aspects of the trial are clearly defined [1].
Sample size determination depends on the design of the study, the type of outcome, the statistical hypotheses, the expected variability in the measurement, the minimum detectable difference, the statistical power, and the level of significance [3]. Insufficient sample size in clinical trials could lead to an increase in type II error (false negatives), thus being unable to detect a true difference among groups and label the difference as statistically insignificant. In contrast, unnecessary sample size may be considered unethical or unfeasible due to high costs. Furthermore, all governmental and regulatory agencies worldwide require justification of the number of volunteers enrolled in the study.
As with any clinical trial, similar concerns apply to bioequivalence (BE) studies, especially in cases where a generic pharmaceutical product (i.e., Test, T) is compared against the reference product (R) [4,5]. Two pharmaceutical products are deemed bioequivalent if they contain the same active substance at the same molar dose, and their equivalence is demonstrated through comparative pharmacokinetic studies, i.e., bioequivalence trials. If bioequivalence is established in the comparative pharmacokinetic trial, the two products can be considered therapeutically equivalent [4,5].
In the context of BE testing, various approaches have been proposed to address the need of recruiting a large number of volunteers, particularly for highly variable drugs [4,5]. In recent years, the emergence of in silico methods has led to the adoption of computational alternatives [6]. These computational methods are utilized for virtually increasing the sample size, a process known as data augmentation. Artificial intelligence (AI), particularly deep learning, has proven advantageous in its several aspects of clinical studies [7]. Considering the importance of data accessibility in data-oriented and personalized healthcare, the use of AI becomes imperative. Training AI models has demonstrated considerable benefits, accelerating and simplifying every step within drug research [8,9].
Recently, our research group introduced the idea of using an artificial neural network, specifically variational autoencoders (VAEs), in clinical studies [10]. VAE models, falling within the category of generative models, leverage deep learning to generate new data once trained. Unlike traditional autoencoders, VAEs are not only capable of reducing variability but they are also capable of generating synthetic data based on real-world data. VAE models utilize two functions: the encoder, responsible for encoding input data, and the decoder, tasked with rebuilding the input data using the output generated by the encoder. This deep learning method was found to offer several advantages in clinical trials with a parallel design [10]. Utilizing clinical data generated by VAE enhanced the statistical power of the studies. The incidence of type I error remained low and consistent with the levels observed in the actual dataset, whereas the statistical power of the VAE approach was even higher compared to that observed in the original datasets [10].
This study is the second step toward using generative AI algorithms in clinical trial data augmentation. In our previous study, the idea was introduced in the case of simple clinical trials; this study proposes the use of artificial neural networks, particularly VAEs, to reduce the need to recruit many subjects in bioequivalence studies. In this context, this work investigates the suitability of using VAEs to virtually increase the sample size in the typical situation of BE studies, namely, the two-period, two-treatment 2 × 2 crossover design with a washout period [11]. To accomplish this task, we developed a computational methodology that combines Monte Carlo simulations of 2 × 2 BE trials with deep learning methods (i.e., VAEs). Various scenarios, including variability levels, the actual sample size of the BE study, AI-generated sample size, and the relationship in the average performance between the T and R pharmaceutical products, were explored. Our ultimate purpose was to assess the usefulness of VAE as an AI method in bioequivalence studies, aiming to significantly reduce human exposure, costs, and trial completion time.

2. Materials and Methods

To assess the utility of VAE in BE studies, it was crucial to replicate the actual conditions of BE testing. The main components of the methodology include generating virtual subjects using Monte Carlo simulations, training/tuning the VAE model to create “synthesized” subjects, applying typical BE testing conditions imposed by regulatory authorities (such as the appropriate statistical framework and acceptance limits), and repeating the entire process several (i.e., hundreds) times to obtain robust estimates. The aforementioned procedure was applied across various scenarios (e.g., different T/R ratios, variability, and original sample size). Each step of the analysis is explained below.

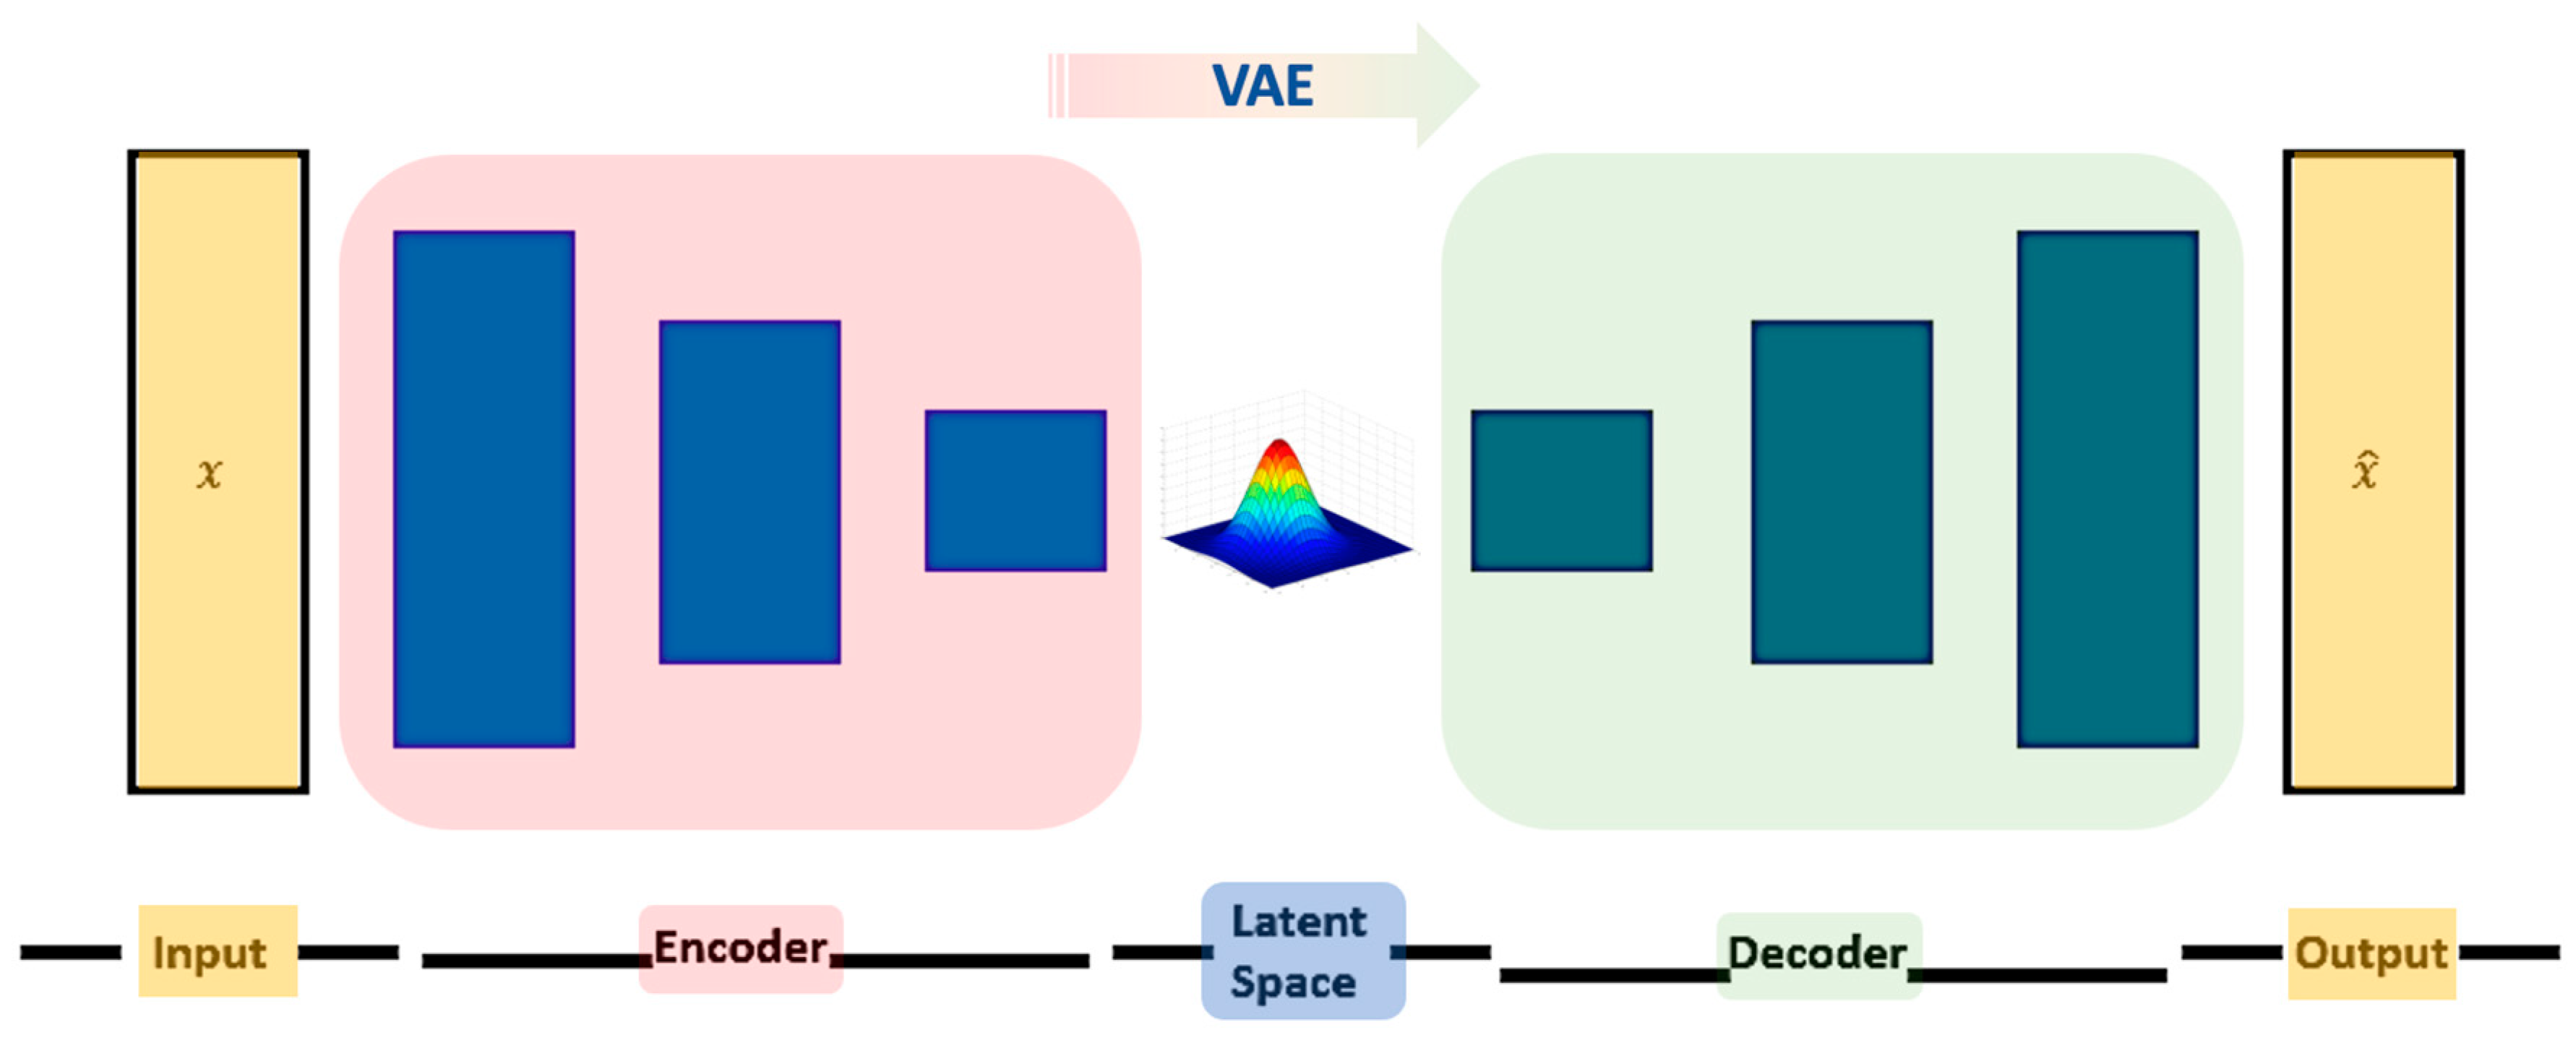
2.1. Variational Autoencoders

Neural networks are composed of neurons, each consisting of a set of inputs, a set of weights, and a nonlinear activation function, typically [12,13]. When neurons are stacked vertically, they form layers and, when layers are placed sequentially, they constitute the neural network. To train a neural network, an input is provided, traversing the entire neural network from left to right to calculate weights (forward propagation) and iteratively optimizing them with respect to a suitable cost function (backward propagation).
VAEs comprise two components: the encoder and the decoder, similar to conventional autoencoders [14,15]. In both components, the layer numbers are the same. The encoder maps the input data to a latent representation later utilized by the decoder for reconstruction. The power of VAEs lies in establishing a connection between actual data and a probability distribution in the latent space. This distribution, frequently defined by the average and standard deviation of a normal distribution, facilitates meaningful random sampling from the latent space. The sampled output can therefore be considered as input for the decoder, leading to the generation of new data. In contrast with traditional autoencoders, the VAE cost function consists of two parts: the reconstruction loss and the Kullback–Leibler loss. A detailed description of VAEs and autoencoders was also provided in a previous study [10]. A schematic representation of a VAE is presented in Figure 1.

2.2. Tuning of Hyperparameters

Hyperparameter tuning in a neural network is crucial. The optimal configuration, including the number of neurons, hidden layers, epochs, and the activation function for both hidden and output layers, depends on the complexity and nature of the problem. Typically, the final choice of these hyperparameters is determined through experimentation and literature review.
We extensively fine-tuned the hyperparameters, which included searching for the most suitable activation functions (e.g., softplus, linear, ReLU, sigmoid, etc.), determining the optimal number of hidden layers, and adjusting the number of epochs. Drawing from our previous study experience and the investigations conducted in this work, we ultimately concluded that the softplus activation function performed best for hidden layers, while the linear function was optimal for output layers. Also, the optimal number of hidden layers and epochs was 3 and 1000, respectively [10]. Similarly, the optimal quantity of neurons for every hidden layer, from left to right, was found to be 64-32-16 for the encoder and 16-32-64 for the decoder [10]. In addition, this study explored the impact of unequally weighting the two parts of the cost function and standardizing the input data by removing the mean and scaling to unit variance. In this context, Table 1 summarizes all the combinations of settings that were investigated in this study.

2.3. Simulation Framework

The simulation of the bioequivalence in the context of 2 × 2 crossover design consisted of generating subjects for the reference (i.e., R) and the test (i.e., T) groups for both periods, termed as “original” [6]. Initially, a total of NR subjects was generated for the first period, corresponding to the R product, from a random process with mean μR1 and standard deviation σR1. For the T drug, NT subjects, equal to NR, were generated, following the same process with mean μT1 and standard deviation σT1. Both groups had equal coefficient of variation (CV), referring to the between-subject variability. For the second period, each of the total N = NR + NT subjects was multiplied with a stochastic term, which was generated through a random process, to incorporate the within-subject variability of the subjects.
The original data were randomly subsampled with varying proportions, referred to as “subsampled”. These subsampled datasets were used to train the VAE model and, in a next step, to synthetize the new virtual subjects termed as “generated”. Finally, the “generated” data from both groups (T and R) and study periods (i.e., periods I and II of the 2 × 2 crossover design) were transferred for statistical analysis, using the official statistical framework imposed by regulatory authorities for bioequivalence [4,5]. This statistical analysis refers to the following steps: ln-transformation of the variables, application of a linear model (ANOVA), calculation of the residual error, using this error term to construct a 90% confidence interval for the mean difference between T and R in the ln-domain, and, lastly, checking if BE is declared [4,5,6]. This entire procedure was repeated 500 times and the percentage of bioequivalence acceptance was measured at the end [6].
The above-mentioned route of analysis can be outlined in the following steps:
I.
Ν individuals are randomly generated for both groups in the case of the first period:
a.
NT individuals for the T group for the first period, with mean μT1 and standard deviation σT1;
b.
NR individuals for the R group for the first period, with mean μR1 and standard deviation σR1;
c.
The T and R groups were set to have equal CVs;
d.
The sample sizes of T and R groups were assumed to be equal: NT = NR;
e.
Thus, the sample size of the study is: N = NT + NR.
II.
The N individuals from the first period are multiplied, with a randomly generated “stochastic term”, with mean μST and standard deviation σST. The stochastic term coefficient of variation (CVw) represents the “within subject variability” for each simulated volunteer between the period I and II of the crossover study [6]. It should be noted that the CVw is different to the between-subject variability (i.e., CV) discussed in step “Ic”.
III.
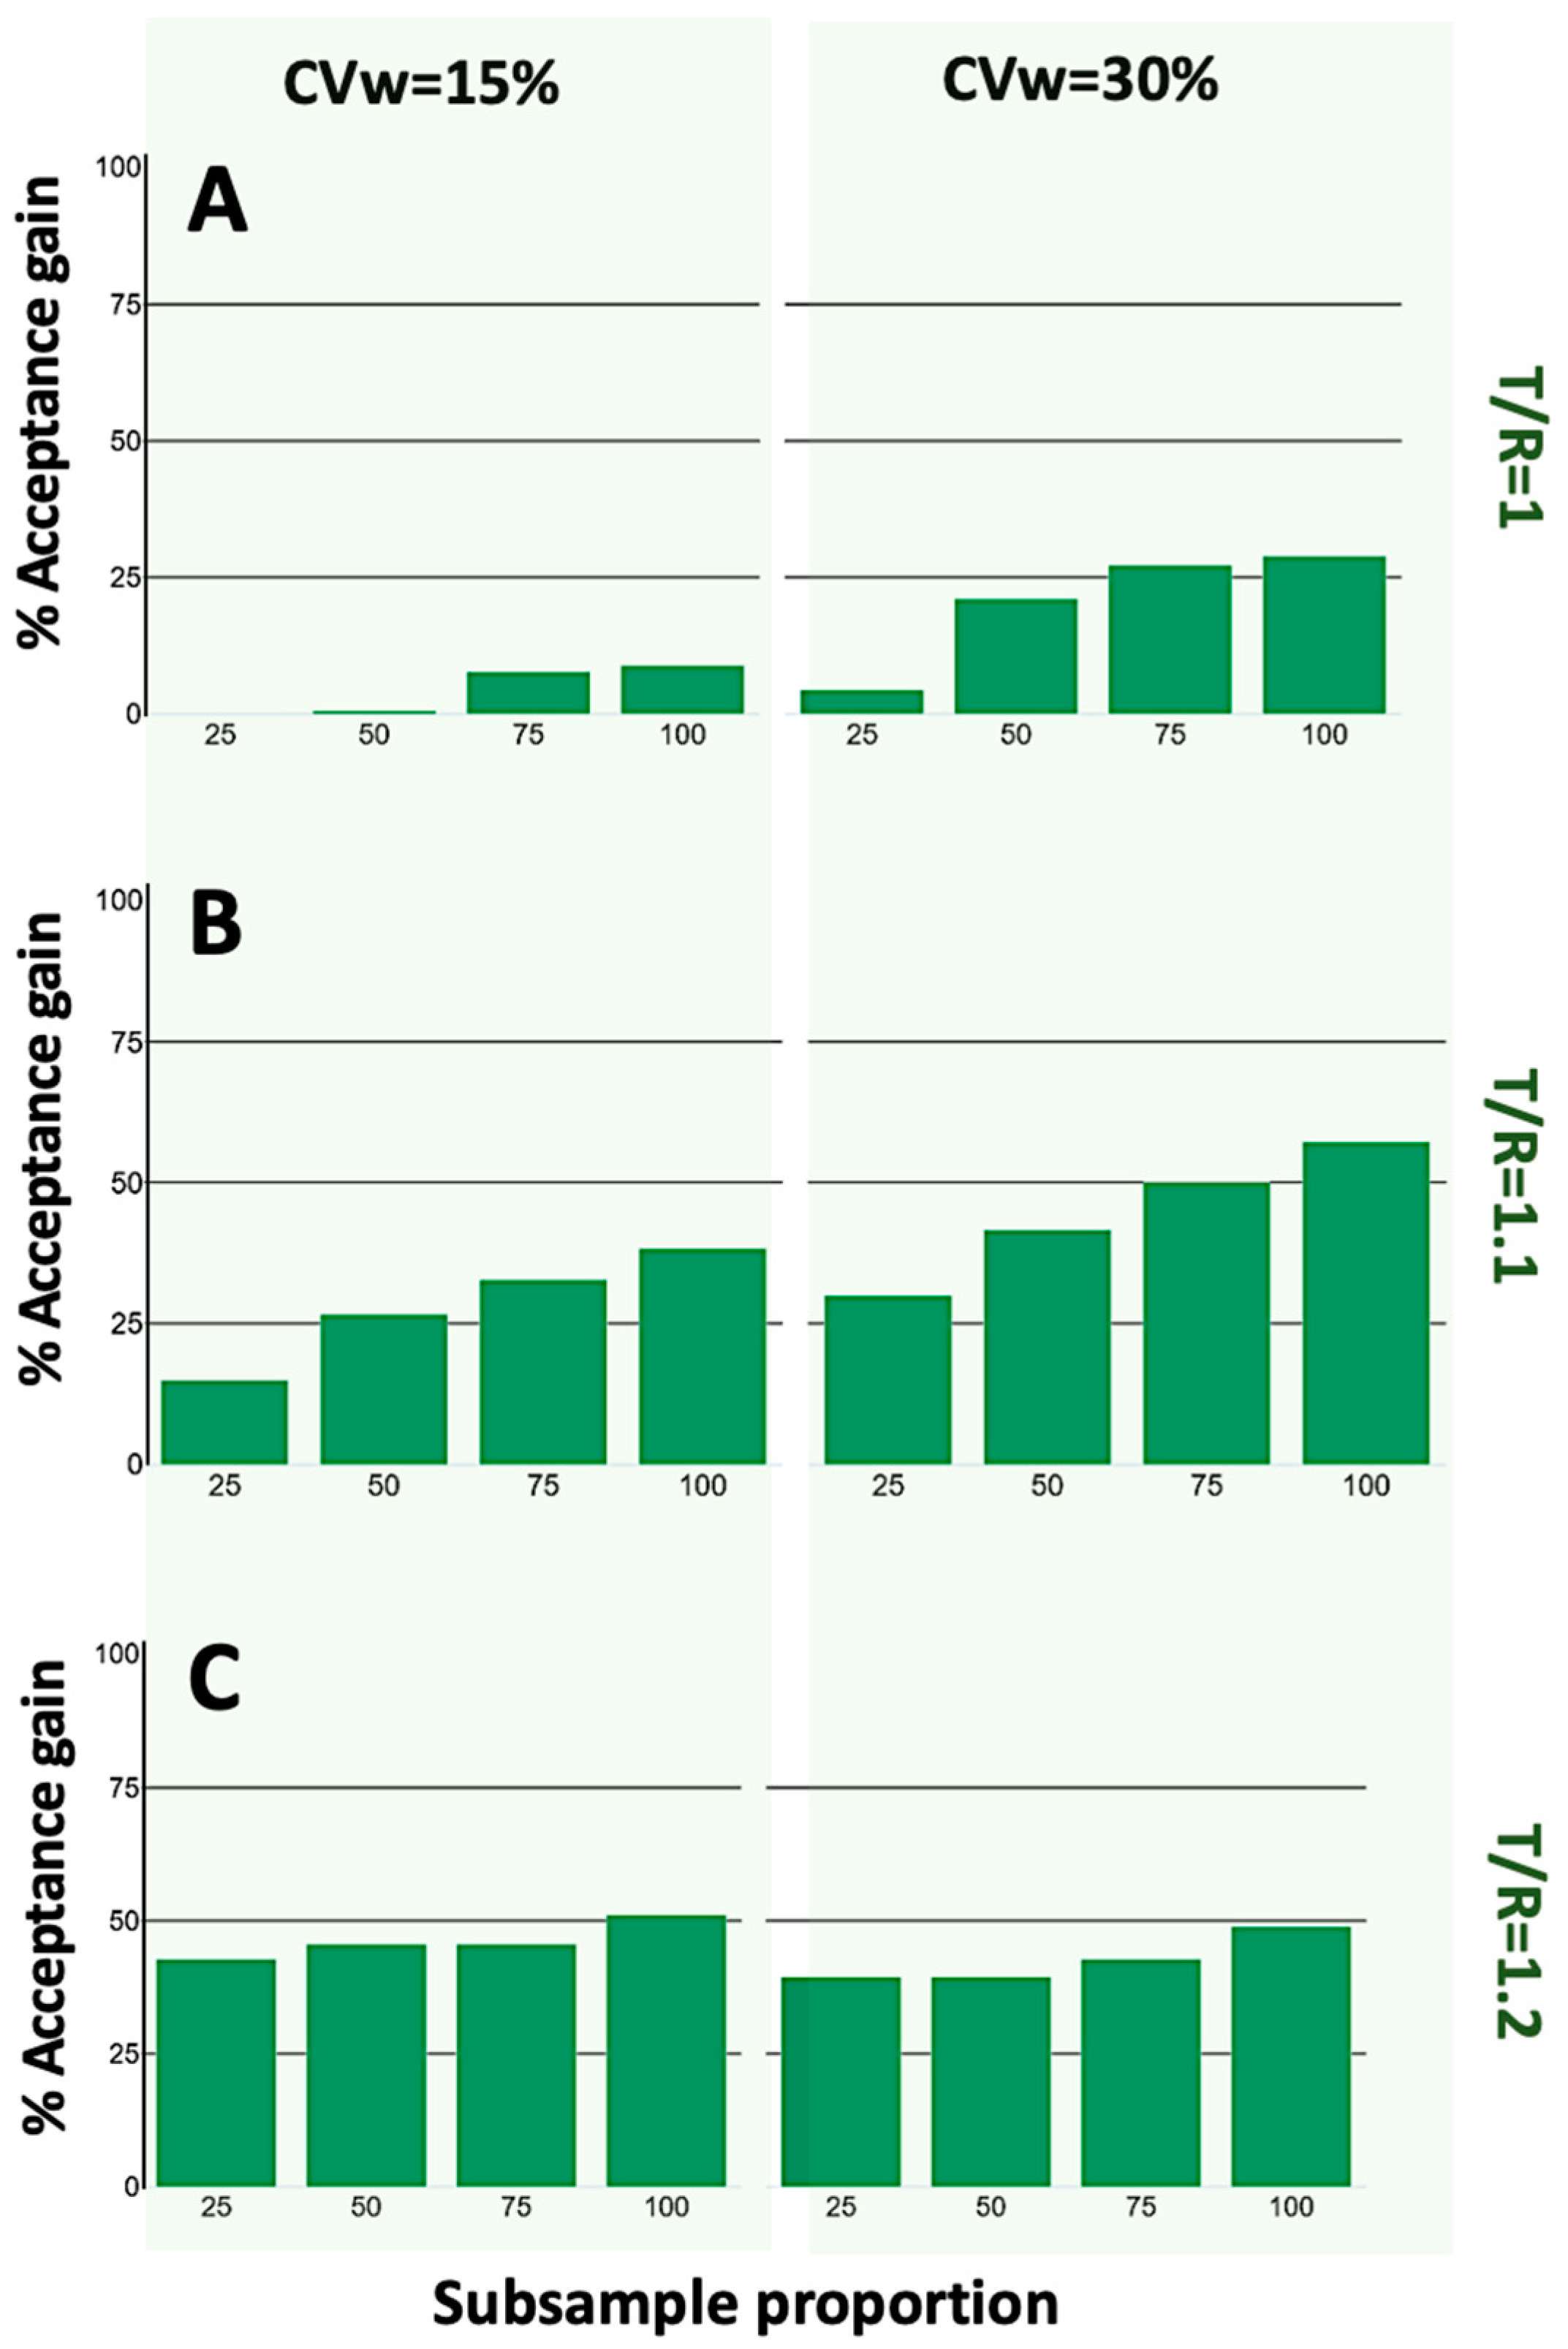
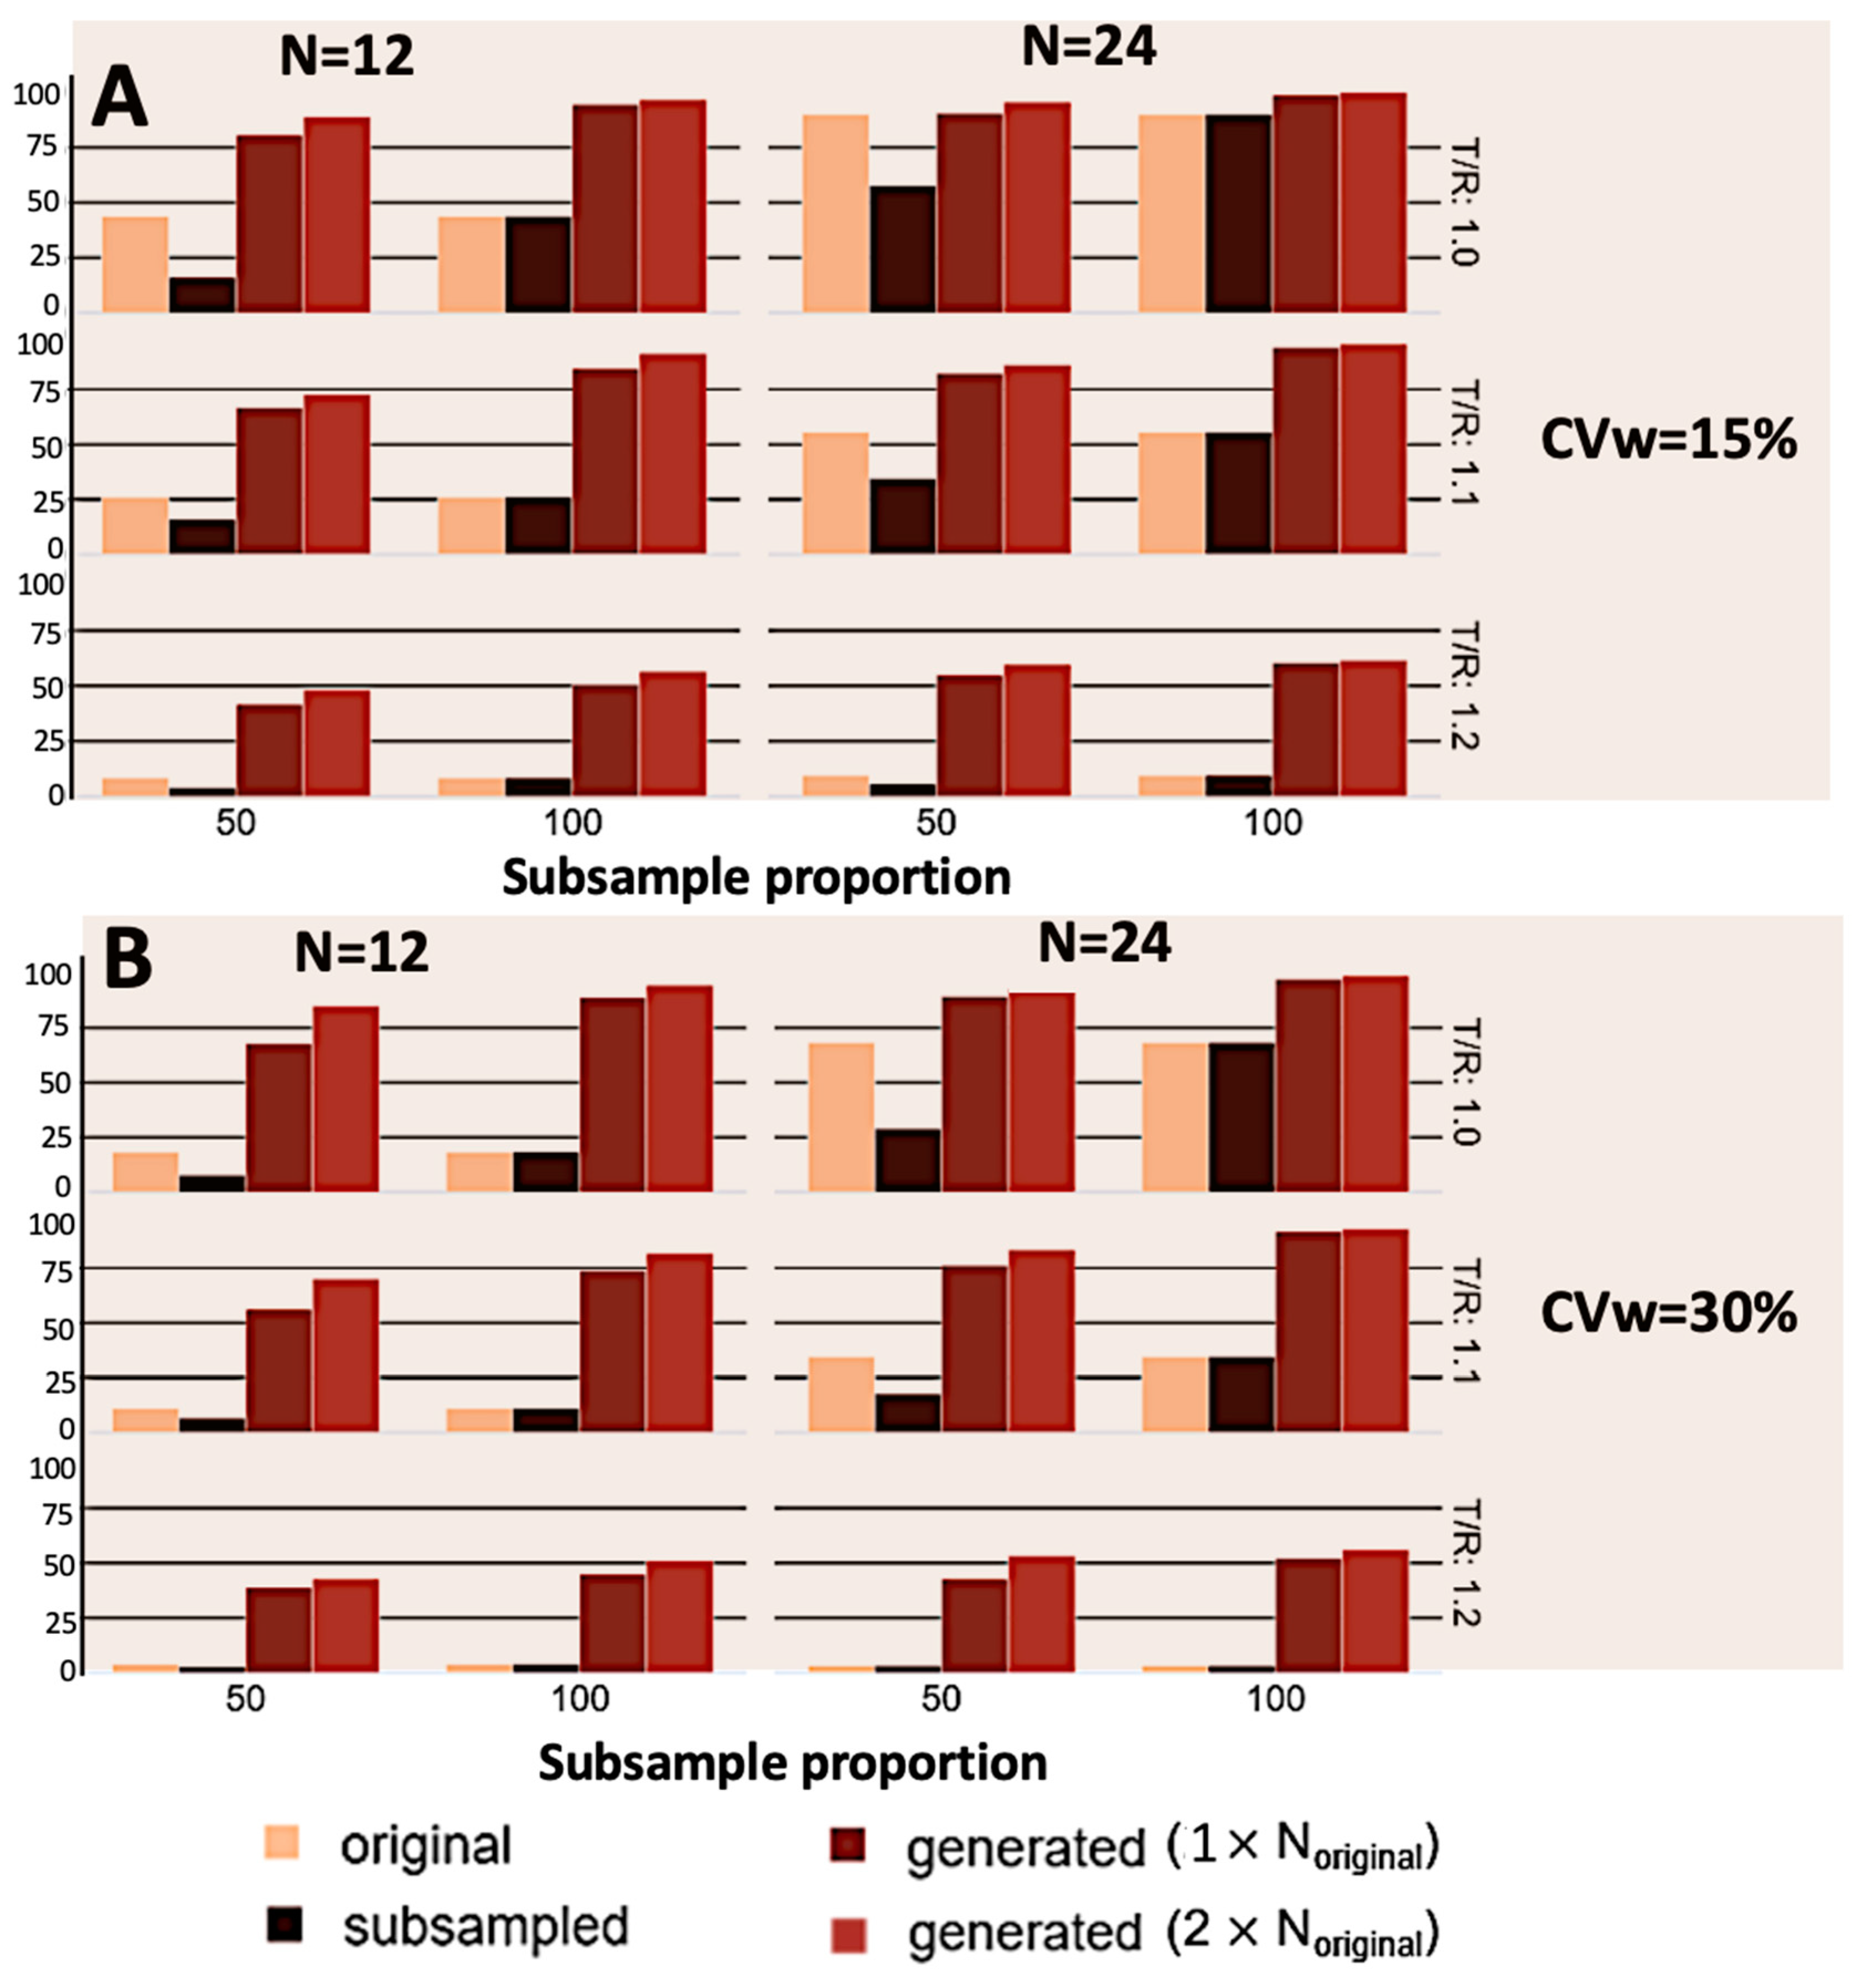
The individuals generated from steps I and II (termed as “original”) are then randomly subsampled with proportions 25%, 50%, and 75%. The so-derived groups are termed as “subsampled”.
IV.
Subsampled individuals are fed into an optimized VAE model to generate new individuals, termed as “generated”. The generated dataset was set to exhibit size equal to or double the “original” dataset.
V.
The standard statistical criteria mandated by regulatory authorities are utilized to assess BE among all comparison groups [4,5].
VI.
The success (i.e., BE acceptance) or failure (i.e., non-equivalence) of the statistical test is tracked for all three datasets.
VII.
Steps “I–VI” are performed again for 500 repetitions in order to obtain robust values for the % BE acceptance.
VIII.
The results attained from step “VII” are evaluated.
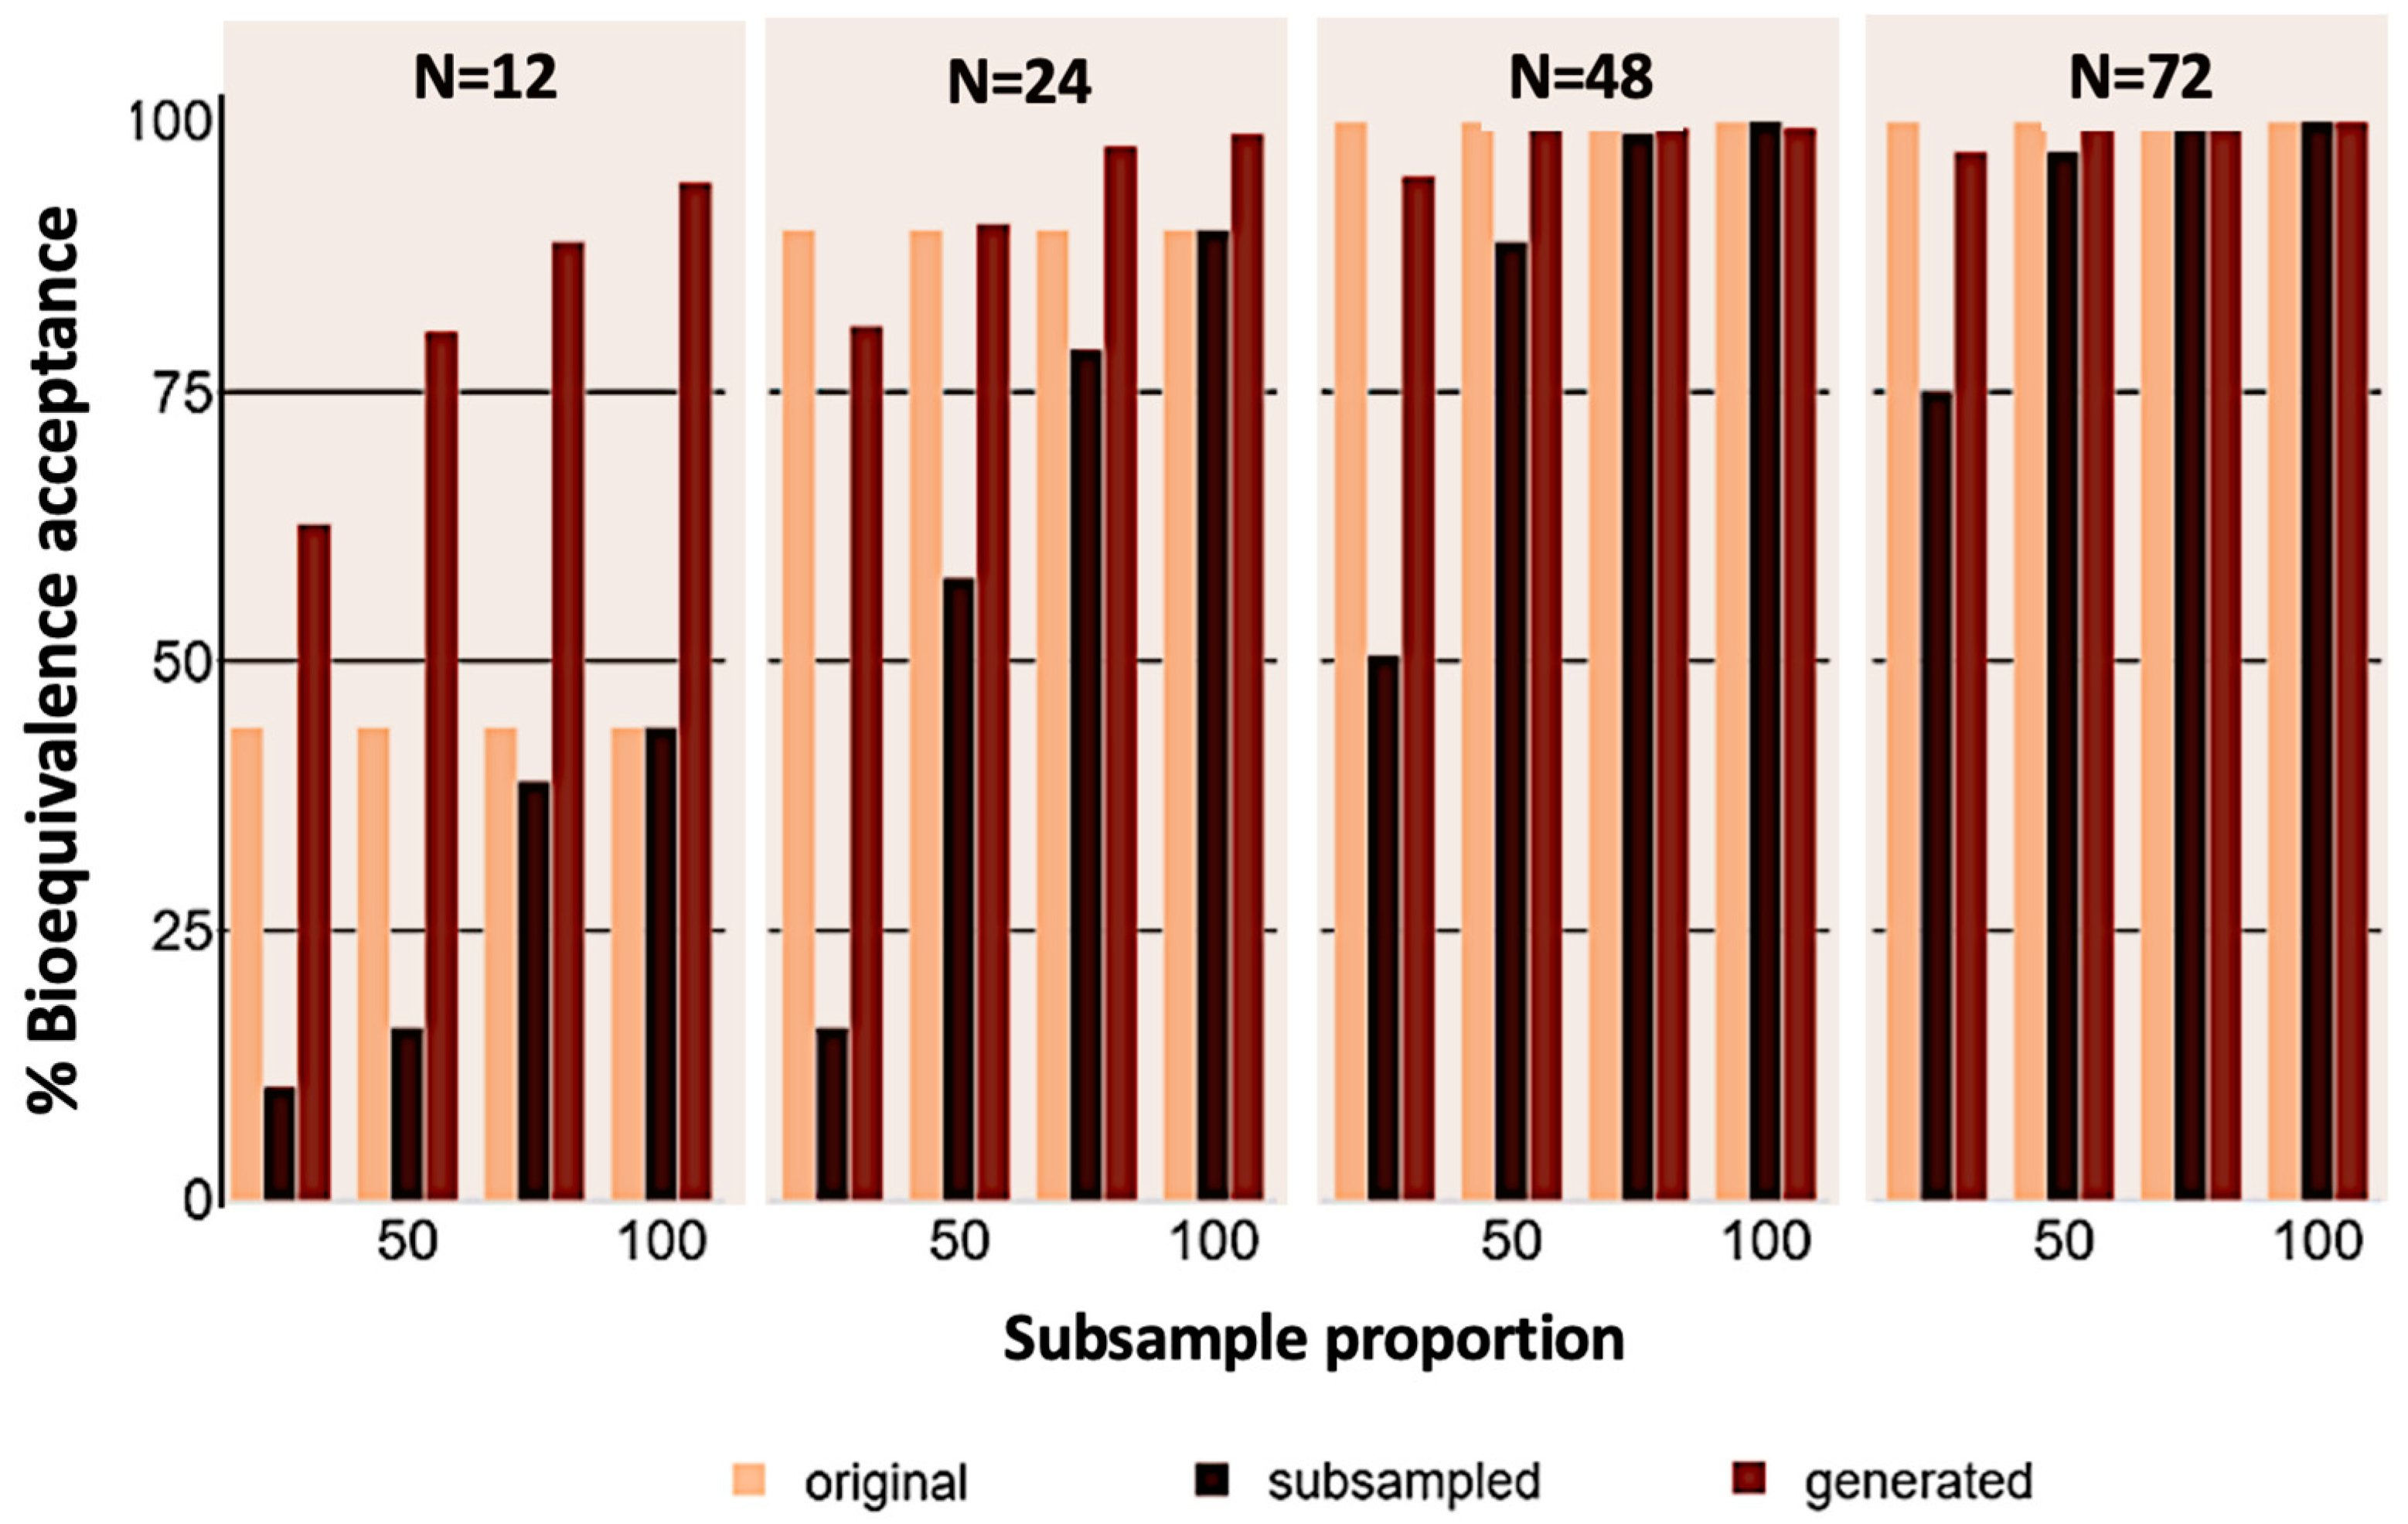
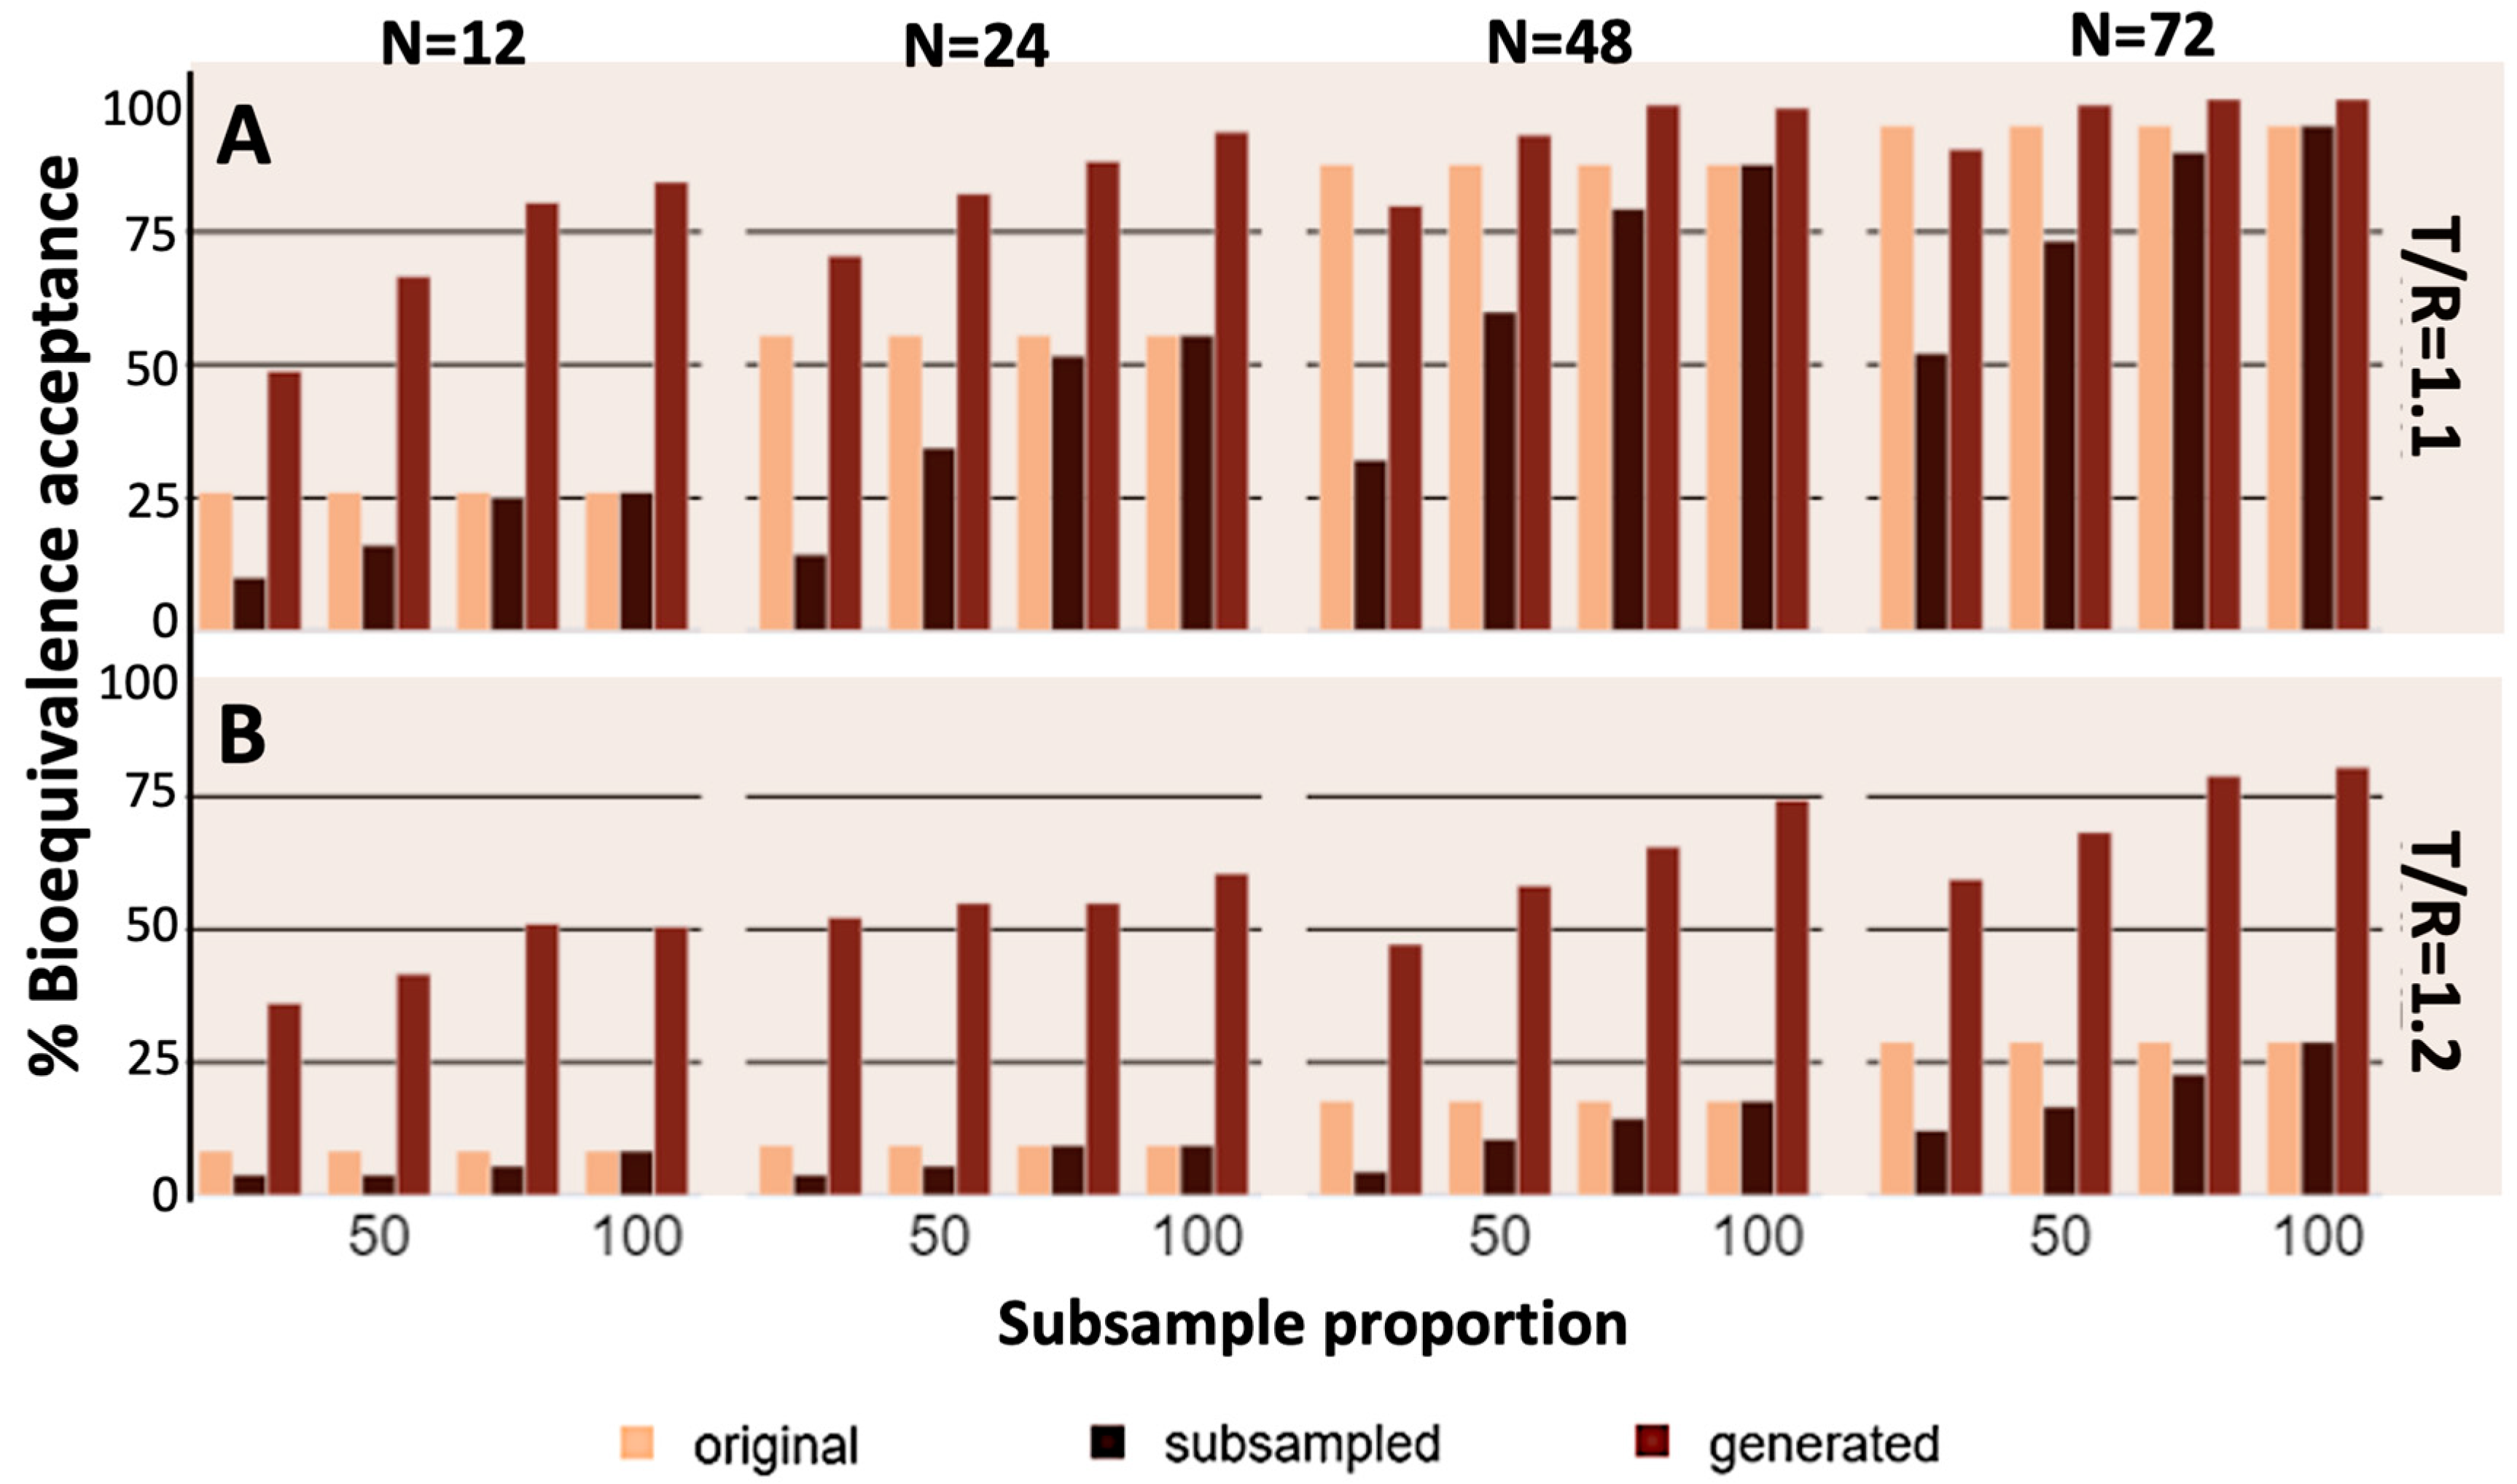
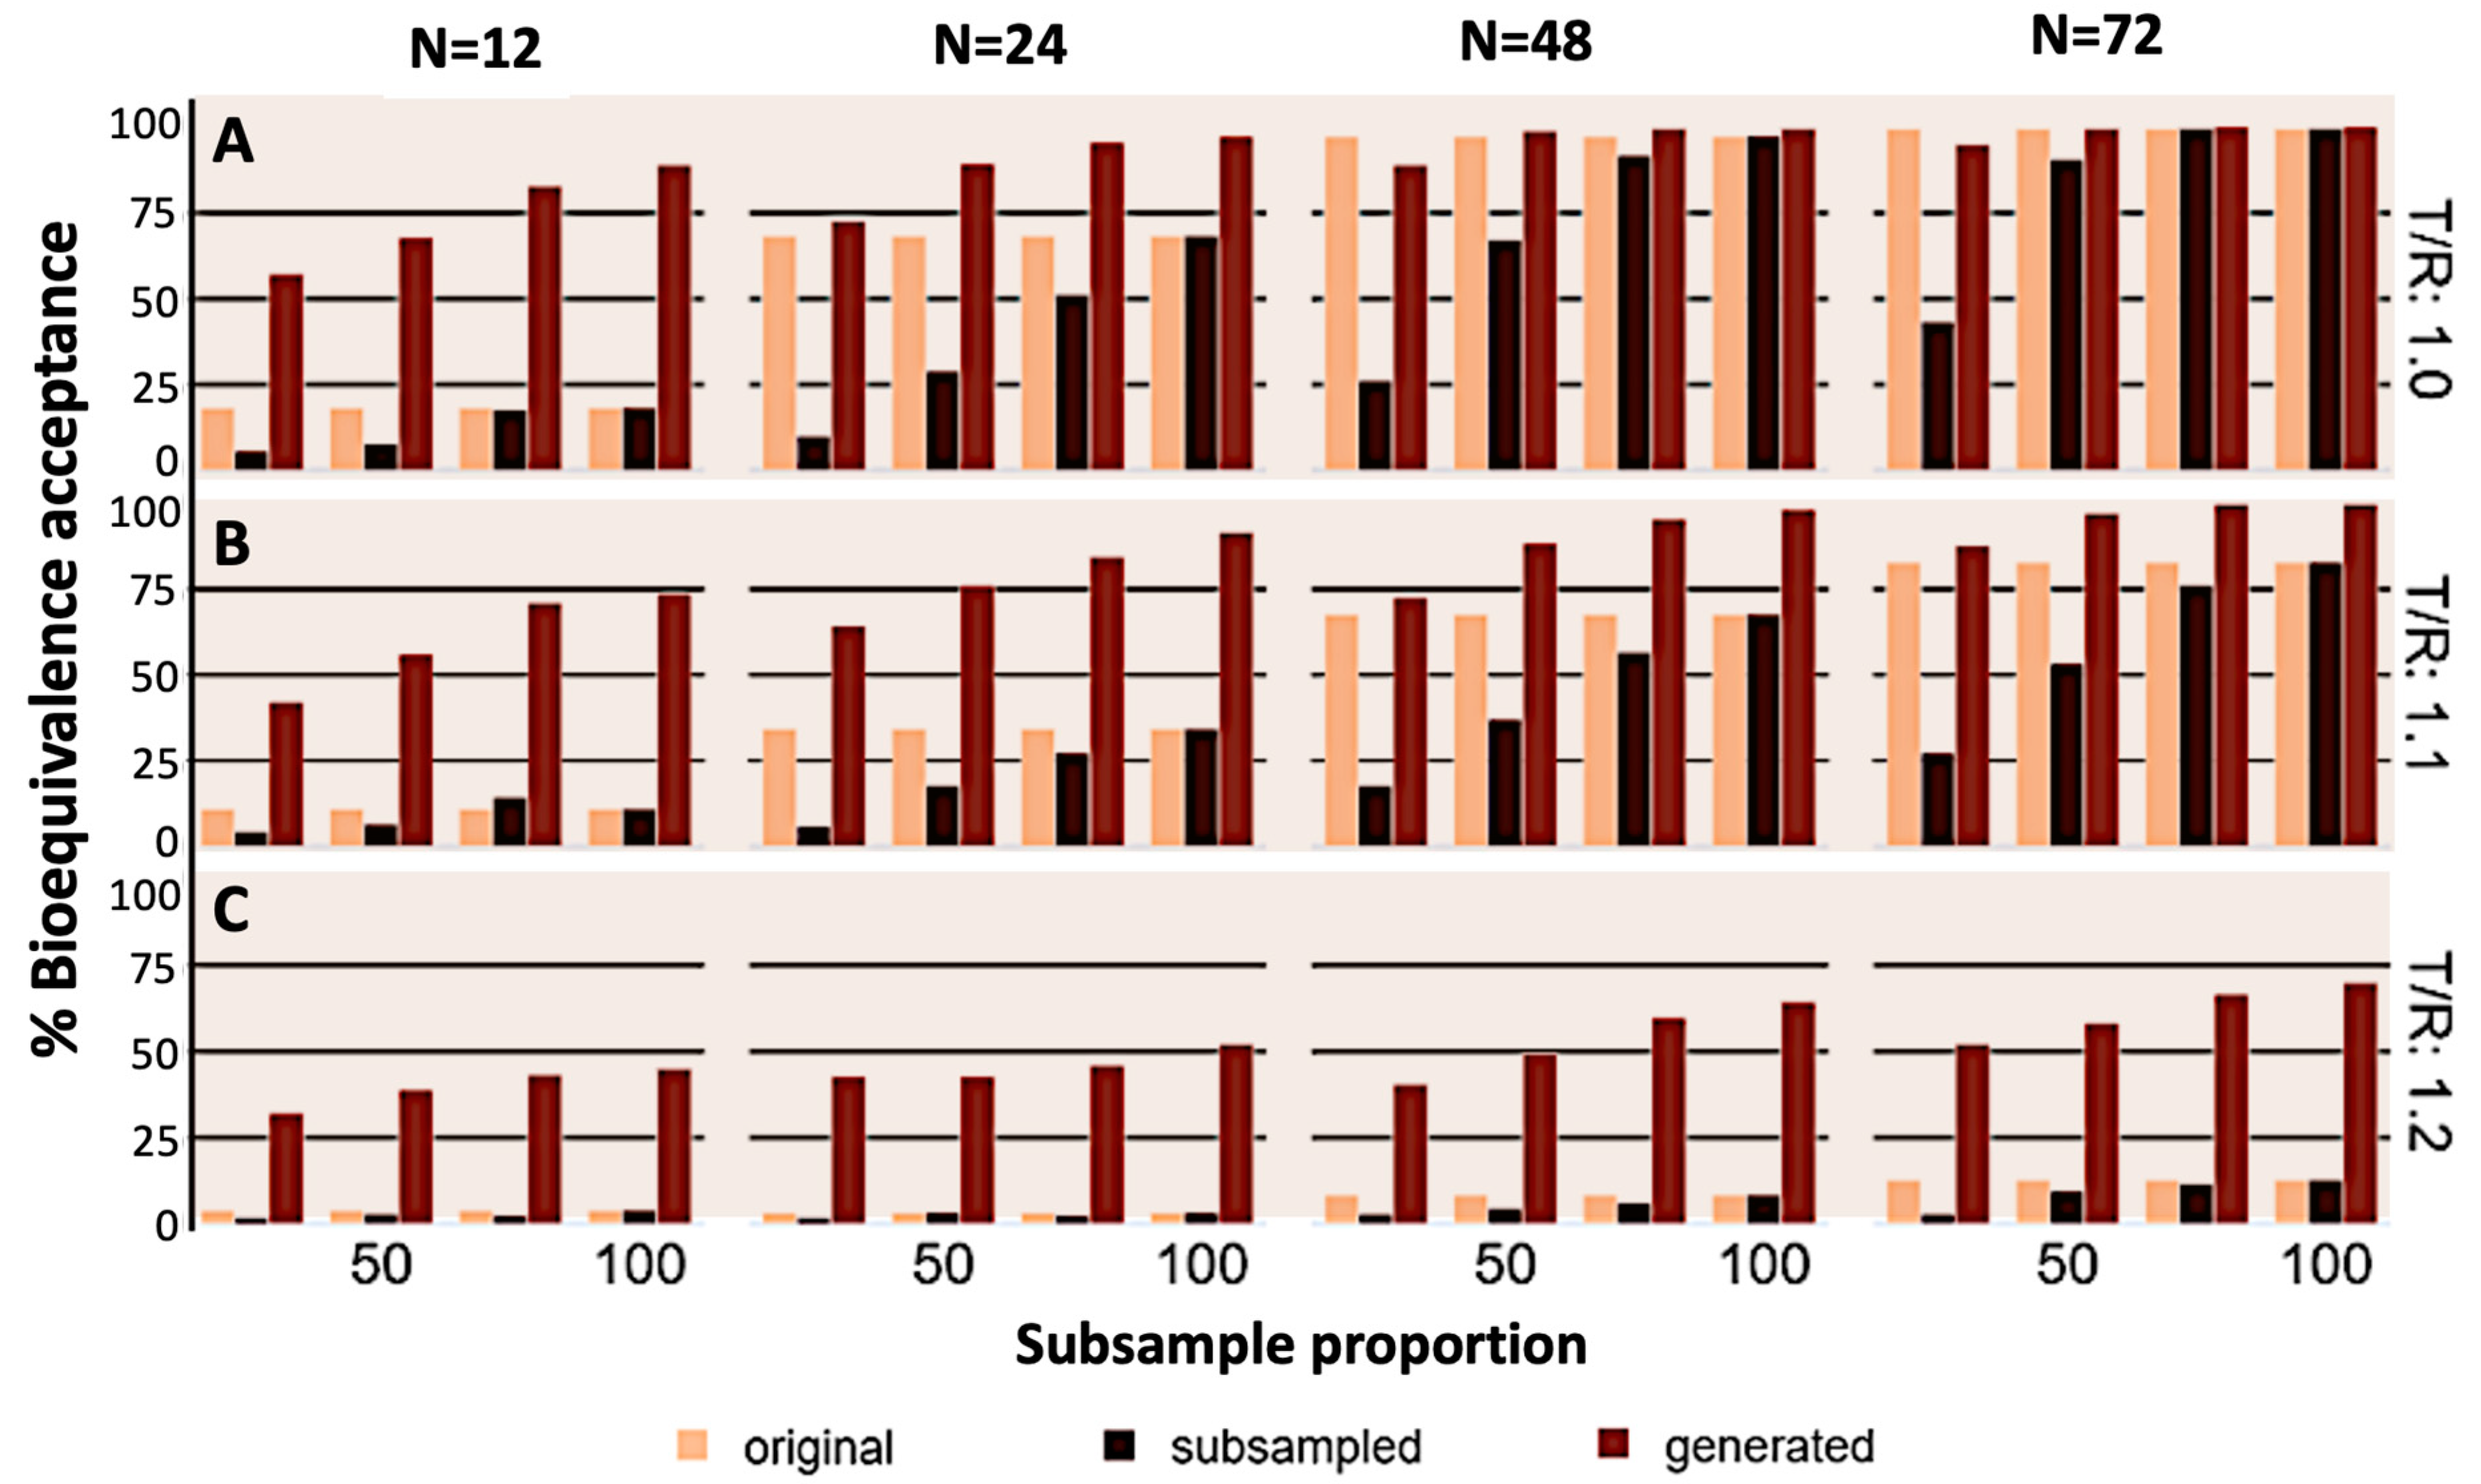
A list of factors analyzed in this study, including CVw, the ratio between μT1 and μR1, N, subsampled proportions, and the size of generated data proportionate to the total size N, is presented in Table 2.

3. Results

The first exploration in this study, referred to the condition when both the T and R pharmaceutical products have equal means and a low coefficient of variation at 15%. This scenario was investigated for various sample and subsample sizes (Figure 2).
As illustrated in Figure 2, the BE acceptance rate increases with the rise in the actual sample size. In addition, the percentage of acceptance for the “subsampled” group is always lower than the “original”, whereas the acceptance rate of the “VAE-generated” group of subjects is always higher than the original and, thus, the “subsampled” also. Also, as expected, for all the three datasets (original, subsampled, and VAE-generated), the acceptance rate tends to decrease when the subsample proportions decline or when the sample size gets lower. Though, for the original and the subsampled datasets, this decrease is more extreme than the generated. More specifically, for the “generated” dataset, the acceptance rate starts from 60% when the sample size and the subsample proportion are small and increases up to 100% while the sample size and subsample proportion increase. This trend is similar for the original and subsampled datasets, though the acceptance rate for the original dataset reaches its lowest (around 40%) for sample size 12, while, for the subsampled dataset, the lowest is reached even at the sample size of 24 for low subsample proportions (around 10%).
Figure 3 illustrates the probability of acceptance for the same sample sizes and proportion rates between the R and T groups for low CVw (15%) when the mean of the T group is 10% and 20% higher than the one of the R group (i.e., for T/R ratios of 1.1 and 1.2).
Figure 3 illustrates the trend of BE acceptance as both sample size and subsample proportions increase from left to right. This analysis is conducted with the T/R ratio of the average endpoint set at 1.1 in the top row and 1.2 in the bottom row. Notably, the acceptance rate of the generated data is significantly higher than that of the original and subsample data. This difference is particularly evident when both the sample size and proportion rate are lower, as shown in Figure 3A,B. As expected, a larger difference between the means of R and T groups corresponds to a lower acceptance rate across all groups. It is essential to emphasize that the acceptance rate of the generated data consistently exceeds that of the other two datasets.
Figure 4 similarly illustrates the acceptance rates for a 30% within-subject variability of the measured BE endpoint and several values of the T/R ratio (1.0, 1.1, and 1.2).
In Figure 4, a consistent trend is evident across all scenarios examined. Again, it should be emphasized that the BE acceptance rate of the generated dataset is consistently higher than that of both the subsampled and original datasets in all cases. Additionally, as expected, the BE acceptance rate decreases for all groups with the increase (or decrease) in the T/R values. Importantly, even in this scenario, the percentage of BE acceptance for the generated data is the least affected. Figure 5 shows the impact of within-subject variability of CVw on BE acceptance “gain” between the generated and original datasets (i.e., % BE acceptance generated—original). The scenarios explored referred to different performances between the two drug products under comparison, namely, T/R values of 1.0 (Figure 5A), 1.1 (Figure 5B), and 1.2 (Figure 5C).
Figure 5 illustrates that, in all cases, the acceptance rate of bioequivalence between the T and R groups is significantly higher in the case of the generated dataset. When the T and R groups have equal means (Figure 5A), this increase is more pronounced for larger within-subject variability and larger subsample proportions. Similar findings are observed when the T/R ratio is 1.1, with the increase being even higher (Figure 5B). For more extreme differences between the T and R groups (T/R = 1.2), an even more substantial increase in the acceptance rate is observed, although the increase is very similar for both 15% and 30% CVw and for all subsample proportions (Figure 5C).
Finally, Figure 6 investigates the relationship between the generated sample size and the original dataset. In other words, the aim of this figure is to show how many times larger the generated dataset can be compared to the original one. Two typical N values were chosen: N = 12, which refers to the lowest accepted sample size for a BE study by regulatory authorities [4,5], and N = 24, which is a typical sample size commonly used in BE studies. Two levels of the generated sample size were tested: 1× and 2×. This means that the generated dataset can be either as large as the original or twice the original sample size. Thus, by using only part of the original dataset (i.e., 25%, 50%, or 75%), the aim was to evaluate the performance of the reconstructed dataset. In all cases, two CVw values were utilized (15% for Figure 6A and 30% for Figure 6B) and three levels of the relationship between the T and R groups (i.e., T/R equal to 1.0, 1.1, and 1.2).
Figure 6 demonstrates that the acceptance rate increases when the sample size of the generated dataset is twice the original size, compared to cases where the original sample size is equal to the generated sample size. In Figure 6A, when CVw is 15% and the original sample size is 24, a slight increase in the acceptance rate is observed for a subsample proportion of 50% across all T/R ratios. When the original sample size is 12, there is a modest increase when the generated sample size is twice the original for a subsample proportion of 100% and a more significant increase when the subsample proportion is 50%. This pattern is evident for all three T/R ratio values. In Figure 6B, where CVw is 30%, the results mirror those of Figure 6A. However, since CVw is higher, the percentage of BE acceptance is lower in all scenarios. The same findings are also observed in the case of a highly variable drug (Figure 6B). In this instance, the superior performance of the two VAE-generated datasets is even more evident.

4. Discussion

In a previous study of our lab, the idea of using artificial neural networks, and particularly VAEs, for virtually increasing the sample size of clinical trials was introduced [10]. Variational autoencoder models, or simply VAEs, are generative models that use deep learning methodologies to generate novel synthetic data. Our lead study demonstrated the various advantages of this deep learning approach in the context of simple clinical trials. Leveraging clinical data generated by VAEs maintained the type I error at a minimum and consistent level with the actual data, even though only a small part of the actual is used [10].
In this study, the concept of utilizing VAEs in clinical trials is extended to the field of bioequivalence studies. So, this study aims to explore how the utilization of a VAE-generated dataset can be used to lower the need of actual human data and substitute them with AI-generated data. To accomplish this task, we simulated the conditions of 2 × 2 (i.e., two-period, two-treatment) crossover BE trials. Initially, a group of original data (i.e., study volunteers) was simulated, and synthesized data were created by taking parts of them (e.g., 25%, 50%, 75%, or all of them, i.e., 100%) using the VAE model. The entire procedure was repeated multiple times through Monte Carlo simulations, exploring various conditions (scenarios). These conditions included within-subject variability (CVw), different average endpoint values for the Test and Reference products (i.e., the T/R ratios), subsampled proportions, and how many times the generated data were larger than the original (i.e., 1×, 2× the original dataset). These scenarios were selected to explore various conditions of special interest. For instance, a T/R ratio of 1 corresponds to the case where the two groups under comparison exhibit identical performance, resulting in a relatively high percentage of bioequivalence acceptance. In contrast, the case of T/R = 1.1 implies a 10% average difference between the two groups, leading to reduced BE acceptances. Also, the role of within-subject variability (i.e., CVw) is crucial in bioequivalence studies, as the statistical assessment relies on estimating a 90% confidence interval where the variability term used is CVw. Thus, in this study, two levels of CVw were examined: a moderate value of 15% and a marginal value of 30%, which is the threshold for a pharmaceutical product to be considered highly variable. It is worth mentioning that an advantage of using VAE neural networks lies in their inherent ability to reduce the variability of input data. This is particularly important for BE studies, especially in the case of topical pharmaceutical products. In fact, additional scenarios involving highly variable drugs and/or pharmaceutical products should be studied, but this could be the focus of an entirely new study. Additionally, this study investigated the robustness of AI-driven generation of virtual subjects concerning the amount of data used. To address this, subsamples as low as 25% of the original dataset were examined, demonstrating the desired performance. Thus, after tuning the VAE hyperparameters, the performance of the VAE system was evaluated in terms of the percentage acceptance of bioequivalence compared to the original and subsampled datasets.
Given that the BE limits are 0.80–1.25 and the T/R ratios used in this study were narrower (i.e., 1.0, 1.1, and 1.2), the desired outcome would be a situation where the percentage acceptance of the generated dataset is higher than that of the original data and certainly much higher than the subsampled data from which they were created. In other words, this would imply that the utilization of AI-driven generation of virtual clinical data could lead to high statistical power by using fewer human subjects. This, in turn, could result in less human exposure to interventions, lower study costs, and faster study completion. If the statistical power of the synthesized VAE data is greater than that of the original data, then these advantages become even more pronounced. Indeed, after investigating all these scenarios, the current analysis showed that the utilization of VAE systems in a clinical trial setting succeeds in all the aforementioned properties (Figure 2, Figure 3, Figure 4, Figure 5 and Figure 6) and offers all the advantages mentioned earlier.
In all scenarios studied, it was demonstrated that the VAE system can successfully generate data superior to any subsampled group and exhibit performance at least equal to the original dataset (Figure 2, Figure 3, Figure 4, Figure 5 and Figure 6). To clearly emphasize this advantageous performance of the VAE model, Figure 5 was constructed to illustrate that, in all cases, the VAE-generated data lead to at least equal or better performance compared to the original data. As expected, the reduced sample dataset (referred to as “subsample”) exhibited inferior performance compared to the original dataset. The subsampled data failed to reproduce the characteristics of the original dataset, lacking the necessary statistical power to establish bioequivalence, particularly when it was present, as a result of the diminished sample size (Figure 2, Figure 3 and Figure 4). However, what is crucial is that relying on this “inferior” dataset (i.e., the “subsampled”) and applying the VAE model to it leads to synthesized data that exhibit performance at least equal to the original whole data. In certain instances, the efficiency of the data generated by the VAE is notably superior, even compared to the original data.
For example, with low within-variability (15%) and when the mean endpoints of the reference and test groups were the same (Figure 5A), the data generated by the VAE exhibited comparable performance to the original dataset, even when only a small portion of the original data was utilized (i.e., 25%). In other words, only a few actual human subjects were included in the study. Generating even more data than the original will lead to an even higher acceptance rate (Figure 6).
The VAE-generated data performed well, even in cases of high variability and when the mean endpoints between the groups differed by 20%, resulting in an increase in statistical power (Figure 3 and Figure 4). It was demonstrated that an increase of up to 40% in statistical power can be achieved when the mean endpoints of the two groups have a 20% difference, even with a 25% subsample proportion, namely, when only a few actual volunteers will participate in the trial (Figure 5C). It should be underlined that high variability poses a significant challenge in the field of BE assessment [4,5,6]. However, achieving strict BE for such drugs can be daunting due to their inherent pharmacokinetic variability. As a result, regulatory bodies have developed particular guidelines and criteria for the acceptance of highly variable drugs to address the expected variability [6,16]. Therefore, employing methods that mitigate unwanted variability without necessitating an increase in the number of study participants, costs, or study complexity becomes paramount.
In recent years, the emergence of machine learning and deep learning methodologies has allowed us to re-examine old problems in science with a fresh perspective and innovative tools. Recently, machine learning approaches were used to address the challenge of finding a suitable pharmacokinetic metric for expressing the rate of drug absorption [17,18]. Furthermore, contemporary studies utilize deep learning approaches in image analysis for personalized medicine, as well as for the detection of hazardous objects in X-ray security inspection devices [19,20].
Besides the extensive utilization of AI in diagnostic approaches, AI has also been integrated into various medical fields, including pneumonology, neurology, cardiology, gynecology, anesthesiology, surgery, urology, etc. [21,22,23,24,25,26,27,28,29,30,31,32,33,34,35,36,37,38,39]. Data augmentation, utilized in various fields such as computer vision to assist AI models in better performing their tasks, has gained recognition in clinical trials [7,40]. In the same vein, this study, along with the previous one [10], attempts to apply state-of-the-art techniques in order to address an old problem in clinical trials, namely, to reduce sample sizes in clinical trials and bioequivalence studies. To address the need for recruiting large sample sizes, particularly in cases involving highly variable drugs or drug products, this study introduces the concept of reducing human exposure by using only a limited sample size from which virtual subjects can be generated using AI. Certainly, caution should be exercised in selecting the actual subjects, as the original sample size must be informative. The advantages of applying this idea in practice include a decrease in human exposure (for ethical reasons), significantly shorter study completion times, lower complexity in the clinical trial, reduced workload for physicians and clinics, clinical research associates monitoring the study, and, overall, significantly lower costs for sponsors or health agencies. In general, this study demonstrates that less data can be used to achieve similar, and even better, results in terms of statistical power.
Up to this point, it is essential to emphasize several important aspects of the proposed methodology. Firstly, the use of synthetic data in clinical trials aims solely to increase the study statistical power. This enhancement is achieved by utilizing VAEs to generate virtual subjects based on information obtained from the actual human subjects. The concept introduced in this paper suggests for the use of VAEs not as a complete replacement for human volunteers but, rather, as a partial substitute. The objective is to reduce human exposure in clinical trials by increasing statistical power without requiring additional human subjects, thus circumventing associated issues like ethical concerns, costs, and time constraints [41]. Thus, AI-generated virtual subjects are used for this purpose. Therefore, having an adequate sample of human volunteers, both representative and sufficiently large, is crucial for accurately generating virtual subjects. However, it is important to note that VAE-synthesized data cannot be used for safety assessments. Additionally, the utilization of VAEs in BE studies offers another advantage related to their ability to reduce variability inherently [42]. By using VAEs, it becomes feasible to generate virtual subjects with diminished variability, thereby narrowing the 90% confidence interval and enhancing the likelihood of establishing bioequivalence (i.e., increasing statistical power). Currently, the use of scaled bioequivalence limits can lead to inflation of type I error [6]. Thus, our approach enables comparable results to be achieved without encountering any type I error inflation. Reproducibility is another critical aspect to consider. VAEs can be rendered reproducible by maintaining consistency in the model architecture, hyperparameters, and random seed [42,43,44]. In the same context lies the need for avoiding hallucinations of the generated data [45]. In our study, we ensured all these measures, ensuring the entire process is fully reproducible. It is up to the regulatory authorities to set specific criteria and guidelines on the minimum requirements for the application of AI-generated virtual subjects in practice. This approach mirrors the adoption of similar principles in pharmacometric models 10–15 years ago, now officially accepted by regulatory authorities such as the FDA and EMA [46,47,48]. Lastly, it is worth noting that the need for data augmentation has been recognized for several decades. While techniques like bootstrapping have been explored for augmenting sample sizes in clinical trials, they have been deemed inappropriate due to various limitations, including overfitting, bias, loss of information, and the assumption of independence [49]. These limitations stem from the reuse of the same subjects, contrasting with the synthesis of new data in approaches like VAEs (or other generative AI algorithms). Moreover, AI-synthetic data have already been used to mimic clinical trials in patients with leukemia and other healthcare applications [50,51,52,53,54]. Notably, tech giants like Amazon (for Alexa) and Google (for self-driving cars), as well as pharmaceutical companies like Roche, utilize synthetic data to train their systems. The integration of synthetic data into various research fields is already underway, with this study proposing its incorporation into clinical (bioequivalence) studies.
One limitation of this work is the relatively low number of repetitions utilized for each scenario. Due to computational constraints, completing 500 runs consumed a significant amount of time; however, the estimates appeared robust and only minimally different compared to 200 or 300 runs, implying that convergence was achieved with 500 runs. Further exploration in this field could include the assessment of more scenarios such as additional clinical designs (e.g., replicate) and statistical hypotheses (e.g., noninferiority or superiority). However, it was impossible to investigate all these possibilities encountered in clinical trials.
The ultimate goal of this study is to introduce the idea of using synthetic data (e.g., through VAEs) in bioequivalence studies and clinical trials in general. Additional work is ongoing in this field by our lab, including elaboration on highly variable drugs, exploration of additional and more complex clinical designs such as replicate and adaptive designs, and enhancing the flexibility and user-friendliness of the code for public accessibility. Furthermore, additional AI algorithms, such as generative adversarial networks, can be used for generating virtual subjects; however, VAEs have the advantage of reducing the variability of the input data. Thus, for highly variable drugs (or pharmaceutical products), VAEs can be advantageous.

5. Conclusions

This study is our second step toward utilizing generative AI algorithms in clinical trials. In our previous study, the idea was introduced in the case of simple clinical trials; this study goes one step ahead and proposes the use of artificial neural networks (particularly VAEs) for reducing the need to recruit many subjects in bioequivalence studies. The typical conditions of 2 × 2 crossover BE studies were simulated by combining Monte Carlo simulations with VAEs. Various scenarios, including variability levels, the actual sample size of the BE study, the AI-generated sample size, and the relationship in the average performance between the T and R products, were explored. All simulations performed in this study showed that incorporating AI generative algorithms in clinical trials has many advantages in creating virtual populations. These advantages include a decrease in human exposure, significantly shorter study completion times, lower complexity in the clinical trial, reduced workload for physicians and clinics, and significantly lower costs for sponsors or health agencies. It was shown that less actual human data can be used to achieve similar, and even better, results in terms of statistical power. Overall, this study suggests the utilization of AI-driven generative algorithms in clinical research. However, the incorporation of such new ideas in practice would require regulatory authorities to set specific criteria and guidelines on the minimum requirements for the application of AI-generated virtual subjects in order to avoid possible pitfalls (e.g., hallucinations) and ensure reproducibility.

Author Contributions

Conceptualization, V.D.K.; methodology, V.D.K.; software, D.P.; validation, D.P. and V.D.K.; formal analysis, D.P.; investigation, D.P.; resources, D.P.; data curation, D.P.; writing—original draft preparation, D.P.; writing—review and editing, V.D.K.; visualization, D.P. and V.D.K.; supervision, V.D.K.; project administration, V.D.K. All authors have read and agreed to the published version of the manuscript.

Funding

This research received no external funding.

Institutional Review Board Statement

Not applicable.

Informed Consent Statement

Not applicable.

Data Availability Statement

The original contributions presented in the study are included in the article, further inquiries can be directed to the corresponding author.

Conflicts of Interest

The authors declare no conflicts of interest.

References

  1. Gupta, K.K.; Attri, J.P.; Singh, A.; Kaur, H.; Kaur, G. Basic Concepts for Sample Size Calculation: Critical Step for Any Clinical Trials. Saudi J. Anaesth. 2016, 10, 328–331. [Google Scholar] [CrossRef] [PubMed]
  2. Sakpal, T.V. Sample Size Estimation in Clinical Trial. Perspect. Clin. Res. 2010, 1, 67–69. [Google Scholar] [PubMed]
  3. Wang, X.; Ji, X. Sample Size Estimation in Clinical Research: From Randomized Controlled Trials to Observational Studies. Chest 2020, 158, S12–S20. [Google Scholar] [CrossRef]
  4. European Medicines Agency; Committee for Medicinal Products for Human Use (CHMP). Guideline on the Investigation of Bioequivalence; CPMP/EWP/QWP/1401/98 Rev. 1/Corr**; Committee for Medicinal Products for Human Use (CHMP): London, UK, 20 January 2010; Available online: https://www.ema.europa.eu/en/documents/scientific-guideline/guideline-investigation-bioequivalence-rev1_en.pdf (accessed on 23 January 2024).
  5. Food and Drug Administration (FDA). Guidance for Industry. Bioavailability and Bioequivalence Studies Submitted in NDAs or INDs—General Considerations. Draft Guidance. U.S. Department of Health and Human Services Food and Drug Administration. Center for Drug Evaluation and Research (CDER). December 2013. Available online: https://www.fda.gov/regulatory-information/search-fda-guidance-documents/bioavailability-and-bioequivalence-studies-submitted-ndas-or-inds-general-considerations (accessed on 23 January 2024).
  6. Karalis, V. Modeling and Simulation in Bioequivalence. In Modeling in Biopharmaceutics, Pharmacokinetics and Pharmacodynamics. Homogeneous and Heterogeneous Approaches, 2nd ed.; Springer International Publishing: Cham, Switzerland, 2016; pp. 227–255. [Google Scholar]
  7. Askin, S.; Burkhalter, D.; Calado, G.; El Dakrouni, S. Artificial Intelligence Applied to Clinical Trials: Opportunities and Challenges. Health Technol. 2023, 13, 203–213. [Google Scholar] [CrossRef]
  8. Harrer, S.; Shah, P.; Antony, B.; Hu, J. Artificial Intelligence for Clinical Trial Design. Trends Pharmacol. Sci. 2019, 40, 577–591. [Google Scholar] [CrossRef] [PubMed]
  9. Delso, G.; Cirillo, D.; Kaggie, J.D.; Valencia, A.; Metser, U.; Veit-Haibach, P. How to Design AI-Driven Clinical Trials in Nuclear Medicine. Semin. Nucl. Med. 2021, 51, 112–119. [Google Scholar] [CrossRef]
  10. Papadopoulos, D.; Karalis, V.D. Variational Autoencoders for Data Augmentation in Clinical Studies. Appl. Sci. 2023, 13, 8793. [Google Scholar] [CrossRef]
  11. Lim, C.-Y. Considerations for Crossover Design in Clinical Study. Korean J. Anesthesiol. 2021, 74, 293–299. [Google Scholar] [CrossRef]
  12. Yang, Y.; Ye, Z.; Su, Y.; Zhao, Q.; Li, X.; Ouyang, D. Deep Learning for in Vitro Prediction of Pharmaceutical Formulations. Acta Pharm. Sin. B 2019, 9, 177–185. [Google Scholar] [CrossRef]
  13. Chollet, F. Deep Learning with Python, 2nd ed.; Manning; Simon and Schuster: New York, NY, USA, 2021. [Google Scholar]
  14. Atienza, R. Advanced Deep Learning with Keras: Apply Deep Learning Techniques, Autoencoders, GANs, Variational Autoencoders, Deep Reinforcement Learning, Policy Gradients, and More; Packt Publishing: Birmingham, UK, 2018. [Google Scholar]
  15. Kingma, D.P.; Welling, M. An Introduction to Variational Autoencoders. Found. Trends Mach. Learn. 2019, 12, 307–392. [Google Scholar] [CrossRef]
  16. Endrenyi, L.; Tothfalusi, L. Bioequivalence for Highly Variable Drugs: Regulatory Agreements, Disagreements, and Harmonization. J. Pharmacokinet. Pharmacodyn. 2019, 46, 117–126. [Google Scholar] [CrossRef] [PubMed]
  17. Karalis, V.D. Machine Learning in Bioequivalence: Towards Identifying an Appropriate Measure of Absorption Rate. Appl. Sci. 2022, 13, 418. [Google Scholar] [CrossRef]
  18. Karalis, V.D. On the Interplay between Machine Learning, Population Pharmacokinetics, and Bioequivalence to Introduce Average Slope as a New Measure for Absorption Rate. Appl. Sci. 2023, 13, 2257. [Google Scholar] [CrossRef]
  19. Galić, I.; Habijan, M. Deep Learning in Medical Image Analysis for Personalized Medicine. In Proceedings of the 2023 International Symposium ELMAR, Zadar, Croatia, 11–13 September 2023; IEEE: Piscataway, NJ, USA, 2023. [Google Scholar]
  20. Wei, Q.; Ma, S.; Tang, S.; Li, B.; Shen, J.; Xu, Y.; Fan, J. A Deep Learning-Based Recognition for Dangerous Objects Imaged in X-Ray Security Inspection Device. J. Xray Sci. Technol. 2023, 31, 13–26. [Google Scholar] [CrossRef] [PubMed]
  21. Gong, E.J.; Bang, C.S.; Lee, J.J.; Baik, G.H.; Lim, H.; Jeong, J.H.; Choi, S.W.; Cho, J.; Kim, D.Y.; Lee, K.B.; et al. Deep Learning-Based Clinical Decision Support System for Gastric Neoplasms in Real-Time Endoscopy: Development and Validation Study. Endoscopy 2023, 55, 701–708. [Google Scholar] [CrossRef] [PubMed]
  22. Wei, C.; Adusumilli, N.; Friedman, A.; Patel, V. Perceptions of Artificial Intelligence Integration into Dermatology Clinical Practice: A Cross-Sectional Survey Study. J. Drugs Dermatol. 2022, 21, 135–140. [Google Scholar] [CrossRef]
  23. Karalis, V.D. The Integration of Artificial Intelligence into Clinical Practice. Appl. Biosci. 2024, 3, 14–44. [Google Scholar] [CrossRef]
  24. Galić, I.; Habijan, M.; Leventić, H.; Romić, K. Machine Learning Empowering Personalized Medicine: A Comprehensive Review of Medical Image Analysis Methods. Electronics 2023, 12, 4411. [Google Scholar] [CrossRef]
  25. Attia, Z.I.; Kapa, S.; Lopez-Jimenez, F.; McKie, P.M.; Ladewig, D.J.; Satam, G.; Pellikka, P.A.; Enriquez-Sarano, M.; Noseworthy, P.A.; Munger, T.M.; et al. Screening for Cardiac Contractile Dysfunction Using an Artificial Intelligence–Enabled Electrocardiogram. Nat. Med. 2019, 25, 70–74. [Google Scholar] [CrossRef]
  26. Carron, M.; Safaee Fakhr, B.; Ieppariello, G.; Foletto, M. Perioperative Care of the Obese Patient. Br. J. Surg. 2020, 107, e39–e55. [Google Scholar] [CrossRef]
  27. Xue, B.; Li, D.; Lu, C.; King, C.R.; Wildes, T.; Avidan, M.S.; Kannampallil, T.; Abraham, J. Use of Machine Learning to Develop and Evaluate Models Using Preoperative and Intraoperative Data to Identify Risks of Postoperative Complications. JAMA Netw. Open 2021, 4, e212240. [Google Scholar] [CrossRef] [PubMed]
  28. Hashimoto, R.; Requa, J.; Dao, T.; Ninh, A.; Tran, E.; Mai, D.; Lugo, M.; El-Hage Chehade, N.; Chang, K.J.; Karnes, W.E.; et al. Artificial Intelligence Using Convolutional Neural Networks for Real-Time Detection of Early Esophageal Neoplasia in Barrett’s Esophagus (with Video). Gastrointest. Endosc. 2020, 91, 1264–1271.e1. [Google Scholar] [CrossRef]
  29. Zhao, W.; Yang, J.; Sun, Y.; Li, C.; Wu, W.; Jin, L.; Yang, Z.; Ni, B.; Gao, P.; Wang, P.; et al. 3D Deep Learning from CT Scans Predicts Tumor Invasiveness of Subcentimeter Pulmonary Adenocarcinomas. Cancer Res. 2018, 78, 6881–6889. [Google Scholar] [CrossRef] [PubMed]
  30. Bendixen, M.; Jørgensen, O.D.; Kronborg, C.; Andersen, C.; Licht, P.B. Postoperative Pain and Quality of Life after Lobectomy via Video-Assisted Thoracoscopic Surgery or Anterolateral Thoracotomy for Early Stage Lung Cancer: A Randomised Controlled Trial. Lancet Oncol. 2016, 17, 836–844. [Google Scholar] [CrossRef] [PubMed]
  31. Niel, O.; Boussard, C.; Bastard, P. Artificial Intelligence Can Predict GFR Decline during the Course of ADPKD. Am. J. Kidney Dis. 2018, 71, 911–912. [Google Scholar] [CrossRef] [PubMed]
  32. Cicione, A.; De Nunzio, C.; Manno, S.; Damiano, R.; Posti, A.; Lima, E.; Tubaro, A.; Balloni, F. An Update on Prostate Biopsy in the Era of Magnetic Resonance Imaging. Minerva Urol. Nephrol. 2018, 70, 264–274. [Google Scholar] [CrossRef] [PubMed]
  33. Freeman, K.; Dinnes, J.; Chuchu, N.; Takwoingi, Y.; Bayliss, S.E.; Matin, R.N.; Jain, A.; Walter, F.M.; Williams, H.C.; Deeks, J.J. Algorithm Based Smartphone Apps to Assess Risk of Skin Cancer in Adults: Systematic Review of Diagnostic Accuracy Studies. BMJ 2020, 368, m127. [Google Scholar] [CrossRef] [PubMed]
  34. Chang, P.; Grinband, J.; Weinberg, B.D.; Bardis, M.; Khy, M.; Cadena, G.; Su, M.-Y.; Cha, S.; Filippi, C.G.; Bota, D.; et al. Deep-Learning Convolutional Neural Networks Accurately Classify Genetic Mutations in Gliomas. Am. J. Neuroradiol. 2018, 39, 1201–1207. [Google Scholar] [CrossRef] [PubMed]
  35. Wu, Y.; Shen, Y.; Sun, H. Intelligent Algorithm-Based Analysis on Ultrasound Image Characteristics of Patients with Lower Extremity Arteriosclerosis Occlusion and Its Correlation with Diabetic Mellitus Foot. J. Healthc. Eng. 2021, 2021, 7758206. [Google Scholar] [CrossRef]
  36. Peng, Y.; Dharssi, S.; Chen, Q.; Keenan, T.D.; Agrón, E.; Wong, W.T.; Chew, E.Y.; Lu, Z. DeepSeeNet: A Deep Learning Model for Automated Classification of Patient-Based Age-Related Macular Degeneration Severity from Color Fundus Photographs. Ophthalmology 2019, 126, 565–575. [Google Scholar] [CrossRef]
  37. Attallah, O.; Sharkas, M.A.; Gadelkarim, H. Fetal Brain Abnormality Classification from MRI Images of Different Gestational Age. Brain Sci. 2019, 9, 231. [Google Scholar] [CrossRef] [PubMed]
  38. Moraes, L.O.; Pedreira, C.E.; Barrena, S.; Lopez, A.; Orfao, A. A Decision-Tree Approach for the Differential Diagnosis of Chronic Lymphoid Leukemias and Peripheral B-Cell Lymphomas. Comput. Methods Programs Biomed. 2019, 178, 85–90. [Google Scholar] [CrossRef] [PubMed]
  39. Quinten, V.M.; van Meurs, M.; Wolffensperger, A.E.; ter Maaten, J.C.; Ligtenberg, J.J.M. Sepsis Patients in the Emergency Department. Eur. J. Emerg. Med. 2018, 25, 328–334. [Google Scholar] [CrossRef] [PubMed]
  40. The Alan Turing Institute. Statistical Machine Learning for Randomised Clinical Trials (MRC CTU). Available online: https://www.turing.ac.uk/research/research-projects/statistical-machine-learning-randomised-clinical-trials-mrc-ctu (accessed on 23 January 2024).
  41. Fogel, D.B. Factors Associated with Clinical Trials That Fail and Opportunities for Improving the Likelihood of Success: A Review. Contemp. Clin. Trials Commun. 2018, 11, 156–164. [Google Scholar] [CrossRef] [PubMed]
  42. Foster, D. (Ed.) Generative Deep Learning: Teaching Machines to Paint, Write, Compose, and Play, 2nd ed.; Karl Friston (Foreword); Oreilly & Associates Inc.: Sebastopol, CA, USA, 2023. [Google Scholar]
  43. Liu, C.; Gao, C.; Xia, X.; Lo, D.; Grundy, J.; Yang, X. On the Reproducibility and Replicability of Deep Learning in Software Engineering. ACM Trans. Softw. Eng. Methodol. 2022, 31, 1–46. [Google Scholar]
  44. Chien, J.-T. Deep Neural Network. In Source Separation and Machine Learning; Elsevier: Amsterdam, The Netherlands, 2019; pp. 259–320. [Google Scholar]
  45. Verma, S.; Tran, K.; Ali, Y.; Min, G. Reducing LLM Hallucinations Using Epistemic Neural Networks. arXiv 2023, arXiv:2312.15576. [Google Scholar]
  46. Dykstra, K.; Mehrotra, N.; Tornøe, C.W.; Kastrissios, H.; Patel, B.; Al-Huniti, N.; Jadhav, P.; Wang, Y.; Byon, W. Reporting Guidelines for Population Pharmacokinetic Analyses. J. Pharmacokinet. Pharmacodyn. 2015, 42, 301–314. [Google Scholar] [CrossRef]
  47. FDA. Population Pharmacokinetics Guidance for Industry. U.S. Department of Health and Human Services Food and Drug Administration. Center for Drug Evaluation and Research (CDER) Center for Biologics Evaluation and Research (CBER), 2022. Available online: https://www.fda.gov/media/128793/download (accessed on 24 March 2024).
  48. EMA. Guideline on Reporting the Results of Population Pharmacokinetic Analyses. Committee for Medicinal Products for Human Use (CHMP), 2007. Available online: https://www.ema.europa.eu/en/reporting-results-population-pharmacokinetic-analyses-scientific-guideline (accessed on 24 March 2024).
  49. Klinger, C. Bootstrapping Reality from the Limitations of Logic: Developing the Foundations of “Process Physics”, a Radical Information-Theoretic Modelling of Reality Paperback—22; VDM Publishing: Riga, Latvia, 2010. [Google Scholar]
  50. Eckardt, J.-N.; Hahn, W.; Röllig, C.; Stasik, S.; Platzbecker, U.; Müller-Tidow, C.; Serve, H.; Baldus, C.D.; Schliemann, C.; Schäfer-Eckart, K.; et al. Mimicking Clinical Trials with Synthetic Acute Myeloid Leukemia Patients Using Generative Artificial Intelligence. medRxiv. 2023. Available online: https://www.medrxiv.org/content/10.1101/2023.11.08.23298247v1 (accessed on 24 March 2024).
  51. Giuffrè, M.; Shung, D.L. Harnessing the Power of Synthetic Data in Healthcare: Innovation, Application, and Privacy. NPJ Digit. Med. 2023, 6, 186. [Google Scholar] [CrossRef]
  52. Lee, P.; Submitter, R.P.S.; Davis, U.C. Synthetic Data and the Future of AI. 110 Cornell Law Review. 2024. Available online: https://papers.ssrn.com/sol3/papers.cfm?abstract_id=4722162 (accessed on 24 March 2024).
  53. Nikolenko, S.I. Synthetic Data for Deep Learning, 1st ed.; Springer Nature: Cham, Switzerland, 2022. [Google Scholar]
  54. Assefa, S.A.; Dervovic, D.; Mahfouz, M.; Tillman, R.E.; Reddy, P.; Veloso, M. Generating Synthetic Data in Finance: Opportunities, Challenges and Pitfalls. In Proceedings of the First ACM International Conference on AI in Finance, New York, NY, USA, 15–16 October 2020; ACM: New York, NY, USA, 2020. [Google Scholar]
Figure 1. Visual representation of a variational autoencoder. The input data flow through the encoder and are mapped into the regularized latent space. The decoder processes the output of the encoder to produce the output. The decoder is a mirrored image of the encoder.
Applsci 14 02970 g001
Figure 2. Bioequivalence acceptance rate (%) for the “original”, “subsampled”, and VAE-“generated” datasets when both the Reference (R) and Test (T) pharmaceutical products exhibit identical average performance. Four different “original” sample sizes (N) were utilized (12, 24, 48, and 72). The subsample proportions were 25%, 50%, 75%, and 100%.
Applsci 14 02970 g002
Figure 3. Bioequivalence acceptance rate (%) for the “original”, “subsampled”, and VAE-“generated” datasets when there is 10% (A) and 20% (B) difference in the average endpoint value between the Test (T) and Reference (R) pharmaceutical products. Four different original sample sizes (N) were utilized (12, 24, 48, and 72). The subsample proportions were 25%, 50%, 75%, and 100%.
Applsci 14 02970 g003
Figure 4. Bioequivalence acceptance rate (%) for the “original”, “subsampled”, and VAE-“generated” datasets for high variability values (CVw = 30%). The T/R of the Test (T) and Reference (R) products was set at 1.0 (A), 1.1 (B), and 1.2 (C), while the subsample proportions were 25%, 50%, 75%, and 100%. Four different original sample sizes (N) were utilized (12, 24, 48, and 72).
Applsci 14 02970 g004
Figure 5. Bioequivalence acceptance “gain” of the VAE-“generated” dataset minus the “original” datasets. Three Test/Reference (T/R) ratios of the average endpoint were considered: 1.0 (A), 1.1 (B), and 1.2 (C). In all cases, a range of subsample proportions (25%, 50%, 75%, and 100%) was investigated, while the within-subject variability (CVw) was set at either 15% (typical case) or 30% (highly variable situation).
Applsci 14 02970 g005
Figure 6. Bioequivalence acceptance of the VAE-“generated”, “original”, and “subsampled” dataset for within-subject variability of 15% (A) and 30% (B). Two possibilities of the VAE-“generated” datasets are shown: one with the same sample size as the “original” dataset and another with twice the “original” sample size. Three Test/Reference (T/R) ratios of the average endpoint were considered: 1.0, 1.1, and 1.2. In all cases, a range of subsample proportions (25%, 50%, 75%, and 100%) was investigated.
Applsci 14 02970 g006
Table 1. Hyperparameter values explored in the tuning process of the VAEs. Across all instances, the latent space dimension and the number of epochs were fixed at 1 and 1000, respectively. Standardizing the input data was applied to all cases.
Activation FunctionWeights of Loss FunctionNumber of Hidden LayersNumber of Neurons in Hidden Layers
Hidden LayersOutput LayerKullback–Leibler PartReconstruction PartEncoderDecoderEncoderDecoder
SoftplusLinear113364-32-1616-32-64
22
99
1010
The entire computational work and “runs”, outlined in Table 1, were performed with TensorFlow 2.10.0 and Python version 3.7 and executed within a “Jupyter notebook” environment.
Table 2. List of factors explored in this study. For all cases, the mean of the stochastic term, mentioned in step “II” above, was set equal to 1.
Between-Subject Variability (CV)Within-Subject Variability (CVw)Mean Endpoint Value for the ReferenceRatio of Average Endpoints Test/ReferenceOriginal Sample Size (N)Subsampled ProportionsSize of Generated Data (xN)
20%15%10011225%
30% 1.12450%
1.24875%
72
Disclaimer/Publisher’s Note: The statements, opinions and data contained in all publications are solely those of the individual author(s) and contributor(s) and not of MDPI and/or the editor(s). MDPI and/or the editor(s) disclaim responsibility for any injury to people or property resulting from any ideas, methods, instructions or products referred to in the content.

