Article

Investigation of Cement and Fly Ash on the Improvement of Fine Sand Soil

Civil Engineering Department, Faculty of Engineering, Bursa Uludag University, Gorukle Kampusu, Nilufer 16059, Bursa, Turkey
*
Author to whom correspondence should be addressed.
Appl. Sci. 2024, 14(7), 2908; https://doi.org/10.3390/app14072908
Submission received: 5 March 2024 / Revised: 25 March 2024 / Accepted: 27 March 2024 / Published: 29 March 2024
(This article belongs to the Section Civil Engineering)

Abstract

:
Soil stabilization problems like liquefaction, bearing capacity, permeability, excessive settlement and swelling can be solved by improving soil’s engineering properties by using various methods. The use of fly ash as a stabilizer has become popular in recent years since it is eco-friendly and effective on soil stabilization, especially for fine-grained soils. This study investigated the reuse of fly ash as a stabilizer (5–25% by weight) and cement (constant 3% by weight) as an activator to enhance the geotechnical properties of poorly graded sand (SP). Standard proctor tests were conducted to determine optimum water content and maximum dry unit weight, followed by direct shear box, falling head permeability and CBR tests at the determined optimum water content. Direct shear box experiments were carried out at two relative densities (30% and 80%) and CBR experiments were performed after 7 and 28 days of curing time. The results demonstrated that the addition of fly ash and cement improved the geotechnical properties, including shear strength, permeability and bearing capacity of the fine sand soil.

1. Introduction

Due to population growth and urbanization, construction on unstable soils plagued by problems like liquefaction, excessive settlement, low bearing capacity, swelling, etc., has become necessary. For this reason, soil improvement methods have gained importance to enhance unsuitable areas in recent years. Soil improvement techniques are categorized as surface and deep soil, mechanical and chemical, or additive and non-additive improvement. Chemical remediation involves injecting or mixing active chemical compounds like fly ash, Portland cement, sodium chloride, lime, or viscoelastic substances such as bitumen [1]. However, in recent years, many studies have been performed to investigate ecological solutions to stabilize soils. Alkaline-activated cements are popular eco-friendly binders [2,3,4]; another one is fly ash, both of which have been considered as alternatives to Portland cement in geotechnical applications.
Improving geotechnical properties of clayey soils with fly ash has been studied for a while in geotechnical engineering. The recent studies on stabilizing silt and clay soils by fly ash were gathered in a paper as a review and it was shown that fly ash can be used as a substitute material to improve the mechanical properties of fine-grained soils [5]. However, studies on the improvement of sand soils with fly ash have been limited; Kaniraj and Havanagi [6] added fly ash and cement to sand and silt soils and found that cement had a greater effect than fly ash. Sahu [7] investigated the impact of fly ash on the CBR values of six types of soils and found that CBR values increased with increasing fly ash content, with the highest increase observed in silty sand soil and the lowest increase seen in high plasticity soil. Sumesh et al. [8], Saha and Pal [9], Ige and Ajamu [10] conducted unconfined compression tests on sandy soils and found that fly ash increased the unconfined compressive strength of the soil by the amount of increased fly ash. Motamedi et al. [11] studied the effect of fly ash and cement on sandy soil’s optimum water content and unconfined compressive strength, and the highest strength was obtained by adding 25% cement and 30% fly ash after 28 days curing, while the lowest strength was obtained by adding 5% cement and 30% fly ash after 1 day curing. Mahvash et al. [12,13] investigated the impact of fly ash on fine sand soil’s compaction behavior and CBR values by adding 5%, 10% and 15% F class fly ash with 3% Portland cement. The addition of cement decreased the optimum water content, while the addition of fly ash increased it. Both the curing time and fly ash amount had significant effects on the soil’s bearing capacity according to compaction test results; Simatupang et al. [14] found that adding fly ash to fine sand soils improved strength, with higher amounts of fly ash and longer curing times leading to increase the strength. Azaiez et al. [15] studied the effect of fly ash on compaction and shear behavior of coarse-grained soils and found that increasing fly ash content and maximum grain size led to an increase in maximum dry density and decreased optimum water content. Additionally, they stated that the shear strength values increased with increasing fly ash content and maximum grain size.
The curing conditions and curing duration are also important subjects to discuss regarding the mechanical strength of stabilized soil. It is known that moisture content affects the mechanical properties of soils by which the increment in water content reduces the mechanical properties of the soil. Some recent studies such as Ghadir and Razeghi [16] and Samadi et al. [17] focused on the curing duration and curing conditions on the mechanical strength of stabilized soil samples.
Mahvash et al. [12] indicated that cement is an effective activator for sandy soil improvement in their study in which they used 3% cement with 5–20% fly ash. Kaniraj and Havanagi [6] studied the compressive strength of cement stabilized soils; in their experiments, they used 3% and 6% of cement with various amount of fly ash. Zumrawi [18] studied the stabilization of pavement subgrade by using fly ash (5–20%) activated by 5% cement. Kolias [19] performed experiments on the stabilization of clayey soils with 10% fly ash and 4% cement. In light of previous research, it was decided to prepare test samples with a fixed 3% cement content and varying percentages (5–25% by weight) of fly ash. Since the cement is only being used as an activator in this research, rather than a stabilizer, it was selected at its lowest percentage.
In this study, cement and fly ash additives on the geotechnical properties of fine sand soil were experimentally investigated, which includes the effect of curing duration and the relative density of sand on the strength of the soil. In addition, the effect of the additives on the permeability of sand was considered. The optimum water content and maximum dry unit weight were obtained by compaction tests. Shear box, falling head permeability and CBR tests were performed to investigate the effect of additives on the geotechnical properties of the sand soil.

2. Materials and Methods
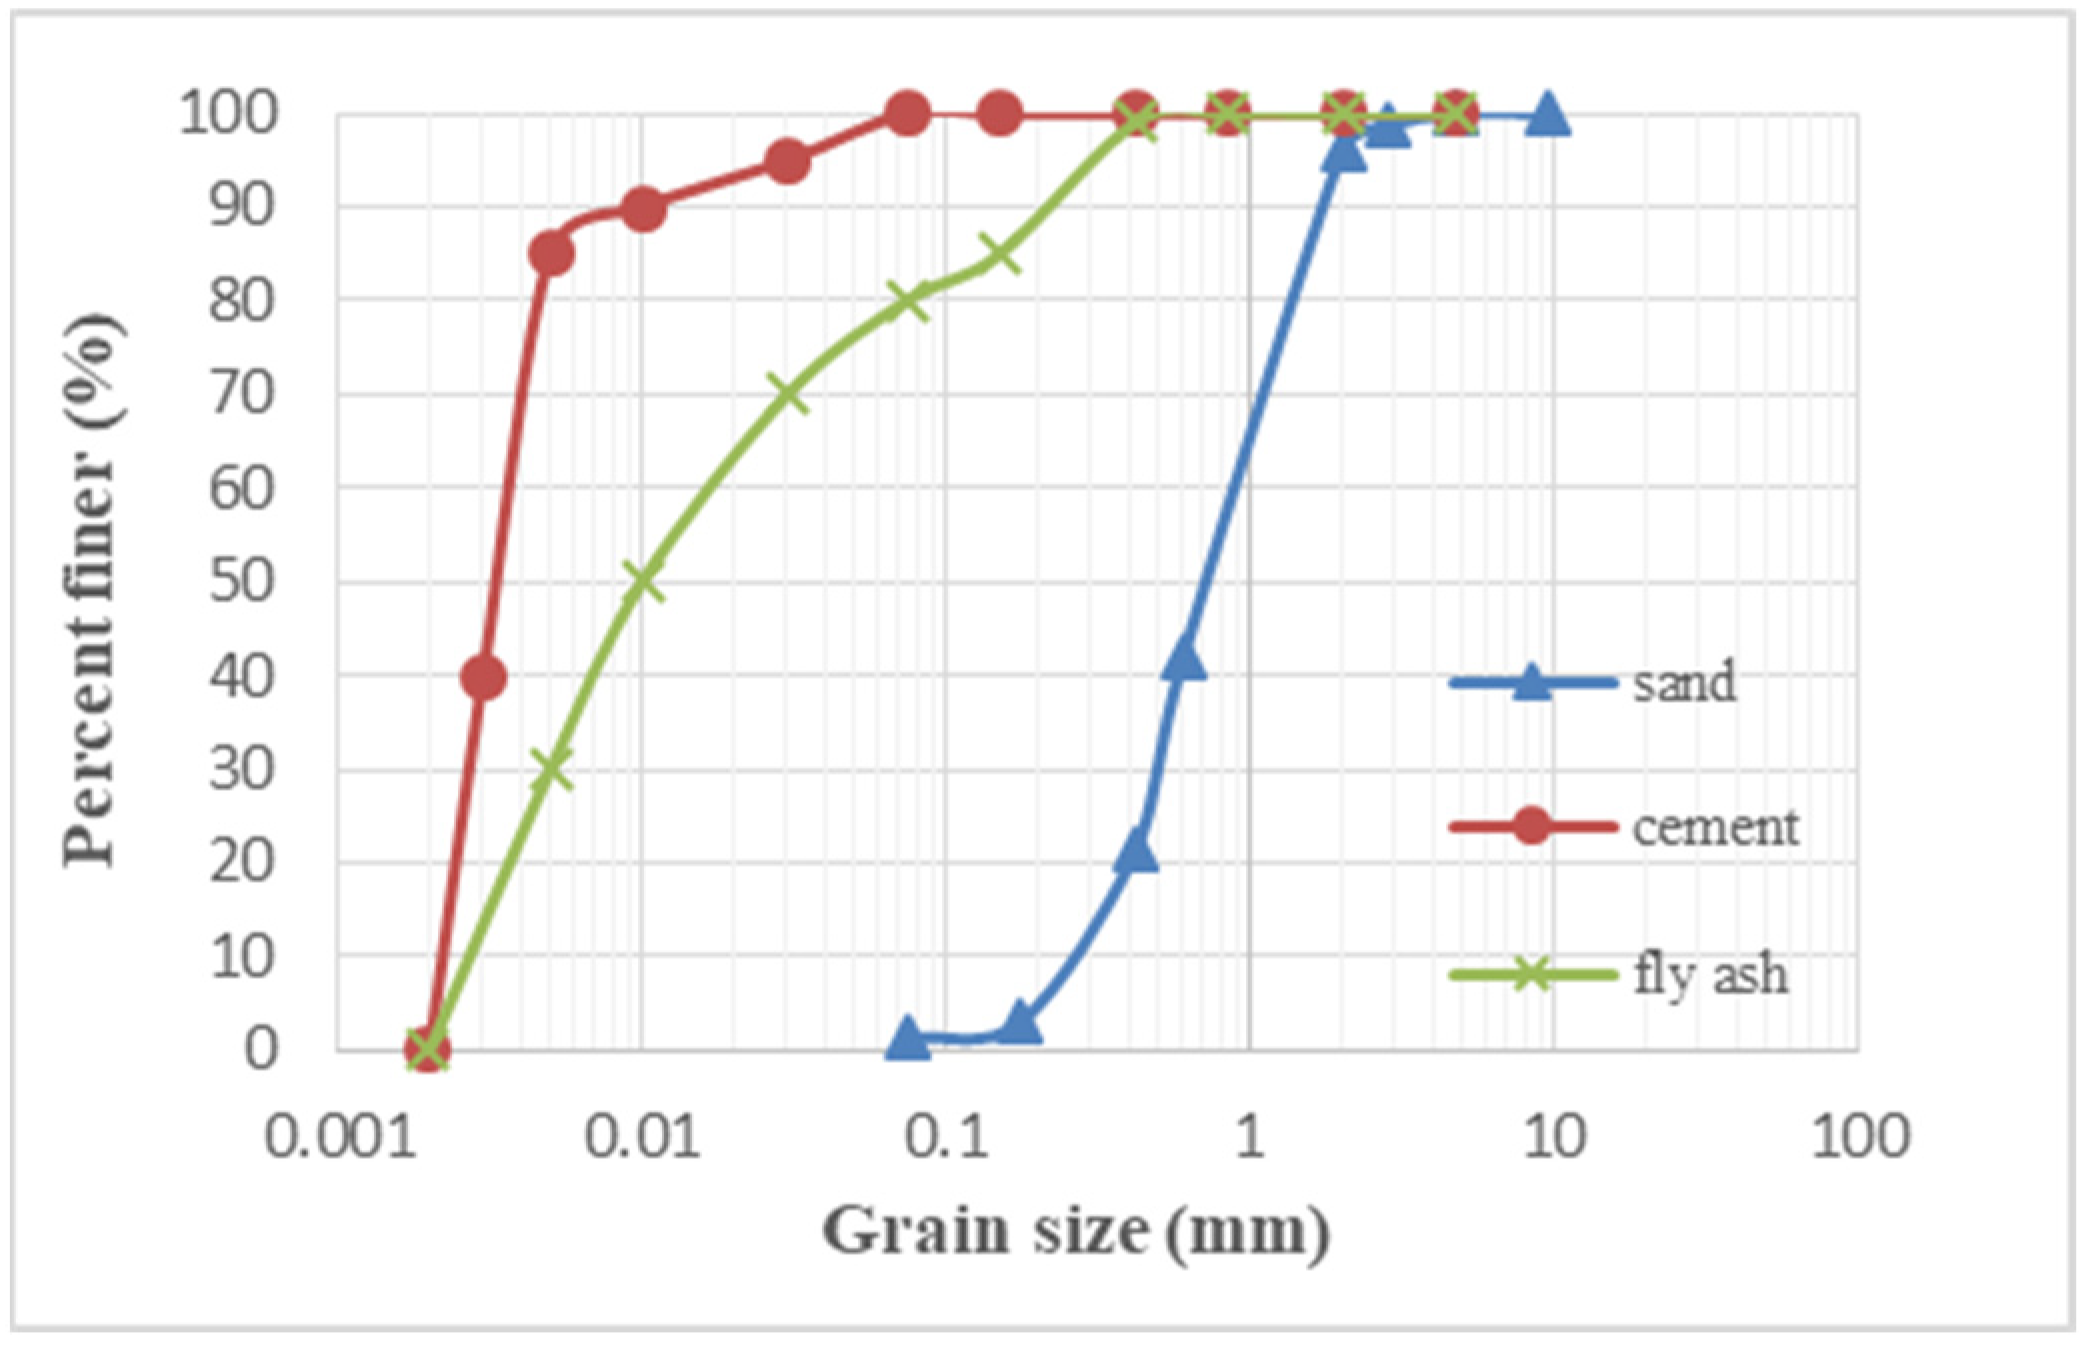
2.1. Materials

In the study, sand samples were sieved between No. 30 and No. 200 sieves and classified as poorly graded sand (SP) according to the United Soil Classification System (USCS) [20]. The grain size distribution curve of the sand is shown in Figure 1. From Figure 1, the uniformity coefficient, the coefficient of curvature and the effective particle size are obtained and noted in Table 1. The other physical properties of the sand, such as the specific gravity, the maximum and minimum void ratio, and the maximum and minimum dry unit weight are also given in Table 1. Table 2 shows the chemical and physical properties (including Specific Gravity and Specific Surface) of the cement and fly ash. The particle size distribution curves of the additive materials are given in Figure 1. CEM II/A-M(P-L) 42.5R Portland Composite cement was used as an activator at a fixed rate of 3% by weight. The fly ash added to the test samples as a stabilizer has CaO = 29.28% > 10% and SiO2 + Al2O3 + Fe2O3 = 50.92% > 50%; therefore, it is defined as C class fly ash according to ASTM C618 standard [21].

2.2. Method

In this study, the effect of fixed 3% cement and varying percentages of fly ash (5%, 10%, 15%, 20%, and 25%) on the geotechnical properties of fine sand soil was experimentally evaluated. First of all, standard compaction tests were performed on fly ash and cement added samples and a pure sand sample to obtain the optimum water content and maximum dry unit weight. Proctor compaction tests were performed according to Method A, since the maximum diameter size of the sample was 0.6 mm and less than 20% of the soil sample was retained on a 4.75 mm sieve (ASTM D698 [22]). Soil samples were prepared at six different water contents at standard proctor compaction molds which had a 101.6 mm diameter. For each experiment, a new soil sample was prepared, since the crushed sand particles after an experiment may change the fine-grained sand particles percentage.
Then, direct shear box tests were performed to determine the internal friction angle and cohesion values of the sand samples at their optimum water contents which were determined previously from standard compaction tests (ASTM D3080 [23]). Shear box tests were carried out at two relative densities (30% and 80%) in order to represent loose and dense conditions, respectively. A square direct shear box of a 60 × 60 × 25 mm size was used in the experiments. The soil sample amount was calculated according to minimum and maximum void ratios for each case. For the dense condition, the calculated soil amount was compacted in the mold in three layers, whereas for the loose condition, the free fall method was used. Normal stresses applied on top of the soil samples were 54.5 kPa, 109 kPa and 218 kPa, respectively. The horizontal load was applied with a speed of 0.5 mm/min [24,25].
After that, California bearing ratio (CBR) tests were carried out (ASTM D1883 [26]). Curing ages were 7 and 28 days, respectively. The mixtures were cast in 3 layers and compacted into molds having a 152.4 mm diameter and 177.8 mm height under optimum water contents. After preparing the samples, molds were placed in sealed plastic bags and kept in desiccators during the aging period in order to maintain their moisture content. Eventually, their 7 and 28 day strengths were tested. The penetration speed of the experimenting rod was 1.3 mm/min. The stresses were recorded when the rod’s penetration depth reached 2.5 mm and 5 mm, and the highest value was recorded as the CBR value of the specimen.
The final experiment that was carried out through the soil samples was the falling head permeability test in order to evaluate the hydraulic conductivity of the mixtures (ASTM D5856 [27]). The falling head permeability test was preferred since sand has a maximum particle size of 0.60 mm and additives have a finer particle size than that. Mixtures were prepared according to their optimum water contents and maximum dry unit weights in a mold by compacting in three layers, and filter papers were placed on the top and bottom of the samples.
The prepared samples for each experiment are listed in Table 3. For the proctor compaction tests, each mixture was prepared six times at different moisture contents. For direct shear tests, three samples were prepared for each mixture at two different relative densities: 30% and 80%, respectively. For CBR tests, four samples were prepared for each mixture; two of them were tested after 7 days of curing, while the others were tested after 28 days of curing. For permeability tests, two samples were prepared for each mixture.

3. Results

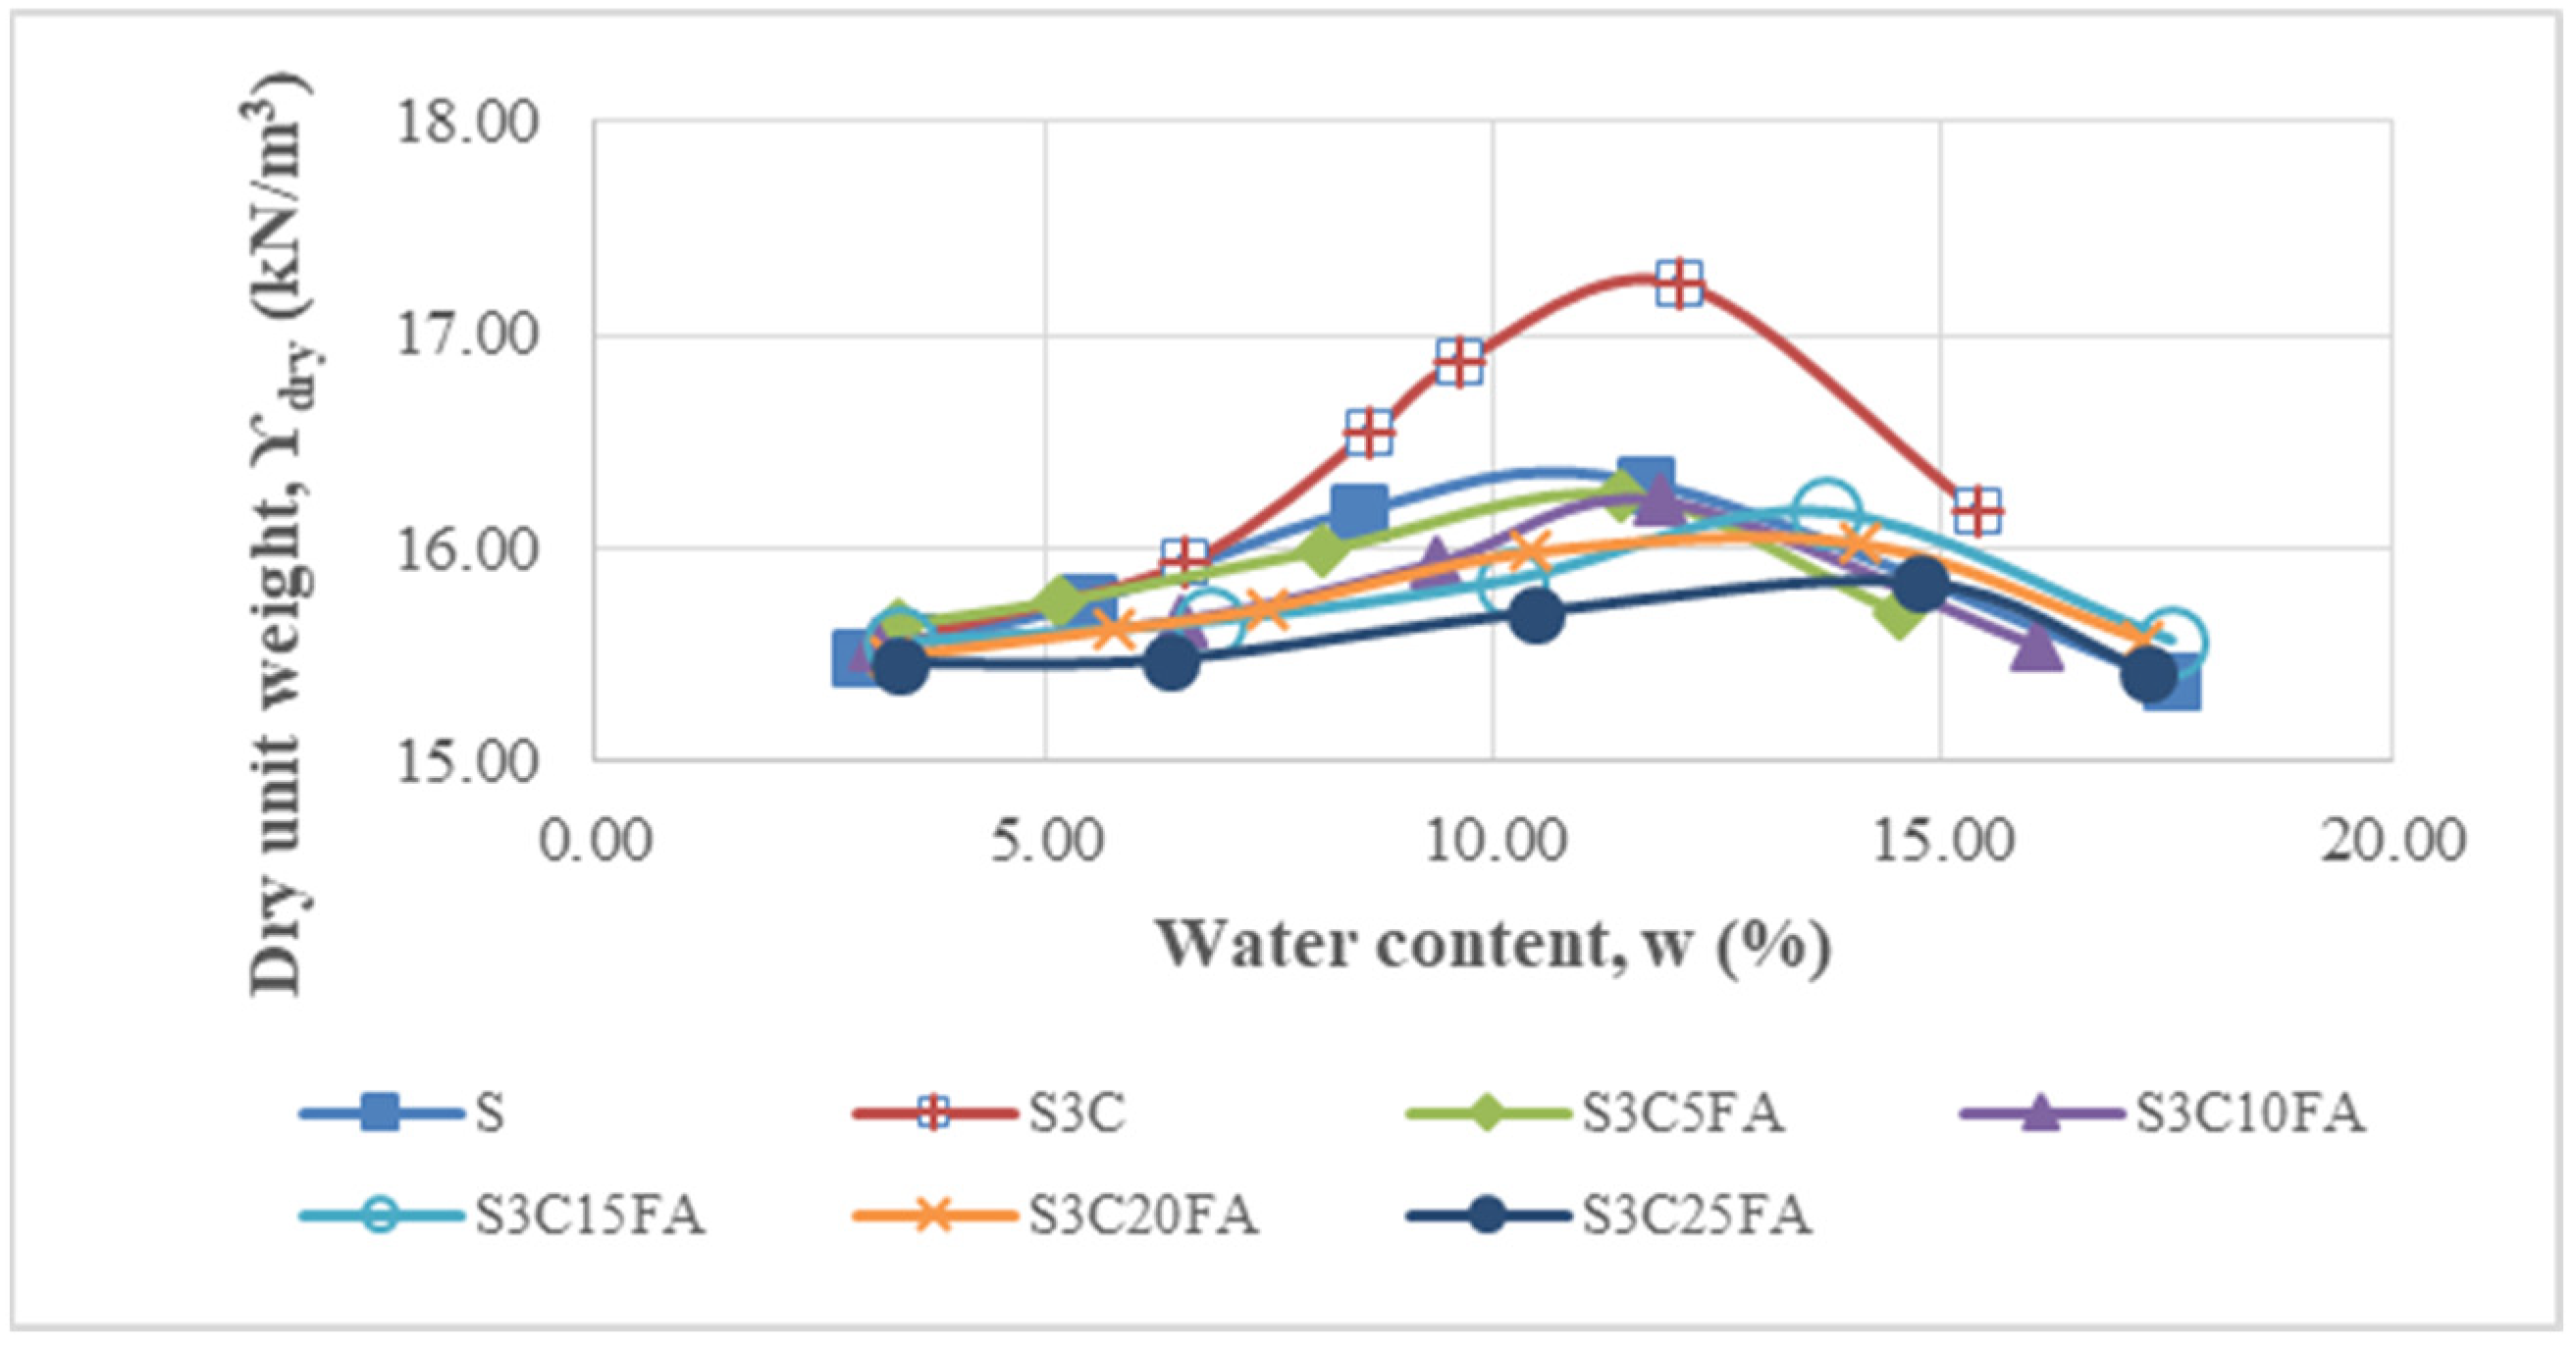
3.1. Standard Proctor Test

Standard proctor tests determine the maximum dry unit weight and optimum water content values of the samples. The test results, shown in Figure 2, compare samples with and without additives. The notation S represents the pure sand sample, S3C represents 3% cemented sand, S3C5FA represents sand soil with 3% cement and 5% fly ash, S3C10FA represents sand soil with 3% cement and 10% fly ash, and so on.
The figure shows that the optimum water content values, which range from 11.66% to 14.74%, increase with increasing amounts of fly ash and cement. This is because fly ash and cement require more water due to their finer particle size, than sand soil due to its hydration. Nithin and Sayida [28] also indicate that the increase in fly ash content results in an increase in optimum water content. From the figure, the highest maximum dry unit weight value of 17.24 kN/m3 is obtained in the S3C sample, and the lowest value of 15.84 kN/m3 is obtained in the S3C25FA sample. The addition of only 3% cement (S3C) led to a significant increase in the maximum dry unit weight value, whereas the inclusion of fly ash results in a drastic decrease in this value. This can be attributed to the higher specific gravity of cement compared to the lower specific gravity of fly ash, which is lower than that of sand. In their study, Prabakar et al. [29] also mentioned that for any particular percentage of fly ash addition in soil, the dry density decreases with an increase in fly ash content.

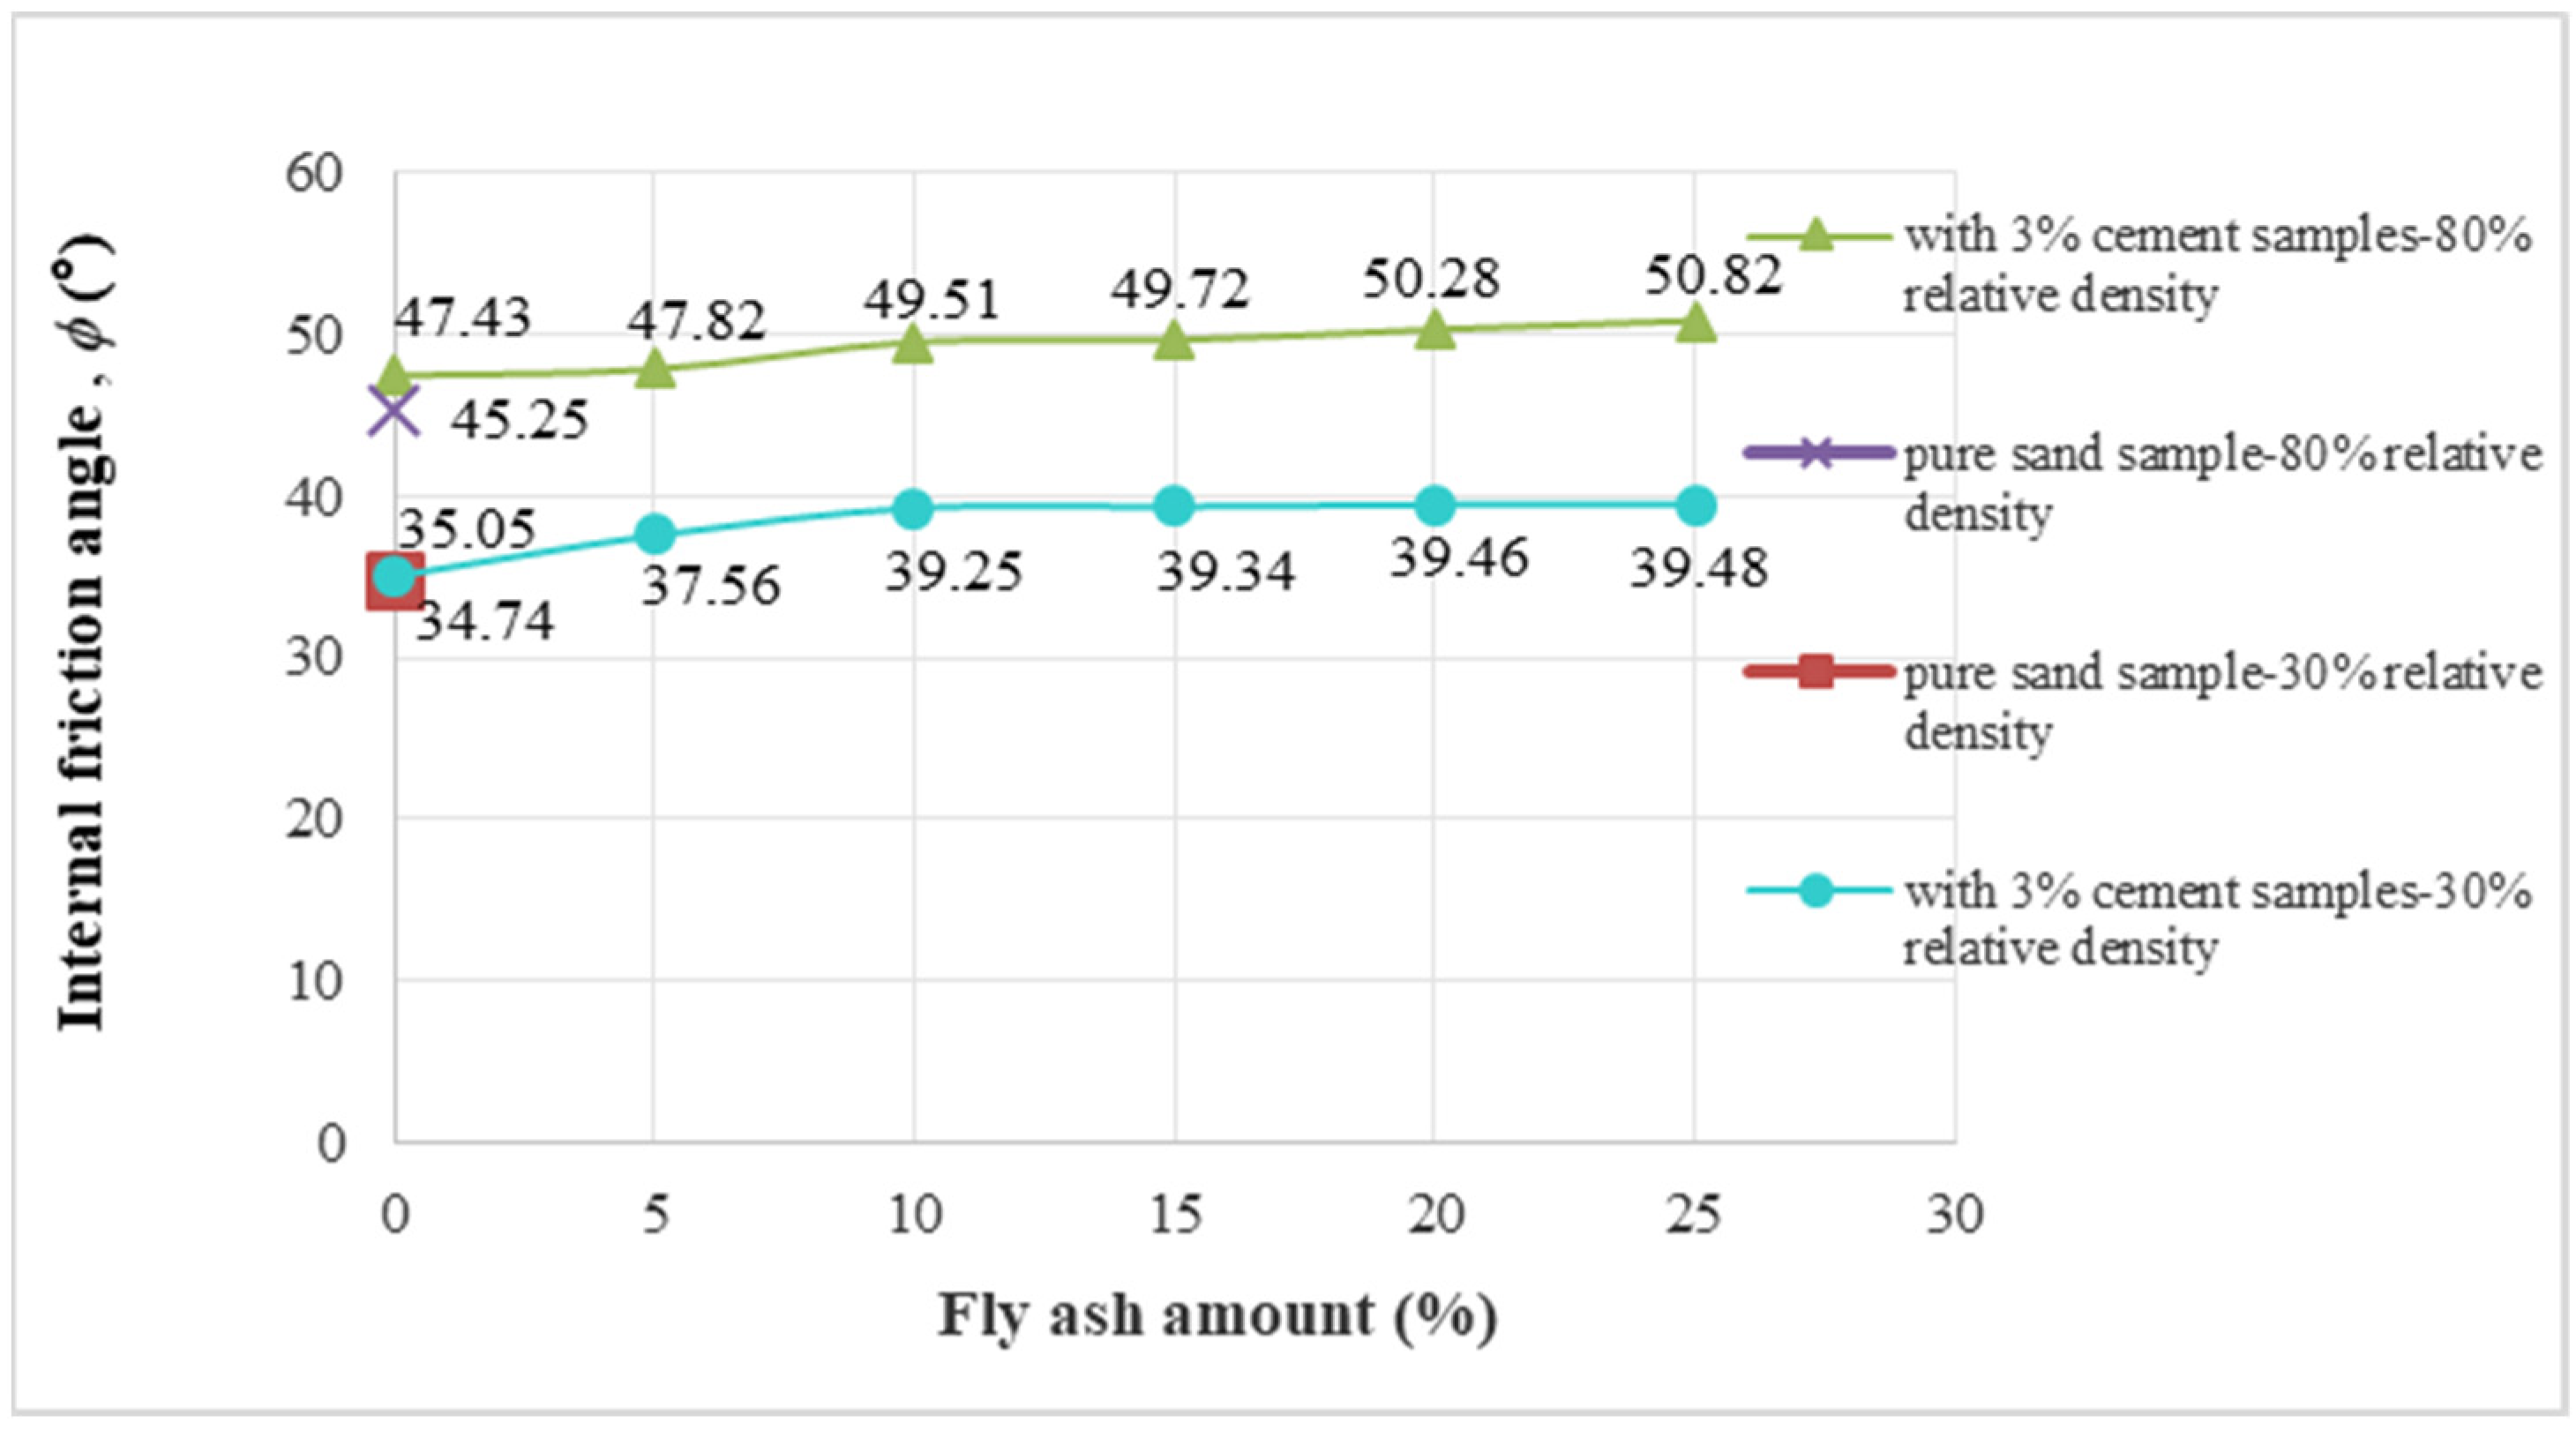
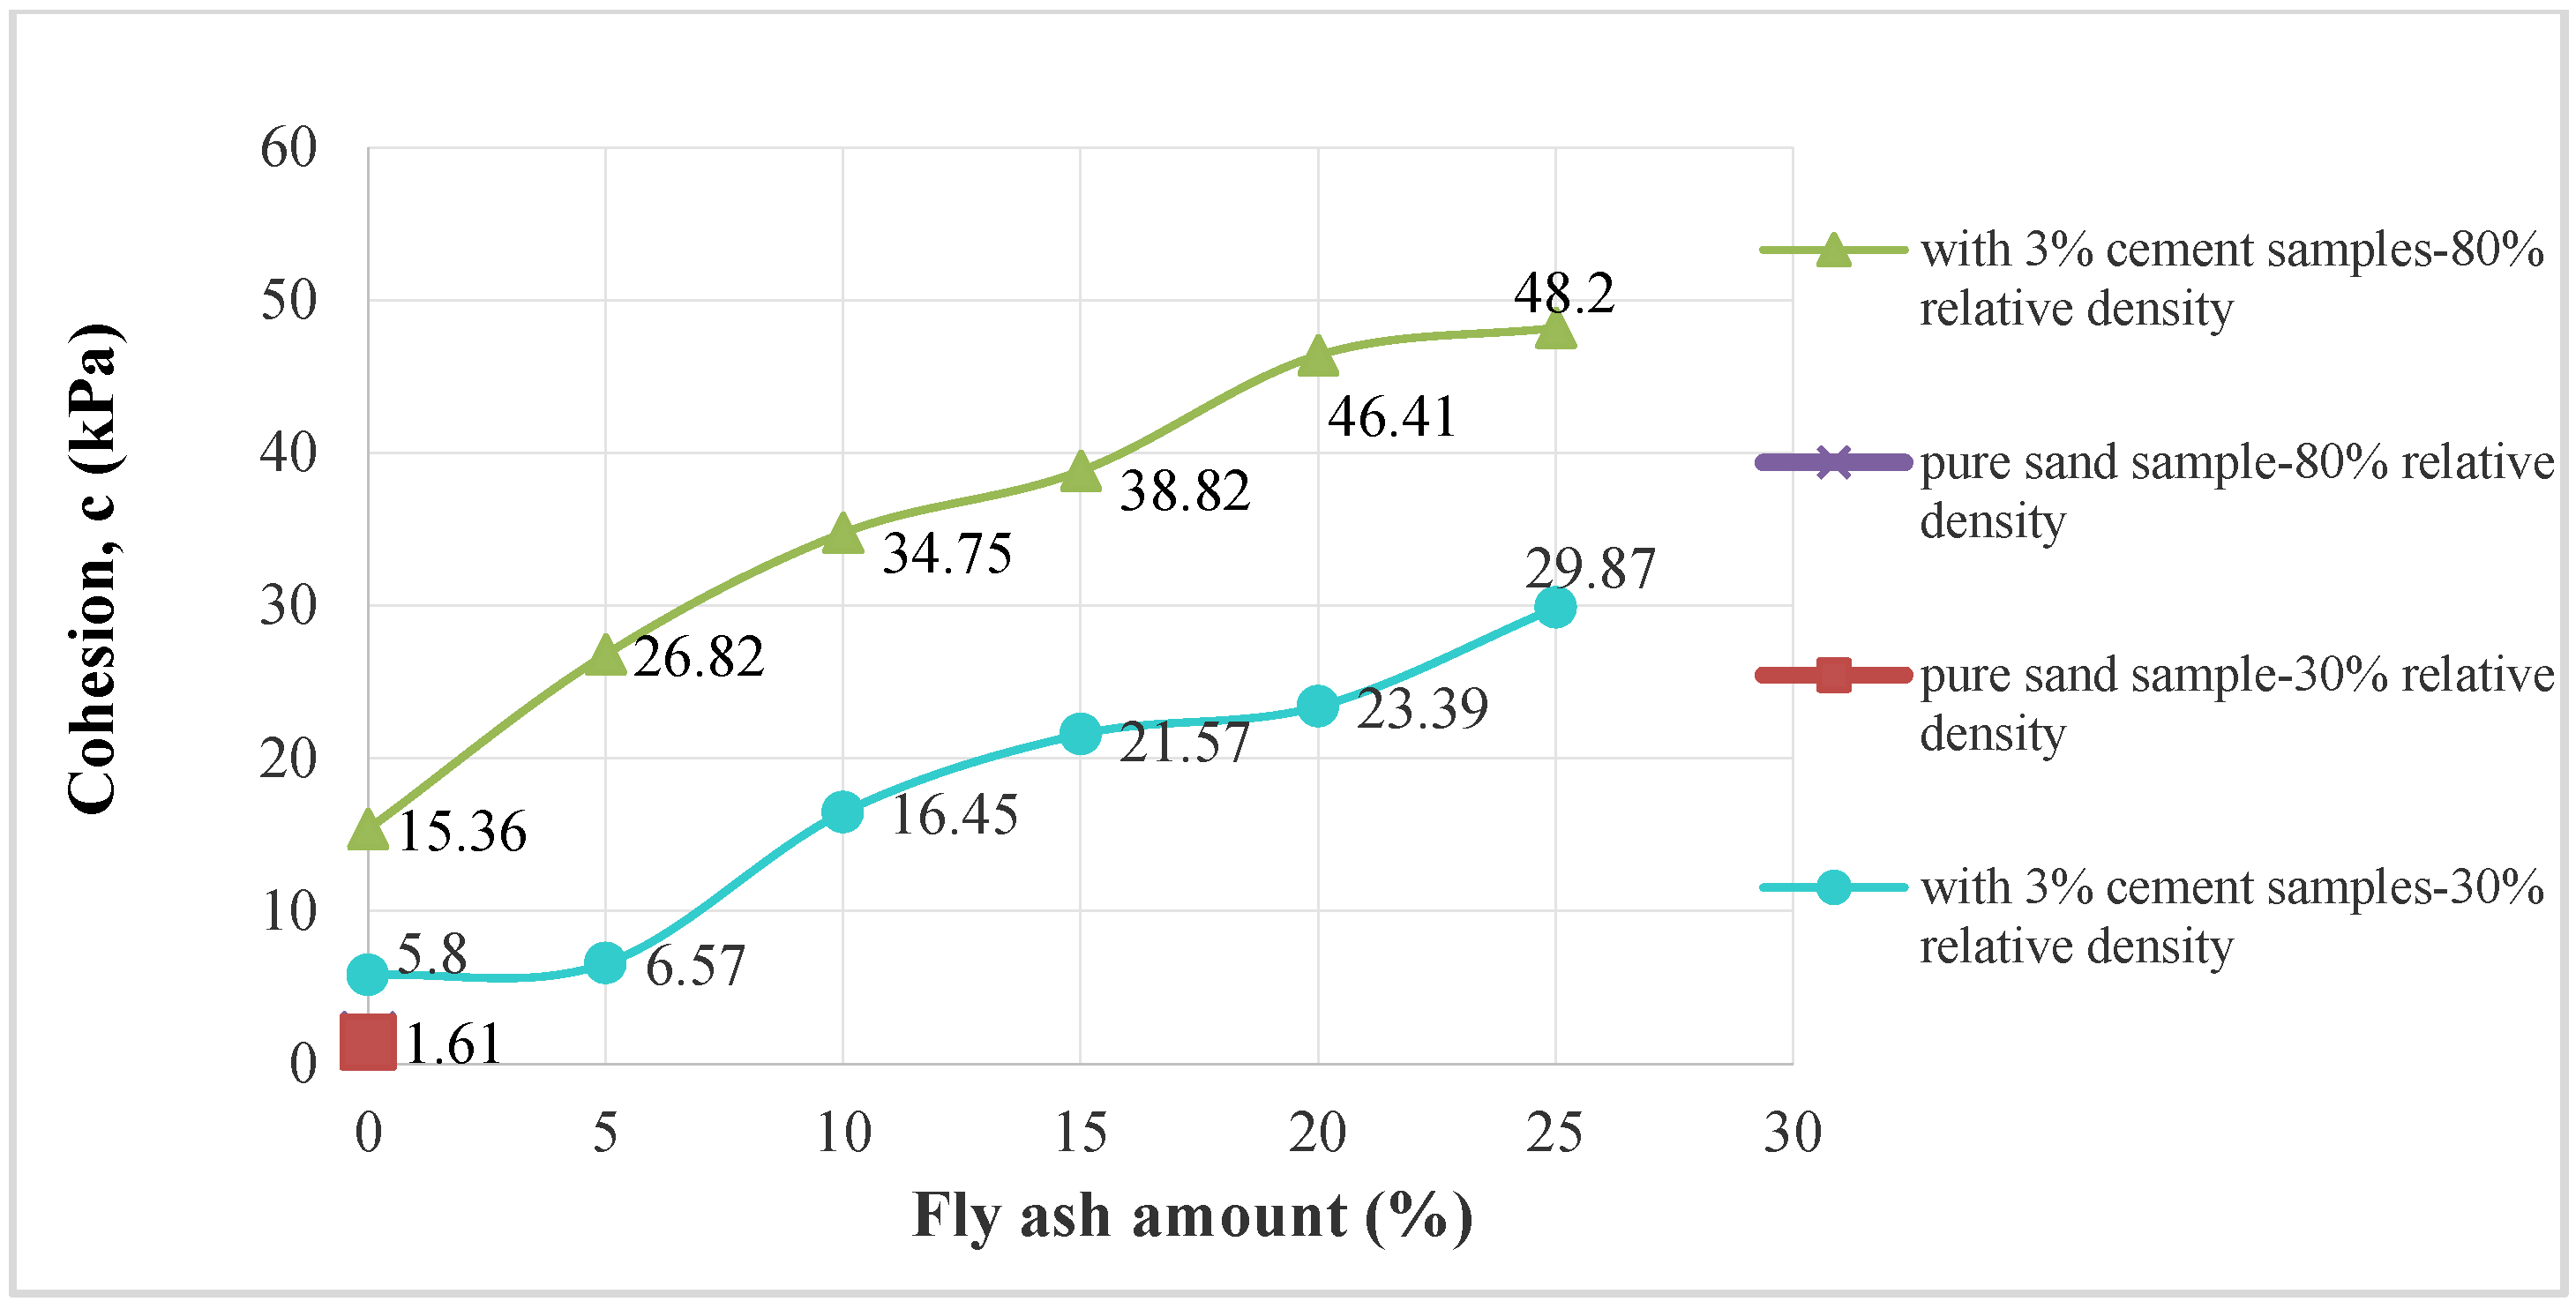
3.2. Direct Shear Box Test

Direct shear box tests are conducted in two sets. The first set represents the loose condition and samples are prepared at a relative density of 30%. The second set represents the dense condition and samples are prepared with a relative density of 80%.
The internal friction angle values obtained for all mixtures are shown in Figure 3. Fly ash and cement additives increase these values for all cases, with an increasing amount of fly ash. From the figure, the rate of increase in the internal friction angle of the mixtures almost does not change after 10% fly ash additive for both densities. The internal friction angle of pure sand is 34.74° for 30% relative density. With 3% cement additive, it increases by approximately 1% to 35.05°. With fixed 3% cement and 10% fly ash, the internal friction angle value increases by 13% to 39.25° compared to the pure sand sample. For the 80% relative density sand, the internal friction angle value (47.43°) shows a 5% increase after adding 3% cement when compared to pure sand (45.25°) and a 9.4% increase is obtained (which is 49.51°) after adding 3% cement and 10% fly ash, compared to the pure sand sample. It is seen that the increment percent of the friction angle is less for dense sand than for loose sand.
The addition of fly ash and cement also increase the cohesion of the samples (Figure 4) for both relative densities (30% and 80%). From the figure, it is noted that the cohesion of sand without additives is 1.43 kPa and 1.61 kPa for 30% and 80% relative densities, respectively. The addition of fly ash and cement to fine sand soil increases the cohesion value, with the highest cohesion value being observed at 25% fly ash and 3% cement (S3C25FA) for both relative densities. For 30% relative density, cohesion increases from 1.43 kPa to 29.87 kPa, while for 80% relative density sand, the highest cohesion value is 48.2 kPa. The increment of cohesion is 60% more for dense sand compared to the loose sand condition. This may be because of the additives filling the voids in the soil and creating a more stable condition, leading to an increased internal friction angle and cohesion values in pure fine sand. For the dense sand condition, compacting the sand with the additives seems to be more efficient to increase the cohesion of the mixtures, when comparing the internal friction angles of the samples. Simatupang et al. [14] also studied mechanical properties of sand soil threated with fly ash; they point out that the parameters of cohesion “c” and friction angle “ϕ” of the fly ash-stabilized sands are always higher than those of the untreated sands.

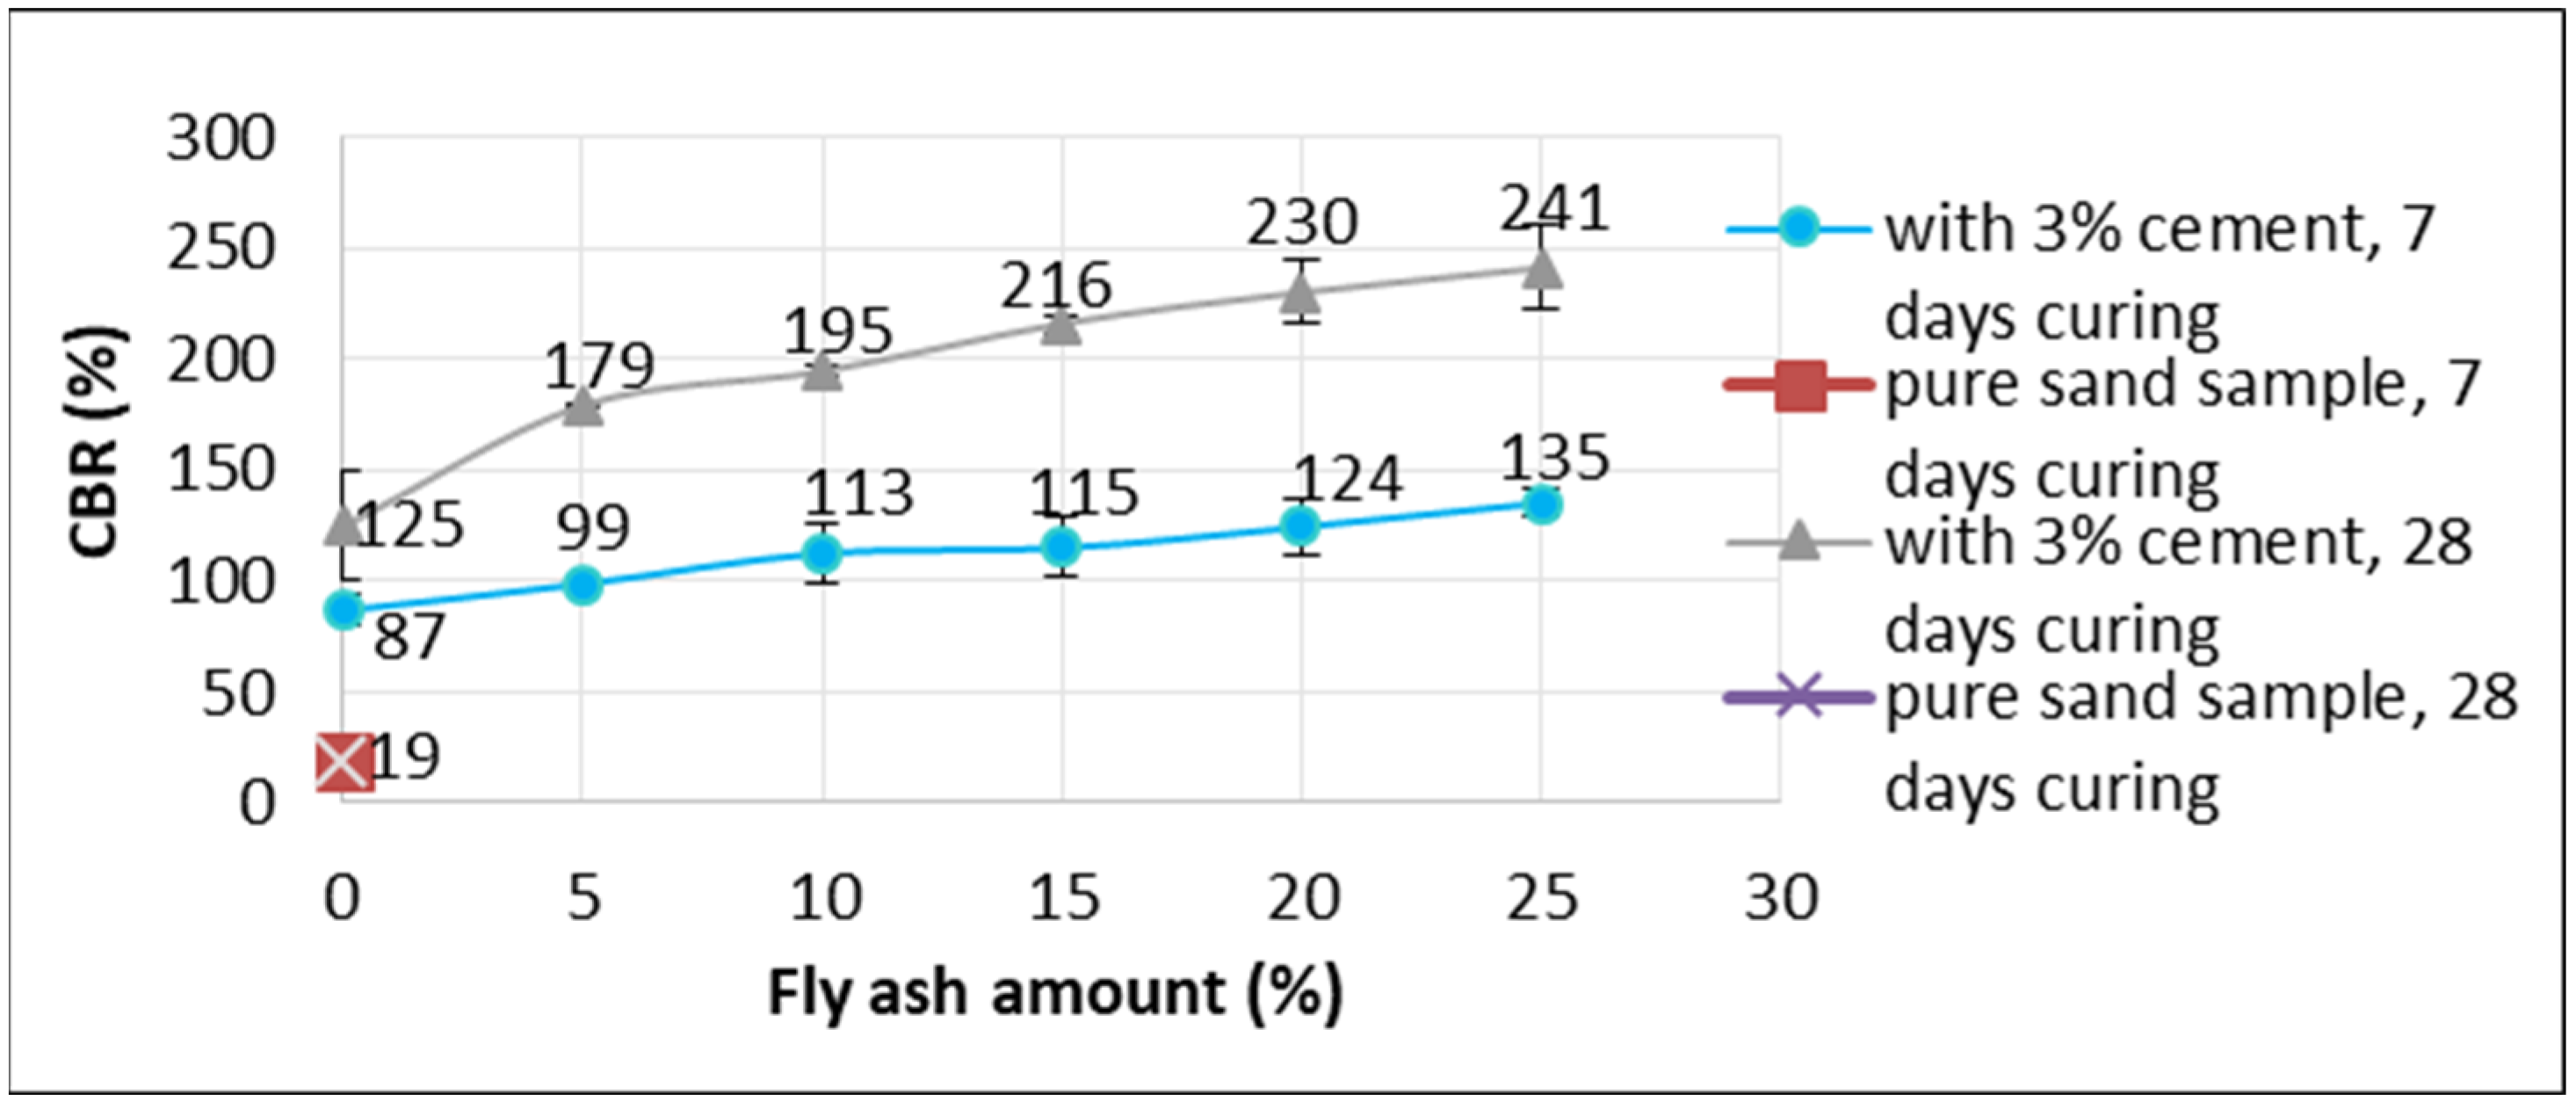
3.3. California Bearing Ratio Test (CBR Test)

The CBR tests are performed on samples with and without additives for 7 and 28 day curing periods; the results are presented in Figure 5. The pure sand sample exhibits a CBR value of 19% at both time points. Adding only 3% cement (S3C) without fly ash results in a CBR value of 87% after 7 days of curing, indicating a 4.6-fold increase compared to the pure sand. As it can be seen from the figure, the CBR values of the samples continue to increase with higher fly ash ratios. After 7 days of curing, the CBR values for 5%, 10%, 15%, 20%, and 25% fly ash additions, along with fixed 3% cement, are 87%, 99%, 113%, 115%, and 124%, respectively. The S3C25FA sample exhibits the highest CBR value at 124%, corresponding to a 6.5-fold increase compared to the pure sand sample.
In Figure 5, the S3C sample’s CBR value after 28 days of curing is 125%, indicating that the addition of 3% cement increases the CBR value of fine sand by 6.58 times. Adding 5%, 10%, 15%, 20%, and 25% fly ash to sand with a fixed 3% cement increases the CBR values of the samples to 179%, 195%, 216%, 230%, and 241%, respectively, after 28 days of curing. The highest CBR value is still observed in the S3C25FA sample, and the increment is 12.7 times that of the pure sand sample. This may be because of the fly ash which binds the particles and therefore increases the soil stiffness and strength which was emphasized in the study of Amadi [30].
The experiment results show that cement increases the CBR value of fine sand soil, while the CBR value of samples continues to increase with an increasing fly ash ratio. Prabakar et al. [29] suggested that the increase in the CBR value of fly ash added soil was due to the interlocking phenomenon of soil and fly ash. It is seen that the curing time is significantly affected by the CBR values of test samples. Simatupang et al. [14] also emphasized that the curing time had a positive effect on the mechanical properties of treated sand soils. The increase in the CBR value with curing time was attributed to the hydration reaction of cement and the slow pozzolanic reaction of fly ash, which caused self-hardening of the generated bond [31].

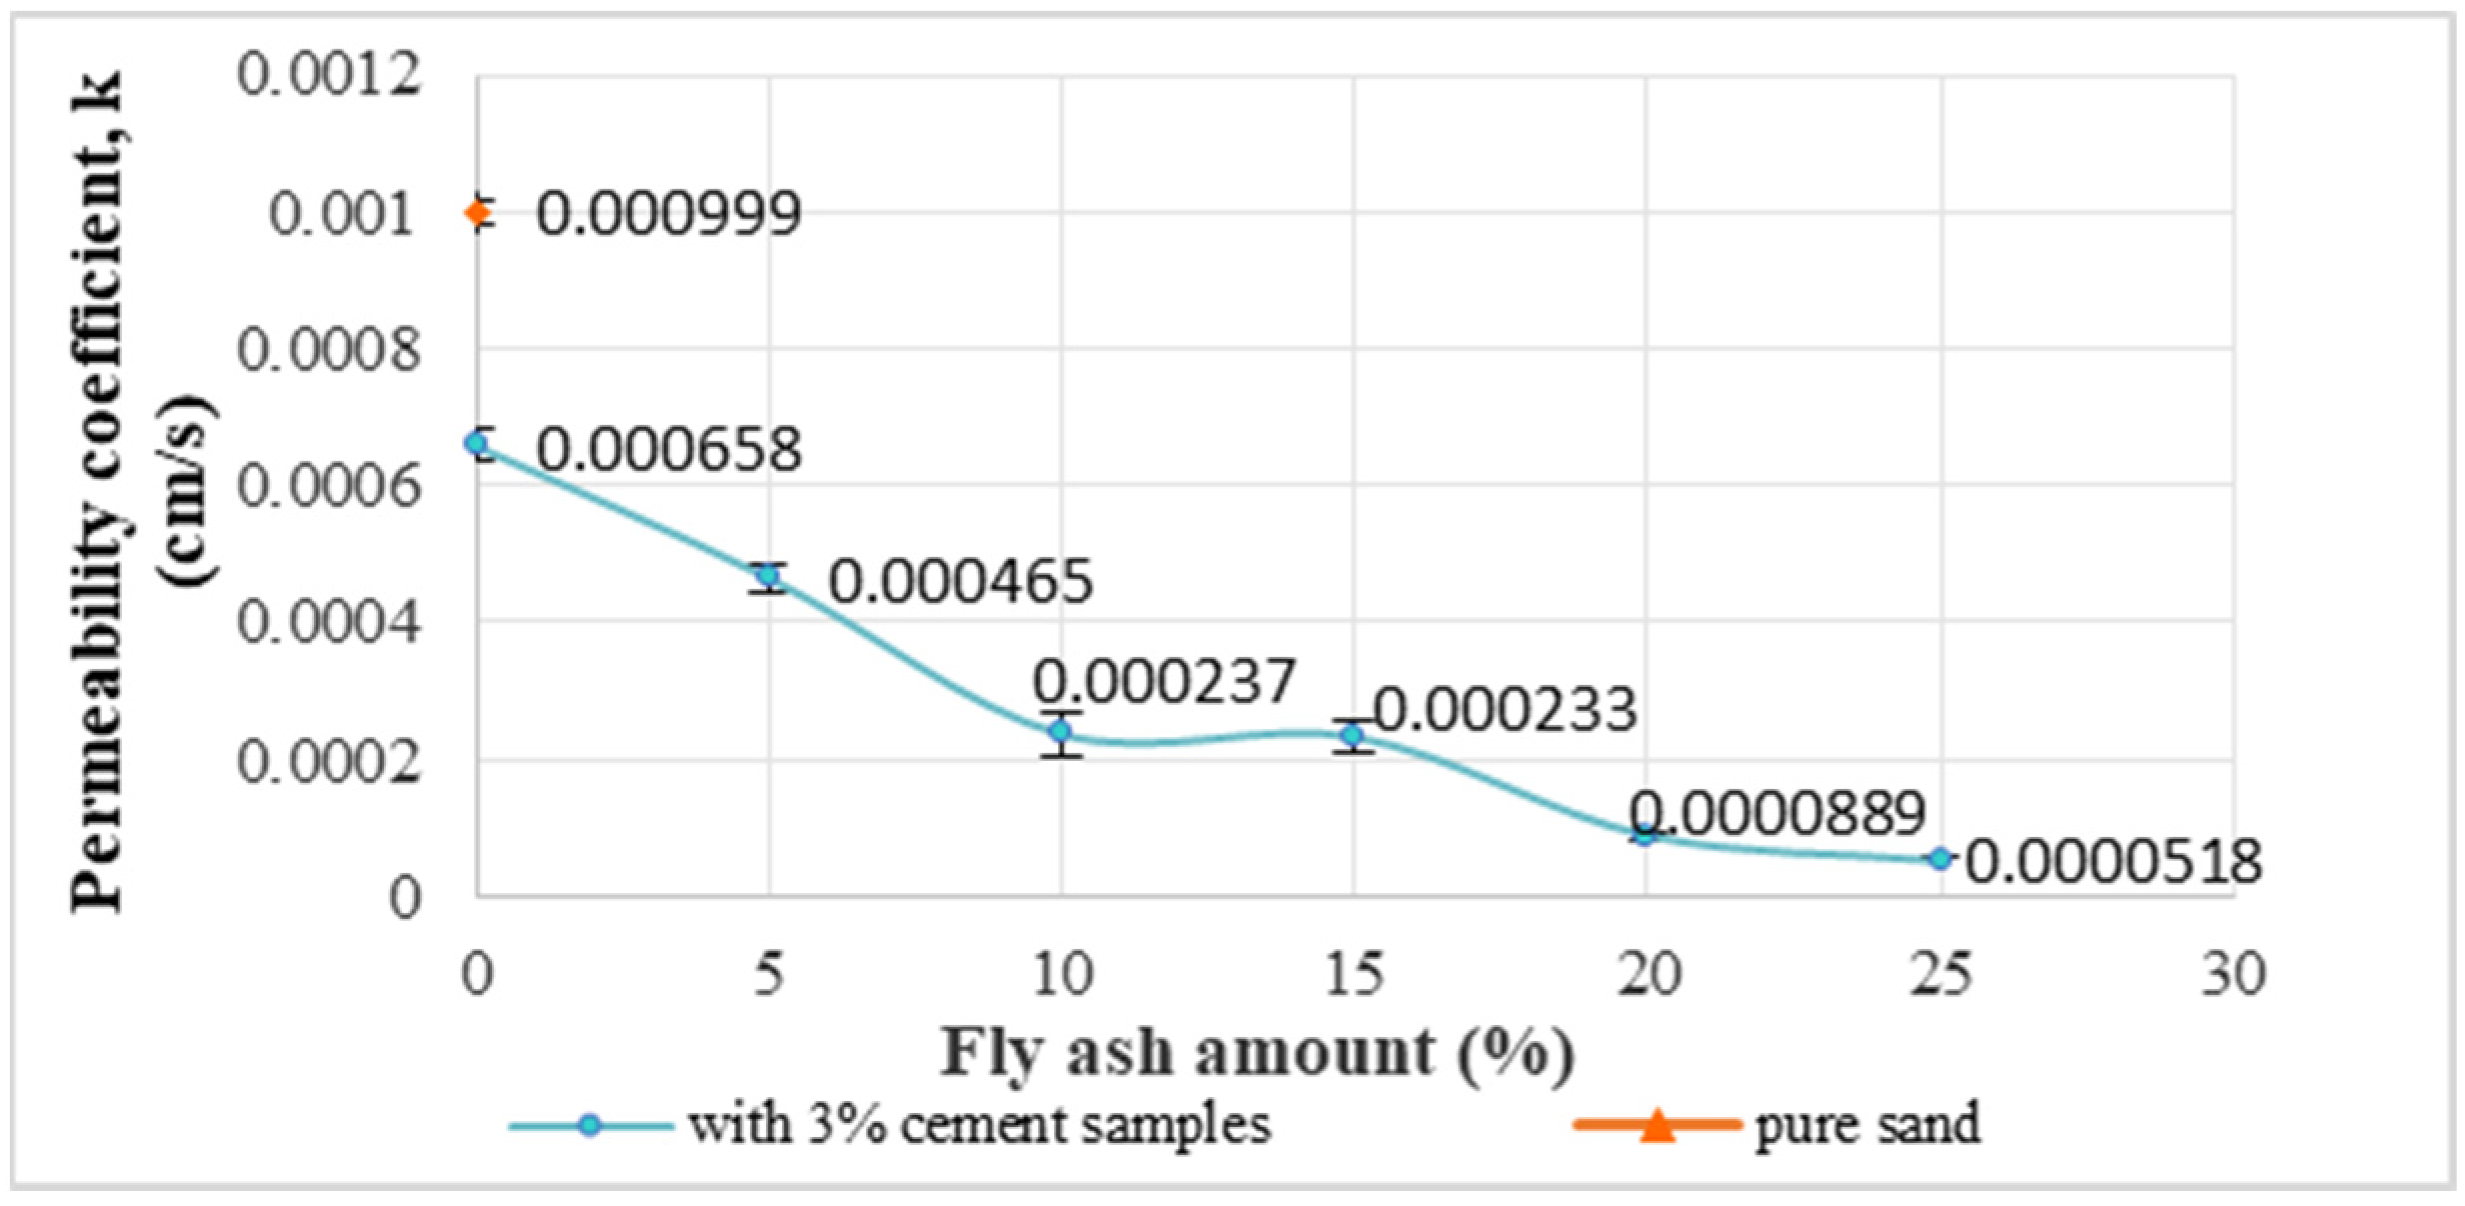
3.4. Falling Head Permeability Test

Falling head permeability tests are conducted to determine the permeability coefficient of the samples, considering the materials (cement and fly ash) in the mixtures and the maximum grain size of the sand (Dmax = 0.60 mm). The results of the tests are presented in Figure 6. The addition of fly ash and cement to the sand soil results in a reduction in the permeability coefficient of the samples at all levels. The pure sand sample (S) exhibits the highest permeability coefficient which is 9.99 × 10⁻⁴ cm/s, while the S3C25FA sample shows the lowest value at 5.18 × 10⁻⁵ cm/s. This represents a decrease in the permeability coefficient of approximately 20 times compared to the pure sand. It may be because of the inclusion of fly ash and cement fills the gaps between the sand particles, creating a denser and void-free structure, thereby reducing permeability. In the study of Zhou et al. [32], it was indicated that C class fly ash permeability was less than 10−6 cm/s; this could also be due to the decrease in the permeability through the increase in the amount of fly ash.

4. Conclusions

This study investigates the effects of cement and fly ash additives on the geotechnical properties of fine sand soil through experimental testing. Samples are created by adding fixed 3% cement and 5, 10, 15, 20 and 25% fly ash by weight to the fine sand soil. Compaction tests are performed to obtain the optimum water content and maximum dry unit volume weight values for the samples with and without additives. The CBR, direct shear box and falling head permeability tests are conducted on the samples at their optimum water contents to evaluate the effects of the additives on the geotechnical properties of the soil.
Based on the extensive experimental study carried out:
  • The optimum water contents of treated soils increases continuously with the increase in fly ash amount. However, the dry unit weight of the samples decreases with the addition of fly ash, contrary to the addition of cement.
  • Fly ash and cement additives improve the internal friction angle, cohesion and CBR value of the fine sand soil in the experiments. A 28 day curing period results in nearly a two-fold increase in the CBR ratio compared to a 7 day curing period. The relative density of the sand influences both the increase in the friction angle and cohesion. The friction angle shows a greater increase in loose sand, while the cohesion exhibits a larger increment in dense sand compared to loose sand.
  • The permeability coefficient of the sand decreases with the addition of fly ash and cement at all percentages of additives.
These findings indicate that fly ash can be used as a stabilizer for soil improvement applications of sand soil, as it positively affects the geotechnical properties of the soil. Further experiments can be conducted on sand particles of varying sizes to broaden the investigation.

Author Contributions

Investigation, E.Y. and Y.S.U.; methodology, Y.S.U.; resources, E.Y.; supervision, Y.S.U.; validation, E.Y.; writing—original draft, E.Y.; writing—review and editing, Y.S.U. All authors have read and agreed to the published version of the manuscript.

Funding

This research received no external funding.

Institutional Review Board Statement

Not applicable.

Informed Consent Statement

Not applicable.

Data Availability Statement

The original contributions presented in the study are included in the article; further inquiries can be directed to the corresponding author.

Conflicts of Interest

The authors declare no conflicts of interest.

References

  1. Little, D.N.; Nair, S. NCHRP 20-07 Recommended Practice for Stabilization of Subgrade Soils and Base Materials; Texas Transportation Institute: Bryan, TX, USA, 2009; ISBN 978-0-309-43562-8. [Google Scholar] [CrossRef]
  2. Correa-Silva, M.; Rouainia, M.; Miranda, T.; Cristelo, N. Predicting the mechanical behaviour of a sandy clay stabilised with an alkali-activated binder. Eng. Geol. 2021, 292, 106260. [Google Scholar] [CrossRef]
  3. Zahmak, A.; Abdallah, M.; Jarah, B.; Arab, M.G. Environmental performance of alkali-activated binders for ground improvement. Transp. Geotech. 2021, 31, 100631. [Google Scholar] [CrossRef]
  4. Komaei, A.; Noorzad, A.; Ghadir, P. Stabilization and solidification of arsenic contaminated silty sand using alkaline activated slag. J. Environ. Manag. 2023, 344, 118395. [Google Scholar] [CrossRef] [PubMed]
  5. Turan, C.; Javadi, A.A.; Vinai, R.; Beig Zali, R. Geotechnical Characteristics of Fine-Grained Soils Stabilized with Fly Ash, a Review. Sustainability 2022, 14, 16710. [Google Scholar] [CrossRef]
  6. Kaniraj, S.R.; Havanagi, V.G. Compressive strength of cement stabilized fly ash-soil mixtures. Cem. Concr. Res. 1999, 29, 673–677. [Google Scholar] [CrossRef]
  7. Sahu, B.K. Improvement in California bearing ratio of various soils in Botswana by fly ash. In Proceedings of the International Ash Utilization Symposium, Lexington, KY, USA, 22–24 October 2001; University of Kentucky: Lexington, KY, USA, 2001. [Google Scholar]
  8. Sumesh, M.; Kalita, A.; Singh, B. An experimental investigation on strength properties of fly ash blended soils treated with cement. J. Environ. Res. Dev. 2010, 5, 322–329. [Google Scholar]
  9. Saha, S.; Pal, S.K. Influence of fly ash on unconfined compressive strength of soil and fly ash layers placed successively. Electron. J. Geotech. Eng. 2013, 18, 1593–1602. [Google Scholar]
  10. Ige, J.A.; Ajamu, S.O. Unconfined compressive strength test of a fly ash stabilized sandy soil. Int. J. Latest Res. Eng. Technol. 2015, 1, 1–11. [Google Scholar]
  11. Motamedi, S.; Song, K.I.; Hashim, R. Prediction of unconfined compressive strength of pulverized fuel ash–cement–sand mixture. Mater. Struct. 2015, 48, 1061–1073. [Google Scholar] [CrossRef]
  12. Mahvash, S.; López-Querol, S.; Bahadori-Jahromi, A. Effect of class F fly ash on fine sand compaction through soil stabilization. Heliyon 2017, 3, e00274. [Google Scholar] [CrossRef]
  13. Mahvash, S.; López-Querol, S.; Bahadori-Jahromi, A. Effect of fly ash on the bearing capacity of stabilised fine sand. Proc. Inst. Civ. Eng.-Ground Improv. 2018, 171, 82–95. [Google Scholar] [CrossRef]
  14. Simatupang, M.; Mangalla, L.K.; Edwin, R.S.; Putra, A.A.; Azikin, M.T.; Aswad, N.H.; Mustika, W. The mechanical properties of fly-ash-stabilized sands. Geosciences 2020, 10, 132. [Google Scholar] [CrossRef]
  15. Azaiez, H.; Cherif Taiba, A.; Mahmoudi, Y.; Belkhatir, M. Shear characteristics of fly ash improved sand as an embankment material for road infrastructure purpose. Innov. Infrastruct. Solut. 2021, 6, 148. [Google Scholar] [CrossRef]
  16. Ghadir, P.; Razeghi, H.R. Effects of sodium chloride on the mechanical strength of alkali activated volcanic ash and slag pastes under room and elevated temperatures. Constr. Build. Mater. 2022, 344, 128113. [Google Scholar] [CrossRef]
  17. Samadi, P.; Ghodrati, A.; Ghadir, P.; Javadi, A.A. Effect of seawater on the mechanical strength of geopolymer/cement stabilized sandy soils. In Proceedings of the TMIC 2022 Slope Stability Conference (TMIC 2022), Dordrecht, The Netherlands, 10–13 December 2022; Atlantis Press: Dordrecht, The Netherlands, 2023. [Google Scholar] [CrossRef]
  18. Zumrawi, M.E.M. Stabilization of pavement subgrade by using fly ash activated cement. Am. J. Civ. Eng. Archit. 2015, 3, 218–224. [Google Scholar] [CrossRef]
  19. Kolias, S.; Kasselouri-Rigopoulou, V.; Karahalios, A. Stabilization of clayey soils with high calcium fly ash and cement. Cem. Concr. Compos. 2005, 27, 301–313. [Google Scholar] [CrossRef]
  20. ASTM D2487; Standard Practice for Classification of Soils for Engineering Purposes (Unified Soil Classification System). ASTM International: West Conshohocken, PA, USA, 2017.
  21. ASTM C618; Standard Specification for Coal Fly Ash and Raw or Calcined Natural Pozzolan for Use in Concrete. Annual Book of ASTM Standards: West Conshohocken, PA, USA, 2003.
  22. ASTM D698; Standard Test Methods for Laboratory Compaction Characteristics of Soil Using Standard Effort. ASTM International: West Conshohocken, PA, USA, 2012.
  23. ASTM D3080; Standard Test Method for Direct Shear Test of Soils Under Consolidated Drained Conditions. ASTM International: West Conshohocken, PA, USA, 2011.
  24. Chegenizadeh, A.; Nikraz, H. Shear Test on Reinforced Clay. Adv. Mater. Res. 2011, 250–253, 3223–3227. [Google Scholar] [CrossRef]
  25. Stacho, J.; Sulovska, M.; Slavik, I. Determining the shear strength properties of a soil-geogrid interface using a large-scale direct shear test apparatus. Period. Polytech. Civ. Eng. 2020, 64, 989–998. [Google Scholar] [CrossRef]
  26. ASTM D1883; Standard Test Method for California Bearing Ratio (cbr) of Laboratory-Compacted Soils. ASTM International: West Conshohocken, PA, USA, 2016.
  27. ASTM D5856; Standard Test Method for Measurement of Hydraulic Conductivity of Porous Material Using a Rigid-Wall Compaction Mold Permeameter. ASTM International: West Conshohocken, PA, USA, 2015.
  28. Nithin, S.; Sayida, M.K. Stabilization of silty sand using fly ash and coir fiber. In Proceedings of the Recent Advances in Civil Engineering, Delhi, India, 28–29 December 2012; CUSAT Cochin: Kerala, India, 2012. [Google Scholar]
  29. Prabakar, J.; Dendorkar, N.; Morchhale, R.K. Influence of fly ash on strength behavior of typical soils. Constr. Build. Mater. 2004, 18, 263–267. [Google Scholar] [CrossRef]
  30. Amadi, A.A. Enhancing durability of quarry fines modified black cotton soil subgrade with cement kiln dust stabilization. Transp. Geotech. 2014, 1, 55–61. [Google Scholar] [CrossRef]
  31. Harichane, K.; Ghrici, M.; Kenai, S. Effect of curing time on shear strength of cohesive soils stabilized with combination of lime and natural pozzolana. Int. J. Civ. Eng. 2011, 9, 90–96. [Google Scholar]
  32. Zhou, Y.; Wang, X.; Liang, J. State of the art of fly ash engineering property. J. Civ. Eng. Constr. 2016, 5, 56–73. [Google Scholar]
Figure 1. Grain size distribution of fine sand, cement and fly ash.
Applsci 14 02908 g001
Figure 2. Standard proctor test results of the samples.
Applsci 14 02908 g002
Figure 3. Change in internal friction angles for mixtures.
Applsci 14 02908 g003
Figure 4. Change in cohesion for mixtures.
Applsci 14 02908 g004
Figure 5. CBR test results after 7 and 28 days curing.
Applsci 14 02908 g005
Figure 6. Falling head permeability test results.
Applsci 14 02908 g006
Table 1. Index parameters of fine sand soil.
Soil Classification (USCS)SP
Specific Gravity, Gs2.78
Max. void ratio, emax1.190
Min. void ratio, emin0.626
Max. dry unit weight, γd,max (kN/m3)16.76
Min. dry unit weight, γd,min (kN/m3)12.44
Uniformity coefficient, Cu2.50
Coefficient of curvature, Cc1.20
Effective particle size, D10 (mm)0.52
Table 2. Physical and chemical properties of cement and fly ash.
Physical PropertiesChemical Properties
CementFly AshChemical
Compounds
Cement (%)Fly Ash
(%)
Specific
Gravity
3.042.46SiO225.0829.88
Specific
surface (cm2/g)
42602380Al2O36.2415.03
Fe2O32.906.01
CaO56.4429.28
MgO0.882.27
SO32.3413.34
Na2O0.730.13
K2O0.961.71
Table 3. A list of soil samples prepared for each experiment set.
CodeS. Proctor TestDirect Shear TestCBR TestPermeability Test
SandS6662
Sand + 3% CementS3C6642
Sand + 3% Cement + 5% FAS3C5FA6642
Sand + 3% Cement + 10% FAS3C10FA6642
Sand + 3% Cement + 15% FAS3C15FA6642
Sand + 3% Cement+20% FAS3C20FA6642
Sand + 3% Cement + 25% FAS3C25FA6642
Disclaimer/Publisher’s Note: The statements, opinions and data contained in all publications are solely those of the individual author(s) and contributor(s) and not of MDPI and/or the editor(s). MDPI and/or the editor(s) disclaim responsibility for any injury to people or property resulting from any ideas, methods, instructions or products referred to in the content.

