Article

Adversarial Attacks on Medical Segmentation Model via Transformation of Feature Statistics

1
BK21 Education and Research Center for Artificial Intelligence in Healthcare, Department of Applied Artificial Intelligence, Hanyang University, Ansan 15588, Republic of Korea
2
Department of Applied Artificial Intelligence, Major in Bio Artificial Intelligence, Hanyang University, Ansan 15588, Republic of Korea
3
Division of Gastroenterology and Hepatology, Department of Internal Medicine, Korea University Ansan Hospital, Ansan 15355, Republic of Korea
*
Author to whom correspondence should be addressed.
These authors contributed equally to this work.
Appl. Sci. 2024, 14(6), 2576; https://doi.org/10.3390/app14062576
Submission received: 31 January 2024 / Revised: 9 March 2024 / Accepted: 18 March 2024 / Published: 19 March 2024

Abstract

:
Deep learning-based segmentation models have made a profound impact on medical procedures, with U-Net based computed tomography (CT) segmentation models exhibiting remarkable performance. Yet, even with these advances, these models are found to be vulnerable to adversarial attacks, a problem that equally affects automatic CT segmentation models. Conventional adversarial attacks typically rely on adding noise or perturbations, leading to a compromise between the success rate of the attack and its perceptibility. In this study, we challenge this paradigm and introduce a novel generation of adversarial attacks aimed at deceiving both the target segmentation model and medical practitioners. Our approach aims to deceive a target model by altering the texture statistics of an organ while retaining its shape. We employ a real-time style transfer method, known as the texture reformer, which uses adaptive instance normalization (AdaIN) to change the statistics of an image’s feature.To induce transformation, we modify the AdaIN, which typically aligns the source and target image statistics. Through rigorous experiments, we demonstrate the effectiveness of our approach. Our adversarial samples successfully pass as realistic in blind tests conducted with physicians, surpassing the effectiveness of contemporary techniques. This innovative methodology not only offers a robust tool for benchmarking and validating automated CT segmentation systems but also serves as a potent mechanism for data augmentation, thereby enhancing model generalization. This dual capability significantly bolsters advancements in the field of deep learning-based medical and healthcare segmentation models.

1. Introduction

1.1. Background

Deep learning-based segmentation models have significantly enhanced a variety of medical procedures, including brain tumor detection [1,2], breast cancer screening [3,4], organ segmentation [5,6], and skin lesion analysis [2,7,8]. Furthermore, these models contribute to the synchronized monitoring of medical devices and patients, exemplified by the detection of artificial ventilation usage [9]. U-Net based models, in particular, have shown exemplary performance in the domain of computed tomography (CT) segmentation [5,6,10]. These advanced models, however, are not immune to adversarial attacks [11,12,13], a vulnerability that extends to automatic CT segmentation models as well [14,15,16].

1.2. Limitations of Current Works

Current adversarial attacks frequently involve injecting perturbations or noise [17,18], a method that amplifies the target model’s loss by manipulating the image gradients. However, this approach presents a notable trade-off between successful deception and perceptibility of alterations. Specifically, existing approaches manually control the perturbation size, often denoted as step size [17,18,19]. Goodfellow et al. [17] introduced a one-step attack that applies the perturbation directly to the original image, whereas Kurakin et al. [18] applied the perturbation iteratively. Although these methods attempt to limit the perturbation size, the induced noise increases and eventually becomes perceptible, aiming to enhance the attack success rate. Additionally, Qi et al. [19] proposed to regularize the noise using a Gaussian kernel during the generation of adversarial images. However, this method still suffers from the trade-off between perceptibility and attack success rate. This is visually depicted in Figure 1. While an unaltered CT image (Figure 1a) seamlessly integrates with the automatic segmentation system, an adversarial sample introduced by an intruder (Figure 1b) may be easily spotted by a medical professional due to the conspicuous noise. Thus, the earlier methods focusing on noise addition prove insufficient for benchmarking automatic segmentation systems. To address this, our goal is to pioneer a novel class of adversarial attacks that can effectively mislead both the target segmentation model and the medical practitioners.

1.3. Overview of Proposed Method

CT images are a valuable diagnostic tool, derived from processing X-ray scans of a patient’s body. These images offer crucial organ-related information, thanks to the CT scanner’s ability to produce cross-sectional images using rotating X-ray tubes [20]. In our research, we delve into scenarios where diagnostic decisions are predominantly driven by the organ’s shape rather than its texture. Our proposed method aims to confuse the target model by intentionally transforming the feature statistics, while leaving its shape unaltered. We leverage a texture reformer [21], a real-time style transfer technique that utilizes adaptive instance normalization (AdaIN) to modify an image’s texture. As AdaIN is designed to align the source and target image distributions, we tweak it to intentionally transform the statistics. Our experimental findings affirm that our adversarial samples convincingly passed as genuine in blind tests with physicians. In addition, the experiment demonstrates that our method can be utilized for data augmentation to enhance model generalization. We anticipate that our proposed method can be a potent addition to the tools used for benchmark testing and contribute substantially towards validating automatic CT segmentation systems.
Our contributions are summarized as follows: We present a novel generation of adversarial attacks designed for medical applications, focusing on transforming the feature statistics of the target image, in contrast to traditional noise addition techniques.
Following our main contribution, our rigorous experiments demonstrate that medical practitioners perceive our adversarial samples as more realistic compared to those generated by existing state-of-the-art methods. Additionally, our technique can be applied for data augmentation, thereby improving model generalization.

2. Proposed Methods

2.1. Problem Statement

In this study, we focus on a deep learning-based segmentation model tailored for analyzing computed tomography (CT) images and their associated organ segmentations. Our primary objective is to generate adversarial examples that successfully deceive the model into making incorrect segmentation predictions. Specifically, the model processes CT images, which comprise continuous pixel values that not only delineate organ boundaries but also represent the distinct characteristics of each organ. These segmentations are represented by integer values that correspond to different organ segments, maintaining the same dimensions as the original CT images. Our foremost aim is to create highly realistic adversarial examples that lead the model to misclassify organ segments. Additionally, we aim to utilize these adversarial examples to improve the performance of the target model as a form of data augmentation.

2.2. Generating Adversarial Images Using Transformation Statistics of Features

Our method for generating adversarial samples is predicated on transforming the statistics of the target organ such that it appears different to the segmentation model, resulting in misclassification of the organ. This concept can be actualized through style transfer, a technique used for transfer the texture from its original domain to a different one. Accordingly, we incorporate a texture transfer system in our approach. In the following part of this subsection, we will discuss the foundational components of our methodology, which are built upon adaptive instance normalization (AdaIN) [22] and the texture reformer [21].

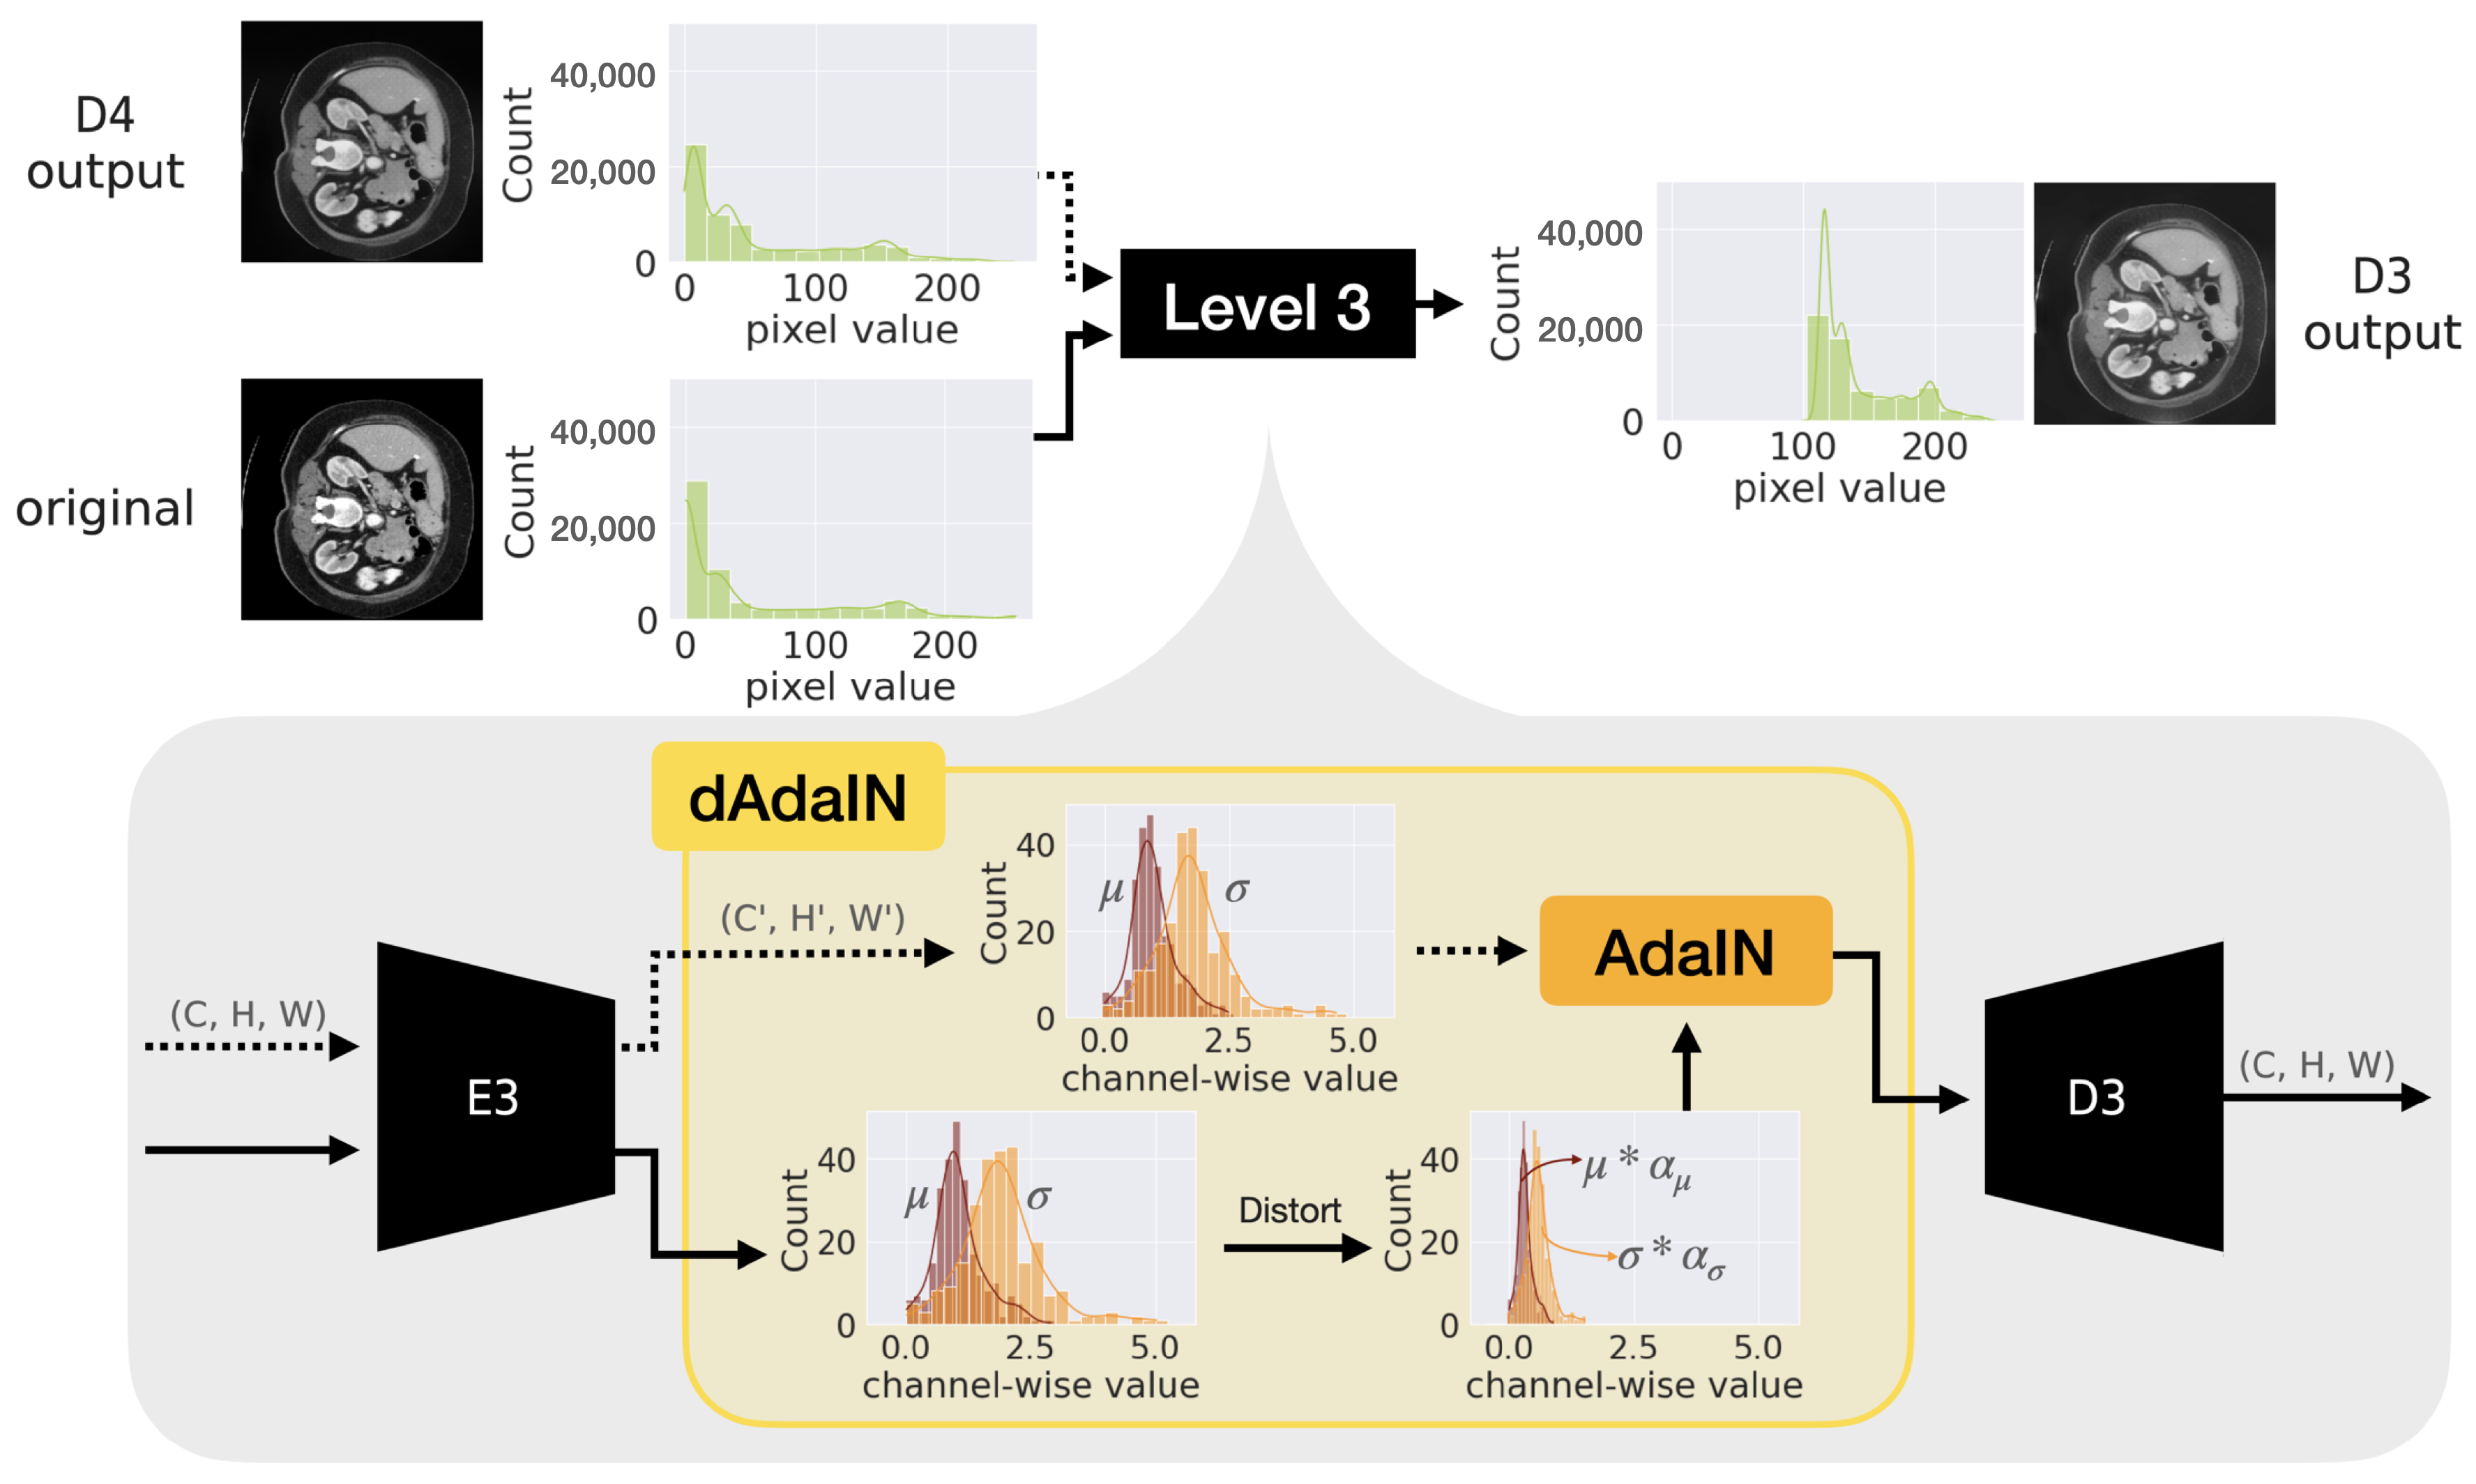
2.3. Generation of Adversarial Sample Using Dynamic Adaptive Instance Normalization

AdaIN has been proposed to align the mean and standard deviations of the feature statistics from the source and target images, respectively [22]. AdaIN can be formulated as follows.
AdaIN ( f t , f s ) = σ ( f t ) f s μ ( f s ) σ ( f s ) + μ ( f t )
where f t and f s represent the feature statistics of the target and source samples, respectively, while μ and σ denote the mean and standard deviation (SD), respectively.
The formula indicates that the source features undergo standard normalization using its own mean μ ( f s ) and standard deviation σ ( f s ) , and subsequently become unnormalized using μ ( f t ) and σ ( f t ) derived from the target input features. As such, AdaIN does not require learning any parameters during model training. Rather, its computation occurs solely during inference, thereby enabling rapid style transfer without the need for predefined styles [21,22]. For these reasons, AdaIN is widely employed in various style transfer models [21,23,24,25].
Given the challenge of predicting the feature statistics of an adversarial sample before its creation, we propose a method influenced by AdaIN for the targeted adjustment of input feature statistics. We designate this method as dAdaIN (Dynamic Adaptive Instance Normalization), which facilitates the manual selection of suitable transformation factors. These factors are chosen based on human judgment to balance the adversarial impact with the authenticity of the generated samples. It is important to note that while an intruder can assess the extent to which the adversarial sample deceives the model and evaluate its visual realism, expertise in CT imaging is not a prerequisite. The transformation of feature statistics in this study is defined as follows:
dAdaIN ( f x , f x a d v ) = α σ · σ ( f x ) f x a d v μ ( f x a d v ) σ ( f x a d v ) + α μ · μ ( f x )
where f x and f x a d v represent the features of the target image and the adversarial sample, respectively. The parameters α μ and α σ are transformation factors for the mean and standard deviation (SD), respectively, with α μ = 1 and α σ = 1 preserving the original statistics. It is worth noting that since the features of the adversarial sample cannot be predetermined, f x = f x a d v . However, as these identical features are fed into different branches of the encoder structure, as detailed in the remainder of this subsection, we differentiate the terms as described. For example, we demonstrate the transformation of the target feature’s statistics in the yellow box shown in Figure 2. Between the encoder and decoder, the statistics of features denoted f x and f x a d v undergo transformation using Equation (2) as illustrated in the figure’s lower diagram. In the diagram, the brown and orange bars represent the mean values and standard deviation (SD) values for each feature channel, respectively.
Although AdaIN accomplishes high performance for style transfer, plugging it in any encoder-decoder structure does not guarantee it will generate realistic adversarial images to fool a segmentation model as well as physicians. Therefore, we consider the state-of-the-art style transfer model which is the texture reformer [21]. The texture reformer is a patch-based style transfer model which receives two pairs of the image and associated segment to be the source and the target.
Since our main goal is not the style transfer but the transforming statistics of features, our modified texture reformer accepts only a pair of original CT images and associated segment. While the original CT image is given to source image and target image, the associated segment image is given to the source segment and target segment as well. The insertions of them are depicted as the black line and the green line, respectively in Figure 3.
As shown in Figure 3, the first two levels of encoder-decoder which include blue blocks, generate a realistic image considering aspects of global information and local information using View-Specific Texture Reformation (VSTR) [21]. In the final three levels of encoder-decoder which have yellow blocks also in the figure, the modified texture reformers create images from the transformed features using dAdaIN. However, since the use of modified texture reformers with dAdaIN can still produce images with artifacts or unusual brightness, we introduce pre-processing and post-processing methods. These methods are detailed in the following sections and are applied to the first two encoder-decoder pairs numbered 5 and 4 as well as shiftDist (purple box) components, respectively, in Figure 3.

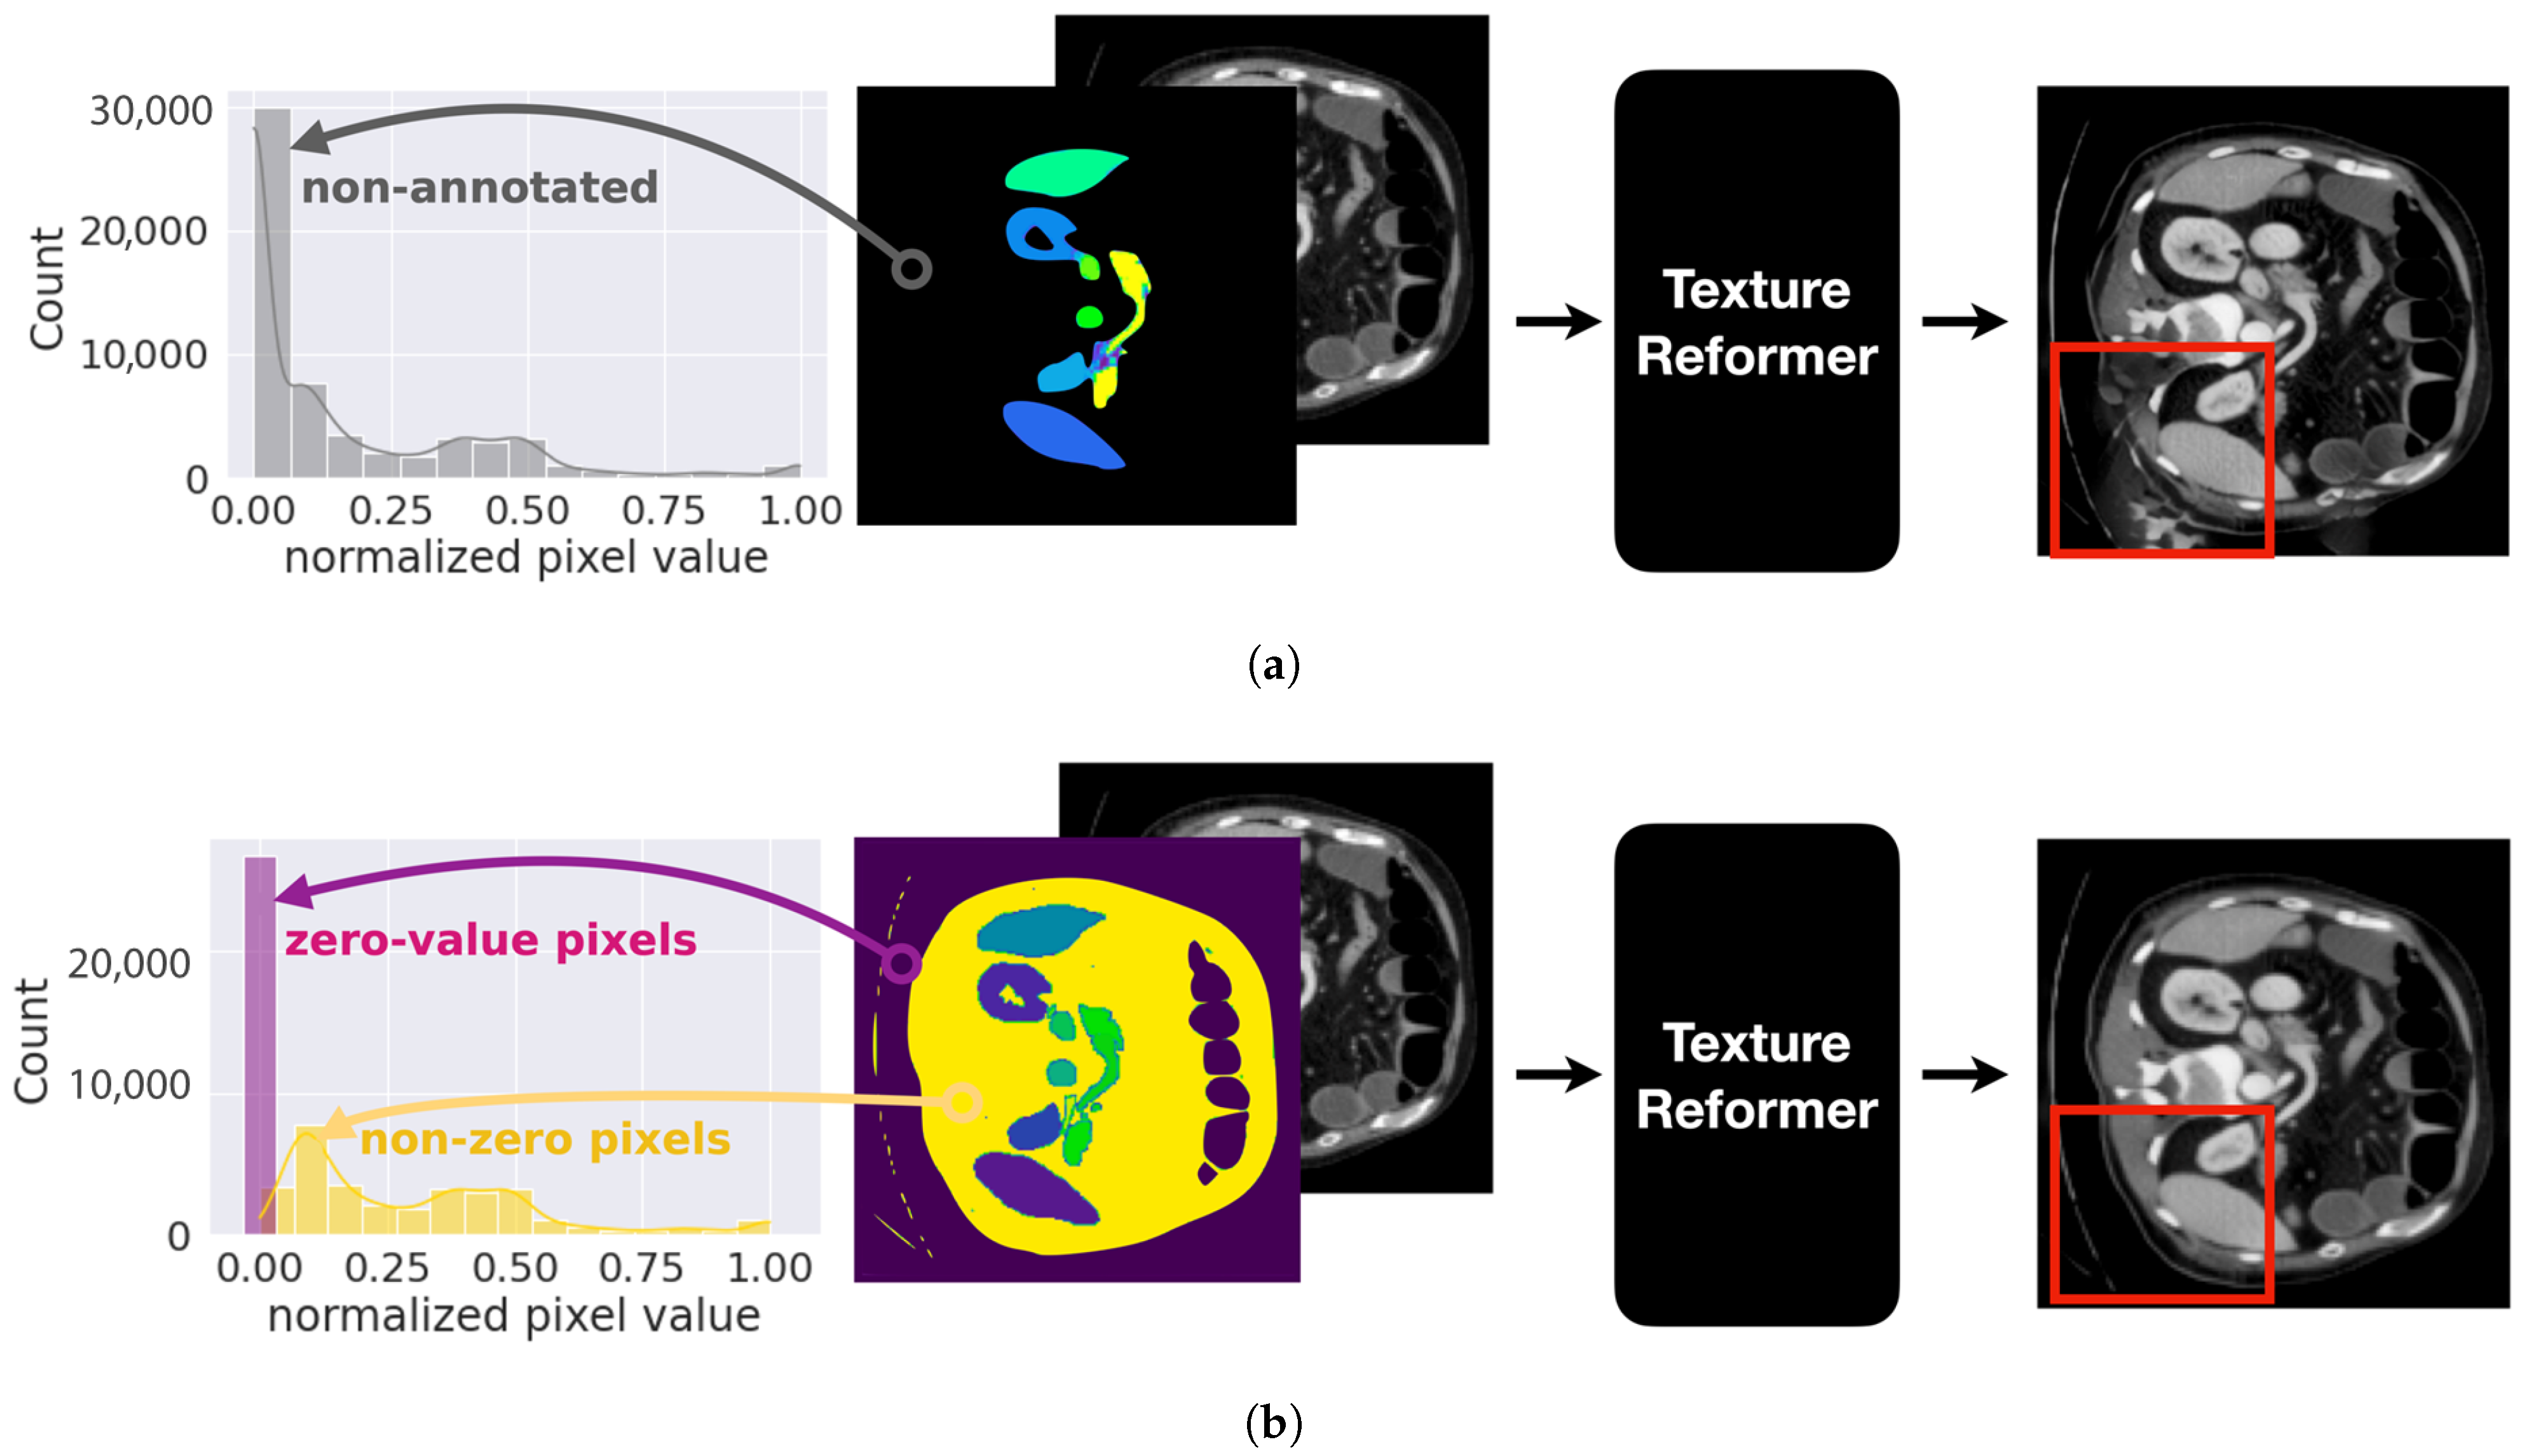
2.3.1. Pre-Processing to Stabilize Statistics of Pixels of Organs

In spite of the fact that the texture reformer outperforms the encoder-decoder structured style transfer methods, there is a challenge caused by VSTR when applied to our problem. Since VSTR modules (depicted as blue blocks in Figure 3) consider the aspects of global information and local information simultaneously, the skewed distribution of the image causes a negative impact on the process, particularly affecting the encoder-decoder pairs numbered 5 and 4 in the figure.
We plot histograms of pixel values which are segmented into a non-annotated organ in Figure 4. In the figure, the black region represents the non-annotated organ in Figure 4a and the gray bars indicate the distribution with respect to pixel values. As shown in the figure, the pixel values are very skewed. Therefore, the texture reformer generates visual artifacts as depicted in the red box.
To overcome this problem, we separate the non-annotated region into zero value pixels and non-zero value pixels as appears in the purple region and the yellow region, respectively. We plot the histograms of pixel values for each region in Figure 4b. As we can see in the red box, the generated adversarial sample is realistic without visual artifacts.

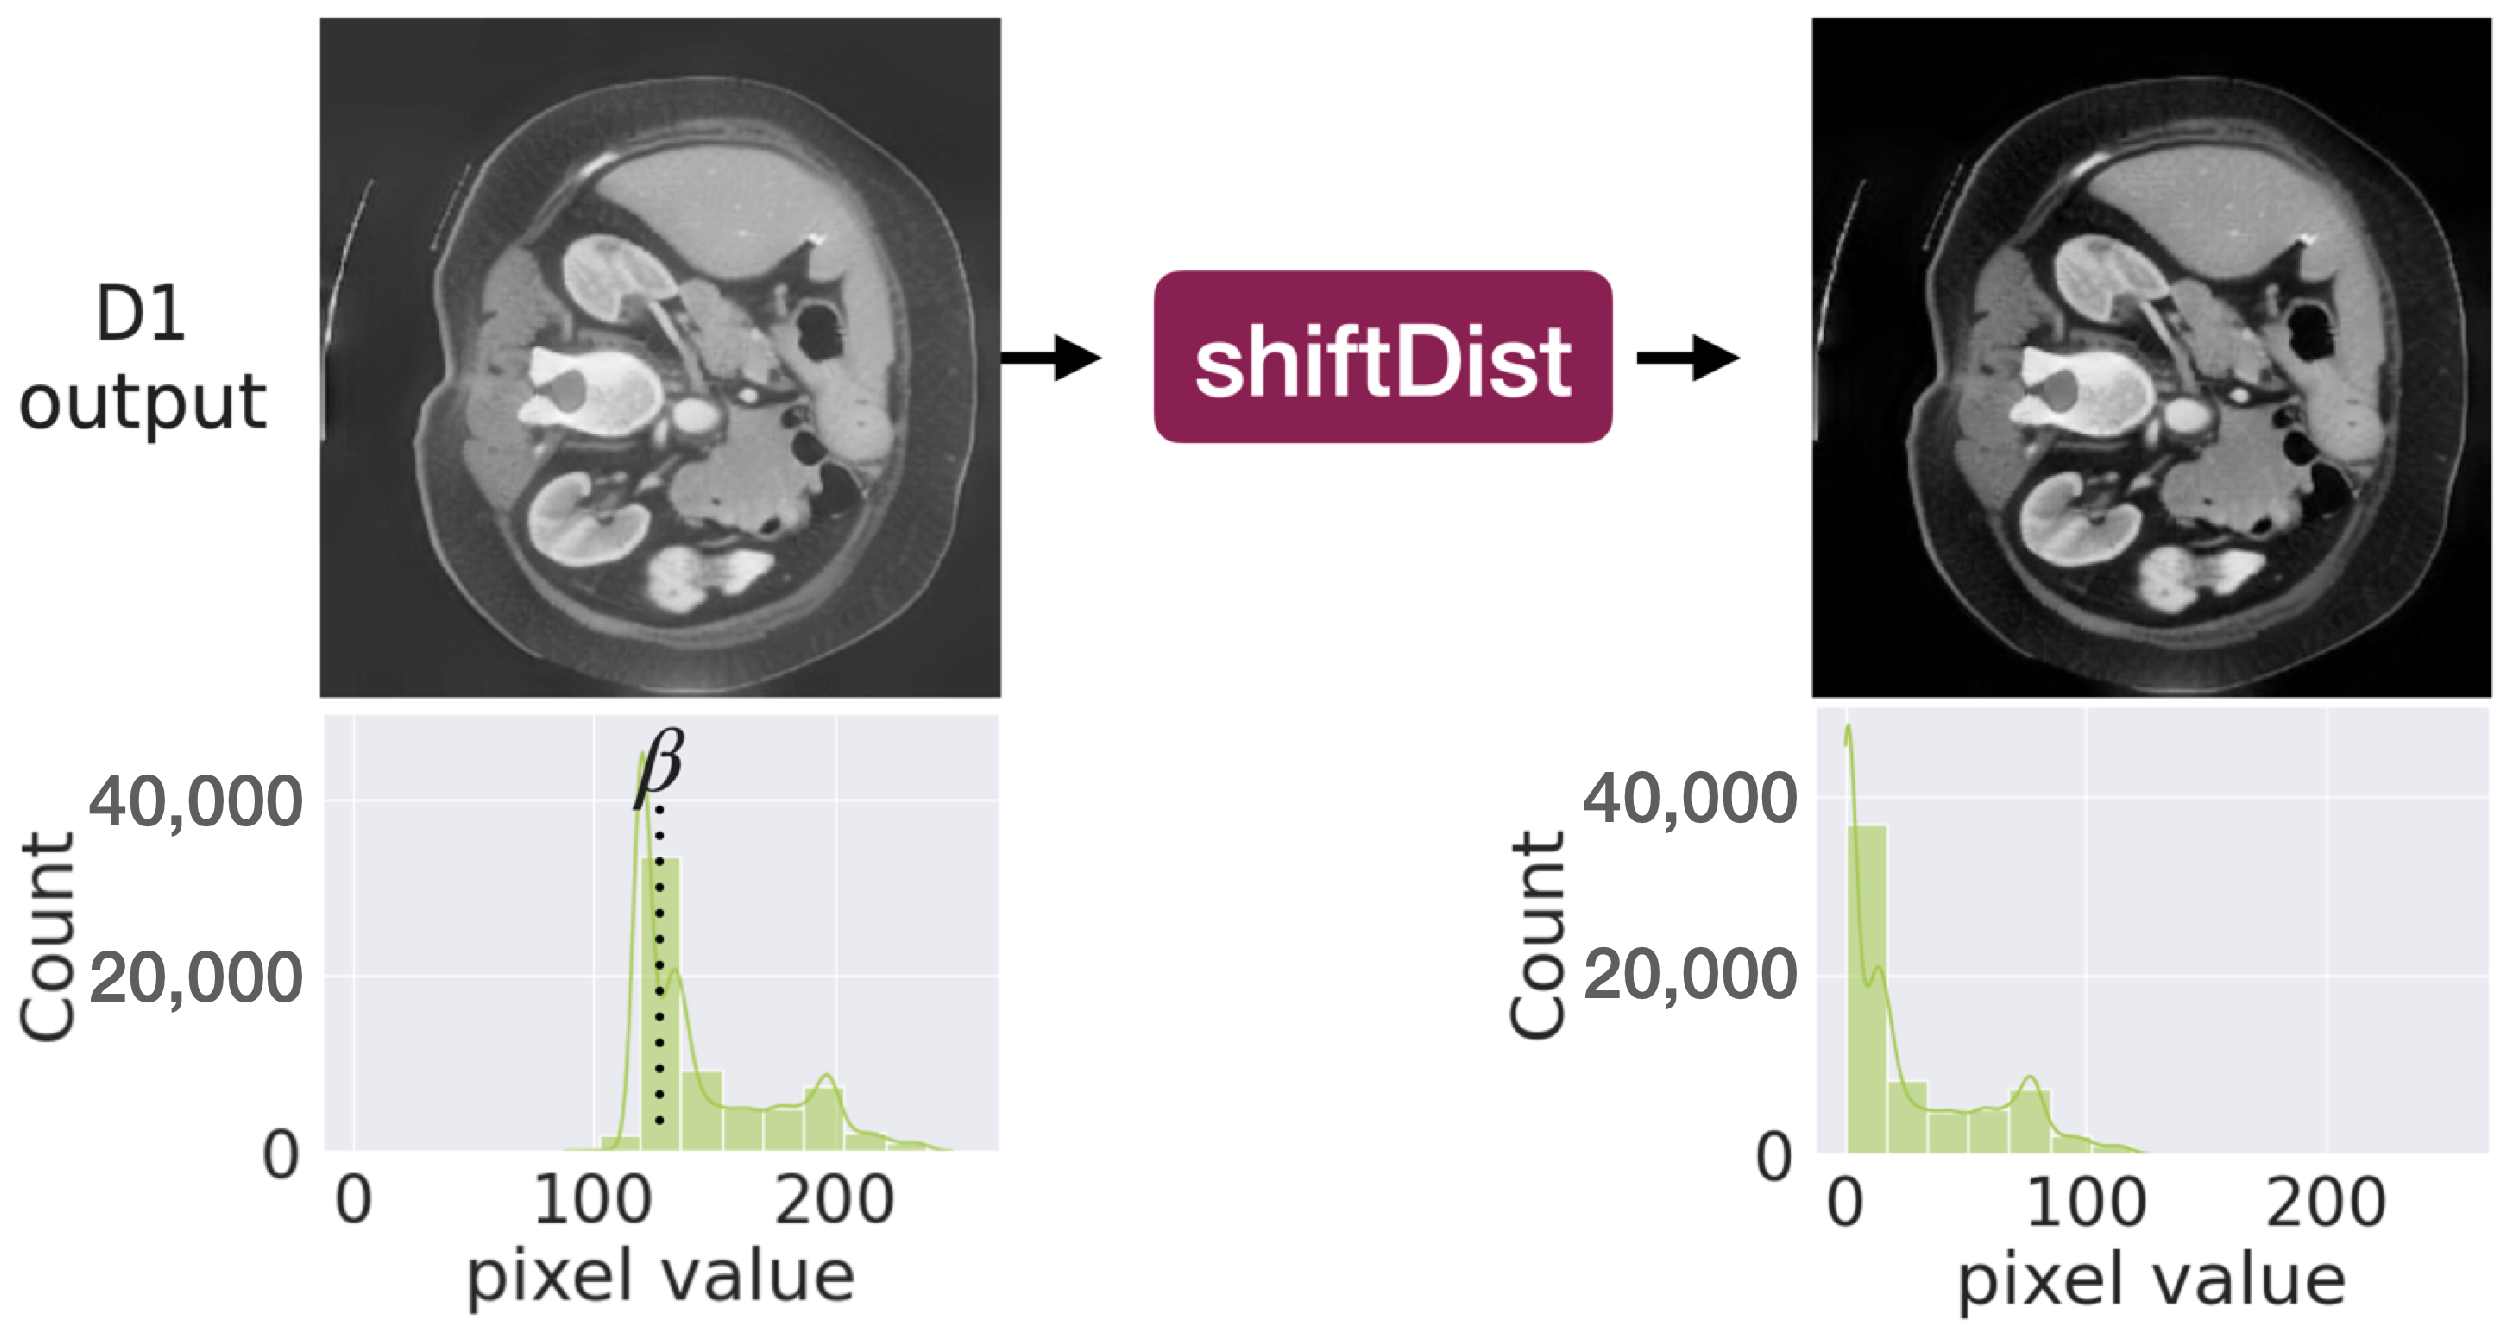
2.3.2. Post-Processing to Generate Realistic Image

In addition, the distribution of the generated image is also moved from the original CT image which is pictured as green bars in Figure 2. Therefore, the generated image is brighter than the original one.
To address this problem, we adjust the image by shifting the distribution named shiftDist as defined below.
shiftDist ( x a d v ) = | x a d v β |
where β is an adjustment parameter and it is designed to darken the image. The adjustment parameter is calculated as the difference between the zero-value pixel regions, which represents the background of the CT image, in both the original and generated images.
Figure 5 presents an illustrative example of this adjustment, where the output from the final decoder, D1, is overly bright. β is specifically determined by the pixel values in the background region, ensuring that it reflects actual background characteristics rather than being arbitrarily chosen based on the lowest pixel value, a common practice in min-max rescaling techniques.
Subsequently, any negative pixel values that emerge from the shiftDist operation are adjusted to zero, maintaining the integrity of the image’s visual quality. This adjustment not only preserves the original quality but also enhances it, as demonstrated with shiftDist (purple box) in Figure 3 and Figure 5.

3. Experiments

All experiments in this work were conducted on a workstation equipped with an AMD Ryzen 7 3700X 3.6 GHz processor, 16 GB of main memory, and an NVIDIA GeForce RTX 3080 GPU card. Furthermore, the implementations for these experiments were carried out using PyTorch 2.0 [26] in Python 3.9. The remainder of this section offers a detailed description of the datasets and methods implemented, along with extensive experiments validated by medical professionals, limitations, potential applications, and a case study.

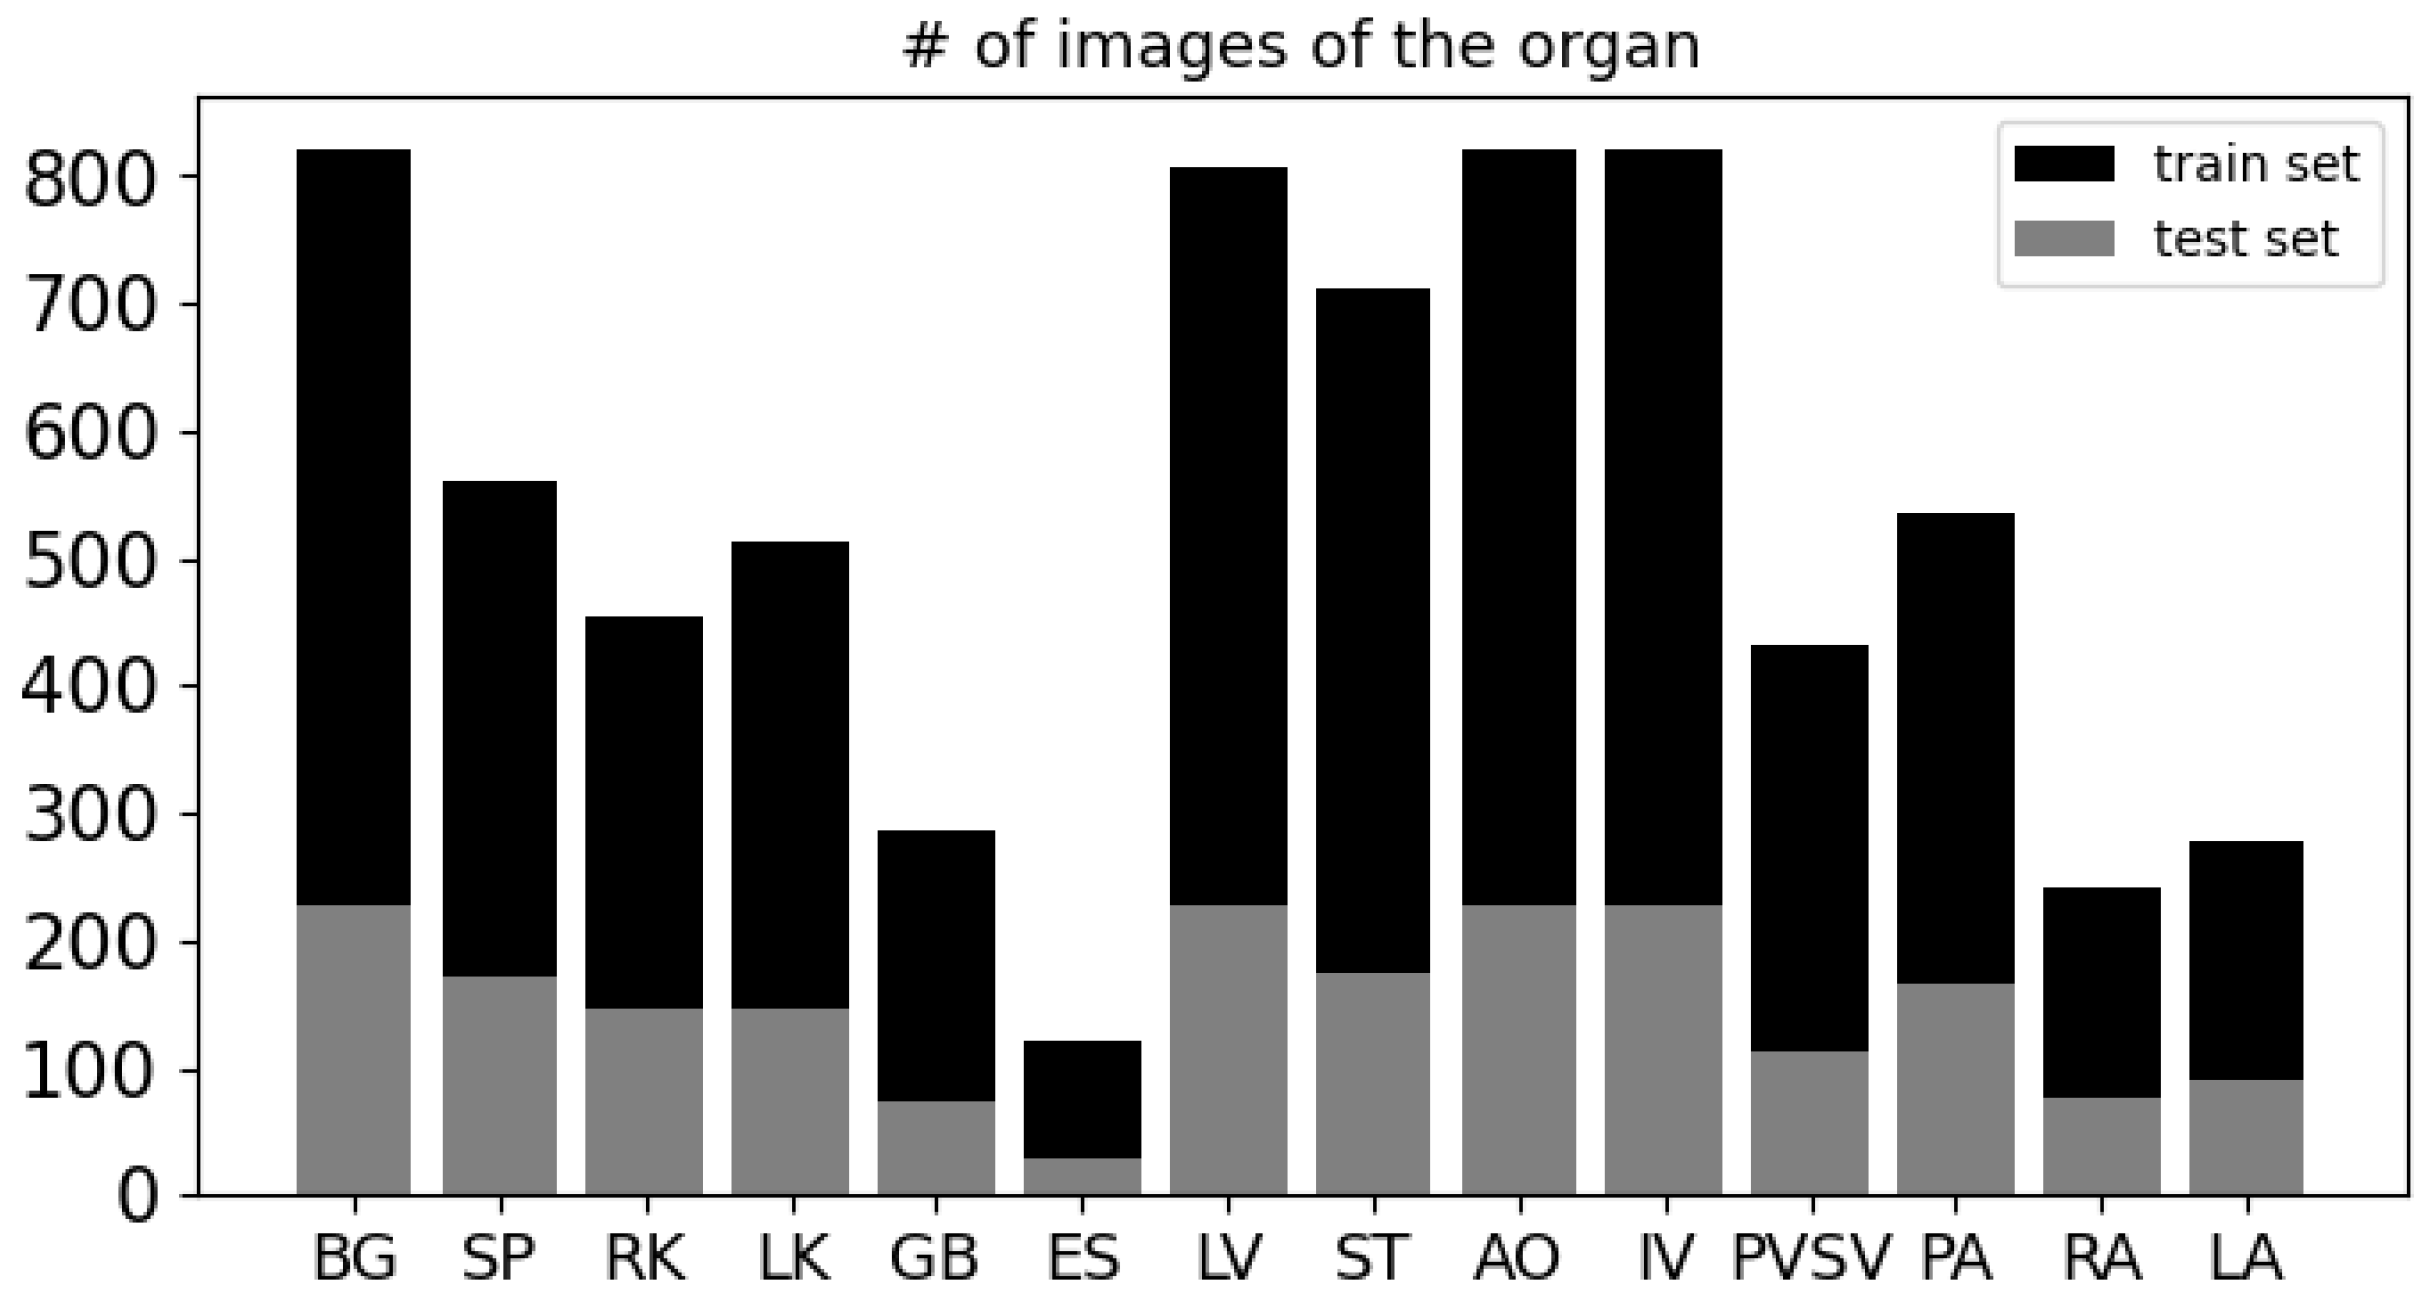
3.1. Data Description and Preprocessing

We downloaded organ data publicly accessible from the “Multi-Atlas Labeling Beyond the Cranial Vault—Workshop and Challenge” (BTCV) dataset [27]. The dataset was compiled with the objective of developing efficient segmentation algorithms and was gathered during a workshop and challenge hosted by MICCAI in 2015. It comprises 50 abdominal CT scans, collected under the supervision of an Institutional Review Board. BTCV labeled the following organs: spleen, right kidney, left kidney, gallbladder, esophagus, liver, stomach, aorta, inferior vena cava, portal vein and splenic vein, pancreas, right adrenal gland, left adrenal gland as well as non-annotated organs. Abbreviations for these organs are as follows: SP for spleen, RK for right kidney, LK for left kidney, GB for gallbladder, ES for esophagus, LV for liver, ST for stomach, AO for aorta, IV for inferior vena cava, PVSV for portal vein and splenic vein, PA for pancreas, RA for right adrenal gland, LA for left adrenal gland, and BG for non-annotated areas.
We clip pixel values of CT images in the range from −135 to 215. In addition, we normalize pixel values and resize them to 256 × 256. We split 75% and 25% for training and test sets by patient. Because there is no image which has all organs at the same time, we select images which have more than seven organs. Consequently, we acquire 821 images for training and 228 images for testing. In Figure 6, we present a plot showing the count of images corresponding to each organ. As illustrated in the figure, the background appears (BG) in all 821 images in the training set. In contrast, the esophagus (ES) appears in only 120 images, and the two adrenal glands (RA and LA) appear in 242 and 279 images, respectively.

3.2. Implemented Models

3.2.1. Implemented Target Model

Our target which is a segmentation model is U-Net [28] which shows outstanding performance of CT segmentation [5,6,10]. The model features a stacked encoder-decoder architecture enhanced with skip connections. Following the design outlined in the original U-Net paper, we employ four encoders and an equal number of decoders, adhering to the hyper-parameters specified in the foundational work. The model undergoes training using the dataset detailed in Section 3.1. We trained 200 epochs with the 16 batch size, using the AdamW optimizer [29] and the learning rate is 0.0001. Moreover, we set the loss function to minimize the combination of cross entropy and dice loss between the true segmentation and the predicted segmentation.

3.2.2. Implemented Attack Methods

We compare our method with existing adversarial attack methods that are most commonly used in automated medical image diagnosis [30]: the fast gradient sign method (FGSM) [17], basic iterative method (BIM) [18] and stabilized medical image attacks (SMIA) [19]. We have implemented these adversarial methods for the comparison. The concepts for the models are outlined as follows:
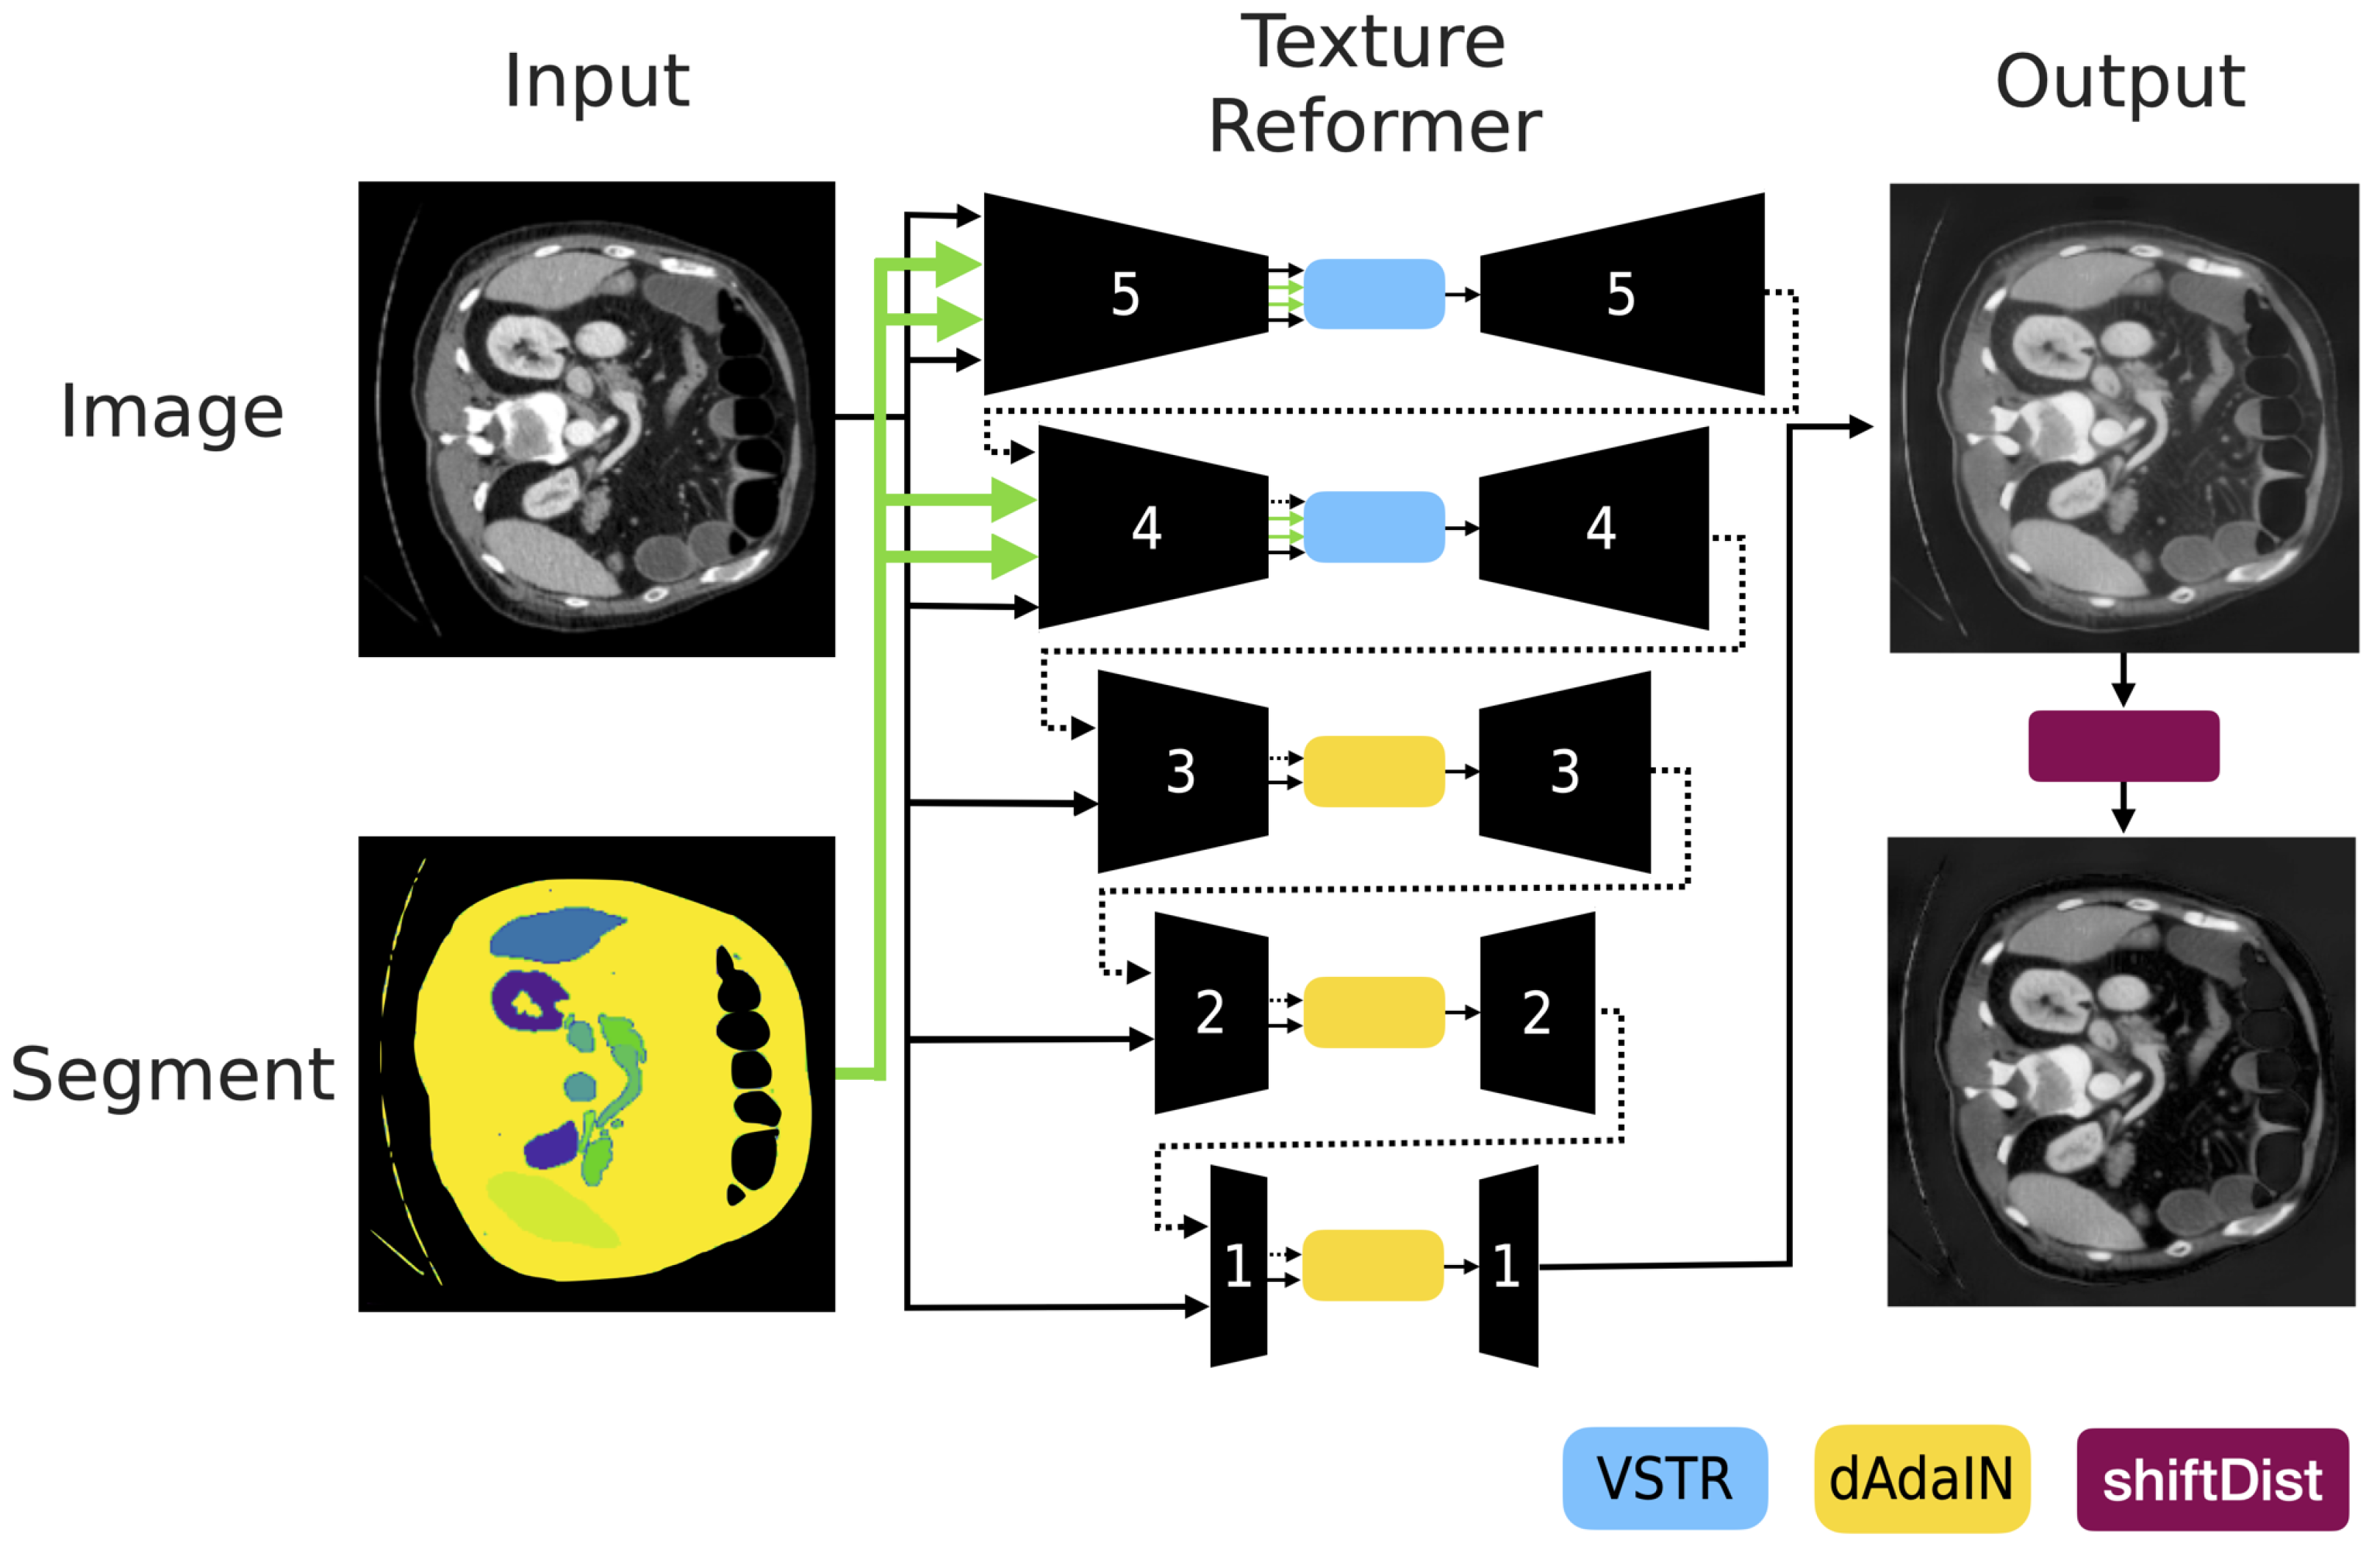
  • Our attack method: We adopt the structure of the texture reformer [21] as depicted in Figure 3 and we reimplement the final three levels to transform the statistics as described in Equation (2). The model is based on stacked autoencoders. It contains the five separate encoder-decoder components. Encoder layers consist of convolutional layers similarly VGG19 [31] to extract features from the source image. Decoder layers are structured as flipped encoders using the nearest neighbor interpolation to generate the target image. We exploit open source and pre-trained weights provided by the official implementation (https://github.com/EndyWon/Texture-Reformer, accessed on 25 July 2022). The source code for our framework is available at https://github.com/hyerica-bdml/adversarial-attack-transformation-statistics (accessed on 17 March 2024).
  • FGSM: It calculates gradients given input image x and corresponding class y. The gradients act as a direction for maximizing the loss function J of the target model. The direction is added into original image x to generate the adversarial sample x a d v . We formulate the attack as below:
    x a d v = x + ϵ · sign x J ( x , y )
    where ϵ is the step size.
  • BIM: It is an iterative method while FGSM is a one-step method. The difference is that BIM maximizes the loss repetitively (for instance, K times) and adds stacks of the gradients x a d v i to the original image. BIM is defined as the following equation for our problem:
    x a d v i + 1 = π x a d v i + 1 K x J ( x a d v i , y )
    where initial x a d v 0 is the input image x and π is the clipping function to avoid exceeding pixel values in the range from x ϵ to x + ϵ .
  • SMIA: It is specialized to fool models in only the medical domain whereas FGSM and BIM are for general purposes. Unlike how those models produce noisy results, SMIA reduces noise. The key idea is that while adversarial samples tend to be noisy, SMIA adds a stabilization function into the loss function to force the noisy sample close to the blurred sample obtained by a Gaussian kernel. The stabilization loss for maximization is formulated for our problem as follows:
    L = L M ( x a d v ) , y α · L M ( x a d v ) , M ( x + W * η )
    where W is the Gaussian kernel to convolutional operation with the perturbation noise η ( = x a d v x ) and α is the scalar balancing factor for the loss terms.

3.3. Evaluation Metric

The performance of the target model is evaluated using the Dice score in this study. This metric quantifies the degree of overlap between the predicted region and the actual or ground truth region. The metric is calculated as follows:
D i c e S c o r e = 2 ( P G ) | P | + | G |
Here, P and G stand for the predicted and ground truth regions, respectively, while | · | represents the size of the region. According to the definition of this metric, a score of 1 indicates the best performance of the segmentation model, whereas a score of 0 indicates the poorest performance. It is noteworthy that the main objective of an adversarial attack is to reduce the Dice score.

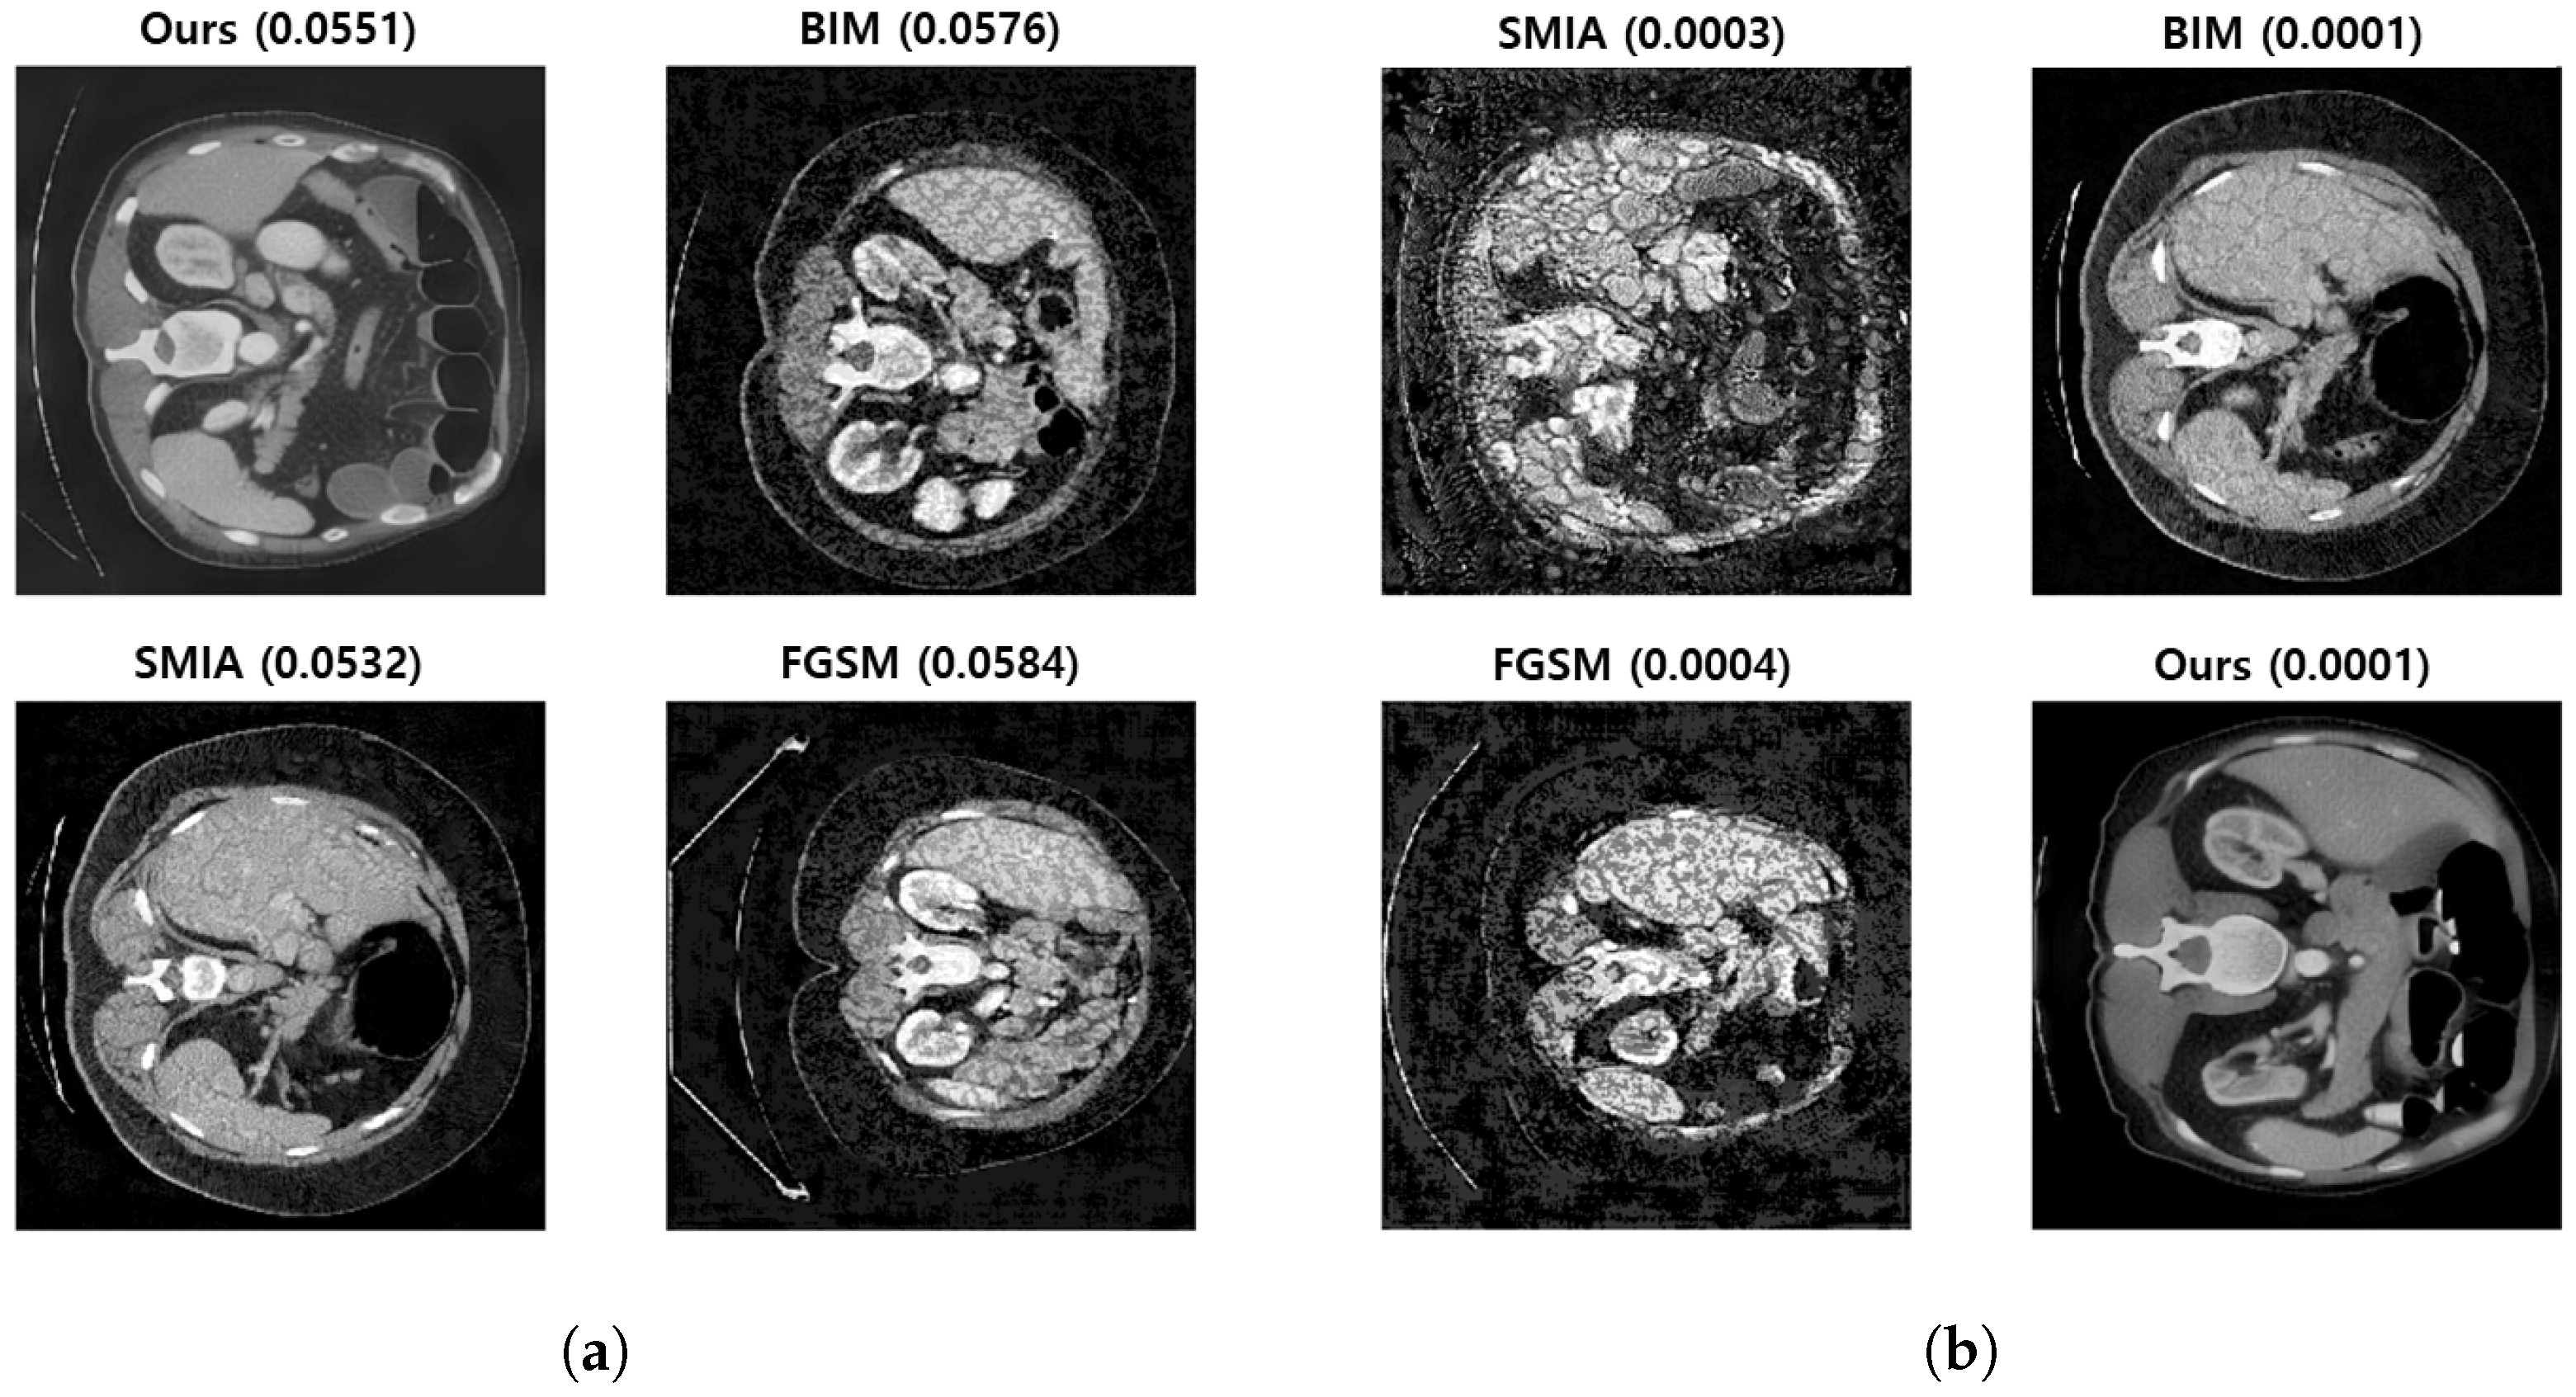
3.4. Qualitative Evaluation by Physicians

We train the target model based on U-Net, as detailed in Section 3.2.1. This yields a target model with a Dice score of 0.4524. We then create adversarial samples using FGSM, BIM, SMIA, and our method, using these to attack the target model.
For qualitative evaluation, we assess whether our method generates realistic images that both fool the target model and deceive physicians. We curated a set of 50 questions featuring adversarial samples from the proposed method in this work and the baselines, asking the question: “Which among the four adversarial images appears most like the genuine one?” Given the trade-off between attack success rate and perceptibility identified in prior research, we have deliberately selected a success rate range that navigates between barely perceptible attacks (with a Dice score of 0.03, which can be challenging to detect at a glance) and highly effective, yet clearly noticeable attacks (indicated by a Dice score of 0.001). Consequently, each question was accompanied by four different adversarial images, one from each method, with Dice scores controlled within the range of 0.001 to 0.03. For fair comparisons, we randomly selected adversarial images generated by the baseline methods, ensuring they all fell within the same range of Dice scores.
Figure 7 presents random samples of two questions. As evident in the figure, the Dice scores across the methods have been maintained at similar levels. The order of the images was randomly altered for each question and the corresponding Dice scores were hidden.
Two medical doctors participated in this blind test, selecting our images as genuine 26 and 47 times, respectively, out of the 50 questions that were randomly shuffled.
We conducted a binomial test to statistically validate these results. This choice was made because each question offers a discrete outcome whether an image is selected as the most realistic or not. Furthermore, the number of questions is fixed at 50 for each doctor, and the probability of randomly selecting any one image as the most realistic is consistently 0.25.
We defined our hypotheses as follows:
  • Null hypothesis: The adversarial images produced by our method are no more convincingly realistic than those produced by other methods.
  • Alternative hypothesis: The adversarial images produced by our method are significantly more convincing in their resemblance to real images than those produced by other methods.
We set the significance level at 5 % , adhering to conventional standards. Given that each doctor was presented with 50 questions, and the selections favoring our images numbered 26 and 47, respectively, we proceeded with the analysis. Considering the expected ratio of 0.25 for random selections, the calculated p-values were 4.80 × 10 5 and 4.26 × 10 25 . Based on these results, we reject the null hypothesis and conclude that our method produces adversarial samples that are significantly more convincingly realistic than those generated by competing methods.

3.5. Limitations and Comparative Analysis
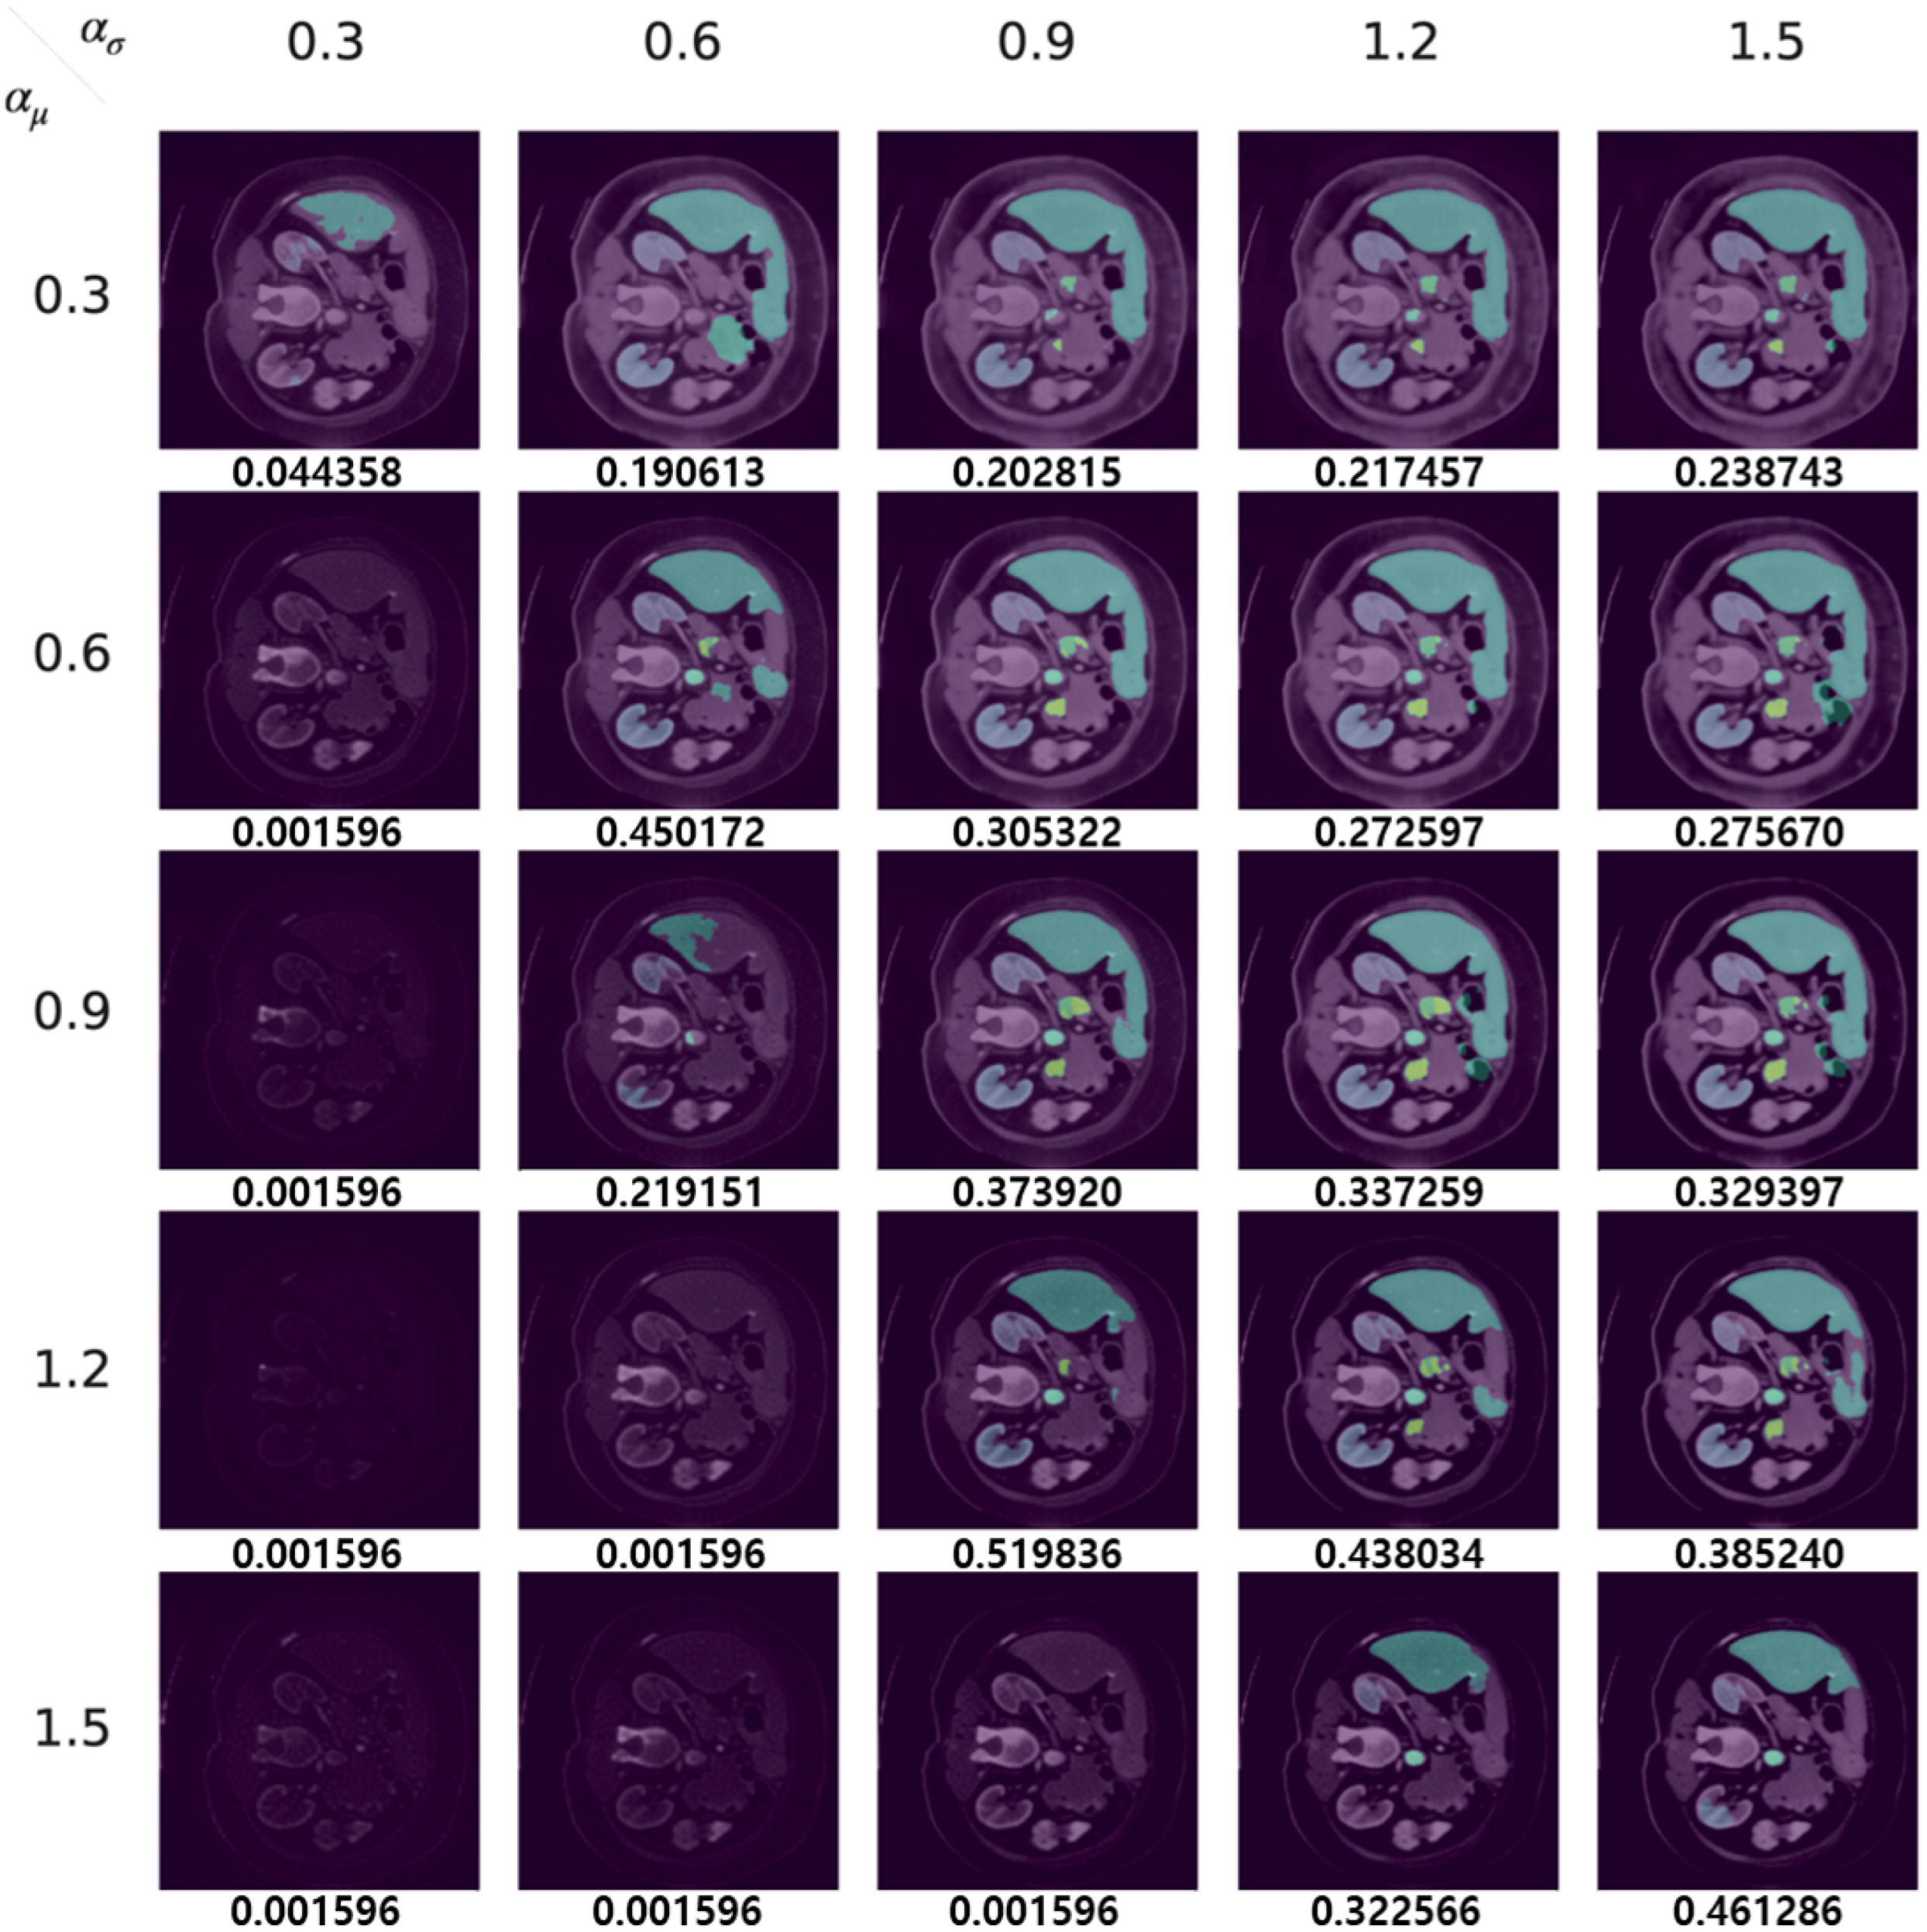
In this section, we delve into the limitations of our method, discuss the underlying reasons for these limitations, and present samples to compare our outcomes with the established baselines.
Figure 8 shows instances where our method encountered some issues, specifically white noise, blurring, and darkening. For example in Figure 8a, the images we generated tend to be blurry and darker. Furthermore, as seen in Figure 8b, our image shows white noise at the bottom, which is absent in the original.
We attribute these issues to the following causes:
  • Some values of transformation factors α μ and α σ tend to create darker samples. By adopting factor values less than 1, the transformed features contribute to a restored image with higher pixel values and smaller variance compared to the input image. This results in a final image adjusted by shiftDist that is darker than the original.
  • The instances of white noise and blurring appear to stem from the high variance seen in the non-zero pixel values in regions that were not annotated, as evidenced by the yellow bars in the histogram in Figure 4b. This leads the VSTR modules of the texture reformer to blend the pixel values of the bone and the organ.
Despite these limitations, our method has proven effective in producing image differences that are less noticeable to physicians compared to the baselines. As illustrated via randomly selected samples in Figure 9, when Dice scores are kept constant for adversarial samples (for each row excluding the original image in the first column), samples generated by our method are less perceptible, while the baselines tend to display noticeable noise.

3.6. Application of the Proposed Method: Data Augmentation

In this section, we explore the potential uses of our proposed method for data augmentation. To evaluate data augmentation effectiveness, we increased the size of the dataset by 25% during the model training phase by adding new samples to the original training set. These additional samples are randomly generated, their α μ and α σ values adhering to the ( 0.9 , 1.1 ) range as specified in Equation (2). This augmentation strategy yields an improvement in the Dice score: it climbs from an initial score of 0.4524 to an improved score of 0.4819.
As demonstrated in Table 1, our method significantly enhances the model’s generalization capabilities, particularly evident in segmenting the esophagus (ES), inferior vena cava (IV), and both adrenal glands (RA and LA). Models trained with our data augmentation approach exhibit improved segmentation for these organs. Notably, for the ES, RA, and LA, models trained without data augmentation fail to segment these organs entirely. As previously mentioned in Section 3.1, the training set comprises only 120, 242, and 279 images featuring the ES, RA, and LA, respectively, out of a total of 821 images. Furthermore, it was noted that the pixel count representing these organs in each image is relatively low in the original dataset. Nonetheless, our data augmentation method successfully increases the variability of pixel representation for these organs, addressing the issue of limited data availability that was previously hindering the segmentation model’s learning efficacy.

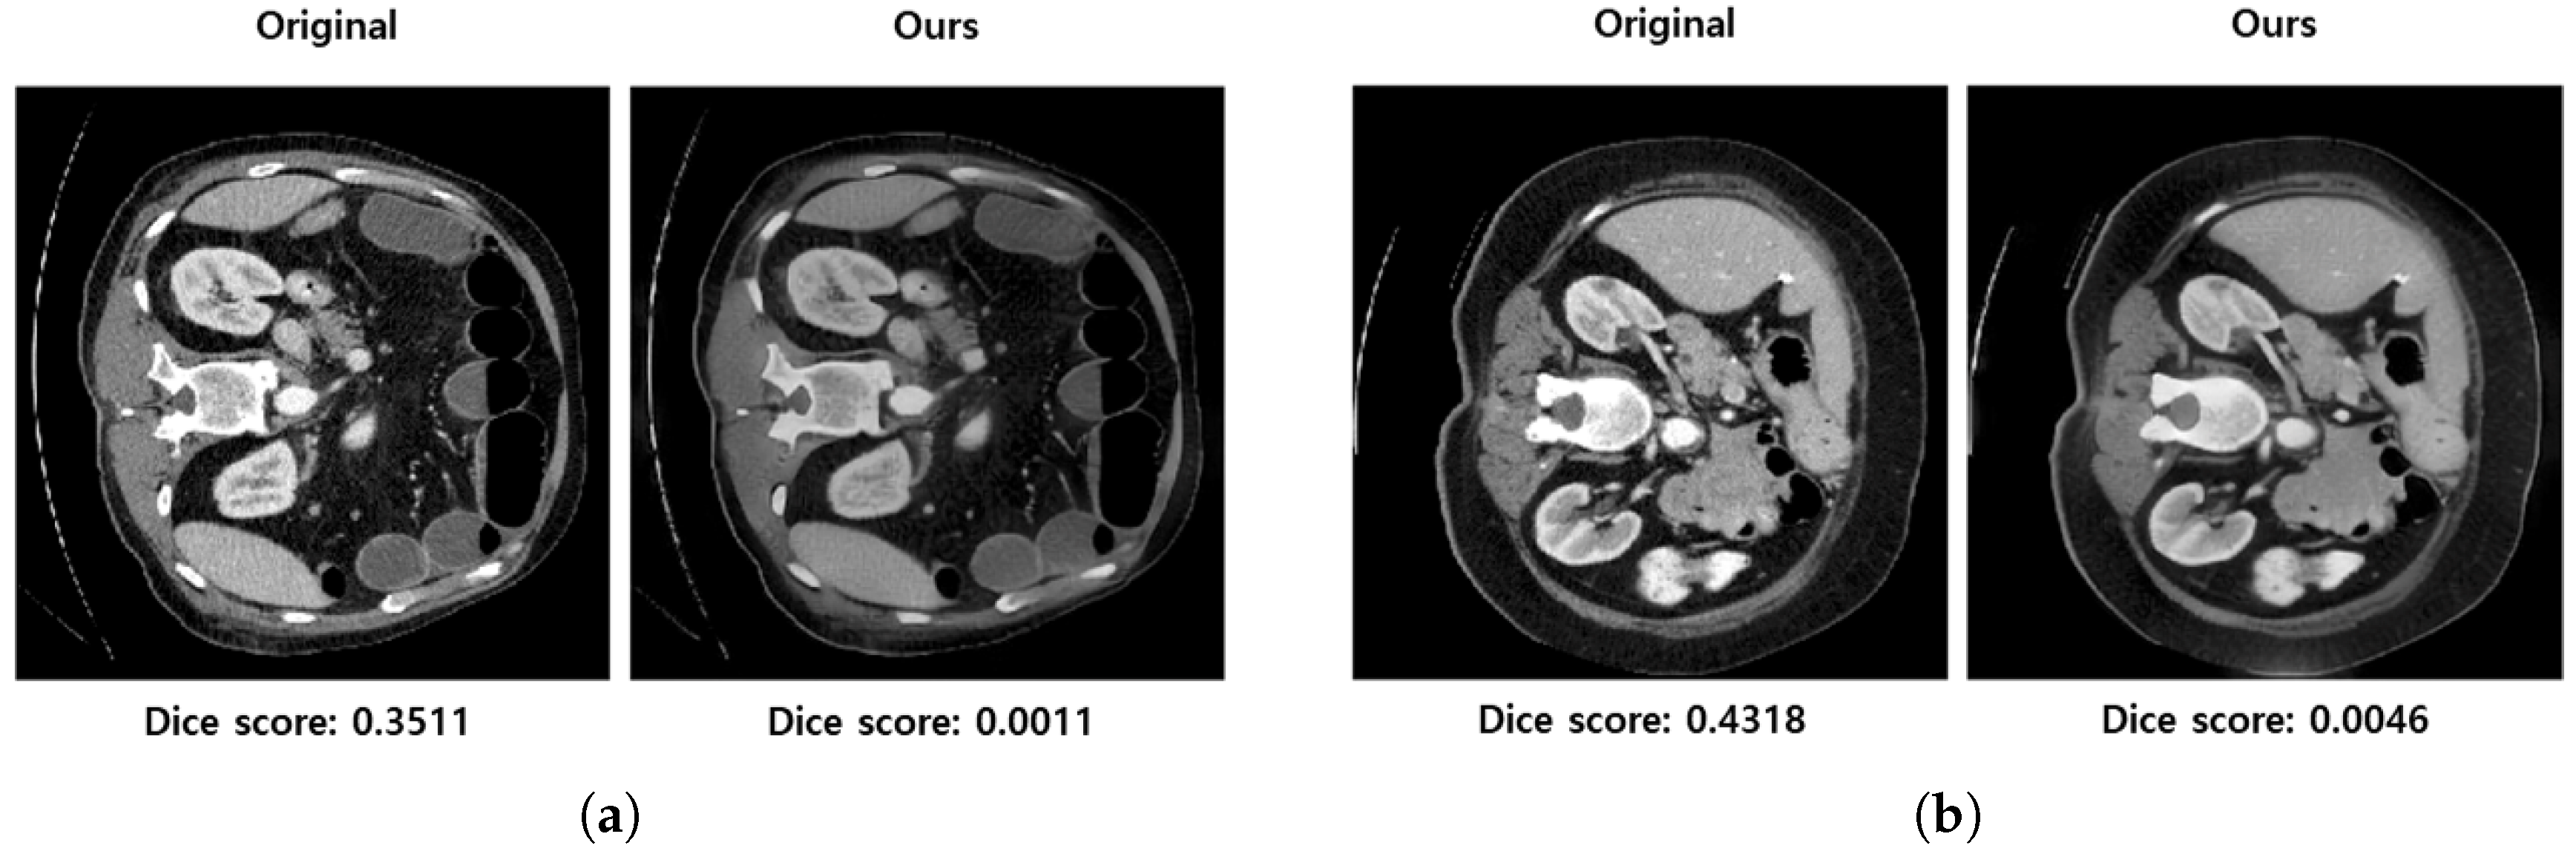
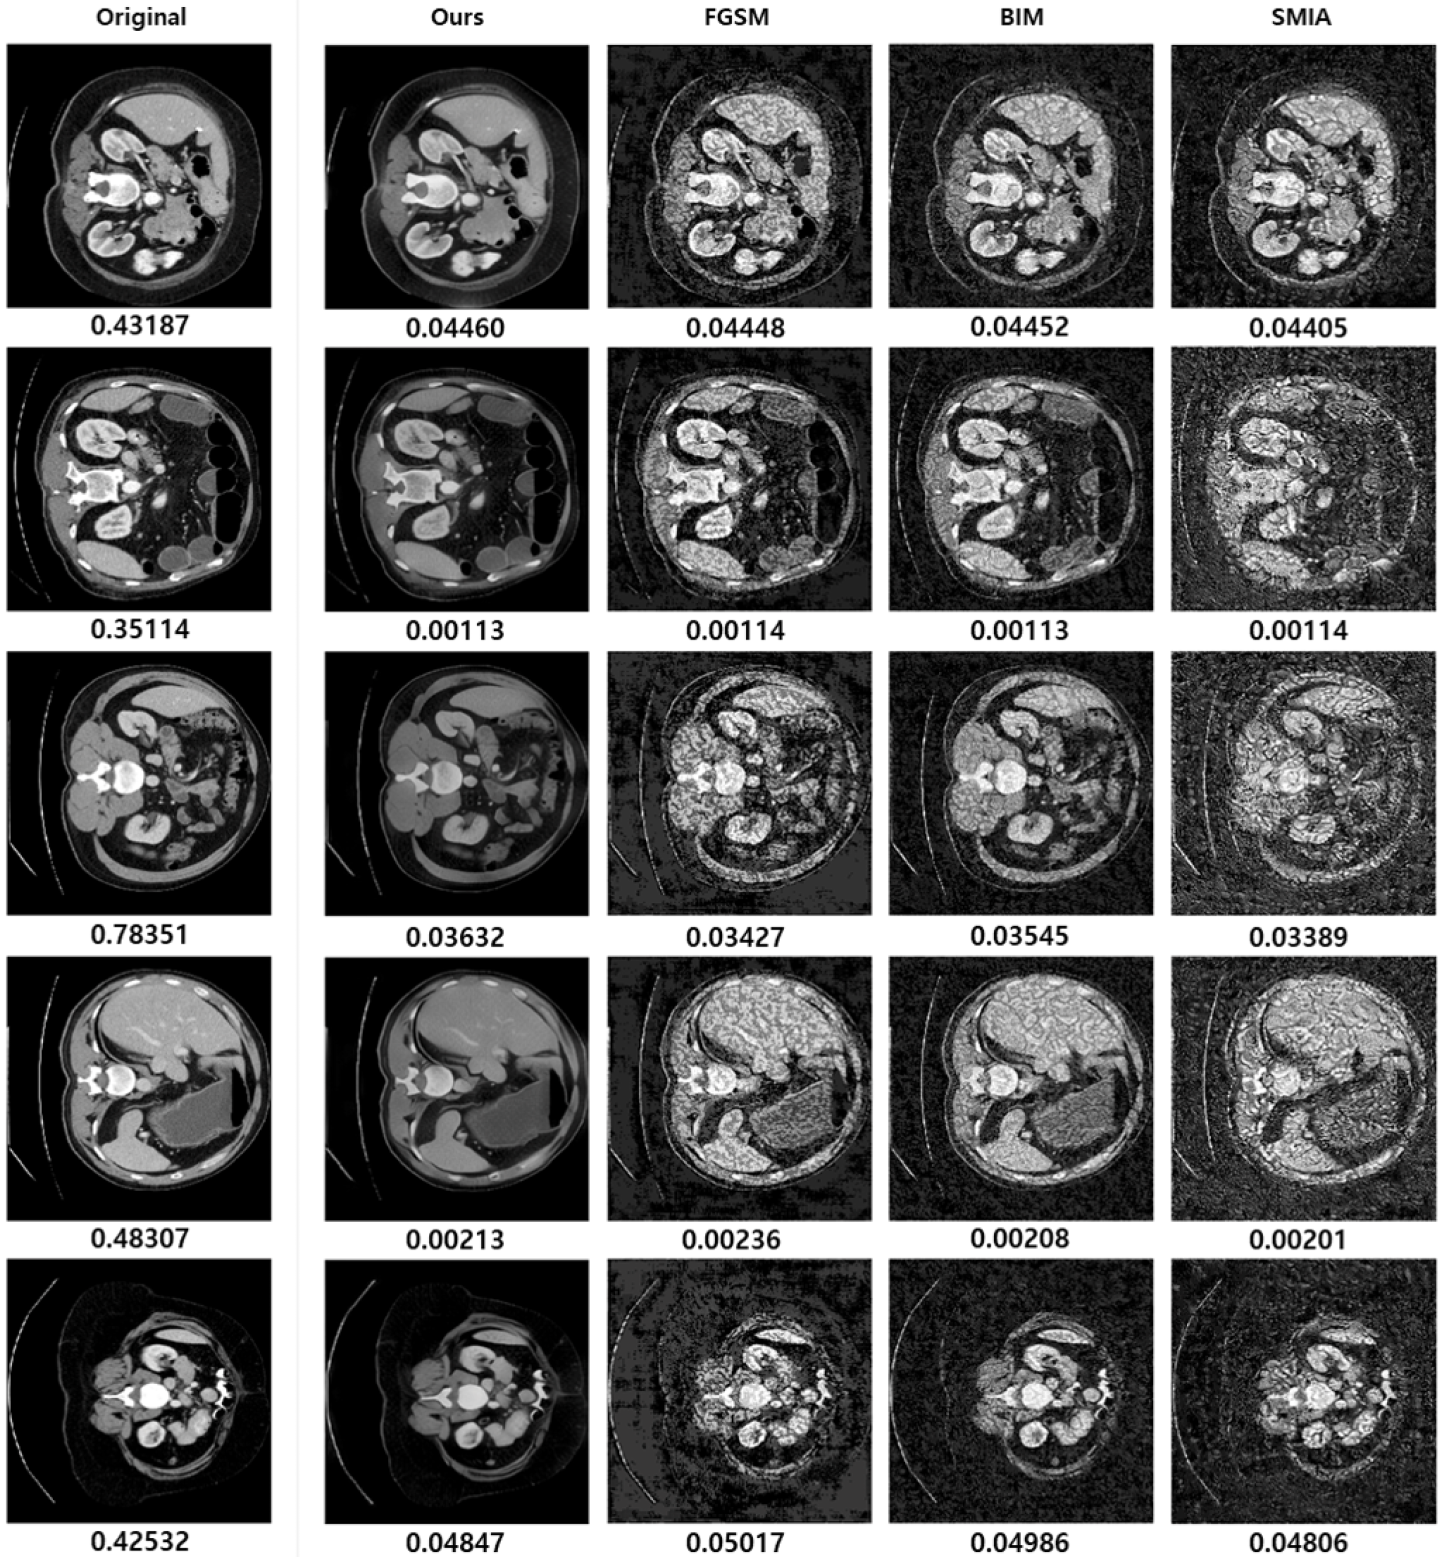
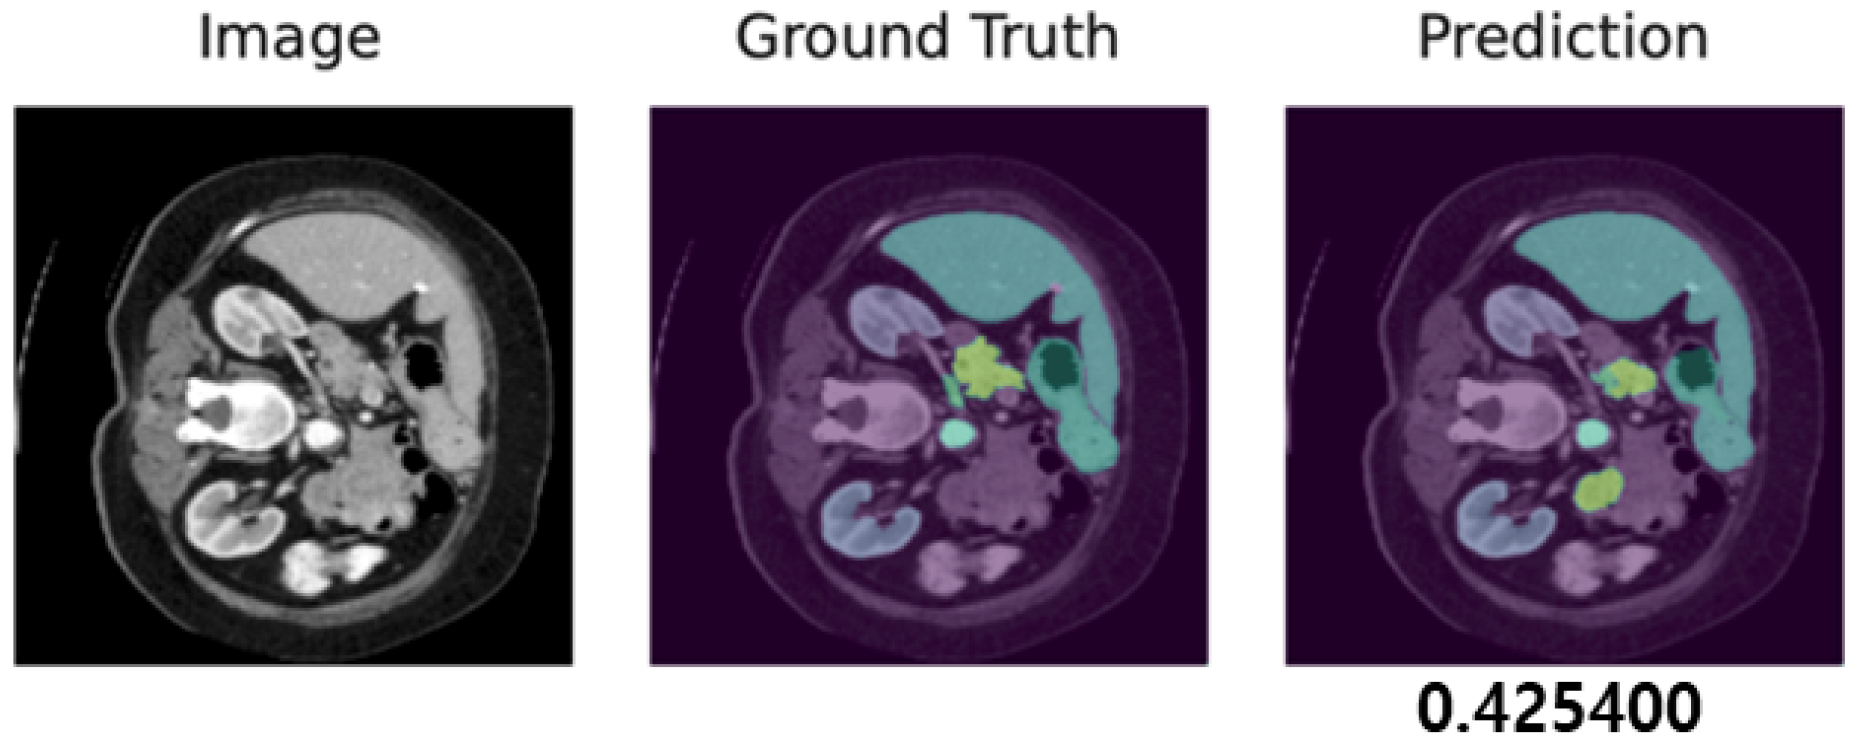
3.7. Case Study: Visualization of Adversarial Samples and Predictions

We display both adversarial samples and prediction by each method with regard to diverse hyper-parameters which is randomly sampled. In Figure 10, the original CT image, the ground truth and the prediction by the target segmentation model are depicted. Moreover, we show adversarial samples generated by our method in Figure 11 and corresponding predictions in Figure 12.
It is worth noting that the target model achieves a Dice score of 0.425400, as depicted in Figure 10. However, when our method is applied with α μ and α σ values of 1.2 and 0.9, respectively, as shown in Figure 11 and Figure 12, the Dice score increases to 0.519836. This improvement suggests that our method effectively reduces false positives in the segmentation model. Thus, our approach can serve the dual purpose of launching attacks on a segmentation model and enhancing its prediction performance.
Since α μ and α σ serve as transformation factors for the mean and standard deviation of the feature vectors, respectively, their values significantly influence the appearance of the generated images. The results, as illustrated in the figures, indicate a trend where extreme values for the mean transformation factor (around 0.3 and 1.5) coupled with a relatively small standard deviation transformation factor tend to effectively compromise the model, as evidenced by a decrease in the Dice score. Furthermore, the generation of realistic images is often achieved when α μ and α σ maintain a similar ratio. This observation suggests a strategy for optimizing the search for suitable pairs of transformation factor values by maintaining a consistent ratio between them, potentially accelerating the optimization process.

3.8. Discussion

To validate the proposed method in this work, we demonstrate its attack performance in comparison with existing baselines, including FGSM, BIM, and SMIA. As detailed in Section 3.4, our approach demonstrably surpasses these baselines in terms of attack performance, as corroborated by medical professionals using a real-world CT dataset targeted at a deep learning-based segmentation model. Moreover, Section 3.5 addresses the limitations inherent to our method, noting that despite these constraints, the adversarial samples it generates maintain a higher degree of realism compared to those produced by the baseline methods, even when Dice scores are controlled across comparisons.
Further expanding the utility of our method, Section 3.6 explores its potential as a novel technique for data augmentation, aimed at bolstering the robustness of deep segmentation models. This is particularly significant given the increasing reliance on deep learning in medical imaging analysis. Additionally, Section 3.7 presents a series of adversarial samples generated using a variety of transformation factors, accompanied by their respective Dice scores, providing insight into the method’s versatility and the nuanced impact of different transformations on model deception and segmentation accuracy. Through these discussions, we aim to underscore the multifaceted contributions of our work to the field of medical image analysis and its implications for the development of more resilient deep learning models.

4. Conclusions

In this study, we present a novel adversarial attack approach that simultaneously targets the deception of a segmentation model and medical practitioners. Unlike existing methods that involve trade-offs between success rates and perceptibility, our approach overcomes this limitation by transforming the statistics of features instead of adding noise. Through rigorous experimentation, we validate the superior realism of our adversarial samples compared to state-of-the-art methods. Furthermore, we demonstrate the versatility of our method by applying it to data augmentation. This additional application expands the potential of our approach as a benchmark test for validating automated CT segmentation systems in the future. We believe that our work will contribute to the advancement and evaluation of such systems in the medical field. Additionally, the outcomes of our research may offer paths to enhance the robustness of medical segmentation models by integrating other data augmentation methods that are orthogonal to ours. In future work, we aim to extend the proposed approach for broader application across various modalities, including Magnetic Resonance Imaging (MRI), Digital Radiography, Mammography, and Nuclear Medicine.

Author Contributions

Conceptualization, W.L. and Y.K.; methodology, W.L., M.J. and Y.S.; software, W.L., M.J. and Y.S.; validation, W.L., M.J. and Y.S.; formal analysis, W.L.; investigation, W.L., M.J. and Y.S.; data curation, Y.K.J. and T.H.K.; writing—original draft preparation, W.L., M.J. and Y.S.; writing—review and editing, W.L., M.J., Y.S. and Y.K.; visualization, M.J.; supervision, Y.K.J., T.H.K. and Y.K.; project administration, W.L. and Y.K.; funding acquisition, Y.K. All authors have read and agreed to the published version of the manuscript.

Funding

This research was financially supported by the Ministry of Trade, Industry and Energy (MOTIE) and Korea Institute for Advancement of Technology (KIAT) through the International Cooperative R&D program (Project No. P0025661). Additionally this work was supported by Institute of Information & Communications Technology Planning & Evaluation (IITP) grant funded by the Korea government (MSIT) (No. RS-2022-00155885, Artificial Intelligence Convergence Innovation Human Resources Development (Hanyang University ERICA)). It was also supported by the BK21 FOUR (Fostering Outstanding Universities for Research) funded by the Ministry of Education (MOE, Korea) and National Research Foundation of Korea (NRF).

Institutional Review Board Statement

Not applicable.

Informed Consent Statement

Not applicable.

Data Availability Statement

Restrictions apply to the availability of these data. Data was obtained from “Multi-Atlas Labeling Beyond the Cranial Vault—Workshop and Challenge” and available: https://www.synapse.org/#!Synapse:syn3193805/wiki/217789, accessed on 9 August 2022.

Conflicts of Interest

The authors declare no conflict of interest. The funders had no role in the design of the study; in the collection, analyses, or interpretation of data; in the writing of the manuscript; or in the decision to publish the results.

References

  1. Zhou, C.; Ding, C.; Wang, X.; Lu, Z.; Tao, D. One-pass multi-task networks with cross-task guided attention for brain tumor segmentation. IEEE Trans. Image Process. 2020, 29, 4516–4529. [Google Scholar] [CrossRef] [PubMed]
  2. Li, S.; Sui, X.; Luo, X.; Xu, X.; Liu, Y.; Goh, R. Medical image segmentation using squeeze-and-expansion transformers. arXiv 2021, arXiv:2105.09511. [Google Scholar]
  3. Calisto, F.M.; Nunes, N.; Nascimento, J.C. BreastScreening: On the use of multi-modality in medical imaging diagnosis. In Proceedings of the International Conference on Advanced Visual Interfaces, Ischia, Italy, 28 September–2 October 2020; pp. 1–5. [Google Scholar]
  4. Zuo, Z.; Li, J.; Xu, H.; Al Moubayed, N. Curvature-based feature selection with application in classifying electronic health records. Technol. Forecast. Soc. Chang. 2021, 173, 121127. [Google Scholar] [CrossRef]
  5. Tang, Y.; Yang, D.; Li, W.; Roth, H.R.; Landman, B.; Xu, D.; Nath, V.; Hatamizadeh, A. Self-supervised pre-training of swin transformers for 3d medical image analysis. In Proceedings of the IEEE/CVF Conference on Computer Vision and Pattern Recognition, New Orleans, LO, USA, 18–24 June 2022; pp. 20730–20740. [Google Scholar]
  6. Isensee, F.; Petersen, J.; Klein, A.; Zimmerer, D.; Jaeger, P.F.; Kohl, S.; Wasserthal, J.; Koehler, G.; Norajitra, T.; Wirkert, S.; et al. nnu-net: Self-adapting framework for u-net-based medical image segmentation. arXiv 2018, arXiv:1809.10486. [Google Scholar]
  7. Benčević, M.; Galić, I.; Habijan, M.; Babin, D. Training on polar image transformations improves biomedical image segmentation. IEEE Access 2021, 9, 133365–133375. [Google Scholar] [CrossRef]
  8. Edlund, C.; Jackson, T.R.; Khalid, N.; Bevan, N.; Dale, T.; Dengel, A.; Ahmed, S.; Trygg, J.; Sjögren, R. LIVECell—A large-scale dataset for label-free live cell segmentation. Nat. Methods 2021, 18, 1038–1045. [Google Scholar] [CrossRef] [PubMed]
  9. Bakkes, T.; van Diepen, A.; De Bie, A.; Montenij, L.; Mojoli, F.; Bouwman, A.; Mischi, M.; Woerlee, P.; Turco, S. Automated detection and classification of patient–ventilator asynchrony by means of machine learning and simulated data. Comput. Methods Programs Biomed. 2023, 230, 107333. [Google Scholar] [CrossRef] [PubMed]
  10. Hatamizadeh, A.; Tang, Y.; Nath, V.; Yang, D.; Myronenko, A.; Landman, B.; Roth, H.R.; Xu, D. Unetr: Transformers for 3d medical image segmentation. In Proceedings of the IEEE/CVF Winter Conference on Applications of Computer Vision, Waikoloa, HI, USA, 3–8 January 2022; pp. 574–584. [Google Scholar]
  11. Szegedy, C.; Zaremba, W.; Sutskever, I.; Bruna, J.; Erhan, D.; Goodfellow, I.; Fergus, R. Intriguing properties of neural networks. arXiv 2013, arXiv:1312.6199. [Google Scholar]
  12. Moosavi-Dezfooli, S.M.; Fawzi, A.; Fawzi, O.; Frossard, P. Universal adversarial perturbations. In Proceedings of the the IEEE Conference on Computer Vision and Pattern Recognition, Honolulu, HI, USA, 21–26 July 2017; pp. 1765–1773. [Google Scholar]
  13. Pal, B.; Gupta, D.; Rashed-Al-Mahfuz, M.; Alyami, S.A.; Moni, M.A. Vulnerability in deep transfer learning models to adversarial fast gradient sign attack for covid-19 prediction from chest radiography images. Appl. Sci. 2021, 11, 4233. [Google Scholar] [CrossRef]
  14. Chen, L.; Bentley, P.; Mori, K.; Misawa, K.; Fujiwara, M.; Rueckert, D. Intelligent image synthesis to attack a segmentation CNN using adversarial learning. In Proceedings of the International Workshop on Simulation and Synthesis in Medical Imaging, Shenzhen, China, 13 October 2019; Springer: Berlin/Heidelberg, Germany, 2019; pp. 90–99. [Google Scholar]
  15. Li, Y.; Zhu, Z.; Zhou, Y.; Xia, Y.; Shen, W.; Fishman, E.K.; Yuille, A.L. Volumetric medical image segmentation: A 3D deep coarse-to-fine framework and its adversarial examples. In Deep Learning and Convolutional Neural Networks for Medical Imaging and Clinical Informatics; Springer: Berlin/Heidelberg, Germany, 2019; pp. 69–91. [Google Scholar]
  16. Pervin, M.; Tao, L.; Huq, A.; He, Z.; Huo, L. Adversarial attack driven data augmentation for accurate and robust medical image segmentation. arXiv 2021, arXiv:2105.12106. [Google Scholar]
  17. Goodfellow, I.J.; Shlens, J.; Szegedy, C. Explaining and harnessing adversarial examples. arXiv 2014, arXiv:1412.6572. [Google Scholar]
  18. Kurakin, A.; Goodfellow, I.J.; Bengio, S. Adversarial examples in the physical world. In Artificial Intelligence Safety and Security; Chapman and Hall/CRC: Boca Raton, FL, USA, 2018; pp. 99–112. [Google Scholar]
  19. Qi, G.; Lijun, G.; Song, Y.; Ma, K.; Zheng, Y. Stabilized medical image attacks. In Proceedings of the International Conference on Learning Representations, Addis Ababa, Ethiopia, 26–30 April 2020. [Google Scholar]
  20. Aguirre, D.A.; Santosa, A.C.; Casola, G.; Sirlin, C.B. Abdominal wall hernias: Imaging features, complications, and diagnostic pitfalls at multi–detector row CT. Radiographics 2005, 25, 1501–1520. [Google Scholar] [CrossRef] [PubMed]
  21. Wang, Z.; Zhao, L.; Chen, H.; Li, A.; Zuo, Z.; Xing, W.; Lu, D. Texture reformer: Towards fast and universal interactive texture transfer. In Proceedings of the AAAI Conference on Artificial Intelligence, Online, 22 February–1 March 2022; Volume 36, pp. 2624–2632. [Google Scholar]
  22. Huang, X.; Belongie, S. Arbitrary style transfer in real-time with adaptive instance normalization. In Proceedings of the IEEE International Conference on Computer Vision, Venice, Italy, 22–29 October 2017; pp. 1501–1510. [Google Scholar]
  23. Xia, X.; Xue, T.; Lai, W.s.; Sun, Z.; Chang, A.; Kulis, B.; Chen, J. Real-time localized photorealistic video style transfer. In Proceedings of the IEEE/CVF Winter Conference on Applications of Computer Vision, Online, 5–9 January 2021; pp. 1089–1098. [Google Scholar]
  24. Chandran, P.; Zoss, G.; Gotardo, P.; Gross, M.; Bradley, D. Adaptive convolutions for structure-aware style transfer. In Proceedings of the IEEE/CVF Conference on Computer Vision and Pattern Recognition, Online, 19–25 June 2021; pp. 7972–7981. [Google Scholar]
  25. Karras, T.; Laine, S.; Aila, T. A style-based generator architecture for generative adversarial networks. In Proceedings of the IEEE/CVF Conference on Computer Vision and Pattern Recognition, Long Beach, CA, USA, 15–20 June 2019; pp. 4401–4410. [Google Scholar]
  26. Paszke, A.; Gross, S.; Massa, F.; Lerer, A.; Bradbury, J.; Chanan, G.; Killeen, T.; Lin, Z.; Gimelshein, N.; Antiga, L.; et al. Pytorch: An imperative style, high-performance deep learning library. In Proceedings of the Advances in Neural Information Processing Systems 32: Annual Conference on Neural Information Processing Systems 2019, Vancouver, BC, Canada, 8–14 December 2019. [Google Scholar]
  27. Landman, B.; Xu, Z.; Igelsias, J.; Styner, M.; Langerak, T.; Klein, A. Miccai multi-atlas labeling beyond the cranial vault–workshop and challenge. In Proceedings of the MICCAI Multi-Atlas Labeling Beyond Cranial Vault—Workshop Challenge, Munich, Germany, 4–9 October 2015; Volume 5, p. 12. [Google Scholar]
  28. Ronneberger, O.; Fischer, P.; Brox, T. U-net: Convolutional networks for biomedical image segmentation. In Proceedings of the International Conference on Medical Image Computing and Computer-Assisted Intervention, Munich, Germany, 4–9 October 2015; Springer: Berlin/Heidelberg, Germany, 2015; pp. 234–241. [Google Scholar]
  29. Loshchilov, I.; Hutter, F. Decoupled weight decay regularization. In Proceedings of the International Conference on Learning Representations, Vancouver, BC, Canada, 30 April–3 May 2018. [Google Scholar]
  30. Dong, J.; Chen, J.; Xie, X.; Lai, J.; Chen, H. Adversarial attack and defense for medical image analysis: Methods and applications. arXiv 2023, arXiv:2303.14133. [Google Scholar]
  31. Simonyan, K.; Zisserman, A. Very deep convolutional networks for large-scale image recognition. arXiv 2014, arXiv:1409.1556. [Google Scholar]
Figure 1. (a) A standard CT image smoothly interacts with the automatic segmentation system, while (b) a conspicuous noise makes an adversarial sample, introduced by an intruder, readily noticeable to a healthcare practitioner.
Applsci 14 02576 g001
Figure 2. This figure depicts an example of the transformation process of the feature statistics from the source image. Note that E3 and D3 represent the third encoder and decoder, respectively, in a series of five cascaded auto-encoders, as shown in Figure 3.
Applsci 14 02576 g002
Figure 3. This figure presents the complete structure, based on the texture reformer, that is used to generate adversarial samples with the proposed method, dAdaIN, followed by shiftDist for post-processing. Essentially, our method adopts the texture transfer technique [21], which utilizes cascaded auto-encoders and processes the inputs in reverse order, from 5 to 1.
Applsci 14 02576 g003
Figure 4. Comparison of processes between (a) an adversarial sample without preprocessing of pixel distribution, where the x-axis of the histogram represents pixel values within non-annotated organs (black area), revealing a skewed distribution that introduces artifacts in the generated image (red box), and (b) an adversarial sample with pixel distribution segmented into zero-value (purple) and non-zero-value pixels (yellow), which effectively eliminates these artifacts, as indicated in the red box.
Applsci 14 02576 g004
Figure 5. This figure shows the pixel values before and after shifting, determined by the background pixel value.
Applsci 14 02576 g005
Figure 6. The number of images corresponding to each organ.
Applsci 14 02576 g006
Figure 7. Examples of two questions used to assess image quality by physicians. (a,b) are randomly selected from the set of 50 questions used for the quality evaluation experiment. (a) Controlled Dice score: 0.0001–0.0003. (b) Controlled Dice score: 0.0551–0.0584.
Applsci 14 02576 g007
Figure 8. The figure depicts the limitations of our method. As observed in image (a), the adversarial sample is darker and more blurred than the original image, and in image (b), white noise is evident at the bottom of the adversarial sample.
Applsci 14 02576 g008
Figure 9. This figure illustrates the comparison of the proposed method with baseline approaches. The transformation factors are set at α μ = 0.3 and α σ = 0.3 , whereas the baselines’ hyperparameters are tuned based on Dice scores.
Applsci 14 02576 g009
Figure 10. Ground truth and target model’s prediction, presented with the corresponding Dice score of 0.4254.
Applsci 14 02576 g010
Figure 11. Our adversarial samples.
Applsci 14 02576 g011
Figure 12. Prediction of our adversarial samples.
Applsci 14 02576 g012
Table 1. Dice score changes with data augmentation.
OrganPre-AugmentationPost-AugmentationDifference
Background (BG)0.98560.9861+0.0004
Spleen (SP)0.64540.6599+0.0145
Right Kidney (RK)0.57100.5708−0.0003
Left Kidney (LK)0.56180.5796+0.0177
Gallbladder (BG)0.18030.1626−0.0177
Esophagus (ES)0.00000.0640+0.0640
Liver (LV)0.93710.9379+0.0008
Stomach (ST)0.48700.4881+0.0011
Aorta (AO)0.87440.8901+0.0157
Inferior Vena Cava (IV)0.53510.6405+0.1054
Portal and Splenic Vein (PVSV)0.25360.2467−0.0069
Pancreas (PA)0.30180.3003−0.0015
Right Adrenal Gland (RA)0.00000.1103+0.1103
Left Adrenal Gland (LA)0.00000.1098+0.1098
Disclaimer/Publisher’s Note: The statements, opinions and data contained in all publications are solely those of the individual author(s) and contributor(s) and not of MDPI and/or the editor(s). MDPI and/or the editor(s) disclaim responsibility for any injury to people or property resulting from any ideas, methods, instructions or products referred to in the content.

