Abstract
People spend two-thirds of their time in buildings. Building materials are, therefore, natural shielding for us. Many studies describe the shielding effect of non-building materials. This study evaluates the shielding effectiveness (SE) of electromagnetic fields for various building materials over a frequency range of 1 GHz to 9 GHz. Measurements of SE, reflection (R), and calculated absorption (A) were conducted to determine the shielding properties of mineral wool (MW), hardened polystyrene (PT), extruded polystyrene (PE), polyurethane board (PUR), brick wall (BW), brick wall filled with mineral wool (BW-MW), and concrete wall. The results demonstrate that MW, PT, PE, and PUR exhibit low SE and R, indicating minimal shielding capabilities, with absorption values that do not significantly deviate from the level of measurement uncertainty. Conversely, BW, BW-MW, and concrete wall materials exhibit high SE, with notably increased absorption at higher frequencies, highlighting their potential for effective EMI shielding. Particularly, the concrete wall presents the highest absorption values, making it a superior choice for shielding applications. Reflection trends revealed a plateau for BW in the 6 GHz to 9 GHz range, indicating a frequency-dependent behavior of shielding mechanisms. This study underscores the importance of balancing reflective and absorptive properties in shielding materials and suggests that composite materials may offer enhanced performance. The findings of this research provide guidance for the selection and design of shielding materials in environments with a frequency spectrum of electromagnetic frequencies from 1 GHz to 9 GHz.
1. Introduction
Microwave radiation (300 MHz–300 GHz—correctly referred to as radiofrequency electromagnetic fields) originates from various transmitters including broadcast (radio and television) transmitters, base stations for mobile networks, and radars positioned on buildings and towers, as well as from wireless telephones, wireless computer networks (Wi-Fi, Bluetooth), amateur radio transmitters, etc., situated in buildings and residential areas. Microwave radiation leaves its source in a straight line. When the direct wave encounters a solid obstacle, one or more of the following situations can occur simultaneously: penetration, reflection, and absorption. A significant portion of electrically conductive materials can reflect microwaves (similarly to how a mirror reflects light), while electrically non-conductive materials (dielectrics) have minimal influence on microwaves, allowing for penetration. For materials that can convert microwaves into heat faster than others, we speak of absorption. The best absorbers include seawater, slate, clays, and graphite. A portion of the microwaves are also absorbed into the ground, while some are reflected, so the nature of exposure in an outdoor environment greatly depends on the geography of the area [1,2,3,4,5].
Building structures alter the territorial profile. Only a small amount of radiation is absorbed directly by building materials; some is reflected (metal roofs and walls, aluminum foils, thermal insulating fillers of modern plastic and aluminum windows, reinforced concrete constructions, steel structures, etc.), and the rest passes through the material without change or with minimal attenuation. For example, classic glass (not that in plastic windows) or drywall allows virtually free passage of microwaves. A small part of building materials (concrete, brick) has higher attenuation, but, for instance, wood and various building blocks have minimal attenuation. Wherever electrically conductive materials (e.g., steel constructions and beams) are used in building construction, there is an influence on microwave fields. The same applies to electrically conductive objects inside buildings (elevators, handrails, door frames, handles, mirrors, iron objects, electrical wiring, switchboards, sockets, lamps, etc.). The intensity of microwave radiation to which individuals inside a building are exposed can, thus, be quite complicated, if not impossible, to calculate [1,2,6,7,8].
2. Electromagnetic Field
Figure 1 presents a simplified illustration of how a microwave field might look inside an apartment, which is part of a residential building (on the right), opposite a transmitter—a base station of a mobile telecommunications network (on the left). In this diagram, only one source is shown, and the radiation is, therefore, emanating from a single direction. However, most base stations have multiple antennas emitting in various directions. Additionally, there could be multiple sources of microwaves around the building, such as several base stations, television transmitters, etc. Therefore, microwaves impact the building from various sides and at different angles [9,10,11].
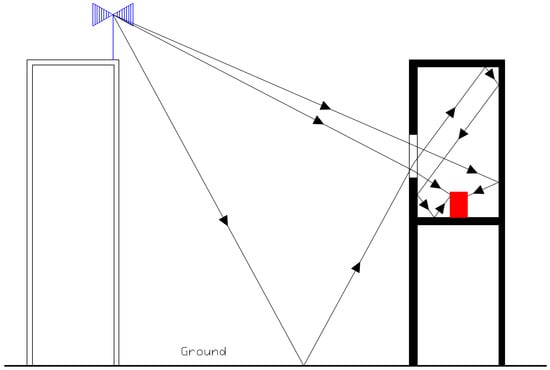
Figure 1.
Microwave radiation in a residential building.
In cases where transmitters are mounted on the roof of a building, individuals on the topmost floors will be exposed to an electromagnetic field. This field will be weaker than if the transmitters were on an adjacent building. However, since most antennas of base stations have a certain directional characteristic, a number of “hot spots”—areas with significantly higher field intensity than the intensity of the direct wave or the average intensity—can occur in a relatively small area. Hot spots can occur inside the building but also outside [12,13,14].
As years pass, we are witnessing an imperceptible expansion and increase in technical sources of electromagnetic fields and, thus, the development of wireless information technologies. Currently, there is significant attention on the newly established 5G network, which is receiving considerable support. On one hand, this is a great benefit for us, but on the other hand, the increase in electromagnetic fields also brings certain negatives.
We are in daily contact with electrical devices that generate electromagnetic fields (EMF). Therefore, it is good to be aware of their harmful effects on our body and also know how to protect ourselves from such fields.
For these reasons, it is important to study electromagnetic fields. The most common method of studying them is by modeling these fields using various computer programs capable of simulating the passage of such fields through different materials and then reliably analyzing them.
An electromagnetic field is a field composed of two components: an electric component and a magnetic component. The electric field exists wherever there is some form of electrical energy. It is created by the presence of electrically charged particles in electrical devices, whether or not current is flowing through them. The magnetic field is characterized by the fact that it only arises where there is a flow of electric current. The electric field is defined as follows [12,15,16]:
- -
- By the vector of electric induction D.
- -
- By the vector of electric field intensity E.
As mentioned, a magnetic field is created by the movement of charged particles, more precisely, by the movement of electrons in a conductor, for example, a regular cable. The movement of these electrons through the cable generates an electric current. The larger this current, the larger the size of the magnetic field, but its size decreases with increasing distance from the source of energy. Like the electric field, it is defined by two vectors [16,17]:
- -
- The vector of magnetic induction B with the unit T.
- -
- The vector of magnetic field intensity H with the unit A/m.
By combining these two fields, i.e., the electric and magnetic fields, we obtain an electromagnetic field, and its components are perpendicular to each other. In terms of frequency, it contains all components of electromagnetic energy, including radio waves, microwaves, infrared radiation, visible light, ultraviolet radiation, X-rays, and gamma radiation.
In recent decades, there have been two international organizations setting exposure limits for the protection from radiofrequency radiation of living organisms, namely the Institute of Electrical and Electronics Engineers (IEEE) and the International Commission on Non-Ionizing Radiation Protection (ICNIRP). These organizations have established limiting criteria for electrical devices due to electromagnetic compatibility concerns, aiming to minimize adverse effects on humans. This action followed a rise in negative feedback from individuals working with computing technology, who reported health deterioration, especially when using computers. Consequently, specific limits were set for electrical devices, which must also be electromagnetically compatible for safe practical use. Given the daily exposure of modern humans to electromagnetic fields of varying intensities from different sources, proof of negative effects such as cancer, mental disorders, organ damage, etc., would have significant implications [18,19,20].
The biological effects of electromagnetic fields (EMFs) depend on several objective and subjective parameters. These include [18]:
- -
- Physical parameters of the field, like frequency range, intensity, field character (amplitude and signal spectrum), and duration of exposure.
- -
- The physical and chemical properties of the organism, including size, weight, surface nature, thickness of layers (skin, fat, muscle), water content, current health and mental state, and the presence of other stress factors.
There are generally two main types of EMF effects [19]:
- Thermal effects, caused by temperature increases due to absorbed EM energy, are well understood and widely used in medicine for various therapeutic applications.
- Non-thermal effects, which are immediate effects of the electromagnetic field.
However, in practice, these two types of effects are practically inseparable. Thermal effects depend on the amount of absorbed energy and the depth of absorption, and problems can arise if the body cannot dissipate the excess heat, potentially leading to overheating of sensitive organs like the eyes, brain, and testes.
Non-thermal effects are mostly determined by the immediate amplitude of high-frequency radiation, and the effects increase with repeated exposure to pulse fields. The impact of long-term, low-power EMP exposure is especially noticeable in the central nervous system, causing symptoms like fatigue, apathy, sleep disturbances, attention and memory decline, headaches, sensitivity, and reduced potency. These changes affect cellular structures and electrical properties.
Non-thermal effects are analyzed at two levels in biological research:
Findings from laboratory experiments, supplemented by epidemiological studies.
Epidemiological observations are only considered valid when supported by experimentally verified hypotheses [18].
Non-thermal phenomena can have a “window character”, only manifesting under certain specific field parameters. This effect is more pronounced in low-frequency magnetic fields. The results of numerous studies indicate [1,5,18,20] changes in enzyme reactions, nerve cells, ion concentration in nerve tissue, and the defensive properties of lymphocytes. There is also a possibility of molecular-level resonance. Sometimes, non-thermal effects are thought to cause protein denaturation and changes in lipoproteins and enzymes. At very high frequencies and intensities, the penetration of fields into the human body is significantly limited.
3. Shielding of Electromagnetic Field
Electromagnetic waves traveling perpendicularly along the z axis and encountering a barrier for shielding are both reflected and partially absorbed. When considering shield effectiveness, waves that approach vertically demonstrate poorer performance due to their easier penetration through the barrier. In contrast, electromagnetic waves striking at a specific angle offer improved shielding properties, as they are more readily reflected, resulting in reduced penetration through the shielding obstacle.
In the case of electromagnetic waves with lower frequencies, the electric and magnetic components of electromagnetic waves are considered separately. In subsequent sections, the components of the electromagnetic wave are derived, having the following significance: the index ‘dop’ for the incident wave, ‘ref’ for the reflected wave, ‘abs’ for the absorbed wave, and ‘pr’ for the transmitted wave—Figure 2 [21,22].

Figure 2.
Incident, reflected, and absorbed waves.
The authors in Refs. [2,3] presented research focused on the effectiveness of shielding the electromagnetic field. The research was focused on two brick samples with different air-gap sizes. The paper also describes the measurement method and procedure in further detail. The results indicate that bricks with the same thickness but different air-gap dimensions exhibit different shielding efficiency values. The experiment demonstrates that a larger air-gap size results in lower shielding efficiency. For instance, at a frequency of 3 GHz, the shielding efficiency for the air gap of Sample 1 is SE = 5.8 dB, and for the air gap of Sample 2, SE = 7.8 dB. Shielding efficiency comprises the absorption and reflection of the electromagnetic field. However, this experiment does not confirm that the absorption/reflection ratio of the electromagnetic field must also change. While the shielding efficiency value is altered, the ratio of R (reflection) and A (absorption) could remain constant. In [4], authors experimented with a combination of shielding paint and some building materials. Specifically, they used polystyrene POLYFORM with a thickness of 5 cm, YSHIELD HSF 64 shielding paint, water, and BauKleber building glue of class C1T. The measurements were conducted in the frequency range from 1 GHz to 9 GHz with a step size of 50 MHz. The HSF 64 paint was mixed with water and glue in a ratio of 1 kg–275 g of paint. According to the manufacturer, the shielding effectiveness of HSF 64 is 39 dB. The results from the measurements indicate that the combination of these materials led to a decrease in shielding effectiveness, with a maximum reduction of approximately 5 dB. The authors concluded that the combination of this type of paint with other materials, especially glue and water, is not suitable and is not recommended. This conclusion suggests that when selecting materials for shielding purposes, it is important to consider their combination, as some combinations can significantly reduce the expected shielding effectiveness [2,3,4].
The intensity of the magnetic field, Hdop, of the incoming wave on a plate is determined by the ratio of the incoming wave’s electric field intensity, Edop, to the impedance of free space. Free space is defined as the space through which the wave propagates freely. Thus, it is not the impedance of the shielding material but, from a practical perspective, it is the impedance of air. However, for the analysis of shielding effectiveness, the free space is considered as a vacuum [2]:
The impedance of free space is determined by the square root of the ratio of vacuum permeability to vacuum permittivity [2]:
When an incident wave strikes the interface between two dielectrics, a portion of the incident wave’s energy reflects (Eref), while another portion of the incident wave’s energy is absorbed (Eabs) within the material of the plate. The remaining energy of the incident wave passes through to the other side of the plate (transmitted wave). It is established that the intensity of the magnetic field absorbed by the plate is defined as follows [2]:
While Habs represents the intensity of the magnetic field absorbed within the board, Eabs denotes the intensity of the electric field absorbed within the board, and ZS is the impedance of the board material. As seen in Figure 3, the interface between two dielectrics, air–board, at point X = 0 is marked. Furthermore, it is possible to define EX = 0− and EX = 0+. The index X = 0− indicates the field to the left of point X = 0, and the index X = 0+ indicates the field to the right of point X = 0, making it easier to distinguish the incident electromagnetic wave from the field beyond the interface of the two dielectrics.
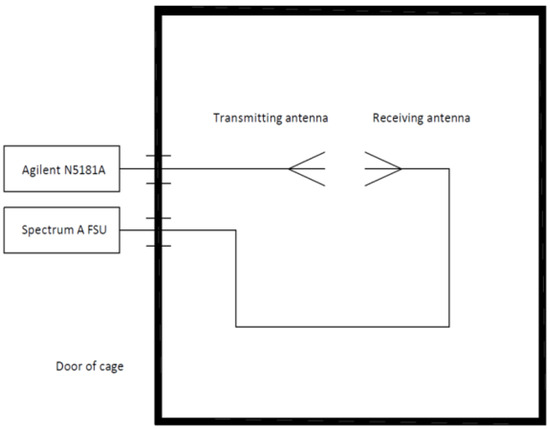
Figure 3.
The calibration process.
The relationship between the incident and reflected waves can be defined based on the energy of the incident wave, Edop, and the reflection coefficient, R, according to the following formula [2]:
It is noted that the reflection coefficient R is given by the formula [2]:
Equation (6) dictates that the energy Eabs absorbed by the wave can be calculated using the incident wave’s energy, denoted as Edop, and the absorption coefficient, referred to as A.
If the material is not ideal and has a specific conductivity σ ≠ 0, the incident wave that hits this material is absorbed within its structure [2]:
Drawing from Figure 2 and the previously outlined formulas, the energy of the transmitted wave, Epr, can be articulated as [2]:
For the scenario where ZS is much less than Z0, it holds that Epr can be expressed as follows:
Using the previously described equations, it is possible to express the shielding effectiveness (SE), which is considered a measure of the quality of the shielding material. Manufacturers of protective gear provide SE values. Shielding effectiveness can be expressed as the ratio of the incident wave Edop to the transmitted wave Epr [2]:
After expressing Edop and Epr, the SE can be articulated as:
where R is the reflection coefficient of the electromagnetic wave and A is the absorption coefficient of the electromagnetic wave. Some works in the literature [2,8] state that a portion of the reflection coefficient comprises the coefficient of multiple reflections M within the shielding material. When an electromagnetic wave propagates through the same space, it maintains its direction of travel. However, when it encounters the interface between two materials, the law of incidence and reflection applies. The same occurs when an electromagnetic wave hits the vacuum/shielding material interface. Part of the transmitted wave is reflected, and part of it penetrates the shielding material. This portion travels through the shielding material in an altered direction until it reaches the interface of the shielding material/vacuum (edge of the shielding material) again. At this point, the law of reflection occurs again, and part of the electromagnetic wave’s energy is reflected back into the material, while a part passes out of the shielding material. The reflected portion continues to travel through the shielding material against the direction of the original incident wave until it again reaches the vacuum/shielding material interface.
For simplification, many texts mention [2,4,13] that the reflection coefficient R includes these multiple reflections, meaning the value of R represents the total reflection of the electromagnetic wave. The absorption coefficient can be expressed through modification as [2]:
where t represents the thickness of the shielding material, and δ is the depth of penetration of the electromagnetic wave into the material. The penetration depth can also be calculated according to the formula [2]:
where μ is the permeability, which includes the permeability of the shielding material, and σ is the specific conductivity of the shielding material. The reflection coefficient R is determined according to [2]:
where μR is the relative permeability of the shielding material, and ε0 is the permittivity of a vacuum. The previous formulas apply when the intensities of the electric and magnetic fields are given in basic units. If the value of the transmitted signal is set in logarithmic units, the shielding effectiveness SE is determined according to Equations (17) and (18) [2]:
where E2 is the intensity of the electric field at a certain point in the shielded space, E1 is the intensity of the electric field impinging on the shielding barrier, H2 is the intensity of the magnetic field at a certain point in the shielded space, H1 is the intensity of the magnetic field impinging on the shielding barrier, V2 is the voltage of the electromagnetic wave at a certain point in the shielded space, V1 is the voltage of the electromagnetic wave impinging on the shielding barrier or wall, P2 is the power of the electromagnetic wave at a certain point in the shielded space, and P1 is the power of the electromagnetic wave impinging on the shielding barrier or wall.
4. Workplace for Experiment to Measure Shielding Effectiveness
The process of calibrating the workspace to measure the efficiency of shielding and reflection involved multiple stages. Both the calibration and the subsequent measurement took place inside a chamber that minimized reflection. The measuring instruments were positioned outside this chamber, ensuring that their emissions did not interfere with the measurement. In this context, the principle of calibration entails aligning the transmitting and receiving antennas so that the latter captures the electromagnetic wave emitted by the former. It is important to note that the receiving antenna can still capture the electromagnetic wave even if it is not perfectly aligned with the transmitting antenna. However, if the alignment is off, the receiving antenna may fail to capture the transmitted electromagnetic wave in the main lobe. This could directly impact the measurement of shielding efficiency, especially when reflections occur, and the incident electromagnetic wave arrives at a different angle. The calibration process involved several steps. Initially, it was necessary to identify the transmitted signal and calculate the signal displayed on the spectrum analyzer. Calibration was achieved by adjusting the position of the receiving antenna both vertically and horizontally—as shown in Figure 3. During these adjustments, it was crucial to monitor the electromagnetic wave’s value on the spectrum analyzer. The basis for calibrating the measuring workplace was the radio communication equation, which is described in the following manner [2,20,21,22]:
It is established that PP represents the received power, PV denotes the transmitted power, L0 are the free-space losses, GV is the gain of the transmitting antenna, and GP is the gain of the receiving antenna. The free-space losses L0 are defined as follows [2,3]:
where r represents the distance of the antenna, and λ is the wavelength, which can be expressed as follows [2,3]:
where c is the speed of wave propagation in a vacuum and f′ is the frequency of the wave. Additionally, it is necessary to consider the losses in cables used during calibration, which are included in the additional losses. Formula (20) applies an ideal scenario. In real-world conditions, the free-space losses L are defined as [2,3]:
where L0 represents the free-space losses and LA represents the additional losses. The additional losses LA consist of several components, which can be generally expressed for the transmission between two antennas as [2,3]:
where LFTX are the losses between the transmitter output and the transmitting antenna (attenuation in cables, connectors), AAG represents attenuation caused by the atmosphere and ionosphere, ARAIN represents attenuation due to rain and clouds, LPOL denotes losses caused by changes in polarization between the transmitting and receiving antennas, LPOINT refers to losses caused by inaccurate aiming of the antenna at the satellite, and LFRX represents the losses between the receiving antenna and the receiver input. In the case of the calibration described in this chapter, the components AAG, ARAIN, and LPOINT are not applicable [2,3,4,21,22].
In this study, two antennas were used for the measurements—the RF spin DRH18-E (RF spin, Hanspaulka, Czech Republic) and the Rohde & Schwarz HF 907 (Rohde & Schwarz, Munich, Germany)—Figure 4 and Figure 5.

Figure 4.
RF spin DRH18-E antenna.
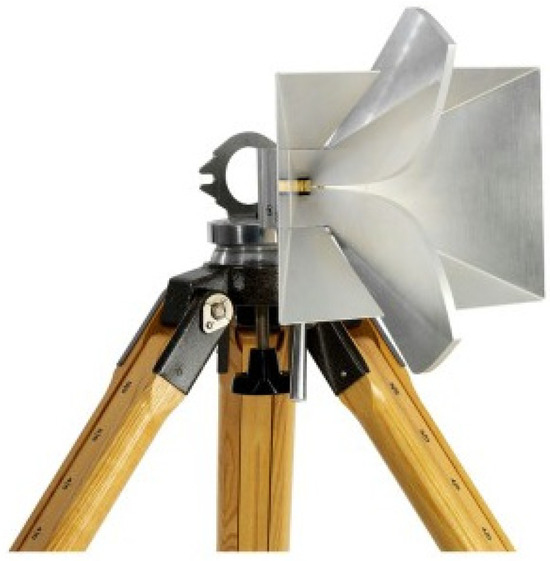
Figure 5.
Rohde & Schwarz HF 907 antenna.
The RF spin DRH18-E horn ridge antenna, with a wide frequency range of 1 GHz to 18 GHz, is designed for use in measuring the electromagnetic compatibility of components, in the automotive industry, in radio monitoring, and in military applications.
The R&S HF907 is a broadband directional antenna with linear polarization, featuring a frequency range of 0.8 GHz to 18 GHz. It is designed for use in electromagnetic compatibility measurements of components. Distinguishing itself from typical broadband antennas, its radiation pattern contains only one main lobe across the entire frequency range, with no significant side lobes [23].
The measurement setup further included the Agilent N5181A pulse generator (Agilent, Hong Kong, China), which powered the RF spin DRH18-E transmitting antenna. Between the antennas, the measured shielding was placed. The output from the R&S HF907 receiving antenna led into the Agilent N9038A MXE EMI spectrum analyzer. Both antennas were connected to the measuring instruments through feedthroughs and a network filter located in the EMC chamber. The Agilent N9038A MXE EMI spectrum analyzer is a standard receiver for electromagnetic interference (noise) and a diagnostic signal analyzer, built on an expandable platform. In the laboratory, it provides the precision, repeatability, and reliability necessary for each measurement. This device offers a wide frequency range from 20 Hz to 44 GHz. As standard with Agilent devices, it communicates via GPIB bus and also includes LAN and USB. The Agilent N5181A pulse generator, with its high reliability and performance, is optimized to provide accurate and repeatable reference signals. It further enhances throughput and maximum operational capability and saves space in the rack. Its wide scalability in RF power ensures easy configuration to meet specific measurement needs. The device offers a wide frequency range from 100 kHz to 20 GHz. Naturally, it communicates via the GPIB bus and also includes LAN and USB connections.
By measuring the shielding effectiveness (SE)—Figure 6, it is possible to determine how effective shielding materials are within the measured spectrum. Different materials can have varying shielding capabilities against electromagnetic waves. Based on the relationships for determining the shielding effectiveness (SE) and the reflection (R) of the electromagnetic waves, it can be concluded that the magnitudes of these quantities depend on the physical properties of the shielding material such as permeability or the specific conductivity of the shielding material. From this, it is also possible to determine the contribution of reflection (R) and absorption (A) of the electromagnetic wave to the overall shielding effectiveness. The values of SE, R, and A also depend on the space through which the electromagnetic wave propagates. However, this work described measurements that took place in an anechoic chamber and, therefore, the electromagnetic wave propagated through air.
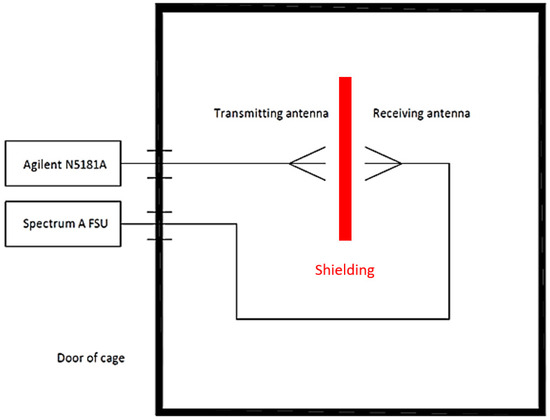
Figure 6.
Measurement of shielding effectiveness.
5. Measurement Uncertainty in Measuring Shielding Effectiveness
Uncertainties in measurement arise in every measurement activity, stemming from imperfections in measuring instruments and devices. In the case of electromagnetic waves, errors can also be caused by the environment through which the electromagnetic wave propagates. To further utilize the results from measurements, it is necessary to establish this measurement uncertainty. This information is crucial in determining the approximate value of shielding effectiveness and the reflection of electromagnetic waves.
The calculation of measurement uncertainty in this work was based on a document from the Slovak National Accreditation Service, which defines the following sources influencing measurement uncertainty:
- Relative amplitude accuracy of the spectrum analyzer.
- Amplitude stability of the signal source.
- Errors occurring during transmission.
- Errors occurring during reception.
The relative amplitude accuracy of the spectrum analyzer was determined from the manual of the used spectrum analyzer. The value of relative amplitude accuracy is primarily determined for a selected frequency band. Similarly, the value of the amplitude stability of the signal source was determined from the manual of the signal generator.
Errors occurring during transmission are largely caused by the effects of standing waves. Given that their influence cannot be excluded in the measurements described in this work, it is necessary to address them. When determining the measurement uncertainty during transmission, the standing wave ratio of 1.18:1 is considered. Based on the relationship described below, the reflection coefficient at the end of the cables is determined by [4]:
Then, the value of the error occurring during transmission is [4]:
Errors occurring during reception are defined in the same manner as those occurring during transmission. The same relationship applies; thus, the error arising during transmission is equal to the error incurred during reception. Table 1 displays a list of measurement uncertainty sources along with the corresponding value of the coverage factor K (coverage coefficient) and the determined or calculated value of the measurement uncertainty.

Table 1.
List of sources of measurement uncertainty [4].
Based on previous statements, it is possible to determine the total measurement uncertainty for the previously described workstation. The total measurement uncertainty is defined according to the following relationship [4]:
6. Results
To prevent interference signals, the measurement was conducted in an anechoic chamber. Prior to the measurement, calibration of the workstation was performed according to Equation (23). After the calibration was completed, a frequency of 1 GHz was set on the transmitting antenna. Using the receiving antenna and spectrum analyzer, the signal at the receiving antenna was recorded. The frequency was incrementally increased by 0.1 GHz up to a value of 9 GHz. After the measurement without shielding was completed, a measured object was placed between the receiving and transmitting antennas. The frequency of 1 GHz and signal height were set again on the transmitting antenna. This signal was captured using the receiving antenna and displayed with the spectrum analyzer. The final step involved calculating the shielding effectiveness based on Equation (18), using the results from the measurements with and without shielding. The same method was used to measure the shielding effectiveness for all shielding materials. The following building materials were examined, each with a thickness of 30 cm:
- -
- Mineral wool—“MW”.
- -
- Hardened polystyrene—“PT”.
- -
- Extruded polystyrene—“PE”.
- -
- PUR board.
- -
- Concrete wall—“Concrete-wall”.
- -
- Brick—“BW”.
- -
- Brick filled with mineral wool—“BW-MW”.
The research results are displayed in Figure 7. From the results, it is apparent that the materials MW, PT, PE, and PUR board achieve the lowest shielding effectiveness values. Among these four materials, the PUR board achieves the highest values. The materials MW, PT, PE, and PUR board reach values at the level of measurement uncertainty. In this case, it is not possible to demonstrate the shielding capability of the materials against electromagnetic waves. The materials BW, BW-MW, and concrete wall achieve significantly higher shielding effectiveness values. In the observed frequency band, it holds that with increasing frequency, the value of shielding effectiveness also increases. When comparing the materials BW, BW-MW, and concrete wall, the following conclusions can be drawn:

Figure 7.
Dependence of shielding effectiveness for MW, PT, PE, PUR board, concrete wall, BW, and BW-MW.
- -
- The graph shows a clear distinction in the shielding effectiveness (SE) across the different materials. Materials such as MW (mineral wool), PT (hardened polystyrene), PE (extruded polystyrene), and PUR board (polyurethane board) demonstrate low SE values throughout the entire frequency range, with all these materials’ SE values hovering around the measurement uncertainty level.
- -
- The PUR board shows a slightly higher SE than the other low-effectiveness materials, although it still remains significantly lower compared to the materials designed for better shielding.
- -
- The SE for the material BW (brick wall) exhibits a plateau effect in the frequency range from 6 GHz to 9 GHz, indicating that the shielding effectiveness does not significantly change within this band.
- -
- On the other hand, the materials BW-MW (brick wall filled with mineral wool) and concrete wall show a consistent increase in shielding effectiveness up to 9 GHz, which suggests that these materials have a better capability to shield against higher frequency electromagnetic waves.
- -
- In comparing BW-MW and concrete wall, their SE trends are nearly identical, and their values are almost the same across the frequency spectrum, highlighting their similar shielding properties.
- -
- The maximum SE values reached for each of the better shielding materials are as follows: BW achieves 16.2 dB, BW-MW achieves 18 dB, and concrete wall achieves 19.7 dB. These maxima occur at the higher end of the measured frequency range, emphasizing that these materials perform better at higher frequencies.
- -
- The overall trend observed is that the shielding effectiveness of all materials increases with frequency, but the rate of increase and the absolute values of SE are highly material-dependent. The materials designed for shielding (BW, BW-MW, concrete wall) show a significant increase in effectiveness, particularly in the higher frequency range.
Further investigation was conducted on the reflection of electromagnetic waves for the observed materials. The results of the electromagnetic wave reflection measurements are presented in Figure 8. The measurement outcomes indicate the materials’ property to reflect electromagnetic waves. Several conclusions can be drawn from the trends shown in Figure 8:

Figure 8.
Dependence of reflection of electromagnetic wave for MW, PT, PE, PUR board, concrete wall, BW, and BW-MW.
- -
- The materials MW (mineral wool), PT (hardened polystyrene), PE (extruded polystyrene), and PUR board (polyurethane board) exhibit the lowest values of electromagnetic wave reflection (R). This observation correlates with their low shielding effectiveness (SE) as previously discussed, supporting the hypothesis that materials with lower SE also demonstrate lower reflection characteristics.
- -
- Conversely, the materials BW (brick wall), BW-MW (brick wall filled with mineral wool), and concrete wall show the highest values of reflection in the observed frequency range. This finding is consistent with the earlier conclusion that these materials offer higher SE. The trend in the development of electromagnetic wave reflection over the observed frequency range is similar across all three materials.
- -
- Similar to the SE behavior, for the material BW, the reflection (R) values in the frequency range from 6 GHz to 9 GHz remain stable, indicating that the material’s reflective properties do not change significantly within this band.
- -
- The ratio between the SE values for materials MW, PT, PE, and PUR board and those for materials BW, BW-MW, and concrete wall is higher than the ratio between the R values. This suggests that the impact of material properties on SE is more pronounced than that on R, indicating that other factors such as absorption and transmission losses may contribute more significantly to SE than to reflection alone.
- -
- The maximum reflection (R) values for the materials are as follows: for BW, it is 7 dB; for BW-MW, it is 8 dB; and for concrete wall, it is 9 dB. These maximum values reinforce the concept that materials with higher density and structural complexity, such as concrete walls and brick walls filled with mineral wool, are more effective in reflecting electromagnetic waves, especially at higher frequencies.
- -
- These conclusions support and extend the understanding of the materials’ interaction with electromagnetic waves, emphasizing the importance of considering both SE and reflection when assessing a material’s shielding capabilities.
In the final step, the value of the electromagnetic wave absorption (A) was calculated. The absorption values were computed according to Equation (27).
The dependencies of the electromagnetic wave absorption for all the examined materials can be seen in Figure 9. From the dependencies, the following observations can be made:
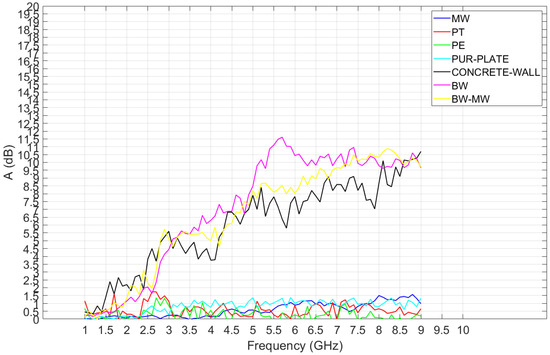
Figure 9.
Dependence of absorption of electromagnetic wave for MW, PT, PE, PUR board, concrete wall, BW and BW-MW.
- -
- In the observed frequency range from 1 GHz to 9 GHz, there is an increasing trend in the electromagnetic wave absorption (A) for the materials BW (brick wall), BW-MW (brick wall filled with mineral wool), and concrete wall. This indicates that these materials are more effective in absorbing electromagnetic waves, which could be attributed to their physical properties and composition.
- -
- The absorption values (A) for the materials MW (mineral wool), PT (hardened polystyrene), PE (extruded polystyrene), and PUR board (polyurethane board) are relatively low, remaining around the level of measurement uncertainty. This suggests that these materials are less capable of absorbing electromagnetic waves, which may correlate with their lower density or the nature of the materials which are not optimized for absorption.
- -
- The material concrete wall achieves the highest absorption values (A), followed by BW-MW and then BW. This hierarchy in absorption capacity may reflect the internal structure and density of the materials, with concrete wall having properties that enable it to dissipate more electromagnetic waves as heat or other forms of energy within its structure.
- -
- The maximum absorption (A) values for the materials are as follows: for BW, it is 11.8 dB; for BW-MW, it is 11 dB; and for concrete wall, it is 10.5 dB. These values might seem counterintuitive as one might expect that higher absorption would correspond to higher decibel values. However, these figures suggest a complex interplay between absorption, reflection, and transmission properties of the materials and how these properties affect the overall attenuation of electromagnetic waves.
- -
- These conclusions reinforce the understanding that the shielding effectiveness of a material is a result of both its reflective and absorptive properties. The materials with higher density or composite structures, such as concrete walls and brick walls with mineral wool, exhibit higher electromagnetic absorption, making them suitable for applications requiring effective electromagnetic interference (EMI) shielding.
When measuring, reflections from the chamber may occur; however, these measurements fall into the category of comparative ones and are present both in measurements with shielding and in measurements without shielding. Therefore, their impact can be neglected even though they may have a minor effect on the results.
7. Discussion and Conclusions
This manuscript has investigated the electromagnetic interference (EMI) shielding properties of various building materials by measuring their shielding effectiveness (SE), reflection (R), and absorption (A) across a frequency range of 1 GHz to 9 GHz. The findings reveal that the shielding effectiveness of materials is a composite outcome influenced by both reflective and absorptive properties. Materials like mineral wool (MW), hardened polystyrene (PT), extruded polystyrene (PE), and polyurethane board (PUR) showed minimal SE and R, indicating limited shielding capability, which was further corroborated by their low absorption (A) values that remained around the measurement uncertainty level.
In contrast, materials with a more substantial structure, such as brick wall (BW), brick wall filled with mineral wool (BW-MW), and concrete wall, demonstrated superior EMI shielding properties. These materials not only showed high SE values but also displayed significant electromagnetic wave absorption (A), particularly at higher frequencies. It is noteworthy that while these materials exhibited similar trends in SE and R, their absorption capabilities varied, with concrete wall exhibiting the highest absorption followed by BW-MW and BW.
During the measurements, there were instances where significant deviations occurred at certain specific frequencies, diverging from the range of other measured values. As a result, a test measurement was conducted on a brick material with a thickness of 30 cm, focusing on the vicinity of the problematic frequency with smaller steps. Figure 10 shows that even with reduced frequency steps, fluctuations only occurred at one measurement point (at one frequency). For this reason, these problematic spots were removed from the measurement results and replaced with values from the surrounding measurement points. This removal of problematic points was performed to prevent distortion of the shielding effectiveness and electromagnetic wave reflection curves, smoothing out the course of shielding effectiveness and reflection of the electromagnetic waves—Figure 11. This elimination was carried out only when a single value was problematic, not when fluctuations occurred over a wider frequency range. Approximately 1–2 data points for each dependency of SE or R of the electromagnetic waves were removed.

Figure 10.
The dependency of shielding effectiveness (SE) on frequency—a detail from the measurement results.
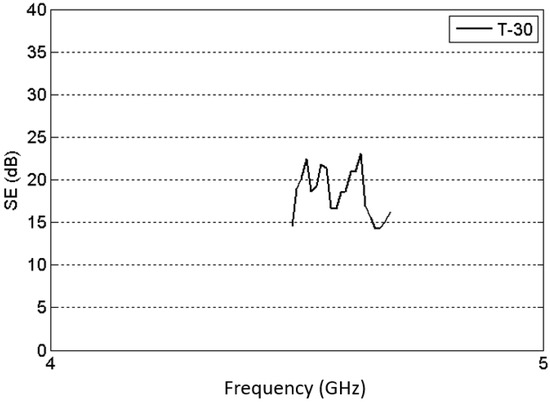
Figure 11.
Modified data.
The manuscript outcomes are significant for the selection of materials for EMI shielding applications. The trend of increasing SE and A with frequency suggests that materials’ shielding properties may be optimized for specific frequency ranges. This is particularly relevant in an era where the frequency spectrum of devices is broadening, and the need for effective EMI shielding is critical in ensuring device performance and compliance with regulatory standards.
Moreover, the observed plateau in R values for BW within the 6 GHz to 9 GHz range, which did not translate to a similar trend in absorption, highlights the complex interplay between different mechanisms of EMI shielding. This suggests that while reflection contributes to SE, absorption plays a critical role in the attenuation of electromagnetic waves, particularly at higher frequencies where wave penetration can be more pronounced.
The close similarity in absorption trends for BW-MW and concrete wall materials, despite their different compositions, indicates that material density and structural properties may have a more pronounced effect on absorption than material type alone. This underscores the potential for composite materials to provide enhanced EMI shielding through a combination of reflection and absorption.
In conclusion, this study advances the understanding of EMI shielding by dissecting the contributions of reflection and absorption to overall shielding effectiveness. It provides a clear indication that for materials to serve effectively in EMI shielding applications, a balance of both reflective and absorptive properties is essential. Future research should focus on the development of materials that combine these properties effectively, potentially exploring composite materials that can offer high-performance EMI shielding across various frequency ranges.
Author Contributions
Conceptualization, M.P.; methodology, M.B.; software, Ľ.B.; validation, M.P. and Ľ.B.; formal analysis, M.P. and M.B.; investigation, M.P. and Ľ.B.; resources, Ľ.B.; data curation, M.P. and M.B.; writing—M.P., M.B. and Ľ.B.; visualization, M.B.; supervision, M.P.; project administration, M.P.; funding acquisition, M.P. All authors have read and agreed to the published version of the manuscript.
Funding
This work was supported by the Slovak Research and Development Agency under the contract No. APVV-19-0576 and the Ministry of Education, Science, Research and Sport of the Slovak Republic and the Slovak Academy of Sciences under the contract no. VEGA 1/0757/21.
Institutional Review Board Statement
Not applicable.
Informed Consent Statement
Not applicable.
Data Availability Statement
The data presented in this study are available on request from the corresponding author. Data in this paper are publicly unavailable due to privacy restrictions.
Conflicts of Interest
The authors declare no conflicts of interest. The funders had no role in the design of the study; in the collection, analyses, or interpretation of data; in the writing of the manuscript; or in the decision to publish the results.
References
- Health Protection Agency. Static Magnetic Fields: Report of the Independent Advisory Group on Non-Ionising Radiation; Centre for Radiation, Chemichal and Enviromental Hazards: Oxford, UK, 2008; 143p, ISBN 978-0-85951-616-7. [Google Scholar]
- Pavlík, M.; Zbojovský, J.; Oliinyk, M.; Ivančák, M. Compare of shielding effectiveness for building materials with different air gap. In Elektroenergetika 2019: Proceedings of the 10th International Scientific Symposium on Electrical Power Engineering, Košice, Slovakia, 16–18 September 2019; Technical University of Košice: Košice, Slovakia, 2019; pp. 189–192. ISBN 978-80-553-3324-3. [Google Scholar]
- Pavlik, M.; Zbojovsky, J.; Oliinyk, M.; Ivancak, M. Experimental Study of High Frequency Electromagnetic Field Penetration through Building Material—Concrete Wall. In Proceedings of the 2019 20th International Scientific Conference on Electric Power Engineering (EPE), Kouty nad Desnou, Czech Republic, 15–17 May 2019; pp. 1–4. [Google Scholar] [CrossRef]
- Zbojovský, J.; Pavlík, M.; Čonka, Z.; Kruželák, L.; Kosterec, M. Influence of shielding paint on the combination of building materials for evaulation of shielding effectiveness. In Proceedings of the 2018 19th International Scientific Conference on Electric Power Engineering (EPE), Brno, Czech Republic, 16–18 May 2018; pp. 1–4. [Google Scholar] [CrossRef]
- Azmy, R.; Shamloul, R.; Elsawy, N.A.F.; Elkholy, S.; Maher, E. Effects of mobile phones electromagnetic radiation on patients with epilepsy: An EEG study. Egypt. J. Neurol. Psychiatry Neurosurg. 2020, 56, 36. [Google Scholar] [CrossRef]
- Ren, J.; Pan, Y.; Zhou, Z. Research on Shielding Effectiveness Testing Method of Irregular Structure. In Proceedings of the 2022 IEEE Conference on Antenna Measurements and Applications (CAMA), Guangzhou, China, 14–17 December 2022; pp. 1–2. [Google Scholar] [CrossRef]
- Zhou, J.; Fang, W.; Chu, R.; Zhu, Y. Analysis of Electric Field Shielding Effectiveness of Composite Materials Based on Near Field Scanning. In Proceedings of the 2023 6th International Conference on Electronics Technology (ICET), Chengdu, China, 12–15 May 2023; pp. 683–687. [Google Scholar] [CrossRef]
- Rusiecki, A. Calculations and measurements of shielding effectiveness of slotted enclosure with built-in conductive stirrer. Przegland Elektrotechniczny 2012, 88 No 10b/2012, 328–329. [Google Scholar]
- Chen, C.; Yu-sang; Yi-Miao. The research on shielding effectiveness measurement for electromagnetic shielding garments. In Proceedings of the 2017 7th IEEE International Symposium on Microwave, Antenna, Propagation, and EMC Technologies (MAPE), Xi’an, China, 24–27 October 2017; pp. 336–340. [Google Scholar] [CrossRef]
- He, L.; Hu, Y.; Guo, C.; Niu, M. Analysis of Shielding Effectiveness of Aperture Based on Multilayer Metal and Ferrite Composite Structure. In Proceedings of the 2023 International Conference on Microwave and Millimeter Wave Technology (ICMMT), Qingdao, China, 14–17 May 2023; pp. 1–3. [Google Scholar] [CrossRef]
- Jin, Z.; Li, J.; Shi, J.; Zhang, Y.; Zuo, Y.; Cai, M. An Equivalent Method for Measuring Shielding Effectiveness of a Microminiature Electromagnetic Shield Using Its Large-Scale Model. In Proceedings of the 2022 IEEE 9th International Symposium on Microwave, Antenna, Propagation and EMC Technologies for Wireless Communications (MAPE), Chengdu, China, 26–29 August 2022; pp. 361–365. [Google Scholar] [CrossRef]
- Zbojovský, J.; Mészáros, A.; Kurimský, P. Modelling the high frequency electromagnetic field propagation through the polystyrene, 2015. In Elektroenergetika 2015; TU: Košice, Slovakia, 2015; pp. 556–559. ISBN 978-80-553-2187-5. [Google Scholar]
- Jin, Z.; Shi, J.; Zhang, Y.; Zuo, Y.; Li, J.; Wu, W. Study on the Reference level of Shielding Effectiveness for Electromagnetic Shielding Doors. In Proceedings of the 2022 International Applied Computational Electromagnetics Society Symposium (ACES-China), Xuzhou, China, 9–12 December 2022; pp. 1–3. [Google Scholar] [CrossRef]
- Pavlík, M.; Zbojovský, J.; Kolcunová, I. Compare of fabric and brick wall as shielding material dependence on electromagnetic field. In Proceedings of the 2021 IEEE 4th International Conference and Workshop Óbuda on Electrical and Power Engineering (CANDO-EPE), Budapest, Hungary, 17–18 November 2021; pp. 139–142. [Google Scholar] [CrossRef]
- Kuriyama, T.; Moritake, T.; Nakagami, K.; Morota, K.; Hitomi, G.; Kitamura, H. Background Factors Affecting the Radiation Exposure of the Lens of the Eye among Nurses in Interventional Radiology: A Quantitative Observational Study. Nurs. Rep. 2024, 14, 413–427. [Google Scholar] [CrossRef] [PubMed]
- Češkovič, M.; Bucko, S.; Miľo, M.; Labun, J. Antennas for UAV application. Aeronautika 2017, 17, 230–237. [Google Scholar]
- Onuki, H.; Shinagawa, M.; Kajiya, Y.; Sato, K. Using Electromagnetic Field Simulations to Evaluate the Impact of Complex Permeability on Shielding Effectiveness. In Proceedings of the 2023 IEEE 12th Global Conference on Consumer Electronics (GCCE), Nara, Japan, 10–13 October 2023; pp. 1087–1089. [Google Scholar] [CrossRef]
- Konig, H.; Erlacher, P. Neviditeľná Hrozba, Elektromagnetická Pole Kolem Nás; HEL: Brno, Czech Republic, 2001; p. 156. ISBN 80-86167-15-1. [Google Scholar]
- International Commission on Non-Ionizing Radiation Protection. Exposure to High Frequency Electromagnetic Fields, Biological Effects and Health Consequences (100 kHz to 300 GHz); INCIRP: Munich, Germany, 2009; ISBN 978-3-934994-10-2. [Google Scholar]
- ICNIRP SCI Review. Mobile Phones, Brain Tumors, and the Interphone Study: Where Are We Now, Online. 2011. Available online: https://www.icnirp.org/cms/upload/publications/ICNIRPSCIreview2011.pdf (accessed on 5 March 2024).
- Pavlík, M.; Kolcunová, I.; Dolník, B.; Kurimský, J.; Mészáros, A.; Medveď, D.; Kolcun, M.; Zbojovský, J. Measuring of Dependence of Shielding Effectiveness of Wet Materials on The Frequency of Electromagnetic Field in the High Frequency Range. Acta Electrotech. Et Inform. 2013, 13, 12–16. [Google Scholar]
- Pavlík, M. Compare of shielding effectiveness for building materials. Prz. Elektrotechniczny 2019, 95, 137–140. [Google Scholar] [CrossRef]
- SHF Antennas R&S®HF907 Double-Ridged Waveguide Horn Antenna. Available online: https://scdn.rohde-schwarz.com/ur/pws/dl_downloads/dl_common_library/dl_brochures_and_datasheets/pdf_1/HF907_2020.pdf (accessed on 5 March 2024).
Disclaimer/Publisher’s Note: The statements, opinions and data contained in all publications are solely those of the individual author(s) and contributor(s) and not of MDPI and/or the editor(s). MDPI and/or the editor(s) disclaim responsibility for any injury to people or property resulting from any ideas, methods, instructions or products referred to in the content. |
© 2024 by the authors. Licensee MDPI, Basel, Switzerland. This article is an open access article distributed under the terms and conditions of the Creative Commons Attribution (CC BY) license (https://creativecommons.org/licenses/by/4.0/).