Article

Perceived Air Quality, Thermal Comfort and Health: A Survey of Social Housing Residents in Kazakhstan

School of Architecture, University of Liverpool, Liverpool L69 7ZN, UK
*
Author to whom correspondence should be addressed.
Appl. Sci. 2024, 14(6), 2513; https://doi.org/10.3390/app14062513
Submission received: 22 February 2024 / Revised: 11 March 2024 / Accepted: 14 March 2024 / Published: 16 March 2024
(This article belongs to the Special Issue Air Quality in Indoor Environments, 2nd Edition)

Abstract

:
Kazakhstan is in Central Asia and is the ninth-largest country in the world. Some socially vulnerable segments of the Kazakh population residing in subsidised social housing have experienced a range of problems due to the low quality of housing construction and its planning. Poor indoor environmental conditions in social housing contribute to occupants’ comfort, health, and general well-being. This study assessed social housing residents’ health and quality of life, focusing on their perceived indoor air quality and thermal comfort satisfaction. A cross-sectional survey in Kazakhstan was conducted to test the effects of environmental factors on social housing residents’ health and satisfaction. Four hundred thirty-one responses were analysed, and the SF12v2 questionnaire was used to measure the health-related quality of life. Multiple regression analysis showed that air quality negatively predicted the respondents’ physical (PCS) and mental (MCS) health. In addition, age, smoking, and employment status had a significantly negative effect on PCS, while education level had a predictive positive effect. Thermal conditions negatively predicted only MCS, as well as alcohol consumption. Next, the air-conditioning control factor had a negative effect. In contrast, low air circulation, low humidity, high solar gain, temperature imbalance, duration of the residence and alcohol consumption had a significantly positive effect on overall satisfaction with the temperature. The odour sources from tobacco, furniture and external sources were predictors of respondents’ overall air quality satisfaction, along with the duration of the residence, alcohol consumption and smoking status.

1. Introduction

The unprecedented levels of urbanisation in many Central Asian countries led to a growth in demand for housing in the city centres and peripheries, reducing housing’s affordability for low-income sectors of society. Kazakhstan is situated in Central Asia and is the world’s largest landlocked country. Its vast territory spans across both Europe and Asia, featuring a diverse range of geographical and climatic features [1]. The focus on extractive industries in Kazakhstan’s economic development resulted in higher rates of urbanisation than the rest of the region, from 43.7% in 1959 [2,3] to 59.5% in 2022 [4]. Rapid urbanisation, climatic conditions and Kazakhstan’s unique geographical location, characterised by extreme winters and hot summers, as well as vast steppes to mountain ranges, pose additional challenges to sustainable urban development and housing policy [5].
As the leading economy in Central Asia, the development of the oil and gas sector has allowed Kazakhstan’s economy to join the ranks of upper-middle-income countries [6]. Despite governmental strategies since the 1990s prioritising economic diversification, Kazakhstan remains afflicted by the “resource curse”, adversely influencing poverty levels and widening income inequality [7]. The country also exhibits significant socio-economic inequalities, underscored by significant disparities in socio-economic development across different inter-regions [8]. This economic disparity is reflected in the housing market, with a recent study showing that no region in Kazakhstan has complete housing affordability, with housing prices not corresponding to the incomes of its citizens [9]. The government’s housing policy, aimed at increasing the availability of affordable housing through various economic development programs, such as the ‘Nurly Zher’ (‘Bright Path’) stimulus, has sought to address these issues by promoting the construction of affordable housing units and providing mortgage subsidies for eligible citizens [10]. However, challenges remain in terms of the quality of affordable housing and the accessibility of these programs to the most vulnerable populations.
In the nineteenth century, Engels [11] gave a detailed description of the complex housing situation of the working class, typically resulting in low-income households being pushed out of the centre of a town towards the poor-quality housing on the city’s outskirts. Even though the social housing sector evolved very differently from one country to another [12], Engel’s prescient analysis of the housing system can still be traced to Kazakhstan’s affordable housing policy. Kazakhstan’s major urban centres have high homeownership rates, mainly due to the legacies of the Soviet Union’s housing policies [13]. The high cost of living in cities leads to the exclusion of lower-income households [14], not only from the city centres but even from the city peripheries [15], especially following the two waves of migration from Russia since 2022 [16].
The total volume of the housing stock in Kazakhstan has increased by 25% in the last decade, with the state owning only a tiny share, at 2.24% [9]. The imbalance in the levels of existing socially vulnerable segments of the population and the provision of subsidised housing has been aggravated by the accumulated problems in the quality of construction and its planning [17]. Urban Forum Kazakhstan [18] noted that disorderly and unplanned social housing development leads to low-quality, outskirt-located, uncomfortable, and segregated districts. Segregated low-income populations are subjected to a disproportionate and uneven distribution of environmental toxins in their air, water, and housing, which might negatively impact their physical health and psychosocial and behavioural well-being, which can harm their mental health [19,20].
Numerous cases have acknowledged the relationship between poor indoor environmental conditions in social housing and adverse health consequences [21]. It has been observed [22] that social housing had significantly higher concentrations of air pollutants, inadequate ventilation and reported mold compared to green homes, suggesting that multilevel housing interventions can improve long-term resident health. Previous research has found that various physical aspects defining the living environment, such as indoor air quality and thermal comfort, contribute to social housing occupants’ lower comfort, health and general well-being [23]. Low-income households in Australian social housing have experienced summer overheating and winter underheating [24], with more than half of the surveyed people reporting health problems like respiratory diseases and allergies and around 30% reporting mental health problems [25].
Recent research based on Kazakhstan’s general population’s subjective perception of well-being found that low monthly income was one of the strongest negative predictors of poor physical and mental health [26]. In addition, considerable inequalities in self-rated health related to material deprivation were found in a Kazakhstani population of mature people aged 45+ [27]. The findings suggest that the prevention of a deterioration of subjective well-being should be aimed at susceptible populations with lower socio-economic status. Given that the population of Kazakhstan is more vulnerable to adverse health outcomes due to living conditions and low socio-economic status [28], studying the indoor environmental quality in these environments becomes imperative for assessing built environments, identifying policy implications, and evaluating healthy homes for improved living standards. This study aimed to assess social housing residents’ health and quality of life, focusing on their perceived thermal comfort and indoor air quality satisfaction, in the Zerdely social housing district of the city of Almaty, Kazakhstan.

2. Materials and Methods

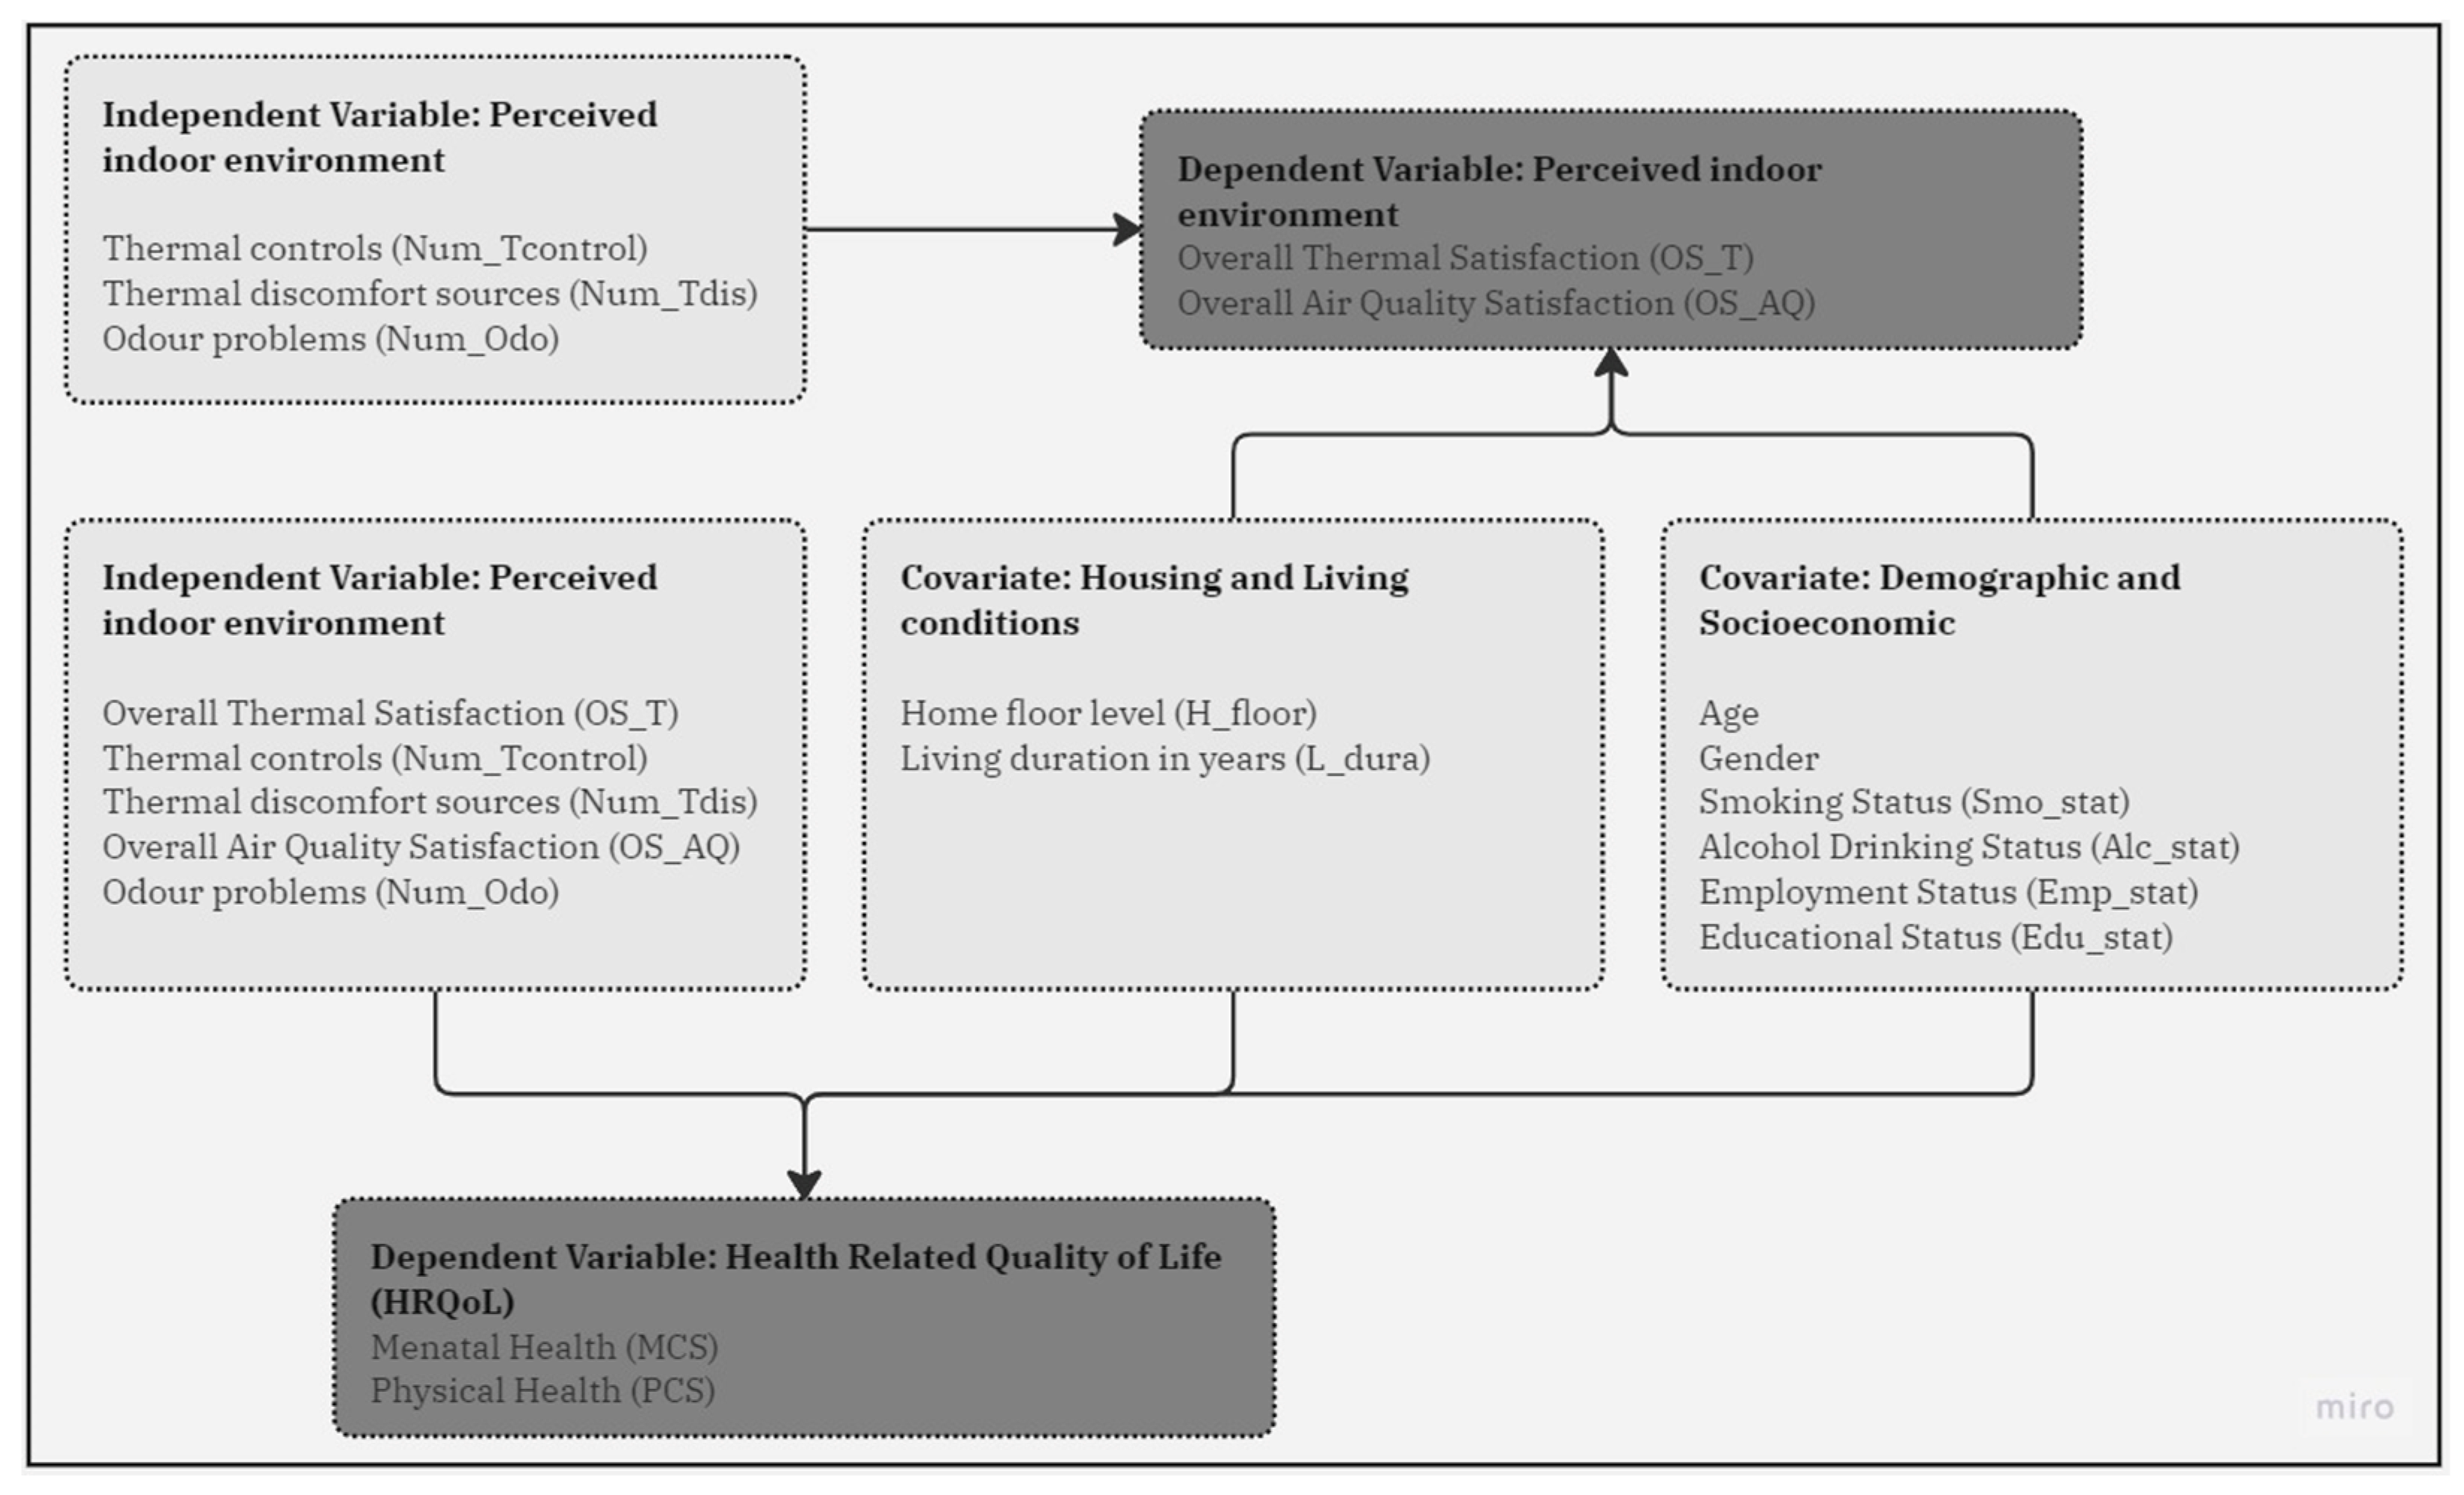
2.1. Research Design

To study the relationship between perceived indoor environmental quality (IEQ) and its effect on social housing occupants’ health-related quality of life (HQoL), a self-administered paper questionnaire was designed based on the IEQ literature and SF12v2, which is a 12-item health survey that is widely used to assess people’s health-related quality of life [29]. The questionnaire comprised four parts and received ethical approval from the University of Liverpool’s Ethics Committee (approval number V02050722).
The design of the questionnaire was aimed at identifying the most direct correlations between IEQ and health outcomes within the specific research objectives and the characteristics of the target population. The first part of the questionnaire collected a respondent’s demographic and background information, such as age, gender, employment status (Emp_stat), educational level (Edu_stat) and personal habits that may affect health, like smoking (Smo_stat) and alcohol drinking (Alc_stat) status. In the second part, respondents described how long they had lived in their residence (L_dura), floor level (H_floor), the number of thermal controls and adjustment solutions (Num_Tcontrol), overall satisfaction with temperature (OS_T), and the number of sources to cause thermal discomfort (Num_Tdis). The third part of the questionnaire asked about overall satisfaction with indoor air quality (OS_AQ) and sources of dissatisfaction, focusing on a number of issues, if any, that caused odour problems (Num_Odo). The satisfaction ratings were evaluated on a 7-point Likert scale, with the dissatisfied answers prompting follow-up questions to make the occupants evaluate their sources of dissatisfaction. Finally, the last part of the questionnaire included the SF-12v2 Health Survey (SF12), with the license agreement from QualityMetric Incorporated, measuring eight health domains in physical (PF) and social functioning (SF), bodily pain (BP), general health (GH), vitality (VT), role limitations due to physical (RP) and emotional (RE) health problems, and mental health (MH), with each domain contributing to the physical (PCS) and mental (MCS) component scores. The SF12v2 Health Survey has been widely validated for predicting a population’s mental and physical health [30,31], including low socio-economic populations [32].
To enrich an understanding of the factors influencing indoor air quality and thermal comfort satisfaction, this study focused on variables directly related to the resident’s immediate living environment and perceptions of their health. This focus was in response to a strategic decision to prioritise the investigation of tangible and perceivable aspects of IEQ that residents could reliably report. While recognising the potential influence of broader socio-economic factors, such as household income and housing maintenance status, on perceptions of air quality, this study opted to focus its analysis on variables that offered the most direct insight into the relationship between IEQ and health outcomes within the specific context of the Zerdely social housing district.
The research design is shown in Figure 1. The independent variables consist of perceived thermal and air qualities of the indoor climate satisfaction levels and actions taken to alter their interior environment. The covariates were included in terms of two dimensions: housing and living and demographic and socio-economic conditions. The apartment’s floor level (H_floor) and the length of occupation (L_dura) were considered under the housing and living conditions, and the essential details about the residents and their behaviours were considered under demographic and socio-economic characteristics. The primary dependent variable was the residents’ self-rated physical (PCS) and mental (MCS) health components, as well as overall satisfaction with thermal (OS_T) and air quality (OS_AQ).
The survey was conducted among the adult population residing in a social housing micro-district, Zerdely, in Almaty, Kazakhstan, from the 1st to the 10th of September 2022. The average daily temperatures ranged from +20.8 °C to +26.4 °C. The relative humidity levels varied across these days, with the lowest recorded on the 2nd of September (28%) and the highest on the 9th of September (42%) [33]. Wind speed remained low throughout the survey period, ranging from 1 to 2 m/s, indicating calm to light air movement [33]. Low wind speeds might result in less ventilation and air exchange in naturally ventilated indoor spaces, potentially affecting the indoor environment’s perceived comfort. Overall, the weather conditions during the survey period were conducive to evaluating residents’ perceptions of indoor environmental quality without extreme weather events impacting the results. However, the warm temperatures and varying relative humidity levels highlight the importance of considering thermal comfort and air quality as critical components of perceived IEQ in social housing studies.
The micro-district of Zerdely was selected because it was built under the state programme ‘Affordable Housing 2020’, making its residents particularly suitable for this study. Over the years, these residents have had time to adapt to the long-term effects of their housing conditions on their health and well-being [34,35]. This temporal aspect is important because it allows for an examination of more sustained impacts rather than transient adjustments, which provides an opportunity to further understand the relationship between housing quality and resident health in a defined community. Additionally, the study might offer findings that may be applicable to similar climatic and residential settings across the country but not necessarily generalisable to all Kazakh people or residents of other regions without further study.
The Zerdely micro-district consists of one hundred and twelve apartment buildings of three different heights (four, five and nine-storey) located on a plot of approximately 0.44 km2 in area. By focusing the survey here, this study aimed to capture a comprehensive snapshot of the lived experiences of those dwelling in social housing, against the backdrop of Kazakhstan’s urban and socio-economic landscape, as detailed in the Introduction. Figure 2 shows views of the surveyed housing.
Participants aged 18 years or older were considered eligible to participate in this study. To ensure the survey reached a representative cross-section of the Zerdely population, a total of fifteen trained interviewers from the Department of Pharmaceutical Technology of Asfendiyarov Kazakh National Medical University were used. These interviewers administered the face-to-face questionnaire survey in the respondents’ approved language version, using Kazakh or Russian language formats, prior to obtaining the signature on the participant consent form to ensure inclusivity and comprehensiveness in data collection. An introductory script was used to introduce the survey to each resident. The survey interviewers went door-to-door in pairs and administered the survey using a paper questionnaire distributed throughout the neighbourhood to cover apartments with different plan layouts, exteriors and floor heights.

2.2. Data Analysis

Several statistical models were implemented using the IBM® SPSS® Statistics 29.0 program [36] to analyse the collected data in this study. Descriptive statistics were used to display quantitative measures and the frequency distributions of the social housing residents’ socio-economic, demographic and housing characteristics. Next, Pearson correlation analyses were performed to test the correlations between independent and dependent variables. A series of linear regressions were used to predict the value of PCS, MCS, and overall thermal and air quality satisfaction based on the value of the independent variable.
Three regression models were conducted, with Model 1 testing only the predicted influence of the five environmental variables. Model 2 showed how the influence of these five factors could be adjusted by respondents’ duration of residence and floor height. Finally, Model 3 tested the adjustment of respondents’ six background characteristics for the influence of Model 2, which included environmental and housing conditions.

3. Results

3.1. Respondent Characteristics and Indoor Environment Conditions

In this study, a total number of 431 valid questionnaires (out of 450) were included, with a response rate of 95.7%. Table 1 presents the baseline demographic descriptors for the social housing residents in the Zerdely micro-district. Overall, the slightly overrepresented categories include females, at 57.5%, and the housing group aged over 41 years and older, at 23.4%. This pattern aligns with findings in similar socio-economic settings, indicating specific lifestyle choices prevalent among social housing residents [37]. Notably, a relatively high percentage, approximately 67%, stated that they do not smoke or drink alcoholic beverages. 42.2% were employed full-time, and 1.6% stated that they could not work. The average length of residence was 4.22 years (SD = 3.16).
The examination of smoking and drinking habits among the participants reflects the lifestyle trends within the Zerdely micro-district’s social housing community. These trends are consistent with behaviours observed in comparable socio-economic environments. Typically, abstention from alcohol and moderate consumption is more common in neighbourhoods of lower socio-economic status [38,39]. While higher levels of neighbourhood deprivation have been linked to increased smoking rates [40], this study found that the proportion of individuals who smoked aligned with the national trend in Kazakhstan, where the overall prevalence of tobacco use slightly decreased from 22.9% in 2014 to 21.5% in 2019 [41,42].
Table 2 provides descriptive statistics on the housing features. In this study, 72.9% of the respondents were residing from the first to fourth floors, reflecting the fact that out of 112 apartment buildings in the micro-district, only 32 were nine stories high. The multiple response frequency analysis of the personally adjusted indoor control variables showed that most residents adjusted window blinds or shades (81.9%), and less than half of the respondents (40.5%) owned air conditioning units. The window operability by residents was low, at 31.4%, with 14.7% owning a portable fan. Furthermore, 34.4% of the respondents regulated the degree of heat supply to the radiator, indicating active engagement with their living environment to maintain comfort.
In contrast, residents in private housing often display a broader range of socio-economic diversity, which can influence lifestyle choices, access to amenities, and health behaviours differently [43,44]. The disparities in housing quality and access to services between social and private housing underscore the importance of considering these differences when evaluating health outcomes and IEQ.

3.2. Correlation Analysis: Key Variables

Table 3 presents the Pearson correlation analyses that were performed to assess the relationship between six demographic and socio-economic variables, two housing and living conditions items, five environmental variables, two overall satisfaction items, and two health measures. The mean value of the physical health scores (PCS) was 52.22 ± 6.28, and the mean score for mental health (MCS) was 50.14 ± 9.97.
The correlation analysis showed a significant negative correlation (p < 0.01) between overall air quality and thermal satisfaction, with both PCS (r = −0.250; r = −0.126) and MCS (r = −0.293; r = −0.192) emphasising the importance of IEQ for residents’ health. This underscores the critical need for interventions aimed at enhancing air quality and thermal comfort within this setting to improve health outcomes. Additionally, alcohol consumption was negatively correlated (p < 0.01) with PCS (r = −0.145) and MCS (r = −0.127), suggesting that higher alcohol consumption may be associated with poorer health. Conversely, it was positively correlated with overall thermal (r = 0.173) and air quality (r = 0.130) satisfaction, indicating that individuals with higher alcohol consumption might have differing perceptions or use of alcohol as a coping mechanism for environmental dissatisfaction.
There was a statistically significant negative correlation between PCS and the number of sources to cause thermal discomfort (r = −0.100, p < 0.05), age (r = −0.234, p < 0.01), and smoking status (r = −0.184, p < 0.01), highlighting the adverse effects of ageing and smoking on physical health. Furthermore, a significant negative correlation (p < 0.05) was found between the duration of the residence and mental health component (r = −0.103), and a positive correlation with overall thermal (r = 0.105, p < 0.05) and air quality (r = 0.155, p < 0.01). Overall thermal satisfaction was strongly correlated with overall air quality satisfaction (r = 0.430, p < 0.01), signifying that improvements in one aspect of the indoor environment might positively influence perceptions of the other, advocating for a holistic approach to environmental improvements. Next, overall thermal satisfaction negatively correlated with several issues that caused odour problems (r = −0.132, p < 0.01), suggesting the importance of addressing these problems. Lastly, the floor height level was not statistically significantly correlated with any other tested variables across all of the combinations.

3.3. Effect of Environmental Satisfaction (Thermal and Air Quality) on Physical Health (PCS) and Mental Health (MCS)

Table 4 presents the results of the three regression models that were performed to understand the effect of the independent variables on the respondents’ PCS. In the linear regression models, Β indicates the level of influence on the dependent variable by the independent variable, and SE means standard error.
Model 1 established that overall air quality satisfaction statistically significantly predicts respondents’ PCS (Β = −0.813, p < 0.01) with an R2 of 0.069 (p < 0.01). This indicates that as satisfaction with air quality decreases, PCS worsens. When housing conditions were entered into the regression Model 2, the air quality environmental variable still significantly predicted the physical health component (Β = −0.801, p < 0.01); however, the increase in R2 was not significant (p > 0.05). After adding the demographic and socio-economic status and housing variables, Model 3 showed the same results as Models 1 and 2 for the overall air quality satisfaction variable (Β = −0.896, p < 0.01), as well as a predicting role of age (Β = −0.724, p < 0.01), smoking habit (Β = −0.953, p < 0.01), employment status (Β = −0.259, p < 0.05) and educational level (Β = 0.418, p < 0.1) on PCS with an R2 value of 0.156 (p < 0.01).
Table 5 presents the results of three regression models that were examined to understand the effect of the independent variables on the respondents’ mental health (MCS) in a social housing context.
Model 1 focuses on the impact of overall air quality satisfaction on MCS, revealing a significant negative relationship (Β = −1.430, p < 0.01), with an R2 of 0.097 (p < 0.01). This indicates that lower satisfaction with air quality is associated with poorer mental health outcomes. With the inclusion of housing condition variables in Model 2, overall satisfaction with the thermal environment (Β = −0.532, p < 0.1) and air quality (Β = −1.383, p < 0.01) significantly predicted mental health. After including demographic and socio-economic variables in Model 3, the effects of air quality (Β = −1.351, p < 0.01) and alcohol consumption status (Β = −1.282, p < 0.1) significantly predicted mental health scores. However, factors such as thermal environment satisfaction did not significantly affect MCS (p > 0.05). Additionally, there were no significant differences among the R2 values of Models 2 and 3 (p > 0.05).

3.4. Prediction of Environmental Satisfaction (Thermal and Air Quality)

Table 6 presents the results of three regression models that predict the effect of various independent variables on overall thermal satisfaction as an outcome variable.
Model 1 indicated that personally adjusting a room air conditioning unit (Β = −0.792, p < 0.01) and none of the provided number of control variables (Β = 1.649, p < 0.01) in the respondents’ indoor environment significantly predicted the overall thermal satisfaction levels, with an R2 value of 0.082 (p < 0.01). With the inclusion of the housing variables in Model 2, the predicting roles of personally controlling the room air conditioning unit (Β = −0.861, p < 0.01), none of the provided variables (Β = 1.471, p < 0.05), and the duration of the occupancy (Β = 0.047, p < 0.1) were significant. In Model 3, after adding the socio-economic and demographic factors, the predicting role of the room air conditioning unit (Β = −0.861, p < 0.01), none of the provided variables (Β = 1.471, p < 0.05), and alcohol consumption (Β = 0.379, p < 0.01) had a significant effect on overall thermal satisfaction. However, the other room control variables and housing conditions had no significant effect on overall temperature satisfaction. Additionally, the increases in R2 values in Models 2 and 3 were not statistically significant (p > 0.05).
Table 7 presents the results of three regression models that were performed to understand the impact of various sources of discomfort on the respondents’ overall thermal satisfaction as the outcome variable.
Model 1 established that low relative humidity (Β = 0.577, p < 0.01), low air movement (Β = 0.980, p < 0.01), solar gain (Β = 0.463, p < 0.05) and the indoor temperature imbalance (Β = 1.320, p < 0.01) statistically significantly predicted overall thermal satisfaction, with an R2 of 0.078 (p < 0.01). With the inclusion of housing condition variables in Model 2, the indoor temperature imbalance (Β = 1.338, p < 0.05) and low air movement (Β = 1.103, p < 0.1) continued to significantly predict thermal satisfaction. The duration of the residence (Β = 0.066, p < 0.05) also emerged as a significant predictor, indicating that longer residency was associated with higher thermal satisfaction. In Model 3, after adding demographic and socio-economic variables, the effects of the indoor temperature imbalance (Β = 1.217, p < 0.05), low air movement (Β = 1.077, p < 0.1), the duration of the residence (Β = 0.054, p < 0.1) and alcohol consumption (Β = 0.343, p < 0.05) significantly predicted overall thermal satisfaction. Additionally, there were no significant differences among the R2 values of Models 2 and 3 (p > 0.05).
Table 8 presents the results of three regression models that predicted the effect of various independent variables on overall air quality satisfaction as an outcome variable.
Model 1 indicated that odour problems that contributed to respondents’ dissatisfaction with the indoor air quality, particularly from tobacco smoke (Β = 0.366, p < 0.1), external sources (Β = 0.894, p < 0.01), home furnishings (Β = −1.519, p < 0.05) and some other sources (Β = 0.503, p < 0.1) could significantly predict the overall air quality satisfaction levels. When housing condition variables were added to the regression Model 2, the odour problems from the external sources (Β = 0.866, p < 0.1) still significantly predicted the overall air quality satisfaction levels, including the duration of the residence (Β = 0.067, p < 0.05). After including the socio-economic and demographic factors in Model 3, the predicting role of odour problems from the external sources (Β = 1.057, p < 0.05), the duration of the residence (Β = 0.051, p < 0.1), alcohol consumption (Β = 0.484, p < 0.01) and smoking habit (Β = −0.251, p < 0.01) had a statistically significant effect on overall air quality satisfaction.

4. Discussion

The statistical analyses from this study identified the range of factors that can impact the perceived thermal comfort and air quality of the social housing residents. Model 3, which incorporated the most comprehensive selection of parameters in the study, indicated that in terms of overall environmental satisfaction, air quality satisfaction, age, smoking habit, employment status and educational level statistically significantly predicted respondents’ physical health. For the same Model 3, mental health was significantly correlated with air quality satisfaction, thermal environment satisfaction and alcohol consumption status. Looking at individual variables and their impact on perceived air quality, Model 3 showed statistically significant relationships with odours from external sources, duration of residence in the housing, alcohol consumption and smoking habit.
Findings from other studies corroborate some of the results of this work. Vakalis et al. [45] examined indoor environmental quality in Canadian social housing and found that poor air quality was experienced by 80% of residents on a weekly basis. Cooking, smoking and outdoor odours contributed to this perceived poor air quality. The study by Langer et al. [46] indicated the importance of perceived air quality studies as they found that residents’ perceptions of their indoor air quality were more positive than would be indicated by objective measurements. Additionally, as with this current study, Langer found that perceived indoor air quality was strongly linked to an occupant’s social status. Alapieti et al. [47] studied people’s perceptions of air quality for a range of ventilation rates and volatile organic compounds (VOCs). Surprisingly, they found that perceived air quality could be high even when VOC levels were high, suggesting that VOCs are not a defining feature of perceived air quality. This type of finding indicates the importance of the suggestion by Pei et al. [48] that an occupant’s perception of air quality should be incorporated into any traditional physical air quality monitoring programme. The findings from the current study would support this suggestion.
The correlation between mental health outcomes and variables such as air quality satisfaction, thermal environment satisfaction, and alcohol consumption status shows the complex relationship between environmental factors and psychological well-being. Emerging evidence suggests that exposure to air pollution, both indoors and outdoors, may precipitate neurocognitive disorders and adversely affect mental health through mechanisms such as neuroinflammation, oxidative stress, and cerebrovascular damage [49,50,51,52]. These pathophysiological changes are linked to the onset of depression via neurotransmitter and hormonal dysregulation [53], with long-term exposure to particulate matter (PM2.5) and nitrogen dioxide (NO2) significantly elevating the risk of depression [54].
Additionally, dissatisfaction with the indoor temperature has been identified as a determinant of mental health scores among low-income residents [55], with extreme temperatures being associated with a spectrum of mental health issues, from increased suicide risk to worsened self-reported well-being [56,57].
The complex relationship between environmental factors and psychological well-being is further complicated by the role of alcohol consumption. This study found that frequent alcohol consumption (≥4 times per week) significantly negatively predicts the self-rated mental health component but not the physical health of social housing residents. According to previous studies, those with an increasing drinking trajectory had an increased risk of experiencing physical and mental health morbidity and mortality as well as an economic disadvantage [58,59]. A recent systematic review of the role of alcohol use in socio-economic inequalities concluded that people with heavy episodic alcohol use explained a significant share of socio-economic inequalities in mortality of 27% compared to the high socio-economic status individuals [60]. Individuals experiencing environmental discomfort or dissatisfaction may resort to alcohol as a coping mechanism, potentially leading to a cycle where alcohol use exacerbates mental health issues, thereby reinforcing the negative impact of suboptimal living conditions on psychological well-being [61,62,63]. These findings highlight the critical need for comprehensive environmental health strategies that address air quality and thermal comfort to mitigate their potential impacts on mental health.
A review of indoor air quality indexes by Pourkiaei and Romain [64] indicated that objective measurements rather than subjective surveys had become more prevalent in air quality research. Future work should try to readdress this balance, given the importance of non-objective environmental and behavioural components on a person’s perception of their air quality and their physical and mental health.

5. Conclusions

This study investigated the complex relationships between indoor environmental quality (IEQ), lifestyle behaviours, and health outcomes among residents of social housing in the Zerdely micro-district. The findings show that satisfaction with air quality and thermal comfort, alongside factors such as age, smoking habits, employment status, educational level, and alcohol consumption, significantly influence both physical and mental health. These results highlight the complex interaction between the built environment and resident well-being, emphasising the importance of considering both objective and subjective assessments of IEQ in research.
This study emphasises the need to design and maintain social housing that not only meets physical standards of air quality and thermal comfort but also addresses the perceptions and behaviours of residents. Integrating objective measures of environmental quality with residents’ subjective experiences will provide a more comprehensive understanding of how IEQ impacts health and well-being.
In conclusion, by emphasising the importance of IEQ in the health outcomes of social housing tenants, this study contributes to the ongoing discussion around public health, urban planning, and social policy. It calls for a multidisciplinary approach to housing design that prioritises the health and satisfaction of residents in social housing settings, resulting in more equal and healthy urban communities.

Author Contributions

Conceptualisation, M.K., J.D. and S.S.; methodology, M.K.; formal analysis, M.K. and J.D.; writing—original draft preparation, M.K.; writing—review and editing, J.D. and S.S.; supervision, S.S. and J.D. All authors have read and agreed to the published version of the manuscript.

Funding

This research received no external funding.

Institutional Review Board Statement

The questionnaire used in this study received ethical approval from the University of Liverpool’s Ethics Committee (approved 19 July 2022; reference number 11123).

Informed Consent Statement

Informed consent was obtained from all subjects involved in the study.

Data Availability Statement

Data is contained within the article. The original contributions presented in the study are included in the article, and further inquiries can be directed to the corresponding author.

Acknowledgments

The authors gratefully acknowledge the fifteen trained interviewers from the Department of Pharmaceutical Technology of Asfendiyarov Kazakh National Medical University who volunteered to administer the face-to-face questionnaire survey.

Conflicts of Interest

The authors declare no conflicts of interest.

References

  1. KazHydroMet. Climate of Kazakhstan. National Hydrometeorological Service of the Republic of Kazakhstan. 2023. Available online: https://www.kazhydromet.kz/en/klimat/klimat-kazahstana-1 (accessed on 4 March 2024).
  2. Center for Economic Research. Urbanization in Central Asia: Challenges, Issues and Prospects; Analytical Report no. 2013/03; Center for Economic Research: Tashkent, Uzbekistan, 2013. [Google Scholar]
  3. Haito, M.A.; Zhan, S.U.N. Comprehensive urbanization level and its dynamic factors for five Central Asian countries. J. Geogr. Sci. 2020, 30, 1761–1780. [Google Scholar]
  4. Bureau of National Statistics. Demographic Situation for January 2022. 2022. Available online: https://www.gov.kz/memleket/entities/stat/press/news/details/341359?lang=en (accessed on 10 December 2023).
  5. Nurlanova, N.K.; Tleuberdinova, A.; Saparbek, N. The Main Factors and Trends of Urbanization in Kazakhstan: Analysis and Recommendations. Econ. Strat. Pract. 2022, 17, 62–79. [Google Scholar] [CrossRef]
  6. Agaidarov, A.; Rahardja, S.; Vawda, A.; Aragones, V.; Hutson, N.; Milne, P.J. Kazakhstan Economic Update: Economic Recovery During Challenging Times 2023. Available online: https://documents1.worldbank.org/curated/en/099319004172398510/pdf/IDU0336efa090a5ea047bc09e560dd1e8a21f03f.pdf (accessed on 4 March 2024).
  7. Sadvakasov, D. On the Brink of Poverty: Why Do We Need to Raise the Issue of Inequality in Kazakhstan and How to Solve It? Steppe. 15 July 2021. Available online: https://the-steppe.com/lyudi/na-grani-nishchety-pochemu-nuzhno-podnimat-vopros-neravenstva-v-kazahstane-i-kak-ego-reshit (accessed on 4 March 2024).
  8. Sermagambet, U.; Satpayeva, Z.; Smagulova, G.; Urban, W.; Yessenzhigitova, R. Socio-Economic Inequality in Kazakhstani Regions: Assessment and Impact on Regional Development Management. Probl. Perspect. Manag. 2022, 20, 487–500. [Google Scholar] [CrossRef]
  9. Mukayev, D.; Shalbolova, U.; Tanaś, J. Housing Affordability Analysis in Kazakhstan Based on D-HAQ Model. J. Int. Stud. 2022, 15, 28–42. [Google Scholar] [CrossRef]
  10. United Nations Economic Commission for Europe. Country Profiles on the Housing Sector: Republic of Kazakhstan. In UNECE Country Profiles on Urban Development, Housing and Land Management; United Nations Economic Commission for Europe: Geneva, Switzerland, 2018; Volume ECE/HBP/18, Available online: https://unece.org/sites/default/files/2022-01/CP_Kazakhstan_web.ENG_.pdf (accessed on 4 March 2024).
  11. Engels, F. The Housing Question. 1872. Available online: https://www.marxists.org/archive/marx/works/1872/housing-question/ (accessed on 10 November 2023).
  12. Poggio, T.; Whitehead, C. Social housing in Europe: Legacies, new trends and the crisis. Crit. Hous. Anal. 2016, 4, 2–8. [Google Scholar] [CrossRef]
  13. Struyk, R.J. Homeownership and Housing Finance Policy in the Former Soviet Bloc—Costly Populism; Urban Institute: Washington, DC, USA, 2016. [Google Scholar]
  14. Seitz, W. Urbanization in Kazakhstan: Desirable cities, unaffordable housing, and the missing rental market. Int. J. Urban Sci. 2021, 25 (Suppl. S1), 135–166. [Google Scholar] [CrossRef]
  15. Jones, P. Russia’s war against Ukraine and the future of Kazakhstan’s foreign policy. J. Int. Aff. 2023, 75, 97–108. [Google Scholar]
  16. IWPR. Central Asians Fight in Ukraine Eyeing Russian Citizenship. Institute for War & Peace Reporting. 19 April 2022. Available online: https://iwpr.net/global-voices/central-asians-fight-ukraine-eyeing-russian-citizenship (accessed on 11 November 2023).
  17. Akorda. The Head of State Held a Meeting on the Development of the Capital City. Official Website of the President of the Republic of Kazakhstan. 2023. Available online: https://www.akorda.kz/ru/glava-gosudarstva-provel-soveshchanie-po-voprosam-razvitiya-stolicy-1163959 (accessed on 4 November 2023).
  18. Orynkanova, A.; Zaritovskaya, T.; Demjanjuk, I.; Beisenova, A.; Abenova, F.; Ablyamitova, A.; Mukanova, Z.; Gorbunova, A.; Krumbergs, R.; Khusainova, D.; et al. A Comprehensive Study of Social Housing in Two Neighbourhoods of Almaty—“Zerdeli” and “Shugyla”. 2022. Available online: https://urbanforum.kz/ufksocialhousing (accessed on 12 November 2023).
  19. Braubach, F.; Fairburn, J. Social inequities in environmental risks associated with housing and residential location—A review of evidence. Eur. J. Public Health 2010, 20, 36–42. [Google Scholar] [CrossRef] [PubMed]
  20. Duncan, D.T.; Kawachi, I. Neighborhoods and Health, 2nd ed.; Oxford University Press: Oxford, UK, 2018. [Google Scholar]
  21. Adamkiewicz, G.; Zota, A.R.; Fabian, M.P.; Chahine, T.; Julien, R.; Spengler, J.D.; Levy, J.I. Moving environmental justice indoors: Understanding structural influences on residential exposure patterns in low-income communities. Am. J. Public Health 2011, 101 (Suppl. S1), S238–S245. [Google Scholar] [CrossRef]
  22. Colton, M.D.; MacNaughton, P.; Vallarino, J.; Kane, J.; Bennett-Fripp, M.; Spengler, J.D.; Adamkiewicz, G. Indoor air quality in green vs. conventional multifamily low-income housing. Environ. Sci. Technol. 2014, 48, 7833–7841. [Google Scholar] [CrossRef]
  23. Mavrogianni, A.; Taylor, J.; Davies, M.; Thoua, C.; Kolm-Murray, J. Urban social housing resilience to excess summer heat. Build. Res. Inf. 2015, 43, 316–333. [Google Scholar] [CrossRef]
  24. Daly, D.; Harada, T.; Tibbs, M.; Cooper, P.; Waitt, G.; Tartarini, F. Indoor temperatures and energy use in NSW social housing. Energy Build. 2021, 249, 1112402021. [Google Scholar] [CrossRef]
  25. Haddad, S.; Paolini, R.; Synnefa, A.; De Torres, L.; Prasad, D.; Santamouris, M. Integrated assessment of the extreme climatic conditions, thermal performance, vulnerability, and well-being in low-income housing in the subtropical climate of Australia. Energy Build. 2022, 272, 112349. [Google Scholar] [CrossRef]
  26. Vinnikov, D.; Raushanova, A.; Romanova, Z.; Tulekov, Z. Health-related quality of life in a general population sample in Kazakhstan and its sociodemographic and occupational determinants. Health Qual Life Outcomes 2021, 19, 199. [Google Scholar] [CrossRef] [PubMed]
  27. Abikulova, A.K.; Tulebaev, K.A.; Akanov, A.A.; Turdalieva, B.S.; Kalmahanov, S.B.; Kumar, A.B.; Izekenova, A.K.; Mussaeva, B.A.; Grjibovski, A.M. Inequalities in self-rated health among 45+ year-olds in Almaty, Kazakhstan: A cross-sectional study. BMC Public Health 2013, 13, 654. [Google Scholar] [CrossRef] [PubMed]
  28. Spankulova, L.; Karatayev, M.; Clarke, M.L. Trends in Socioeconomic Health Inequalities in Kazakhstan: National Household Surveys Analysis. Communist Post-Communist Stud. 2020, 53, 177–190. [Google Scholar] [CrossRef]
  29. QualityMetric. Available online: https://www.qualitymetric.com/sf-12v2-pro-health-survey-lp/?utm_source=Google&utm_medium=Text&utm_campaign=SF&utm_id=SF12&gclid=EAIaIQobChMIuJHSjJbOgwMVk853Ch1WJgO1EAAYASAAEgIFvfD_BwE2023 (accessed on 12 November 2023).
  30. Gandek, B.; Ware, J.E.; Aaronson, N.K.; Apolone, G.; Bjorner, J.B.; Brazier, J.E.; Bullinger, M.; Kaasa, S.; Leplege, A.; Prieto, L.; et al. Cross-validation of item selection and scoring for the SF-12 Health Survey in nine countries: Results from the IQOLA Project. J. Clin. Epidemiol. 1998, 51, 1171–1178. [Google Scholar] [CrossRef] [PubMed]
  31. Sansom, G.T.; Kirsch, K.; Horney, J.A. Using the 12-item short form health survey (SF-12) to assess self rated health of an engaged population impacted by hurricane Harvey, Houston, TX. BMC Public Health 2020, 20, 257. [Google Scholar] [CrossRef] [PubMed]
  32. Larson, C.O. Use of the SF-12 instrument for measuring the health of homeless persons. Health Serv. Res. 2002, 37, 733–750. [Google Scholar] [CrossRef]
  33. National Telecommunications LLC. Weather in Almaty. Air Temperature and Precipitation. September 2022. 2022. Available online: https://www.pogodaiklimat.ru/monitor.php?id=36870&month=9&year=2022 (accessed on 6 March 2024).
  34. Tsubouchi, K.; Mori, S.; Nomura, R. Actual Conditions and a Planning Review of Collective Relocation Site from the View of Changes in Neighborhood Relationships: Focusing on the Collective Relocation Project for Disaster Prevention in Koizumimachi District, Kesennuma City, Japan. Jpn. Arch. Rev. 2023, 6, 6–13. [Google Scholar] [CrossRef]
  35. Khalis, P.; Adianto, J. A Preliminary Study of Housing Satisfaction, Mobility, and Adaptation of the Jakartans in 2020–2021. Int. J. Built Environ. Sci. Res. 2022, 6, 2–19. [Google Scholar] [CrossRef]
  36. IBM® SPSS® Statistics. 2023. Available online: https://www.ibm.com/spss?p1=Search&p4=43700077577385563&p5=p&gclsrc=aw.ds (accessed on 8 December 2022).
  37. Jackson, S.E.; Cheeseman, H.; Arnott, D.; Titmarsh, R.; Brown, J. Smoking in Social Housing Among Adults in England, 2015–2020: A Nationally Representative Survey. BMJ Open 2022, 12, e061013. [Google Scholar] [CrossRef]
  38. Pollack, C.E.; Cubbin, C.; Ahn, D.; Winkleby, M. Neighbourhood Deprivation and Alcohol Consumption: Does the Availability of Alcohol Play a Role? Int. J. Epidemiol. 2005, 34, 772–779. [Google Scholar] [CrossRef]
  39. Lakshman, R.; McConville, A.; How, S.; Flowers, J.; Wareham, N.; Cosford, P. Association Between Area-Level Socioeconomic Deprivation and a Cluster of Behavioural Risk Factors: Cross-Sectional, Population-Based Study. J. Public Health 2011, 33, 234–243. [Google Scholar] [CrossRef] [PubMed]
  40. Algren, M.H.; Bak, C.K.; Berg-Beckhoff, G.; Andersen, P.T. Health-Risk Behaviour in Deprived Neighbourhoods Compared with Non-Deprived Neighbourhoods: A Systematic Literature Review of Quantitative Observational Studies. PLoS ONE 2015, 10, e0139297. [Google Scholar] [CrossRef] [PubMed]
  41. Abdrakhmanova, S.; Slazhnyova, T.; Adayeva, A.; Ciobanu, A.; Vremis, L.; Palipudi, K. The Global Adult Tobacco Survey. 2019. Available online: https://cdn.who.int/media/docs/default-source/ncds/ncd-surveillance/data-reporting/kazakhstan/gats-kazakhtstan-eng-web.pdf?sfvrsn=89ea4372_3&download=true (accessed on 6 March 2024).
  42. Glushkova, N.; Smailova, D.; Namazbayeva, Z.; Mukasheva, G.; Zhamakurova, A.; Kuanyshkalieva, A.; Karibayeva, I.K.; Kauysheva, A.; Otyzbayeva, N.; Kulzhanov, M. Prevalence of Smoking Various Tobacco Types in the Kazakhstani Adult Population in 2021: A Cross-Sectional Study. Int. J. Environ. Res. Public Health 2023, 20, 1509. [Google Scholar] [CrossRef] [PubMed]
  43. Arvanitakis, J. The Heterogenous Citizen. M/C J. 2008, 10. [Google Scholar] [CrossRef]
  44. Northridge, J.; Ramirez, O.; Stingone, J.; Claudio, L. The Role of Housing Type and Housing Quality in Urban Children with Asthma. J. Urban Health 2010, 87, 211–224. [Google Scholar] [CrossRef]
  45. Vakalis, D.; Touchie, M.; Tzekova, E.; MacLean, H.L.; Siegel, J.A. Indoor environmental quality perceptions of social housing residents. Build. Environ. 2019, 150, 135–143. [Google Scholar] [CrossRef]
  46. Langer, S.; Ramalho, O.; Derbez, M.; Ribéron, J.; Kirchner, S.; Mandin, C. Indoor environmental quality in French dwellings and building characteristics. Atmos. Environ. 2016, 128, 82–91. [Google Scholar] [CrossRef]
  47. Alapieti, T.; Vornanen-Winqvist, C.; Mikkola, R.; Salonen, H. Measured and perceived indoor air quality in three low-energy wooden test buildings. Wood Mater. Sci. Eng. 2023, 18, 827–840. [Google Scholar] [CrossRef]
  48. Pei, J.; Qu, M.; Sun, L.; Wang, X.; Yin, Y. The relationship between indoor air quality (IAQ) and perceived air quality (PAQ)—A review and case analysis of Chinese residential environment. Energy Built Environ. 2024, 5, 230–243. [Google Scholar] [CrossRef]
  49. Babadjouni, R.M.; Hodis, D.M.; Radwanski, R.; Durazo, R.; Patel, A.; Liu, Q.; Mack, W.J. Clinical Effects of Air Pollution on the Central Nervous System; A Review. J. Clin. Neurosci. 2017, 43, 16–24. [Google Scholar] [CrossRef] [PubMed]
  50. Li, W.; Dorans, K.S.; Wilker, E.H.; Rice, M.B.; Ljungman, P.L.; Schwartz, J.D.; Coull, B.A.; Koutrakis, P.; Gold, D.R.; Keaney, J.F.; et al. Short-Term Exposure to Ambient Air Pollution and Biomarkers of Systemic Inflammation: The Framingham Heart Study. Arterioscler. Thromb. Vasc. Biol. 2017, 37, 1793–1800. [Google Scholar] [CrossRef] [PubMed]
  51. Lee, H.; Myung, W.; Jeong, B.H.; Choi, H.; Jhun, B.W.; Kim, H. Short- and Long-Term Exposure to Ambient Air Pollution and Circulating Biomarkers of Inflammation in Non-Smokers: A Hospital-Based Cohort Study in South Korea. Environ. Int. 2018, 119, 264–273. [Google Scholar] [CrossRef] [PubMed]
  52. Bhui, K.; Newbury, J.B.; Latham, R.M.; Ucci, M.; Nasir, Z.A.; Turner, B.; O’Leary, C.; Fisher, H.L.; Marczylo, E.; Douglas, P.; et al. Air Quality and Mental Health: Evidence, Challenges and Future Directions. BJPsych Open 2023, 9, e120. [Google Scholar] [CrossRef] [PubMed]
  53. Li, H.; Cai, J.; Chen, R.; Zhao, Z.; Ying, Z.; Wang, L.; Chen, J.; Hao, K.; Kinney, P.L.; Chen, H.; et al. Particulate Matter Exposure and Stress Hormone Levels. Circulation 2017, 136, 618–627. [Google Scholar] [CrossRef] [PubMed]
  54. Borroni, E.; Pesatori, A.C.; Bollati, V.; Buoli, M.; Carugno, M. Air Pollution Exposure and Depression: A Comprehensive Updated Systematic Review and Meta-Analysis. Environ. Pollut. 2022, 292, 118245. [Google Scholar] [CrossRef]
  55. Liddell, C.; Morris, C. Fuel Poverty and Human Health: A Review of Recent Evidence. Energy Policy 2010, 38, 2987–2997. [Google Scholar] [CrossRef]
  56. Hanigan, I.; Butler, C.; Kokic, P.; Hutchinson, M. Suicide and Drought in New South Wales, Australia, 1970–2007. Proc. Natl. Acad. Sci. USA 2012, 109, 13950–13955. [Google Scholar] [CrossRef]
  57. Heo, S.; Lee, W.; Bell, M. Suicide and Associations with Air Pollution and Ambient Temperature: A Systematic Review and Meta-Analysis. Int. J. Environ. Res. Public Health 2021, 18, 7699. [Google Scholar] [CrossRef] [PubMed]
  58. Melchior, M.; Berkman, L.F.; Kawachi, I.; Krieger, N.; Zins, M.; Bonenfant, S.; Goldberg, M. Lifelong Socioeconomic Trajectory and Premature Mortality (35–65 Years) in France: Findings from the GAZEL Cohort Study. J. Epidemiol. Community Health 2006, 60, 937–944. [Google Scholar] [CrossRef] [PubMed]
  59. Black, B.S.; Rabins, P.V.; McGuire, M.H. Alcohol Use Disorder is a Risk Factor for Mortality Among Older Public Housing Residents. Int. Psychogeriatr. 1998, 10, 309–327. [Google Scholar] [CrossRef] [PubMed]
  60. Probst, C.; Kilian, C.; Sanchez, S.; Lange, S.; Rehm, J. The Role of Alcohol Use and Drinking Patterns in Socioeconomic Inequalities in Mortality: A Systematic Review. Lancet Public Health 2020, 5, 324–332. [Google Scholar] [CrossRef] [PubMed]
  61. Quiroz-Reyes, J.; Bojorquez-Chapela, I.; Colchero, M. Psychological Discomfort and Binge Drinking in Mexican Adults. Salud Pública México 2022, 64, 498–506. [Google Scholar] [CrossRef]
  62. Mahdinia, M.; Yarandi, M.; Fallah, H.; Soltanzadeh, A. Modeling Cause-and-Effect Relationships Among Variables Affecting Work Stress Based on Fuzzy DEMATEL Method. J. Public Ment. Health 2022, 21, 341–356. [Google Scholar] [CrossRef]
  63. Yamashita, T.; Kim, G.; Liu, D.; Bardo, A. Associations between Perceived Environmental Pollution and Mental Health in Middle-aged and Older Adults in East Asia. Asia Pac. J. Public Health 2020, 33, 109–112. [Google Scholar] [CrossRef]
  64. Pourkiaei, M.; Romain, A.-C. Scoping review of indoor air quality indexes: Characterization and applications. J. Build. Eng. 2023, 75, 106703. [Google Scholar] [CrossRef]
Figure 1. Research design: independent, covariate, and dependent variables.
Applsci 14 02513 g001
Figure 2. Views of the surveyed social housing complex, Almaty, Kazakhstan.
Applsci 14 02513 g002
Table 1. Descriptive statistics of respondent’s characteristics.
VariableItemnPercentage
GenderMale17841.3
Female24857.5
Prefer not to disclose51.2
Age≤206013.9
21–256916.0
26–306414.8
31–357417.2
36–406314.6
41≥10123.4
Smoking status- Never smoked28866.8
- Used to smoked7116.5
- Smoke occasionally388.8
- Smoke less than 5
  cigarettes daily
133.0
- Smoke 5–15
  cigarettes daily
133.0
- Smoke more than 15
  cigarettes daily
61.4
- Smoke tobacco
  products other than
  cigarettes daily
20.5
Alcohol
Consumption Status
Never28866.8
Monthly or less11526.7
2–4 times a month173.9
2–3 times per week40.9
≥4 times per week71.6
Employment StatusEmployed full-time18242.2
Employed part-time276.3
Self-employed/freelance4510.4
Studying6114.2
Retired358.1
Unemployed4410.2
Not able to work71.6
Prefer not to say307.0
Educational LevelPrimary school30.7
Secondary school8219.0
Higher secondary education or technical and vocational
education
13932.3
College or University12829.7
Postgraduate degree358.1
Prefer not to say4410.2
Table 2. Characteristics of built environment conditions in surveyed social housing.
VariableItem% of Respondents (n = 431)
Responses by floor level1–472.9
≥927.1
Frequency of personally
adjusted items
None of these or the other0.2
1 item32.3
2 items35.5
3 items16
4 items12.5
5 items3.2
7 items0.2
Table 3. Correlation analysis between 15 variables, including demographic and socio-economic, housing and environmental conditions, and health status (n = 431).
123456789101112131415
Age1
Gender0.0851
Smo_stat0.123 *−0.404 **1
Alc_stat0.163 **−0.217 **0.495 **1
Emp_stat0.0430.160 **−0.0140.0181
Edu_stat0.0830.0670.0050.0740.171 **1
L_dura0.225 **0.064−0.0330.074−0.007−0.0691
H_floor −0.034−0.0400.008−0.0410.0070.069−0.0421
Num_Tcontrol−0.102 *0.0670.030−0.044−0.075−0.013−0.0020.0411
OS_T0.068−0.0400.0680.173 **0.025−0.0390.105 *0.012−0.0291
Num_Tdis0.040−0.0300.099 *0.069−0.0300.0170.0220.0780.260 **0.156 **1
OS_AQ0.0660.047−0.0670.130 **−0.0210.0140.155 **−0.003−0.0450.430 **0.185 **1
Num_Odo−0.0870.005−0.009−0.012−0.0540.012−0.0820.0270.197 **−0.132 **0.204 **0.0321
PCS−0.234 **0.028−0.184 **−0.145 **−0.0800.039−0.067−0.0040.008−0.126 **−0.100 *−0.250 **0.0431
MCS0.025−0.028−0.019−0.127 **0.0370.039−0.103 *0.0010.019−0.192 **−0.007−0.293 **−0.0320.165 **1
Pearson correlation significant: * p < 0.05, ** p < 0.01.
Table 4. Multiple regression analysis with PCS as outcome variable.
VariableModel 1Model 2Model 3
BSEBSEBSE
Constant54.478 ***0.91854.679 ***1.09658.250 ***1.759
Num_Tcontrol0.0120.2710.0150.272−0.1250.265
OS_T−0.0160.187−0.0140.1880.0940.182
Num_Tdis−0.5050.369−0.5030.370−0.2730.358
OS_AQ−0.813 ***0.181−0.801 ***0.183−0.896 ***0.178
Num_Odo0.4370.3380.4230.3400.3020.327
L_dura −0.0480.0960.0390.095
H_floor −0.0070.141−0.0380.136
Age −0.724 ***0.172
Gender −0.0640.578
Smo_stat −0.953 ***0.305
Alc_stat −0.0050.445
Emp_stat −0.259 **0.129
Edu_stat 0.418 *0.243
R20.0690.0700.156
𝛥R2 0.0010.086
Significant: * p < 0.1, ** p < 0.05, *** p < 0.01.
Table 5. Multiple regression analysis with MCS as outcome variable.
VariableModel 1Model 2Model 3
BSEBSEBSE
Constant54.843 ***1.43655.632 ***1.71256.129 ***2.859
Num_Tcontrol−0.0340.424−0.0220.4240.0750.430
OS_T−0.543 *0.293−0.532 *0.293−0.4700.296
Num_Tdis0.7890.5760.7940.5780.7770.581
OS_AQ−1.430 ***0.283−1.383 ***0.285−1.351 ***0.289
Num_Odo−0.5390.528−0.5960.531−0.5310.531
L_dura −0.1930.150−0.2120.155
H_floor −0.0220.221−0.0550.221
Age 0.4270.280
Gender −1.0650.938
Smo_stat −0.2030.496
Alc_stat −1.282 *0.723
Emp_stat 0.1540.210
Edu_stat 0.2860.394
R20.0970.1000.116
𝛥R2 0.0040.016
Significant: * p < 0.1, *** p < 0.01.
Table 6. Multiple regression analysis with thermal control factors as part of the independent variables and overall satisfaction with temperature as the outcome variable.
VariableModel 1Model 2Model 3
BSEBSEBSE
Constant2.462 ***0.2402.209 ***0.3081.770 ***0.510
C_blinds0.0670.236−0.1100.334−0.1200.336
C_AC−0.792 ***0.173−0.889 ***0.267−0.861 ***0.271
C_por_heater0.2580.3430.0980.4210.0920.420
C_fix_heater0.2850.1850.1530.2760.1270.278
C_airvent0.2380.4470.0250.521−0.0240.522
C_fan0.1940.2520.0750.3210.0620.322
C_thermostat0.5950.4340.4110.5040.2090.507
C_open_win−0.0300.109−0.0600.129−0.0640.129
C_none1.649 ***0.6231.482 **0.6511.471 **0.670
C_other−1.1411.012−1.3681.037−1.3741.034
L_dura 0.047 *0.0270.0370.028
H_floor 0.0150.0400.0230.040
Num_Tcontrol 0.1300.2180.1640.219
Age 0.0280.052
Gender −0.0190.172
Smo_stat −0.0560.089
Alc_stat 0.379 ***0.129
Emp_stat 0.0060.038
Edu_stat −0.0400.072
R20.0820.0900.112
𝛥R2 0.0080.022
Significant: * p < 0.1, ** p < 0.05, *** p < 0.01. C_blinds: window blinds or shades; C_AC: room air-conditioning unit; C_por_heater: portable heater; C_fix_heater: permanent heater; C_airvent: adjustable air vent in wall or ceiling; C_fan: portable fan; C_thermostat: thermostat; C_open_win: openable window; C_none: none of above; C_other: specific answer.
Table 7. Multiple regression analysis with sources of discomfort as part of the independent variables and overall satisfaction with temperature as the outcome variable.
VariableModel 1Model 2Model 3
BSEBSEBSE
Constant1.761 ***0.2001.489 ***0.2701.211 **0.499
D_hum_high0.1040.3600.1850.6030.1730.603
D_hum_low0.577 ***0.2050.6320.5360.6240.538
D_air_high0.4670.3390.5450.5930.3750.593
D_air_low0.980 ***0.3571.103 *0.6001.077 *0.599
D_solargain0.463 **0.1880.5010.5190.4470.519
D_dra_window−0.1300.201−0.1030.542−0.10.541
D_dra_vents0.3060.5890.3280.7770.2930.777
D_T_imbal1.320 ***0.3471.338 **0.6121.217 **0.614
D_T_stat0.3690.3240.520.6150.440.616
D_stra0.2580.2990.3270.5760.2910.579
D_other0.4390.3290.4290.3290.4760.33
Occu_years 0.066 **0.0270.054 *0.028
Floor 0.0050.0400.0120.04
Num_T_dis −0.0710.527−0.0320.527
Employ_status 0.0380.038
Drinking 0.343 **0.129
Edu_status −0.0660.072
Gender −0.0620.171
Age 0.030.051
Smoking −0.050.09
R20.0780.0910.113
𝛥R2 0.0130.022
Significant: * p < 0.1, ** p < 0.05, *** p < 0.01. D_hum_high: humidity too high; D_hum_low: humidity too low; D_air_high: air movement too high; D_air_low: air movement too low; D_solargain: incoming sun; D_dra_window: drafts from window; D_dra_vents: drafts from vents; D_T_imbal: my area is hotter/colder than other areas; D_T_stat: thermostat is adjusted by other people; D_stra: hot/cold surrounding surfaces; D_other: specific answer.
Table 8. Multiple regression analysis with overall satisfaction with air quality as outcome variable.
VariableModel 1Model 2Model 3
BSEBSEBSE
Constant1.917 ***0.2181.616 ***0.2841.209 **0.506
OD_tob0.366 *0.1920.3940.5160.6560.517
OD_equip−0.2600.288−0.2540.590−0.0690.587
OD_food−0.3490.221−0.2760.526−0.0460.530
OD_furn−1.519 **0.620−1.3690.829−1.0650.824
OD_perfu0.8470.8121.0250.9371.5040.937
OD_produ0.2590.5410.3100.7120.5220.709
OD_out0.894 ***0.2080.866 *0.4981.057 **0.498
OD_other0.503 *0.2690.4020.2720.4270.271
L_dura 0.067 **0.0280.051 *0.029
H_floor 0.0170.0410.0290.041
Num_Odo −0.0300.492−0.2530.492
Age 0.0360.051
Gender 0.0940.172
Smo_stat −0.251 ***0.090
Alc_stat 0.484 ***0.132
Emp_stat −0.0140.038
Edu_stat −0.0230.073
R20.0810.0930.129
𝛥R2 0.0120.036
Significant: * p < 0.1, ** p < 0.05, *** p < 0.01. OD_tob: tobacco smoke; OD_equip: equipment; OD_food: food; OD_furn: carpet or furniture; OD_perfu: perfume; OD_produ: cleaning products; OD_out: outside sources (car, exhaust, smog); OD_other: specific sources (none of the above).
Disclaimer/Publisher’s Note: The statements, opinions and data contained in all publications are solely those of the individual author(s) and contributor(s) and not of MDPI and/or the editor(s). MDPI and/or the editor(s) disclaim responsibility for any injury to people or property resulting from any ideas, methods, instructions or products referred to in the content.

