1. Introduction
Since the 1990s, there have been several major accidents in the maritime transport process, which are considered to be caused by human factors. Human factors have always been an important topic of discussion in the maritime industry, and the lack of abilities acquired by seafarers through education and training is one of the key factors [
1,
2]. In fact, in maritime accident reports, 45% of safety recommendations about human factors are about training, skills, and experience [
3]. Since then, simulators have become one of the time-consuming and costly tools for skills training [
4]. Simulators can provide learners with the actual feel of ships [
5], and they can also be designed to train and measure specific learning outcomes, targeting training according to the student’s level of ability [
6], not only quickly improving students’ technical levels but also enhancing their learning experience [
7]. Creating an engine room learning environment has also become relatively easy and achievable at the current level of technology [
8]. Although traditional onshore engine rooms offer a more realistic learning environment, they have drawbacks such as high safety risks and huge practical costs (equipment maintenance, oil and electricity consumption, etc.) [
9], coupled with the implementation of increasingly strict air emission regulations in the shipping field, which have placed higher demands on ship emissions [
10]. Especially since the MARPOL Convention was issued, emissions of gases such as NOx (nitrogen oxides) and CO
2 (carbon dioxide) have been greatly restricted [
11].
In this context, simulation systems have gradually replaced real systems as the mainstream [
12,
13], especially engine simulators, which have played a significant role in the training of seafarers [
14,
15]. The ship piping network plays an extremely important role in the engine simulation system [
16]. It allows users to intuitively feel the changes in flow, pressure, and other parameters in the piping systems of various systems on ships. The programming of ship piping networks is extremely complex, usually described and calculated based on text, which requires programmers to manually import and process a large amount of data, and usually having a low reuse rate [
17].
In order to increase the efficiency of ship piping network programming and the reuse rate of programs, researchers have made great efforts. In 2018, Wang Erqiang [
18] designed various functional simulation model programs and system simulation interfaces in the Visual Studio integrated environment, completing the simulation of the liquid cargo loading and unloading system of an independent C-type LNG ship. Taking the LNG ship loading operation simulation process as an example, he detailed the calculation process of the parameters inside the liquid cargo tanks during each stage of the loading operation. The developed simulation software has advantages such as a beautiful interface, simple and convenient operation, and strong professionalism. It realizes the operation simulation of the liquid cargo system and further improves the development of liquid cargo simulators for various types of liquefied gas ships, which has certain application value for the operation training of liquefied gas ships, but the modeling process is tedious. In 2017, Wu Dong [
19] established a visualization modeling software using WPF graphical interface technology. The visualization modeling environment provided by the platform made it convenient to build simulation models of ship piping networks. This visualization modeling platform supports the modification of piping network equipment attributes, supports automatic piping network topology analysis, and has the characteristics of a friendly interface, convenient operation, and easy maintenance and management in the later stage, meeting the needs of building and hydraulic calculation of ship piping network simulation models. However, the software cannot be reused. In 2021, Zhou Jia [
20] and others proposed a parameterized modeling method based on the finite element method of piping networks and developed a ship ballast water simulation system using mixed programming methods such as C#, MATLAB, and structured query language. The application on different ships shows that the system has universality and can automatically generate reasonable ballasting schemes according to the target. This method improves the accuracy of calculation but is relatively less operable. In October 2023, Xiaoyu Wu and others [
21] used Microsoft’s WPF graphical interface technology and C# language to build a graphical interface of the ship piping network and used Excel spreadsheets as a means of data input to establish logical models of various pipelines and valve devices on ships, allowing users to intuitively drag and drop controls on the base map of the drawing to visually build the physical model of the real ship’s piping network and customize attributes such as maximum allowable flow and flow direction according to the table. It improves the accuracy and efficiency of data processing and calculation. However, the calculation ability for complex piping networks is poor.
In the field of research on ship piping network system design, the methodology introduced in this paper has obvious innovative points. First, we used a combination of advanced drawing software and the Scalable Vector Graphics (SVG) format to improve the clarity and precision of piping network graphics at different resolutions and sizes, which is a significant technical leap in traditional ship piping network design. Secondly, the core of this study lies in the seamless integration of the Windows Presentation Foundation (WPF) with professional drawing tools, making the visualization of complex piping networks not only more intuitive and efficient but also more flexible when modifying and optimizing the design. In addition, the method of flow and pressure calculation in the study is also innovated, especially in dealing with complex situations such as multiple pumps in parallel and series pipelines. Our developed program can accurately simulate the actual situation, providing users with a simulation platform close to the real operating environment. The integration of these technologies not only optimizes the design process and reduces human errors but also significantly improves the efficiency and reliability of the entire ship piping network system design. This innovative methodology not only provides important reference value for instruction on and practical operation of ship piping networks but also lays a foundation for future research and development in ship piping network system design.
3. Program Development and Implementation
3.1. Implementation of Piping Network Visualization
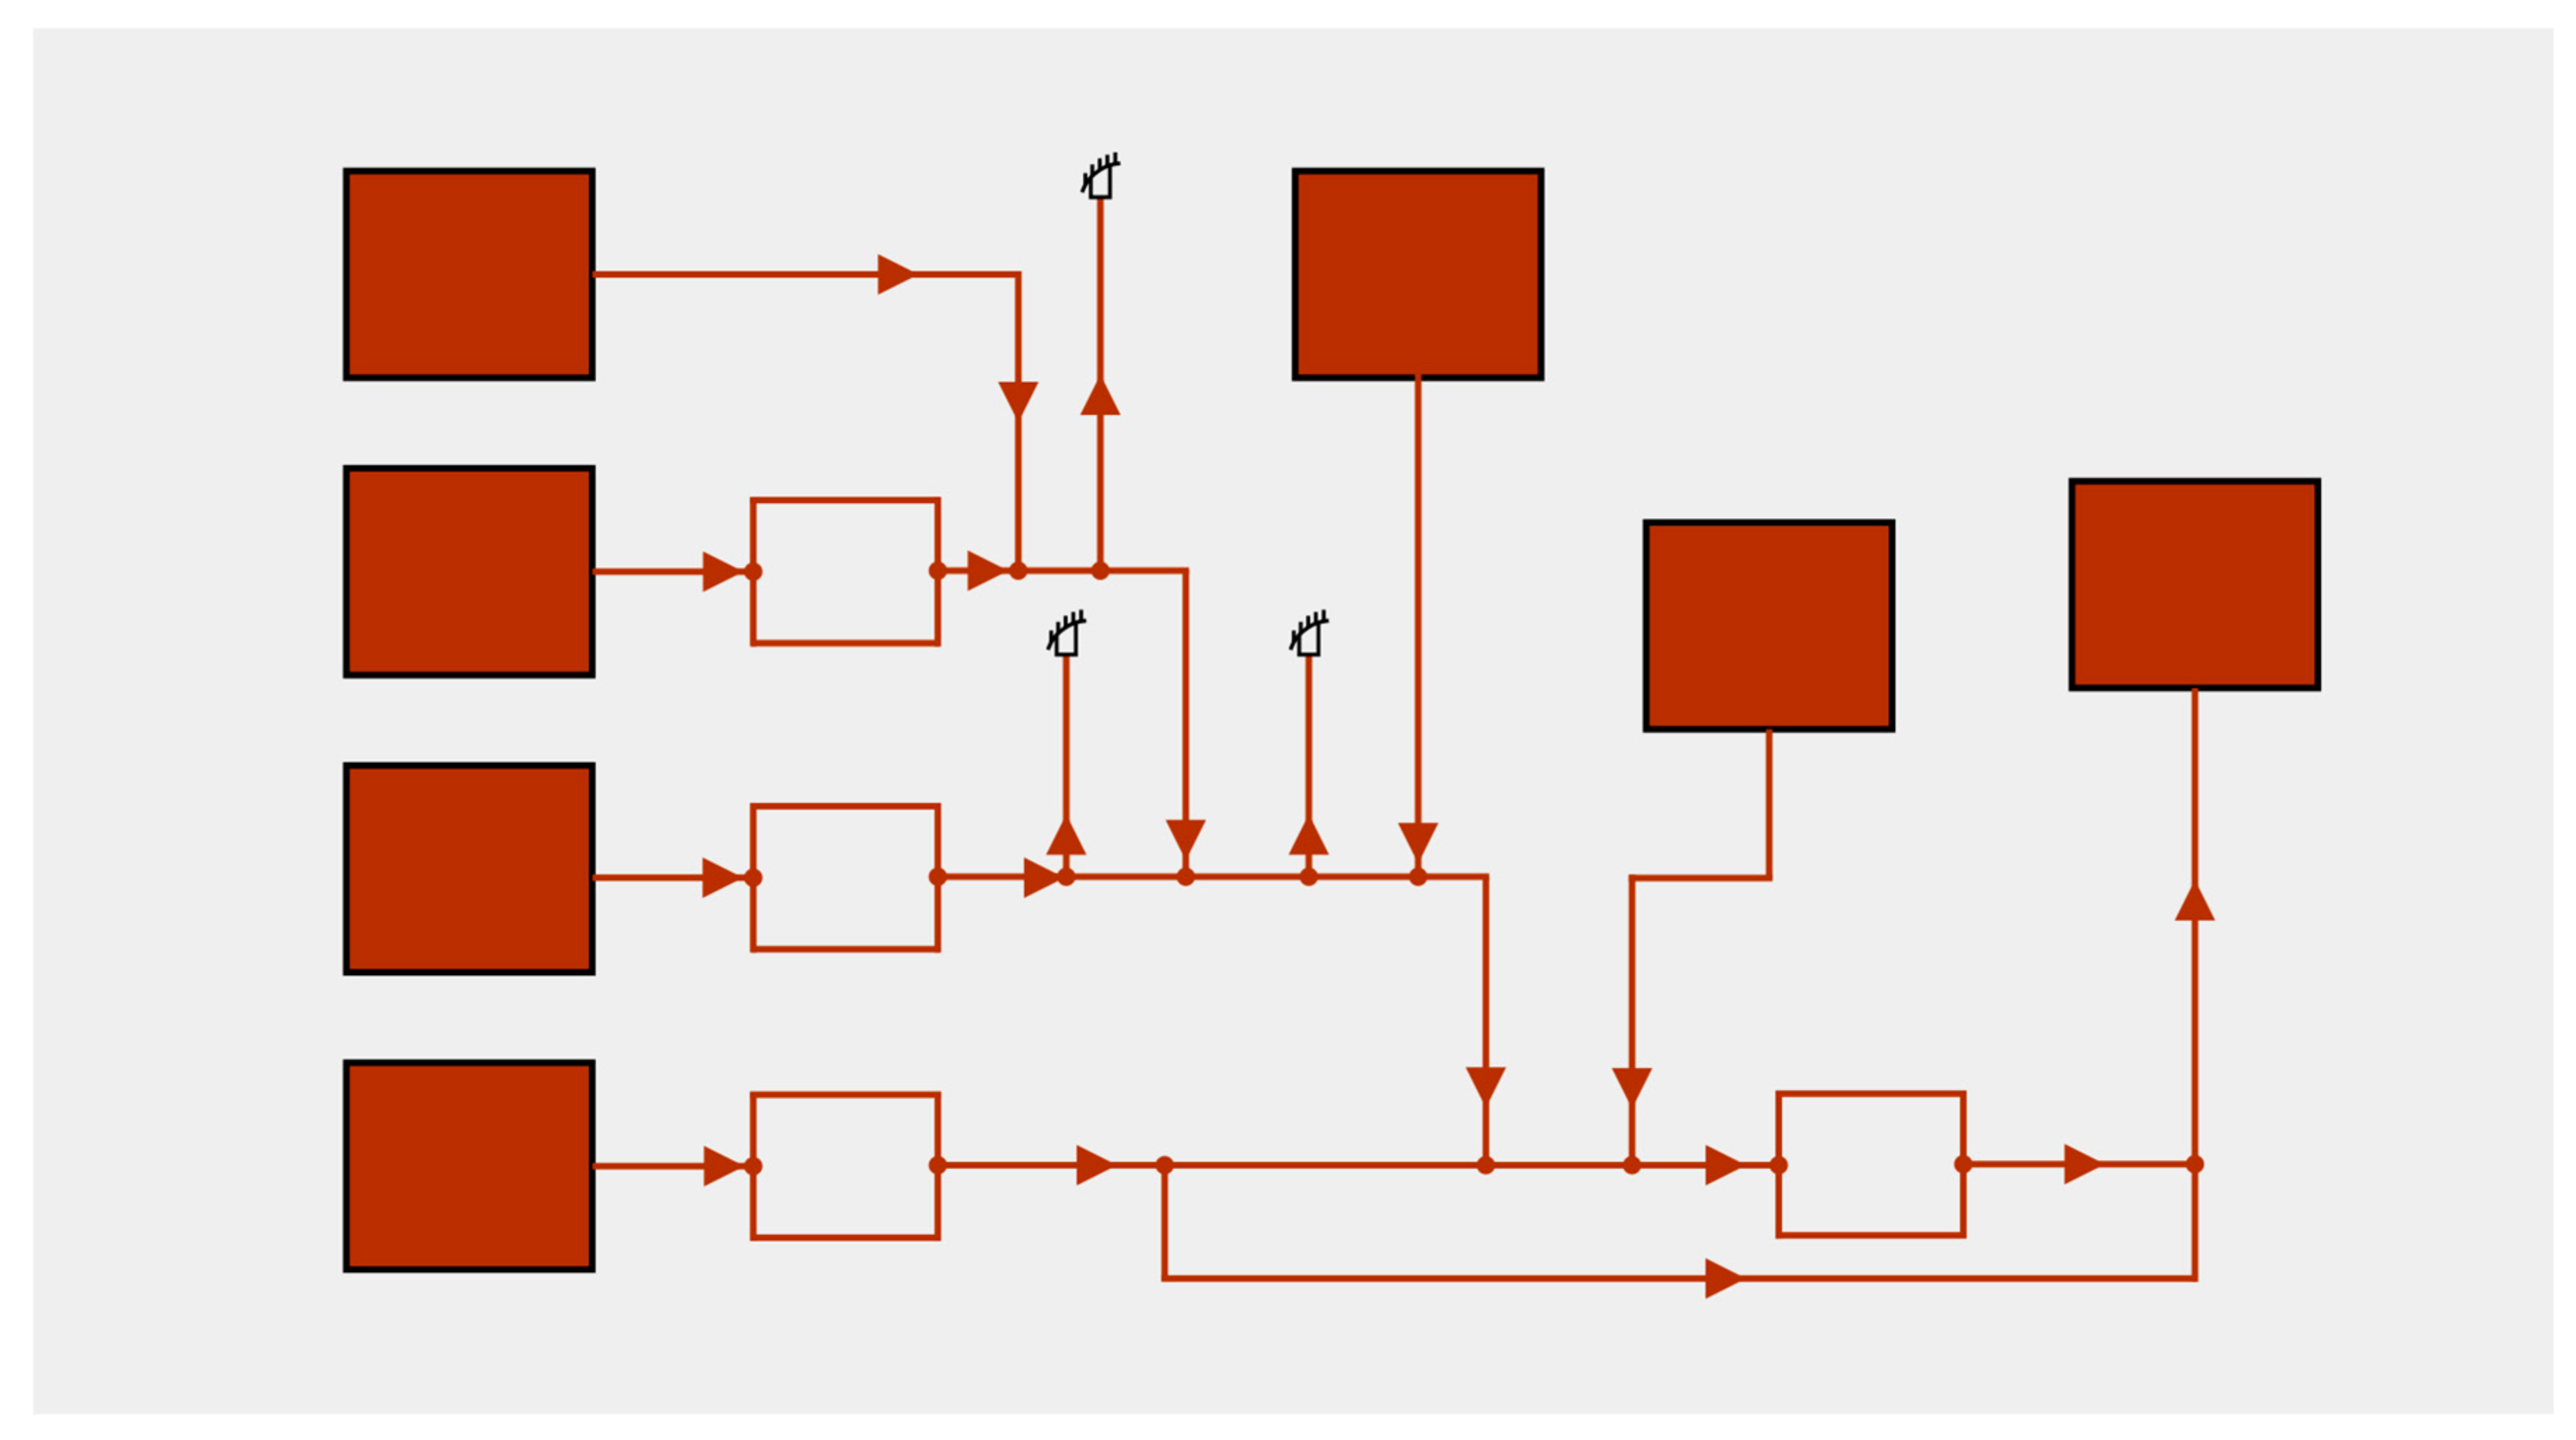
At the initial stage of piping network modeling, we first used advanced drawing software to carefully draw piping schematic diagrams, as shown in
Figure 1. In this schematic diagram, large rectangles represent tanks, and thin lines map out the pipes in the piping network. Arrows are used to indicate the direction of fluid flow in the pipes. We used different colors to distinguish pipes and tanks with different functions. In this paper, the color of pipes and tanks is brown for the sewage system, but users can also set the colors inside pipes and tanks themselves, such as generally using red for firefighting water, black for heavy oil, etc. After completing these detailed drawing tasks, we save the piping diagram in SVG format. Then, these SVG image files are imported into the WPF environment as the basic layer for design work. The significant advantage of this method is that it not only allows us to display the piping network layout in a personalized way but also ensures the clarity and accuracy of the SVG vector graphics at various display sizes and resolutions [
24]. Furthermore, this method allows programmers to easily adjust and optimize piping diagrams to ensure that they meet the precise requirements of complex piping network system designs.
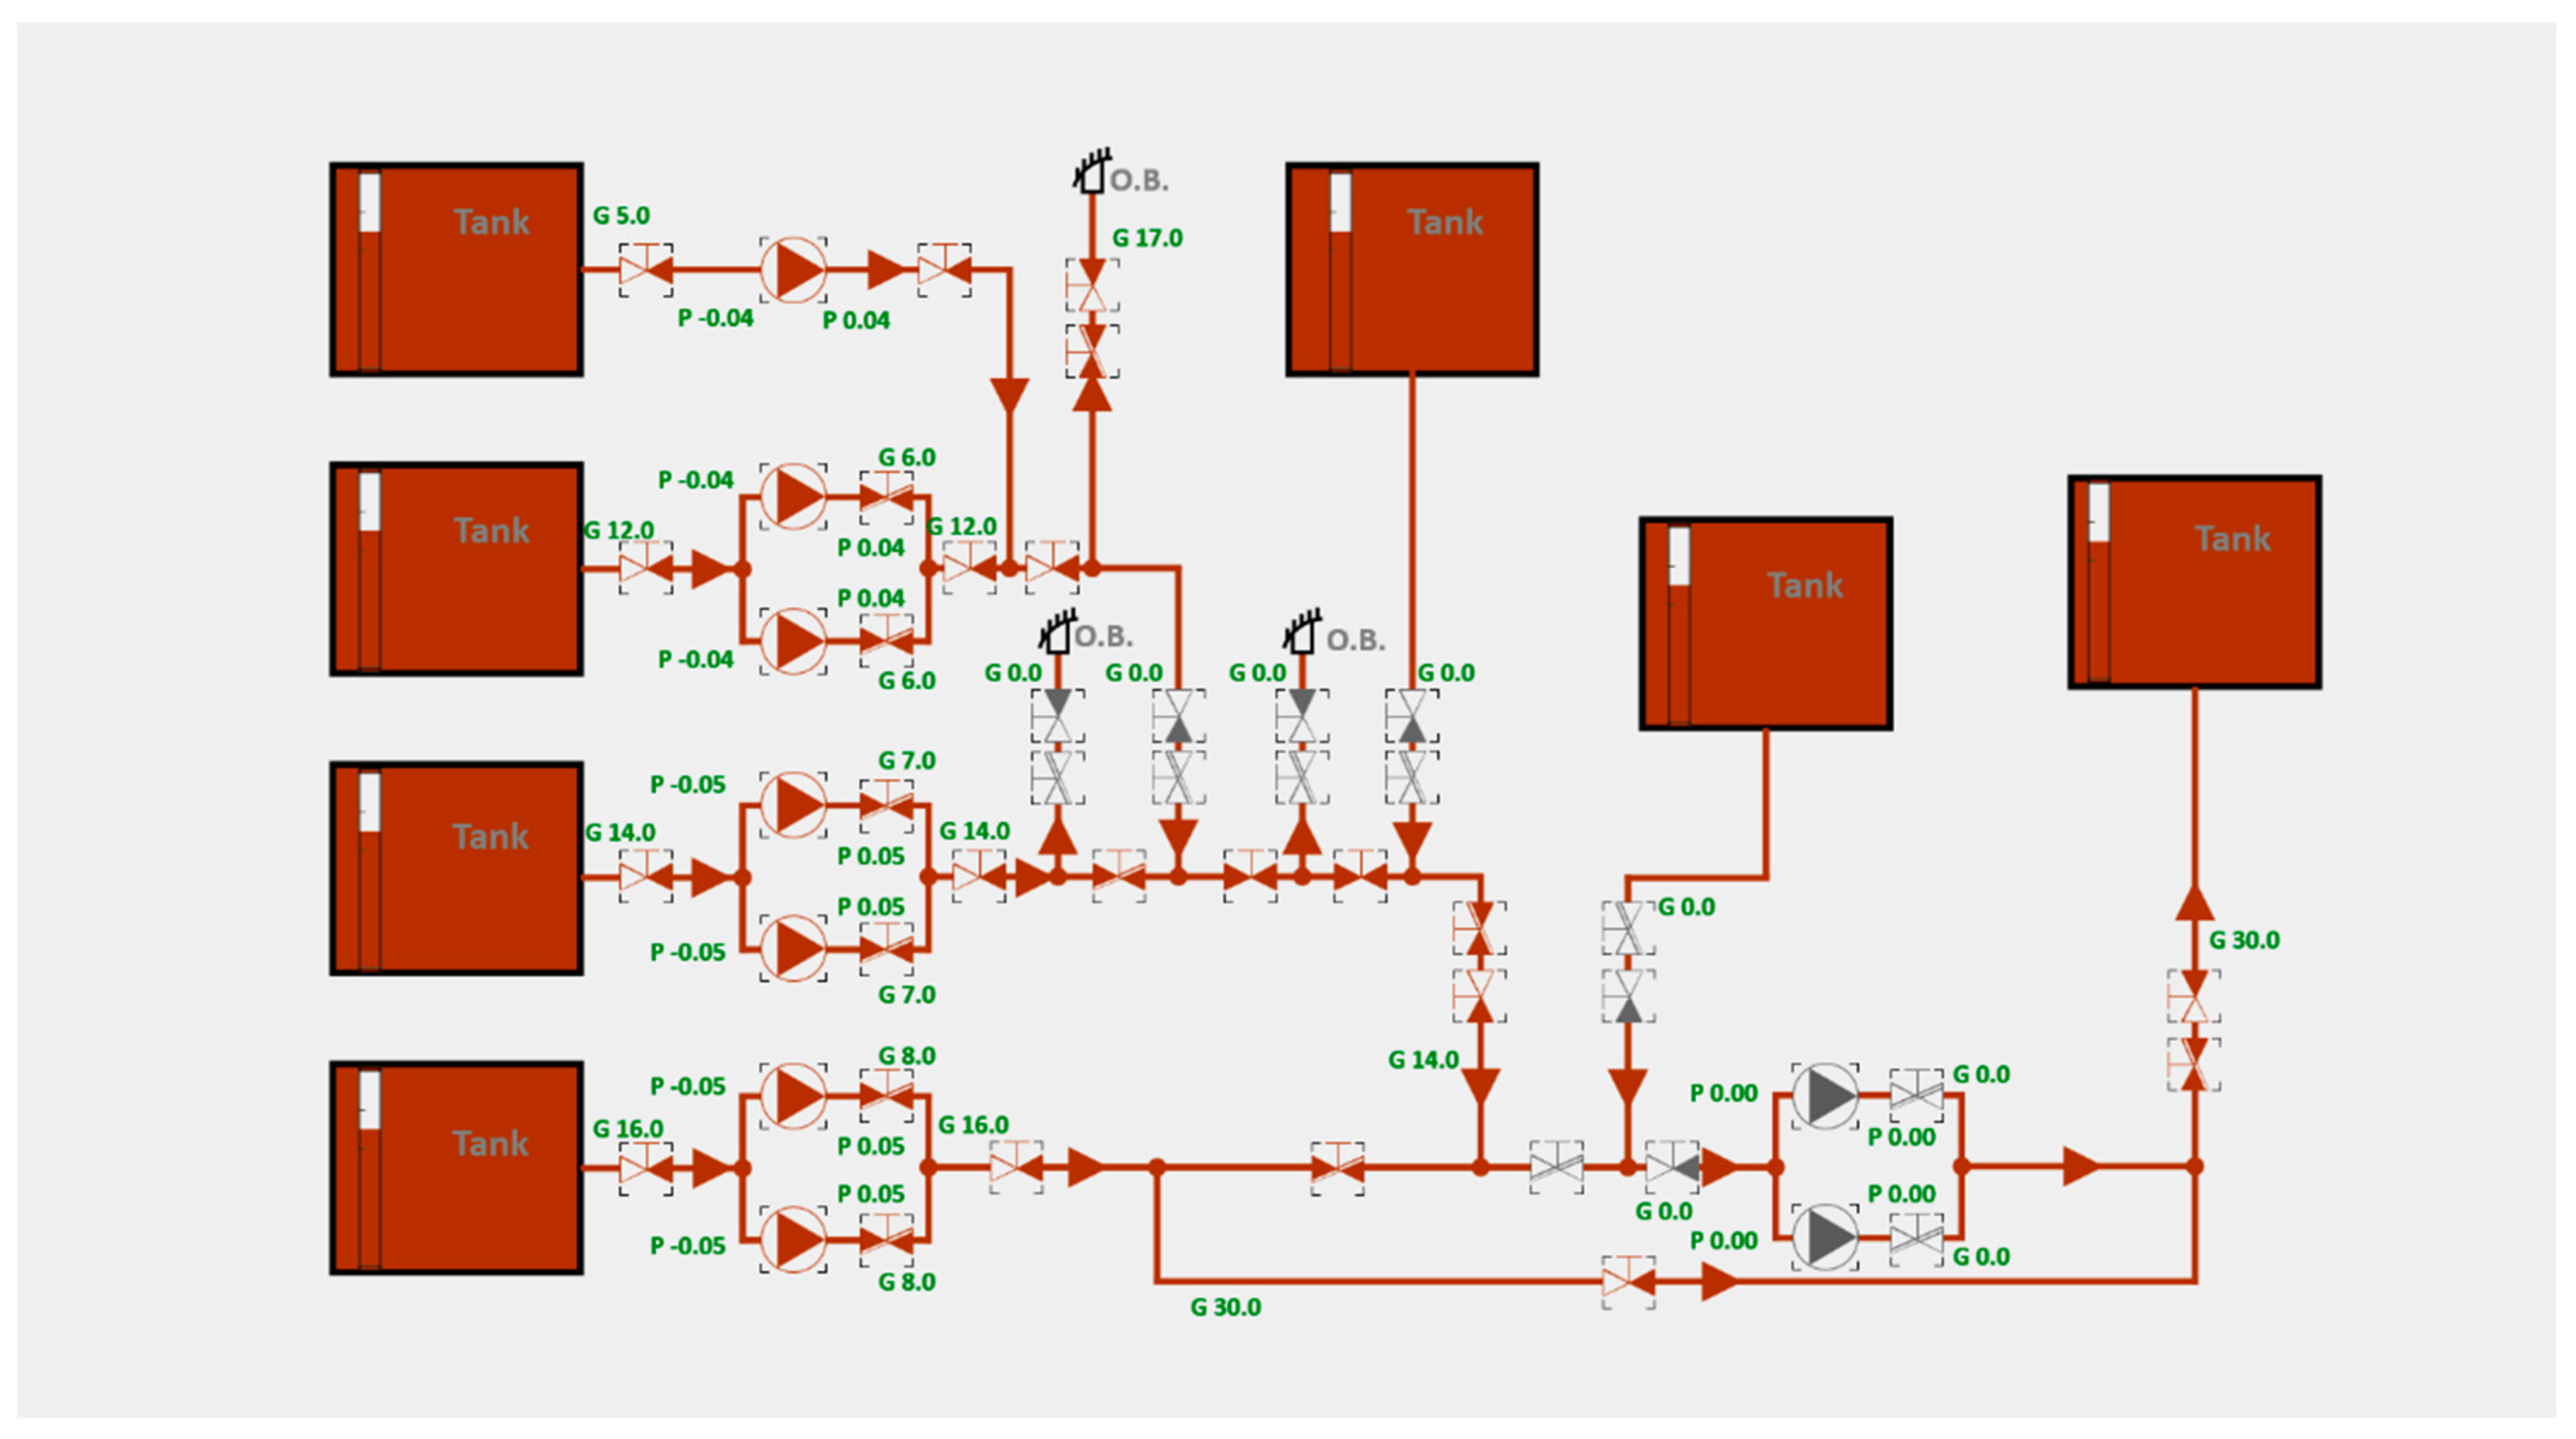
When designing the piping network system, we focus on the visual representation of key components, such as pumps, valves, and monitoring tags, including water level, pressure, and flow. As shown in
Figure 2, we developed a set of control styles in WPF and placed them in a reusable resource library. In this example program, flow and pressure are respectively marked with “G” and “P”. Considering that the flow value is relatively large and the pressure is small, the flow value is kept to one decimal place, while the pressure value is kept to two, to facilitate accurate representation. In the piping network diagram, the valve is represented by two opposite triangles. The one-way valve is displayed as one black and one white triangle, with the gray-black part indicating the direction of fluid flow. When the valve is open, the black part will turn to the color of the piping for the operator to intuitively understand. It is worth noting that pumps on actual ships are generally designed with safety valves to prevent the pump or prime mover from being damaged when the pump operates when the discharge piping is not operational (equivalent to infinite system resistance). In this system, pumps are assumed to come with safety valves by default, but when the user only opens the pump and the valve in the direction of the pump inlet, the pump’s pressure will be higher than the pump’s rated pressure, and a warning will pop up (as shown in
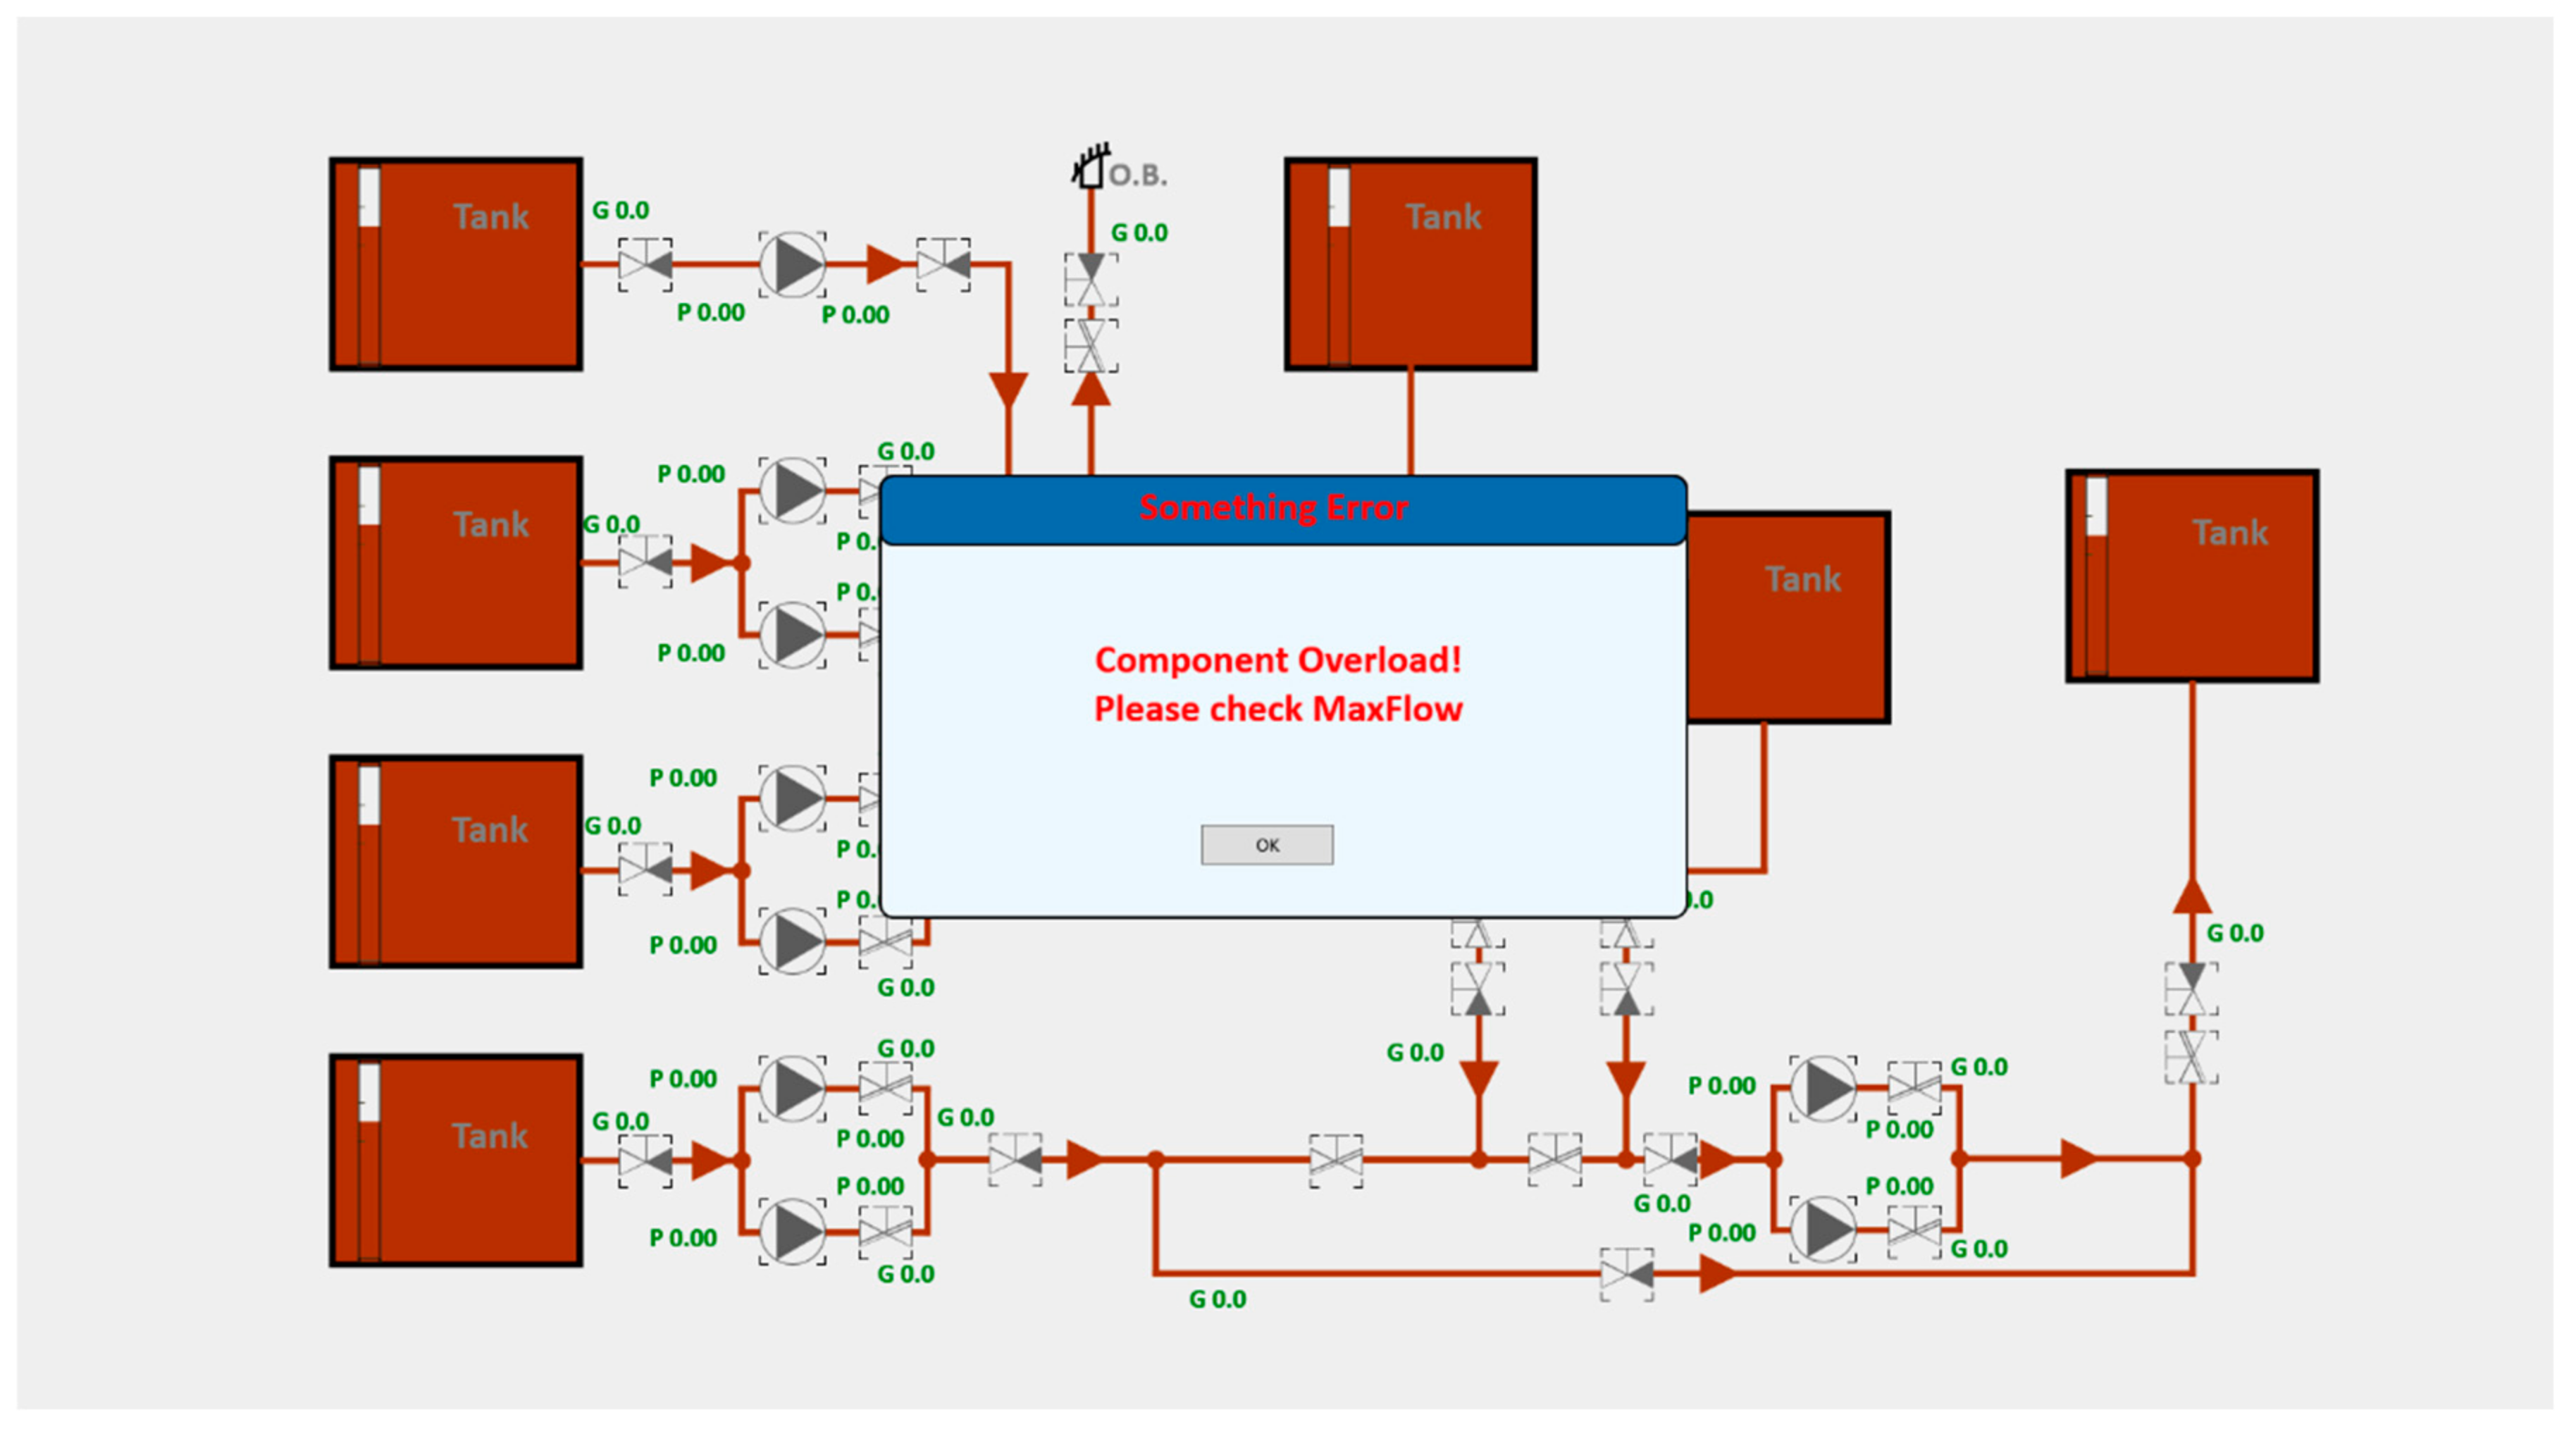
Figure 3). When the user opens the valve in the direction of the pump outlet so that the pump can work normally, the program will continue to run normally and cancel the warning. If both triangles are white, this indicates that the valve is a stop valve, meaning that the flow is blocked. When the stop valve is opened, the color of the triangles will all turn to the color of the piping. The triangle embedded in the circle represents the pump, and the direction of the triangle indicates the outlet direction of the pump. When the pump is not turned on, it shows a gray-black color and will show the color of the piping when it is opened. The rectangle inside the tank represents the water level tag, providing an intuitive way for the operator to understand the liquid level in the tank. In the design of this program, the upper limit of the tank’s water is 100, the initial water level is 70%, and the water level shown in the water level tag will change with the user’s operation. When the maximum water level is reached, it will be impossible to continue supplying water to the tank, and it will be diverted to other branches. Similarly, when the minimum water level is reached, it will be impossible to take water from the tank. When the pump corresponding to the tank cannot supply water to the tank or take water from the tank, it will be automatically shut down. It is worth mentioning that some tanks operate using fluid gravity (without pumps), and at this time, it is necessary to set the maximum flow limit for the outlet pipe section of the tank, otherwise the program will pop up a warning and stop running, and the programmer will need to check and correct the error before it can continue running (as shown in
Figure 4). This detailed graphic design ensures that operators can clearly identify and interpret the various status information in the piping network.
Through this design method, which considers both aesthetics and functionality, the project successfully enhances the overall coordination of the user interface and ensures the clear visibility and ease of use of the controls against different piping diagram backgrounds. Such a user interface design is not only easy to understand but also easy to operate, which is of great significance for reducing the difficulty in instruction regarding complex ship piping networks.
3.2. Implementation of Data Visualization
In a specific ship piping network, due to the complexity of internal channels, similar to an anthill’s crisscrossing, these pipes cross several decks to form a three-dimensional network system. This is designed to achieve effective material transmission between devices. However, in the simulation environment, the specific length and shape of the pipes do not affect the final simulation results, so the pipe representation is more of a schematic diagram of the network layout, used to describe the flow path of the medium from inlet A to outlet B, which also has to pass through valves and pumps.
To simplify the analysis and design of this complex network, this paper proposes to convert the complex piping network into a tabular description, recording in detail the inlets and outlets of each branch and the effective cutoff points on the branch, such as valves and pumps. Then, these textual descriptions are converted into structural diagrams, which facilitate finding all connected branches from any point in the piping network and recording the cutoff points on each branch. In this network, the changes in each cutoff point are crucial to the function and efficiency of the entire network.
For complex piping networks with multiple pumps in parallel, pump groups in series, and series pipes with bypass branch pipes, accurately calculating the flow at any point at any time is a highly complex task. This requires not only careful consideration of all branches that allow flow, but also, taking into account that when encountering a ring-shaped piping network, the complexity will increase exponentially. Therefore, this study proposes to simplify the complex piping network to a simple piping network containing a single pump. For such a web-like structure consisting of nodes and connecting lines, the system’s structural diagram becomes clearer and easier to understand.
Most importantly, this study uses Excel spreadsheets as the carrier of information, describing the controls and piping nodes in the ship piping network. In this way, programmers only need to edit the front-end interface and Excel spreadsheet to make the program run normally. This method greatly reduces the complexity of programming and improves programming efficiency, providing a more efficient and intuitive method for the design and analysis of ship piping networks. Through this innovative method, it is possible to more effectively manage and optimize complex ship piping network systems, improving the reliability and efficiency of the system.
3.3. Data Integration
The data of the ship piping network is defined in both the front-end interface and the external Excel spreadsheet, and these two datasets need to correspond to each other. The data is defined in the front-end interface as follows:
Name: Used to name each control in the piping network, which can be defined by the programmer.
ID: Used to mark a unique name for each control in the piping network.
Coordinates: Used to mark the location information of each control in the piping network.
VariableID: A unique identifier for each control in the piping network.
Type: The related type of each control in the piping network, which can be defined by the programmer.
Color: The color of each control in the piping network, which can be defined by the programmer.
PipeID: The number of the pipe section and each control on the pipe, which corresponds to the external Excel spreadsheet.
The data of the ship piping network is stored in the external Excel spreadsheet, and the data in the spreadsheet is defined as follows (as shown in
Table 1):
PipeID: The number of the pipe section and the controls on the pipe, which must correspond to the front-end interface one by one.
Name: The naming of the controls in the piping network, used for the program to recognize the controls on the pipe section.
PipeDirection: The direction of the pipe flow, if AB is defined as flowing from node A to node B, and BA is the opposite. If the pipe flow can move from A to B and from B to A, it is defined as CC (defining the upper left as node A and the lower right as node B (left and right weight is greater than up and down)).
PipeConnecterA: Other pipe nodes connected to pipe node A.
PipeConnecterB: Other pipe nodes connected to pipe node B.
IsSource: Whether it is a starting pipe, with no other pipes connected before the starting pipe.
IsTerminal: Whether it is a terminal pipe, with no other pipes connected after the terminal pipe.
PumpFlow: The flow produced by the pump when it is running normally in the pipe.
PumpMaxPressure: The operating pressure of the pump when the inlet is connected and the outlet is not, during the running of the pump.
PumpMinPressure: The operating pressure of the pump when it is normally connected during the running of the pump.
MaxFlow: The maximum flow limit of the pipe; the default maximum flow is infinite. If there is a preset maximum flow limit, the distribution of flow will proceed freely until this limit is reached. Once the actual flow exceeds this threshold, the excess flow will be temporarily stored in the upstream node of that pipeline and redistributed to other pipelines at the same level. If these pipelines have also reached their flow limit, then the excess flow will be drawn from the connected pipelines in a predetermined proportion and redistributed, and this adjustment process will continue to be executed until the flow is balanced and distributed to the end pipelines of the network. This mechanism ensures that every pipeline in the system receives an appropriate flow distribution, avoiding the risk of exceeding flow capacity.
G/Ppipe: The tags in the program that display the flow and pressure of the pipeline. When entering, Gpipe is in front, Ppipe at the pump inlet direction is after it, and Ppipe at the pump outlet direction is at the end. Use a semicolon to separate Gpipe and Ppipe, and use a comma to separate two Ppipes. Specifically, a pipe section can have at most one Gpipe and two Ppipes. When there is no corresponding tag in the pipe section, use 0 to replace it.
3.4. Data Analysis and Calculation
During program operation, when the user clicks a valve or pump, the color will change to the color of the piping to indicate that it has been opened, and at the same time, the opening signal will be transmitted to the calculation program. This visual effect intuitively displays the current state of the valves and pumps, enhancing the user experience.
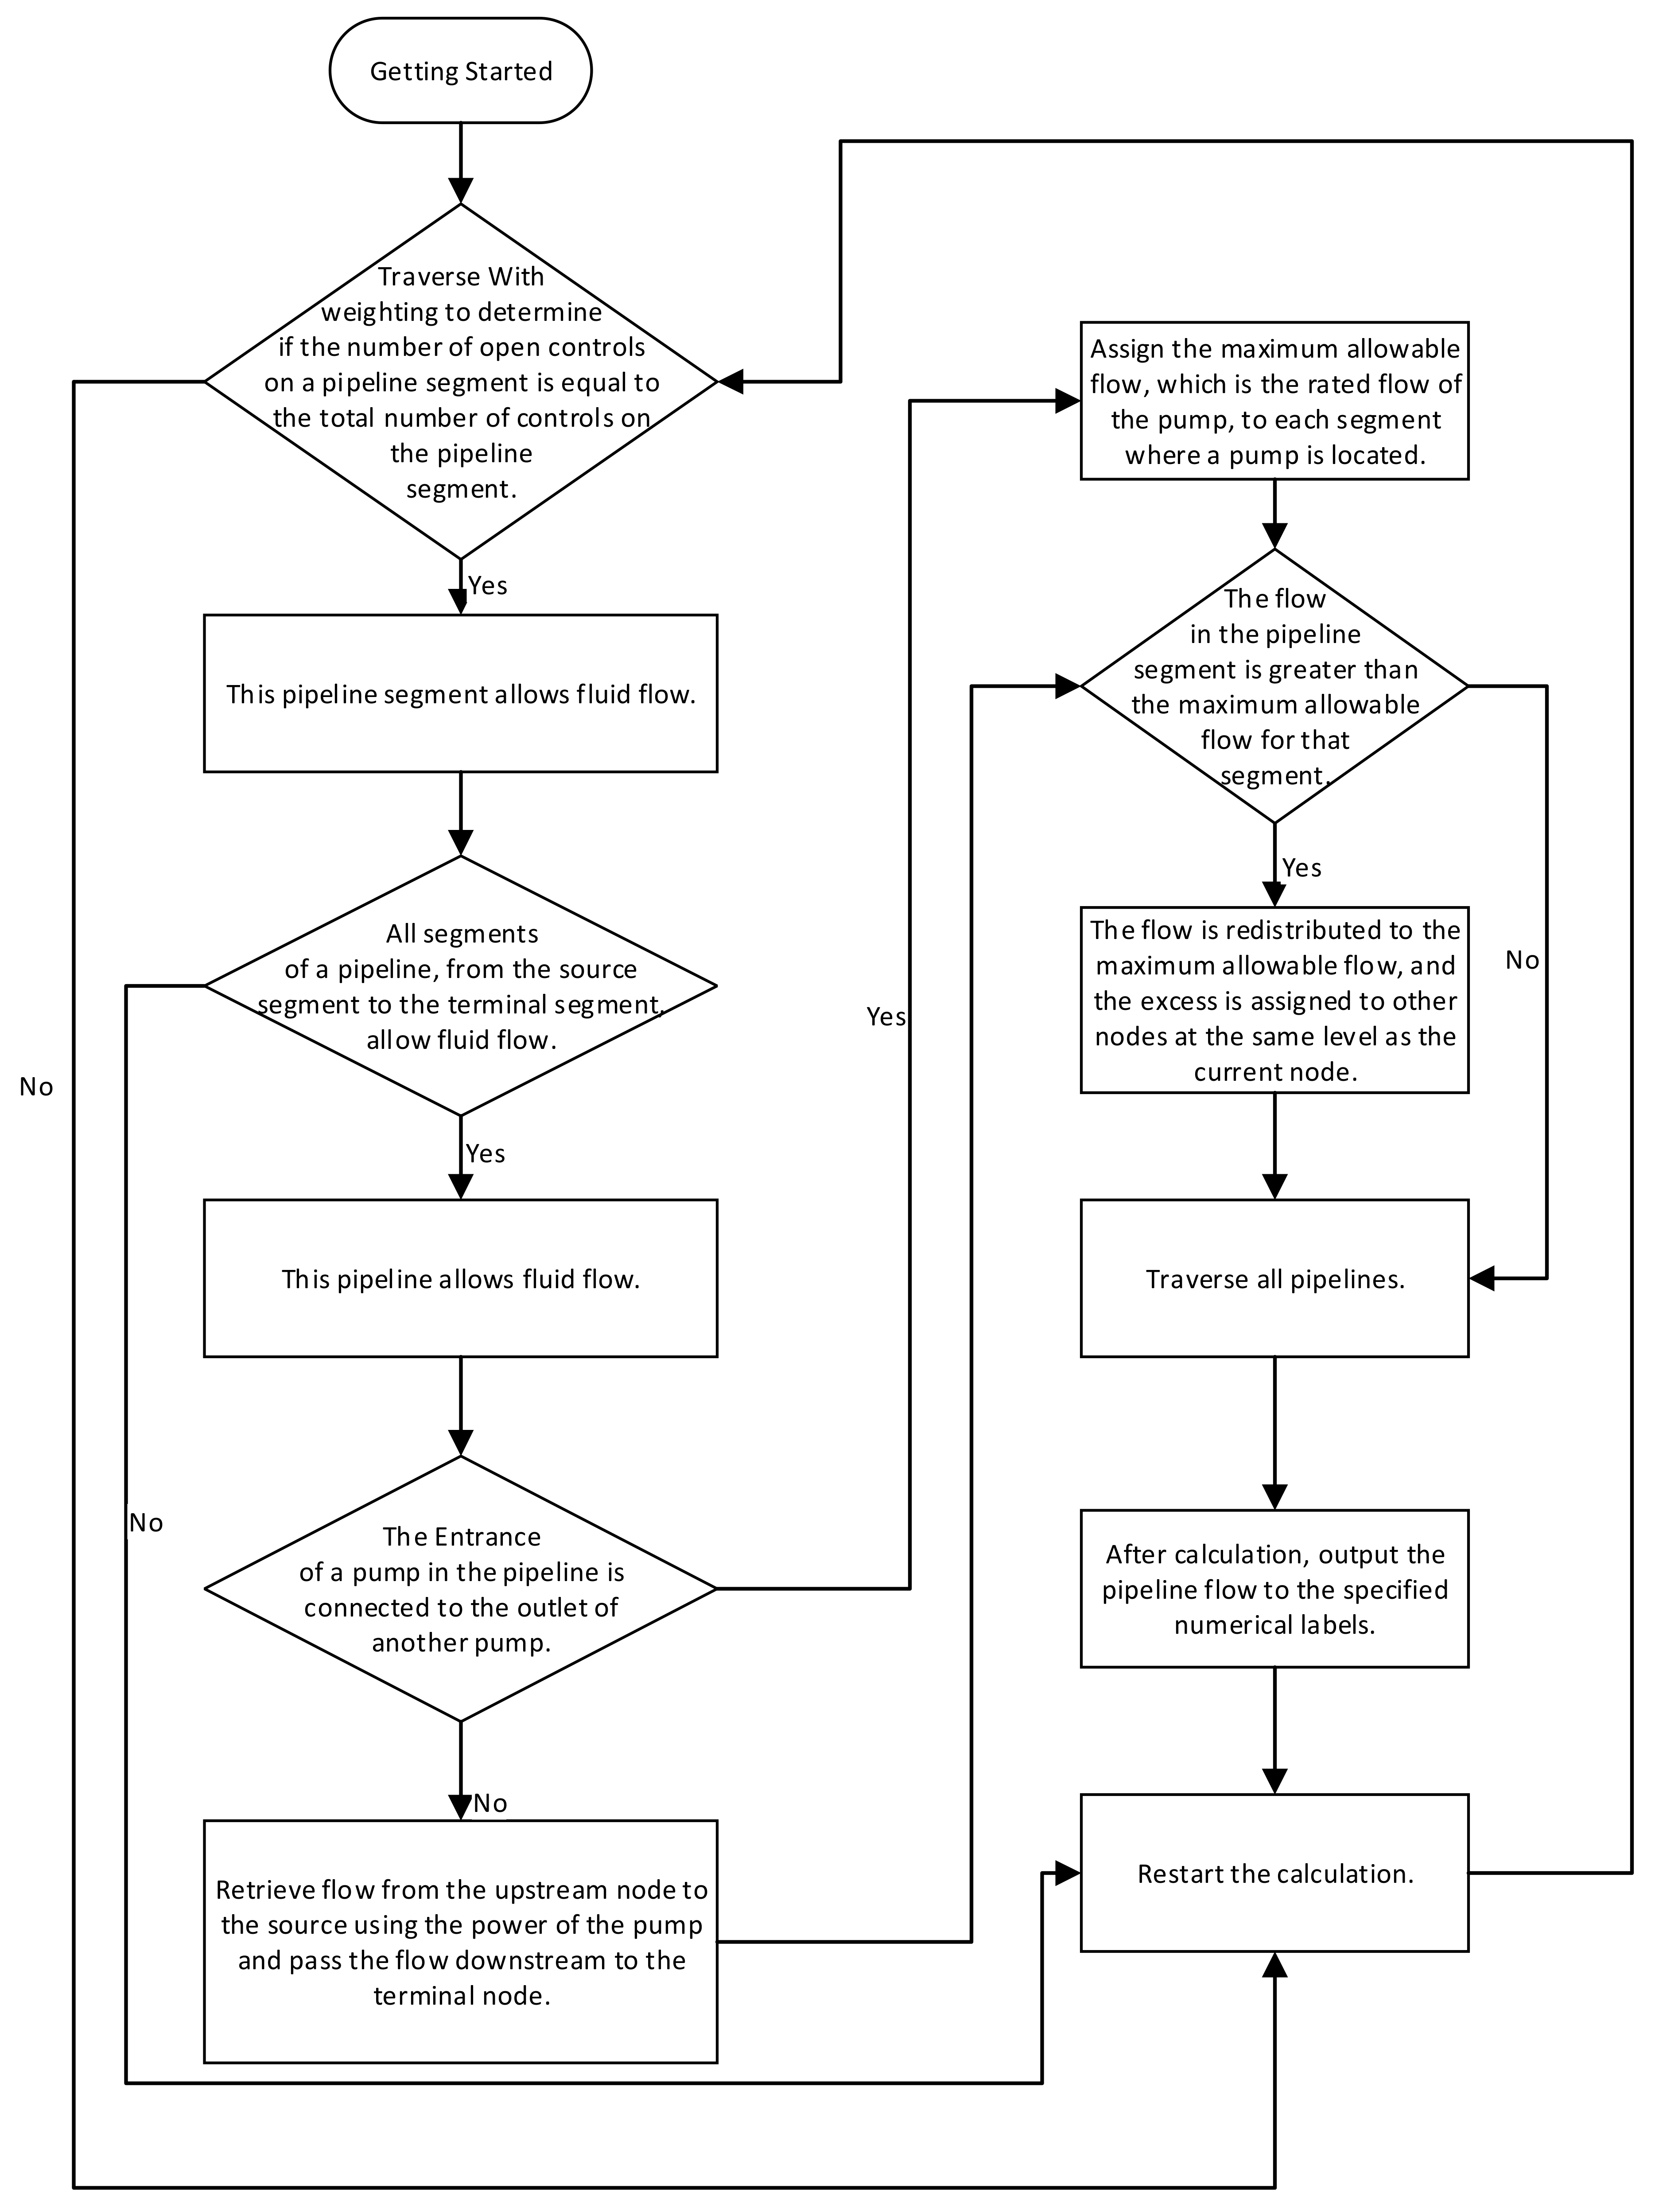
Then, the program will analyze the piping network to determine which pipe sections can allow fluid flow. It works through a traversal method, reading and evaluating the state of controls on the pipe sections. When the number of open controls on a pipe section and the number of controls set in the external Excel spreadsheet match (for example, the controls on Pipe1 section are LineValve1, LineValve2, and LinePump1 when the program calculates the open property value of the pipe section as 3), the program will judge that pipe section as allowing flow. When all pipe sections from a source pipe section to an end pipe section allow flow, the pipes composed of these pipe sections will be considered capable of fluid flow. Once a pipe is determined to allow flow, the process of flow calculation and transmission will start.
The flow calculation process is detailed as follows. The program, based on the power of the pump and the flow direction of the pipe predetermined in the external Excel spreadsheet, will request flow from the source section starting from the pump inlet. In this process, if the maximum flow provided by an upstream pipe section exceeds the rated flow of the pump, the system will request according to the pump’s rated flow; otherwise, if the maximum flow that can be provided by the upstream pipe section does not reach the pump’s rated flow, it will adjust the request value according to the maximum flow limit of that section. In this process, the flow is temporarily stored at each upstream node of the pump and continues to request upstream until the source is reached.
In particular, when there are multiple branches at the upstream node, the system will implement an equal flow distribution strategy, that is, it will request flow from each branch node and create an average value. If the maximum flow limit of any branch is lower than the average value calculated, the system will request according to the maximum flow of that branch, and the remaining flow will be distributed to other branches at the same level. When all branches at the same level reach their maximum flow limit, the system will automatically adjust the maximum flow setting of the upstream node to the sum of the maximum flow limits of all branches at the same level.
After the flow is assigned to the source, it will be distributed downstream to each branch node along the piping. The processing of the pump outlet is similar, and the flow stored in the pump node will be adjusted downwards according to the maximum allowable value of the downstream section, following the same principle of average distribution and adjustment of maximum flow limit, until it reaches the terminal. The entire distribution process ensures the accurate and balanced distribution of flow from the source to the end pipe sections. All calculated and distributed flow values are detailed in the pipeline node processing scheme shown in
Figure 5, to ensure the intuitiveness of the piping network operation and the clarity of logic.
This software provides a dynamic piping network control and flow display interface. Users can simply click to adjust the working status of valves and pumps, while tracking the flow dynamics of the piping network in real time. This visualization technology not only enhances the interactive experience of users but also makes the understanding and control of the ship piping network system more precise. Through the immediate adjustment of the colors and status of valves and pumps, combined with the intuitive display of flow dynamics, the program plays a crucial role in the visualization of ship piping network instruction and operation. Its interactive features effectively promote users’ intuitive awareness of piping network operation and reflect the results of the operation in real time, greatly enhancing the efficiency of the operation while reducing the risk of mis-operation.
4. Example of the Model’s Actual Execution
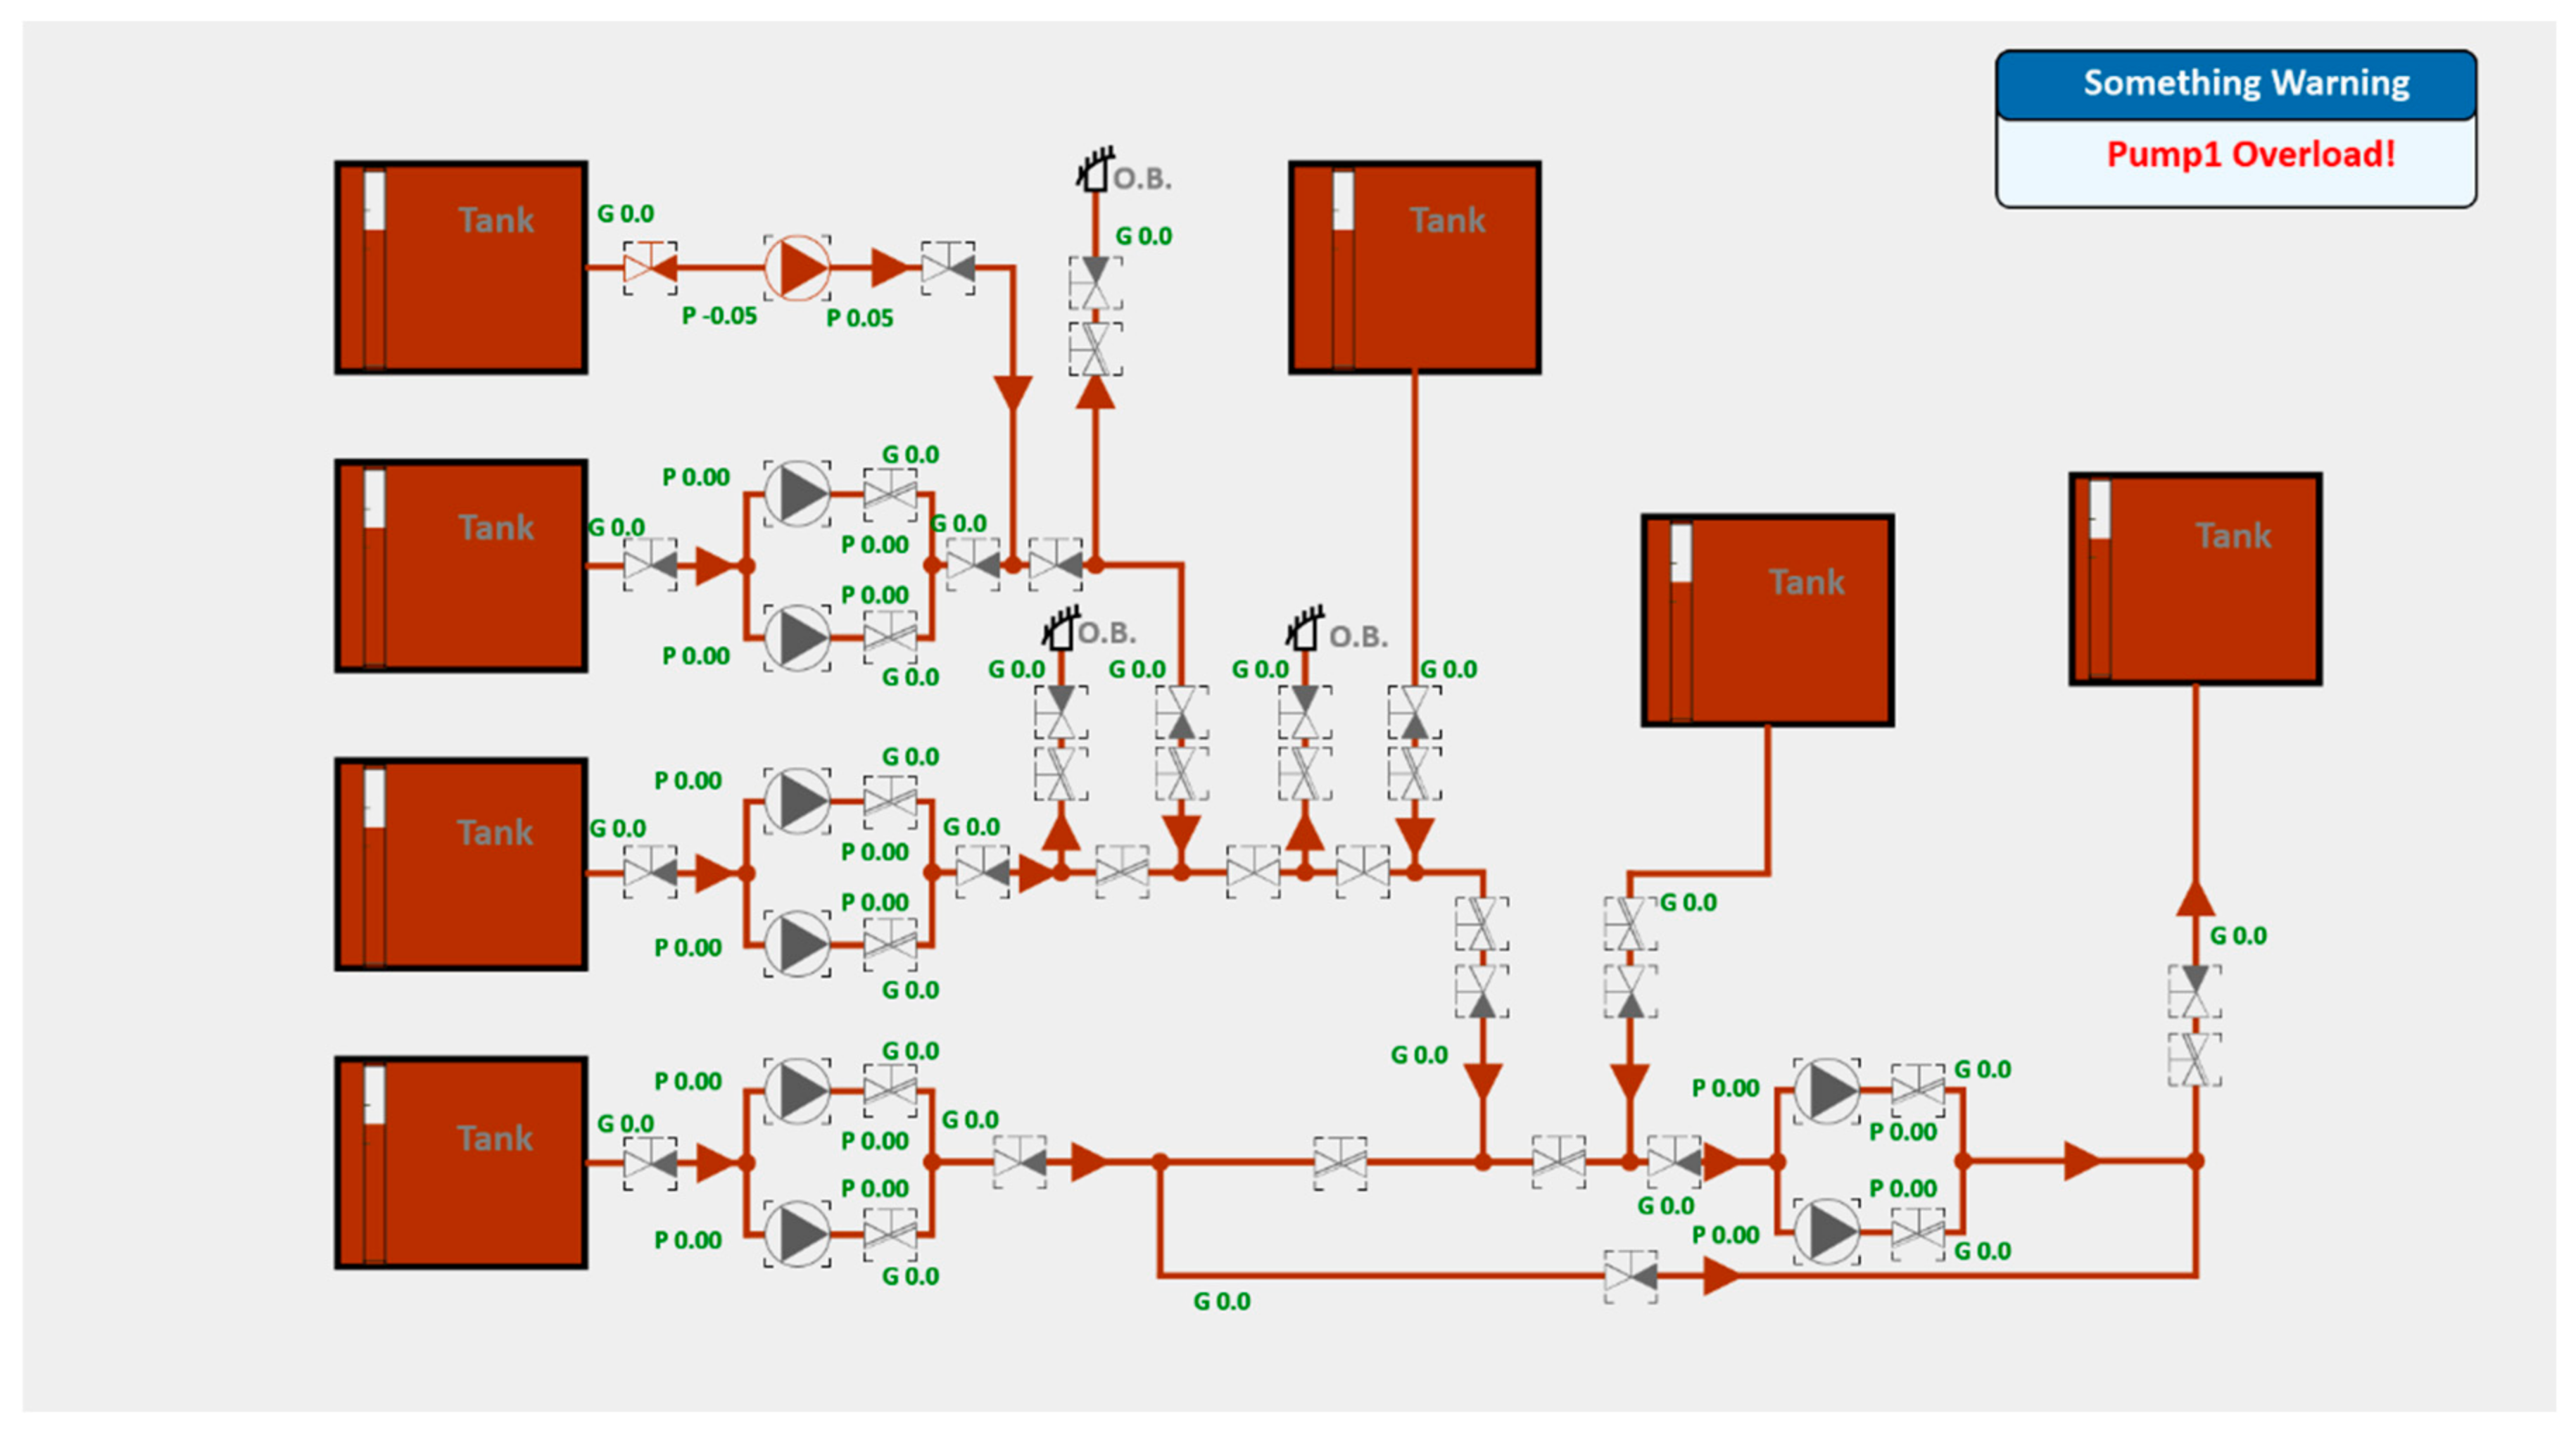
Taking a certain ship sewage system as an example, in terms of the user interface, through the linkage with the external Excel data table, we successfully realized the precise presentation of the ship piping network structure. When users enter the system, they can immediately observe an intuitive and graphical display of the ship piping network (as shown in
Figure 2).
After the user clicks on controls such as pumps and valves, the corresponding controls will change color to indicate they are open, and after the piping network program judges the pipe to be connected, the corresponding flow and pressure values will be calculated and displayed on the respective tags after calculation.
Figure 6 is the display of the program when there is no pump inlet for another pump outlet in the pipe;
Figure 7 is the display of the program when there is a pump inlet for another pump outlet in the pipe.
From the above figures, it can be seen that the program can calculate the flow, pressure, and other parameters when there is no pump inlet for another pump outlet in the pipe and when there is a pump inlet for another pump outlet, and display them in the designated position, allowing users to intuitively observe how their operations affect the entire piping network system in real time.
5. Conclusions
The ship piping network programming tool developed in this study provides an effective solution to the problems encountered by traditional text description and calculation methods when dealing with complex and large data volume systems. Facing the challenges of large programming workload, susceptibility to errors, and difficulty in troubleshooting, we used Microsoft’s WPF technology and C# language to successfully create an innovative tool with an intuitive graphical interface, and by integrating Excel as a means of data input, we built a comprehensive logical model.
Based on a deep insight into industry practice, the tool allows users to intuitively build physical models of ship piping networks by dragging controls through the graphical interface. This not only simplifies the design process of complex systems but also significantly enhances the precision and efficiency of data processing and calculation. Users can define key attributes of piping by adjusting parameters in Excel, such as maximum flow and direction, thus enhancing the practicality and accuracy of the model.
After comparative analysis, our tool shows superiority over traditional methods in many aspects. First, it provides an intuitive platform for piping network design, greatly reducing the complexity of design and the difficulty in user instruction. Secondly, the integration of Excel as a data input tool greatly improves the flexibility and efficiency of data management, enabling even non-programming professionals to easily carry out piping network design and analysis.
In summary, the ship piping network programming tool successfully developed in this study not only overcomes the limitations of traditional methods but also provides a more efficient, intuitive, and user-friendly solution for the education and application of ship piping networks. The development and promotion of this tool could open new avenues for optimizing the operation and management of ship piping network systems and could have a profound impact on future teaching and practice in the field. Looking forward to the future, we expect this tool to play a greater role in the teaching and industry application of ship piping networks, bringing a more convenient and efficient design and operating experience.


