
A Geophysical Investigation of the Pâclele Mici Mud Volcano in Romania Using Deep Geoelectrical Surveys

1
National Institute for Earth Physics, 077125 Bucharest, Romania
2
Doctoral School of Geology, University of Bucharest, 010041 Bucharest, Romania
3
School of Electronic, Electrical and Computer Engineering, University of Birmingham, Edgbaston, Birmingham B15 2TT, UK
*
Author to whom correspondence should be addressed.
Appl. Sci. 2024, 14(6), 2463; https://doi.org/10.3390/app14062463
Submission received: 4 December 2023
/
Revised: 27 February 2024
/
Accepted: 1 March 2024
/
Published: 14 March 2024
(This article belongs to the Special Issue Advances in Geosciences: Techniques, Applications, and Challenges)
Abstract
:Featured Application
Deep geoelectrical mapping of subsurface objectives.
Abstract
This work presents a case study of a geoelectrical exploration of understudied mud volcanoes in Romania, specifically the Pâclele Mici mud volcano from Buzău County. Using a geoelectrical technique facilitated by the distributed network of V-FullWaver equipment, we present, to our knowledge, the first deep 3D case study of a mud volcano in the country. The findings indicate that while geoelectrical surveys in such environments are met with important challenges in terms of soil conductivity, they nonetheless provide a viable approach to uncovering the complex structures and processes of mud volcanoes. We map a part of the mud volcano, showing that the active subsurface part corresponds only partly with what is visible on the surface, and suggest a framework for an in-depth analysis of the extensive mud volcano area.
1. Introduction
Mud volcanoes are relatively understudied features within the field of geology. They resemble true igneous volcanoes in shape but have distinct underlying processes and characteristics. They are the largest surface expression of methane-rich fluids that migrate through neotectonic faults or fractures [1] and are scattered across various areas around the world, with their distribution being controlled by tectonic or geological factors [2]. However, the complex mechanisms and processes involved are not perfectly understood [3,4].
The formation of a mud volcano involves the extrusion of a mixture of gases, liquids, and solids [5]. This extrusion is primarily driven by the upward migration of pressurized subsurface fluids, typically a slurry of fine sediment and water, occasionally mixed with hydrocarbon gases such as methane. These materials are forced upward through geological faults and fractures.
It is unclear how many mud volcanoes there are on Earth, although the total number is over 600 just for onshore [6]. Mud volcanoes can appear both onshore and offshore.
Despite their geological significance [5] and associated hazards [7,8,9] that include the (relatively low) seismicity, the potential violent release of hydrocarbons and mud, the degradation of soil and quicksand effect, and episodic dissociation of gas hydrates, mud volcanoes are relatively understudied compared to other geological phenomena.
One reason for the relative lack of intensive study is the remoteness and challenging accessibility of many mud volcano sites. Many of these formations are located in regions that are difficult to reach, such as offshore locations or within rugged terrains. This presents logistical challenges for scientists aiming to conduct regular and detailed studies. Furthermore, mud volcanoes are complex systems that involve a range of geological and biochemical processes, making them challenging to address holistically. They often involve the interaction of lithosphere, hydrosphere, atmosphere, and potentially even biosphere components [10], all of which must be accounted for in order to understand the entire system.
However, geophysical surveys can reveal at least some parts of the plumbing system of mud volcanoes. This is what was attempted here. We aim not necessarily to provide a better understanding of the entire mud volcano system but to image some of the subsurface features and extent of the Pâclele Mici volcano with a true 3D geoelectrical survey and demonstrate the feasibility of this FullWaver methodology in the study of mud volcanoes in general. The core of our work here utilizes the V-FullWaver equipment from IRIS instruments, a distributed survey equipment system for deep resistivity and induced polarization surveys which is designed to be used for 2D, pseudo 3D, or full 3D surveys.
1.1. Motivation
Mud volcanoes are significant for several reasons. They provide an indirect window into the deep biosphere and subterranean geochemical processes; they can pose hazards; they play a role in the global methane generation; they provide value through tourism and by creating unique ecosystems.
The mud volcanoes in Romania are located in Buzău County. They are part of the newly designated Buzău Land Geopark [11], in southeast Romania, on the exterior of the Oriental Carpathians. The geology of the Buzău Land Geopark is complex, involving two tectonic phases [12] from the Late Cretaceous and Early Miocene periods. The area is also relatively close to the Vrancea seismogenic zone. Along with other mud volcanoes, it lies on the Berca–Arbanasi anticline, which is in the vicinity of one of the main faults linked with the major 1977 earthquake from the Vrancea area [13]. Although it is not clear to what extent the anticline and mud volcanoes were affected by the earthquake, mud volcano activity is strongly influenced by external factors. We do not aim to offer a comprehensive geological summary of the area here, merely to emphasize the tectonic and geological complexity of the area, map a part of its subsurface, and understand the geoelectrical signature of the volcano.
The mud volcanoes lie near the town of Berca. They are a part of the national heritage and draw numerous tourists every year. There are four main manifestations of mud volcanoes, although the “plumbing” of these systems is not mapped: Pâclele Mari, Pâclele Mici, Fierbători, and Beciu. The former two are a Natura 2000 site, and overall, an area of 93.8 hectares is protected.
This is the first survey of what is planned to be a multiyear, extensive, and multidisciplinary geophysical research. In this case study, we focus on the Pâclele Mici mud volcano, as it represents a good application site for several reasons. It is more accessible logistically, it is a challenging area that has not been thoroughly addressed geophysically, and it is a nationally significant site that draws in numerous tourists every year. The site poses an additional interest as it lies relatively close to the seismically active Vrancea area.
1.2. Study Site
The Pâclele Mici mud volcano, part of the Berca Mud Volcanoes (Noroioșii de la Pâclele Mici in Romanian), constitutes a remarkable geological and botanical reservation located in the Scorțoasa commune. Geologically, the Pâclele Mici mud volcano is a consequence of the eruption of mud and natural gases (95% methane per [14]), from 3000 m beneath the Earth’s surface. The volcano produces a brine that shows remarkable stability in two analyses conducted 25 years apart [15,16]. This brine exhibits contents of Na+ and Cl− on the same order of magnitude as corresponding seawater concentrations, which suggests a halite leaching origin [17].
Botanically, the badlands around the Pâclele Mici mud volcano provide a unique environment characterized by high soil salinity because of this brine. This condition results in sparse highly specialized vegetation, creating a particular landscape. Despite the scarcity of plant life, this environment is conducive to the survival of some rare species of plants such as Nitraria schoberi and Obione verrucifera [18], which are capable of withstanding the high salt levels present in the soil. The site is currently carefully managed to ensure the preservation of its unique environment.
All of that makes Pâclele Mici an important study site. However, like many other mud volcanoes, Pâclele Mici is a challenging task to study geophysically. In [19], the electrical signature of a different mud volcano area in Romania (the Homorod area) is presented, with values of 1.7–28.7 Ωm. However, at the Pâclele Mici site, values were expected to be even lower given the high level of activity and levels of salt. The geoelectrical data in [19], also from the Pâclele Mici volcano, suggest somewhat lower values. This is challenging because high conductivity [20] is often associated with reduced contrast, higher attenuation, and challenges in data interpretation. As geoelectrical surveys rely on the propagation of electrical currents through the subsurface, high conductive subsurface materials allow easy flow of these currents but also quickly dissipate the electrical energy. As a result, the depth of penetration of the electrical signals is reduced, making it difficult to investigate deeper subsurface structures. Differentiating between different objectives also becomes more challenging as high conductivity can mask and blur geoelectrical boundaries. In addition, standard geoelectrical equipment is not optimized for highly conductive environments. This can lead to technical challenges, such as the need for more powerful transmitters or more sensitive receivers, to adequately conduct surveys in such settings. In addition to the resistivity values, the Pâclele Mici site also features important topographic variations that can pose additional challenges to data acquisition and processing. The inversion of geoelectrical data with steep topography is challenging as such topography can affect the measurements severely [21].
Here, however, we focus on a larger area, using nonconventional geoelectrical surveys that can address both these issues.
2. Materials and Methods
The V-FullWaver (described in detail here: http://www.iris-instruments.com/Pdf_file/FullWaver_Gb.pdf, accessed 2 February 2024) is an independent system specifically designed for precise full-waveform time-domain-induced polarization, resistivity, and SP measurements. Each system is fully self-contained, integrating its own power source, a GPS module, and digital memory that can store data for up to three months of continuous recording.
The FullWaver system is essentially a dual-channel receiver for induced polarization, resistivity, and SP. It is a quasi-cableless system [22] where injection and recording devices come as separate hardware, the recording devices operate autonomously and are not connected by cables, and there is no multiplexer (see Figure 1). FullWaver operates with a constant recording at a 10 ms sample rate, providing a comprehensive waveform record. An added bonus of the equipment is that it can filter out some of the noise which was to be expected at this site. Each autonomous measuring station includes three potential electrodes, typically placed in perpendicular directions. In this arrangement, all the geoelectric measurements are in two perpendicular directions. This permits the creation of a “true” subsurface 3D, as opposed to the “pseudo 3D” created with parallel Electrical Resistivity Tomography (ERT) profiles. Herein lies one of the key advantages of this approach compared to conventional geoelectrical measurements. A real geoelectrical 3D subsurface of the volcano is desirable in this case.
The recorded time-series by the V-FullWaver can be post-processed using dedicated software. The software enables various processing steps such as improving the signal-to-noise ratio, focusing on stable and accurate parts of the signal, removing SP spikes, and resynchronizing the data if necessary.
Some advantages of the FullWaver make it particularly well suited to the study of mud volcanoes. The FullWaver devices, including the V-FullWaver, are designed for the measurement of resistivity, IP, and PS on large 3D surfaces, which can be affected by sharp topography, as is the case at Pâclele Mici (see Figure 2). The array is not bound by any particular geometry (i.e., Wenner) and can be customized depending on the desired survey objective. Depending on the size of the area to investigate, multiple V-FullWaver devices can be located in any desired way on the surface of the investigation, performing continuous measurements.
Another advantage of this type of objective is the current injection system. The system can use a pseudo-pole–dipole system with one electrode fixed “at infinity” and one mobile injection station. Here, we use the VIP10000 which can output up to 6000 V peak to peak and 20 A. The ability to inject strong current was useful at this conductive site, enabling deeper penetration. The realization of true 3D subsurface visualization was also an important advantage of this system.
Although the methodology is different, the underlying physical processes are largely similar to ERT. Parameters controlling the depth of investigation and the depth of penetration are still the length of the transmitting line and the distance between transmitters and receivers [6]. The maximum estimated depth of investigation is 156 m.
At the end of the survey, the data were copied from each FullWaver device. The electrode coordinates have been entered into the devices, and an automatic process was used to export the resistivity and IP data in Prosys II.
3. Results
Before carrying out the V-FullWaver survey, several test ERT profiles were carried out in the area to confirm the conductive nature of the subsurface and indicate whether the approach is necessary. The profiles confirmed the very low resistivity values, as depicted in the figure below (Figure 3 resistivity values < 1.7 ohm.m).
Low resistivity values were anticipated. However, the observed values fall even below what was anticipated. A Dipole–Dipole ERT array with 24 electrodes and a distance between electrodes of 5 m showed resistivity values under 2 ohm-meters.
As a result, ERT measurements are not expected to provide substantial value in this context because the subsurface is very conductive, and therefore, it is extremely challenging to reach a satisfactory depth of investigation (as the current dissipates). However, other geoelectrical surveys were expected to be of more use. The current that can be injected with conventional ERT equipment will not provide a good enough depth of penetration and will likely not ensure significantly deeper contrasts.
The FullWaver survey was thus employed. The survey was carried out over the course of one day. A total of 20 measuring stations were used, as well as injection points displayed thusly. The distance between measuring stations was 50 m in both directions, while the distance between injection stations was 100 m (see Figure 4).
Processing was carried out using Prosys III. The first part of the processing was verifying that the time series were synchronized. Eliminated points were noisy, had poor signal, or appeared singularly anomalous. Notably, some points appeared as negative resistivity and were eliminated. Topography corrections were also introduced, using the coordinates of each individual electrode.
Overall, however, most points had a satisfactory signal-to-noise ratio. In the end, out of the 801 data points, a total of 748 data points were retained. The signal amplitude of the selected data ranges from 0.013 to 38.02 mV, and the apparent resistivity data range from 0.2 to 8.8 ohm.m. The average value is 1.76, and the median value is 1.6 ohm.m (Figure 5).
These are very low resistivity values that are explained by mud volcano activity, as the conductive fluid drastically reduces the surrounding resistivity. This is consistent with reported cases in the literature [23] which also mention that mud volcano activity is linked with very low resistivity values. Notably, even in the area outside of the visible surface mud, the values are still very low, suggesting that the active area extends beyond what is visible at the surface.
Interpreting the results from spontaneous potential is not attempted here. However, we note that the spontaneous potential variation helps put into perspective just how low the observed resistivity values are (Figure 6). In many instances, the induced potential differences are comparable to or even smaller than the natural spontaneous potential of the site. This suggests that such natural variations can be a significant source of errors given the low resistivity values.
Figure 6.
Representation of the recordings on one of the V-FullWaver surveys, displaying potential as a function of time. As they record continuously, the SP values would appear with a thinner line in the image, and the injection points are visible with higher amplitude and significantly highlighted. The recording lasted for approximately 17,000 s. A cassette is highlighted for a zoomed-in version (see Figure 7).
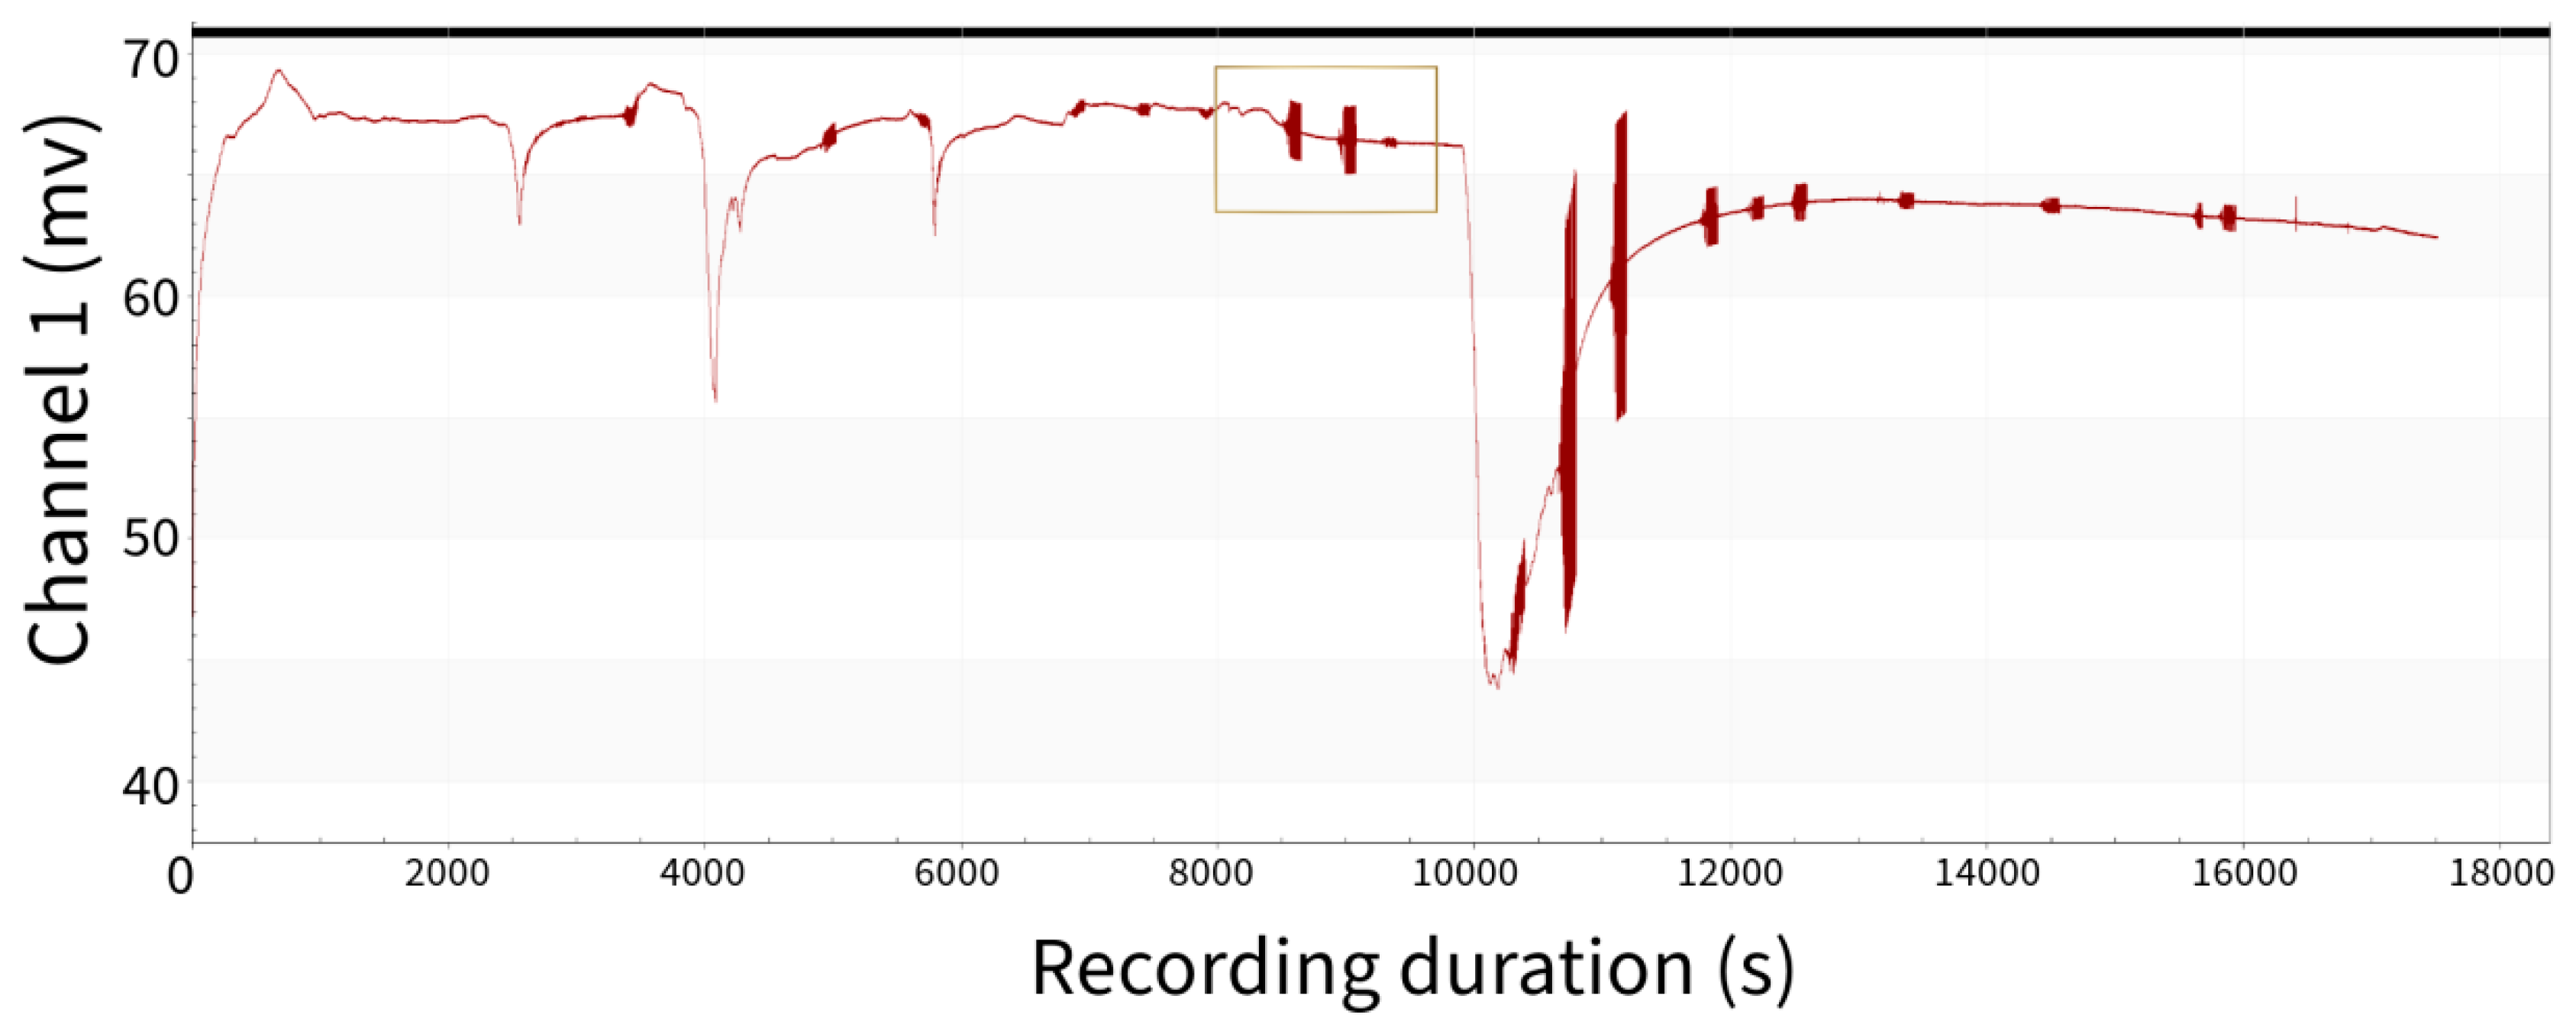
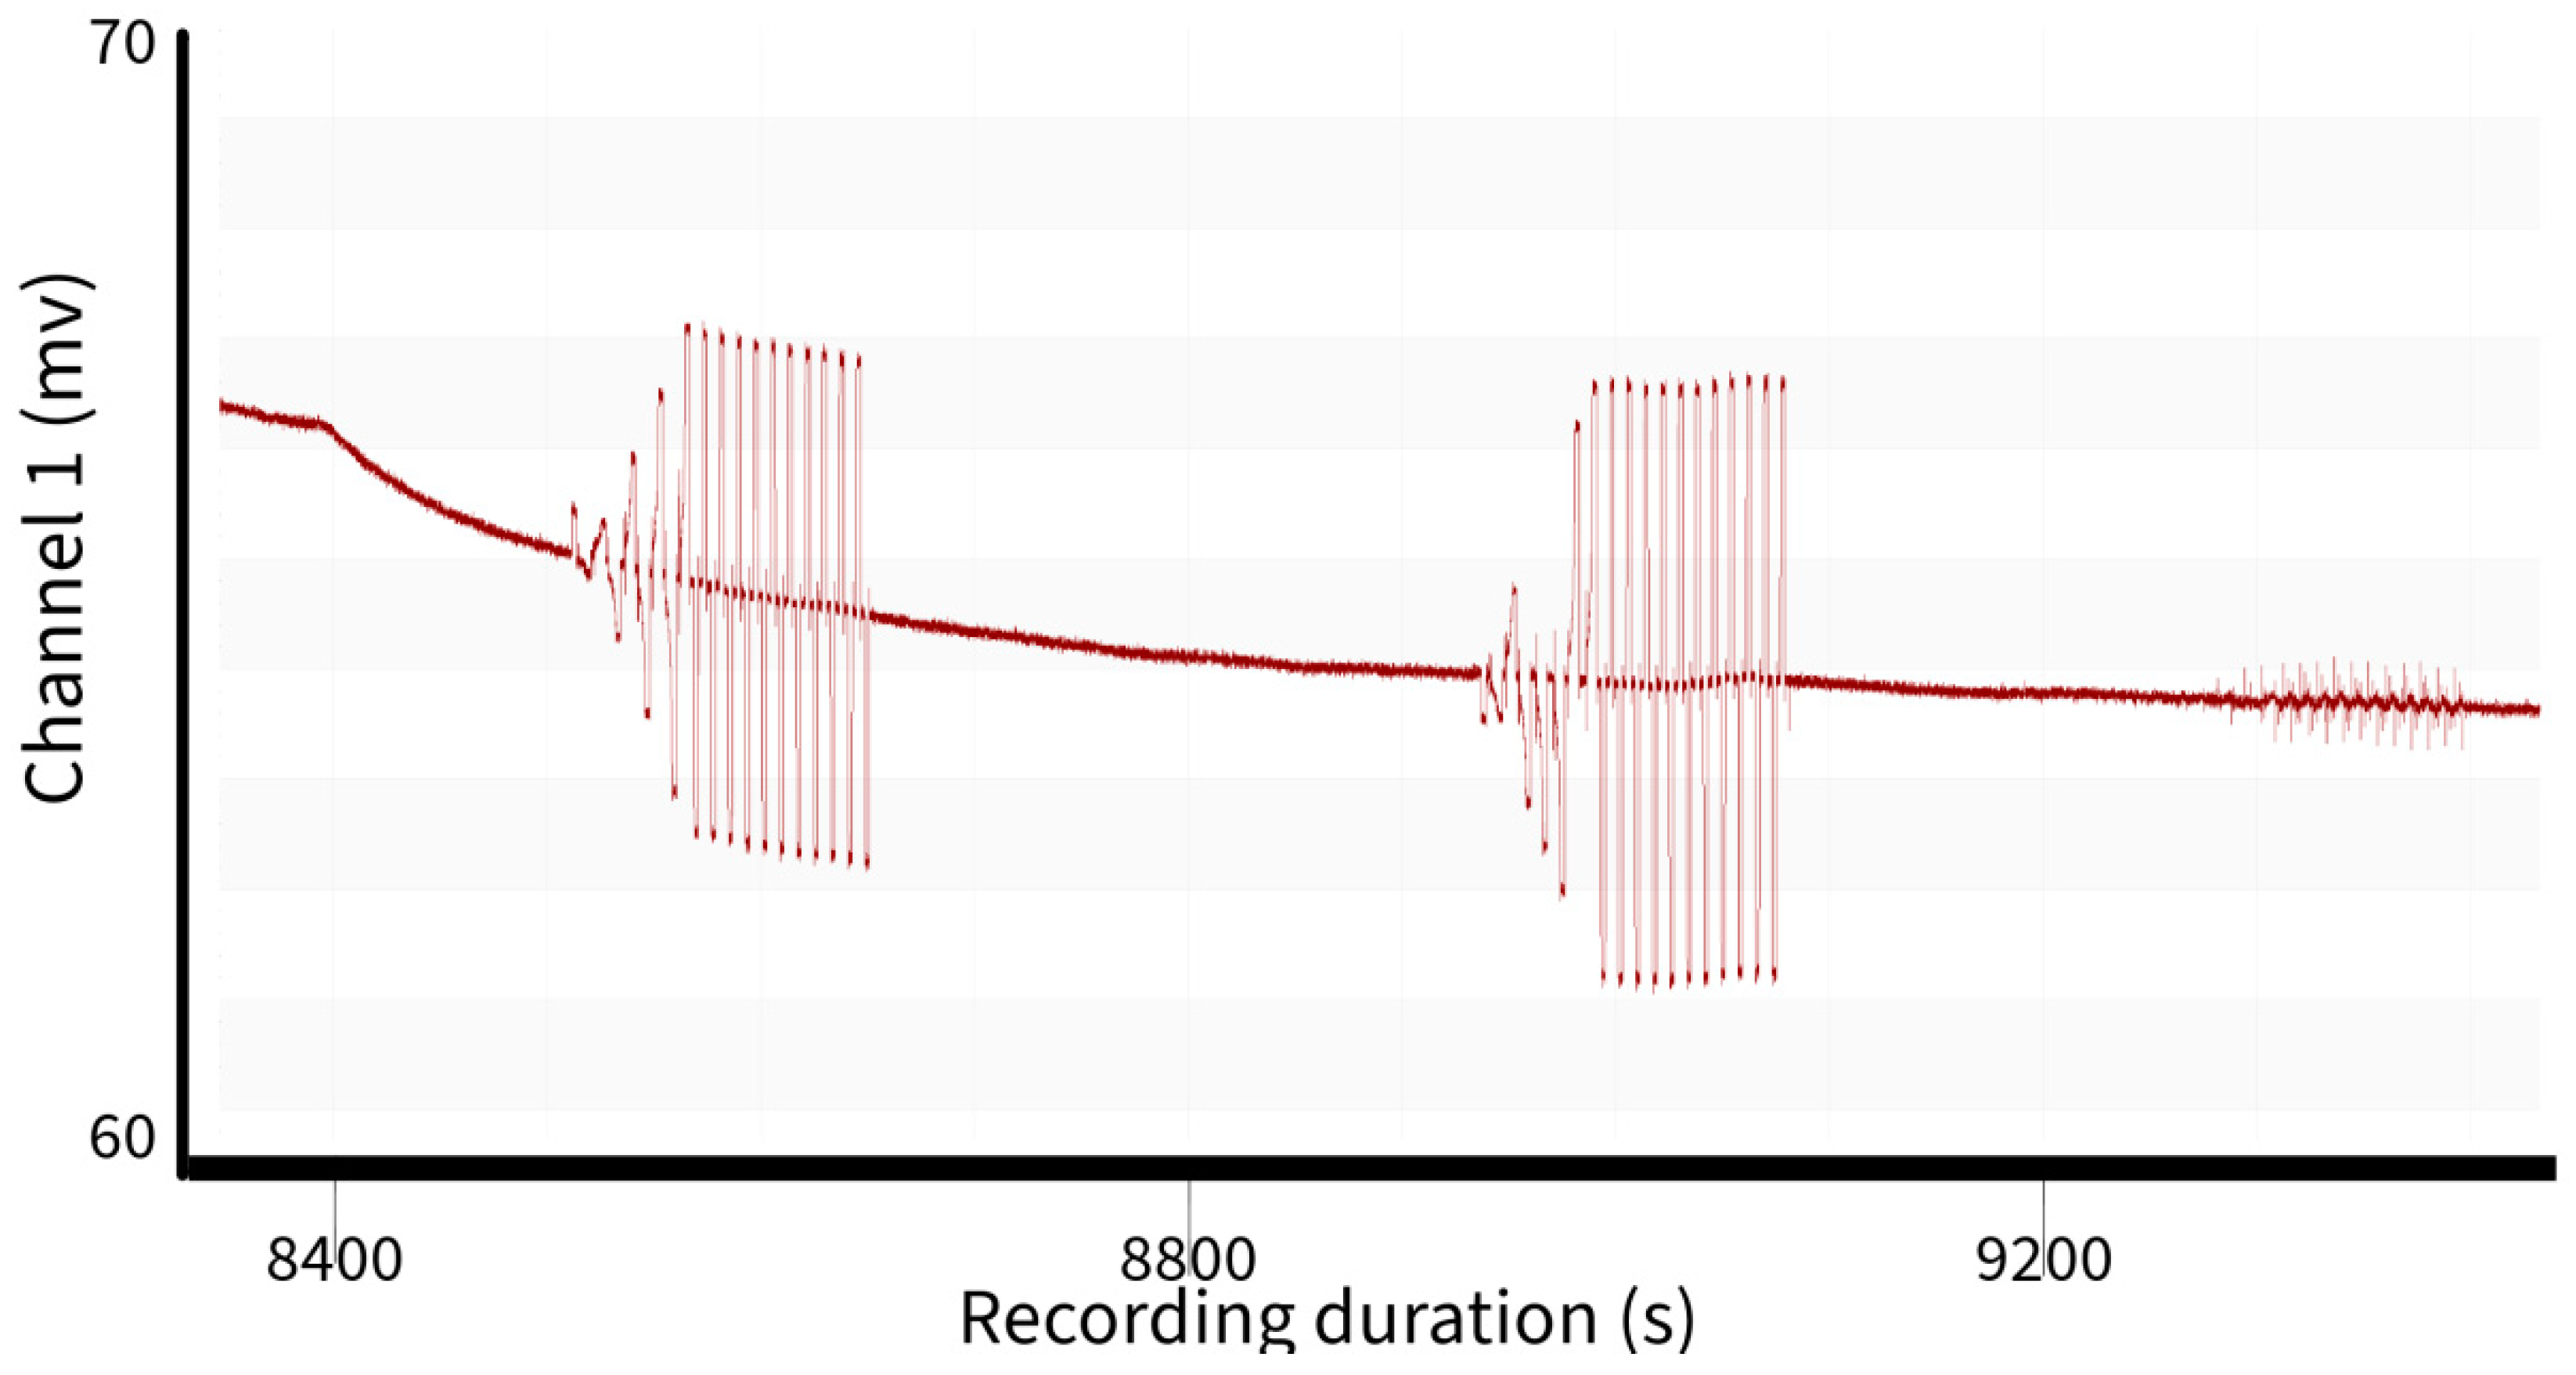
Figure 7.
A zoomed-in cassette (see Figure 6) showing the FullWaver data on the natural potential curve. This highlights that the natural curve is comparable in scale to the observed geoelectrical currents.
Figure 7.
A zoomed-in cassette (see Figure 6) showing the FullWaver data on the natural potential curve. This highlights that the natural curve is comparable in scale to the observed geoelectrical currents.
Unfortunately, the chargeability data are also remarkably unreliable on all stations. Therefore, the interpretation efforts were only focused on resistivity values.
The data were then inverted using both Res3DInv (v3.20.0) and ERTLab Studio (http://www.geostudiastier.it/area_en.asp?idCanale=56&sezione=1, accessed on 27 February 2024). The calculated elevation values were estimated from GPS positioning, not extracted with a total station. The RMS was 7.69, which we interpret to be a good result for such a large volume and such a low-resistivity site. Res3DINV was used to derive several horizontal and vertical slices (including topography).
For ease of visualization and analysis, we split these geoelectrical slices into two groups: one with the shallower slices, with depths ranging from 0 to 40.9 m (Figure 8), and one with the deeper slices, ranging from 40.9 to 156.3 m (Figure 9).
Already, from these slices, an area of interest can be defined. As the core interest is the mud volcano activity, this area is marked by low resistivity. In most circumstances, a contrast of around 1 ohm.m would be negligible, but given the conditions at this site, and what can be inferred from the literature, this appears to be a significant contrast area. The area becomes even more pronounced in the deeper parts of the surveyed area of the mud volcano.
The area of interest (low resistivity) becomes even clearer in the deeper parts of the investigated area.
Similarly, in vertical profiles (see Figure 9) extracted with RES2DINV, an area with resistivity under 1 ohm.m is clearly delineated (in green) in the central part of the investigated area (Figure 10).
However, Res2DInv has significant visualization limitations and offers no straightforward way to georeference and visualize the inverted data directly. The inversion model was therefore exported and imported into ArcGIS, where it was georeferenced. This was more than simply a visualization approach. The data imported in GIS would lose a bit of detail, as the model imported contains the values and the coordinates at the center of the cell blocks of the calculated 3D inversion model resulting from the RES3DINV. The interpolation of the points available in ArcGIS Pro is Empirical Bayesian Kriging, which in this case seems to allow for results similar to what can be visible in the RES3DINV. Even so, it appears that there are no major changes or losses through this process, for this dataset, and ArcGIS Pro has the advantage of working with 3D models in a scene and allowing for true 3D visualizations. It also allows for creating and selecting isosurfaces (surfaces and volumes with the same resistivity) with specific values and sectioning the 3D volume in any direction, which allows for a better visualization of different areas of interest from the dataset.
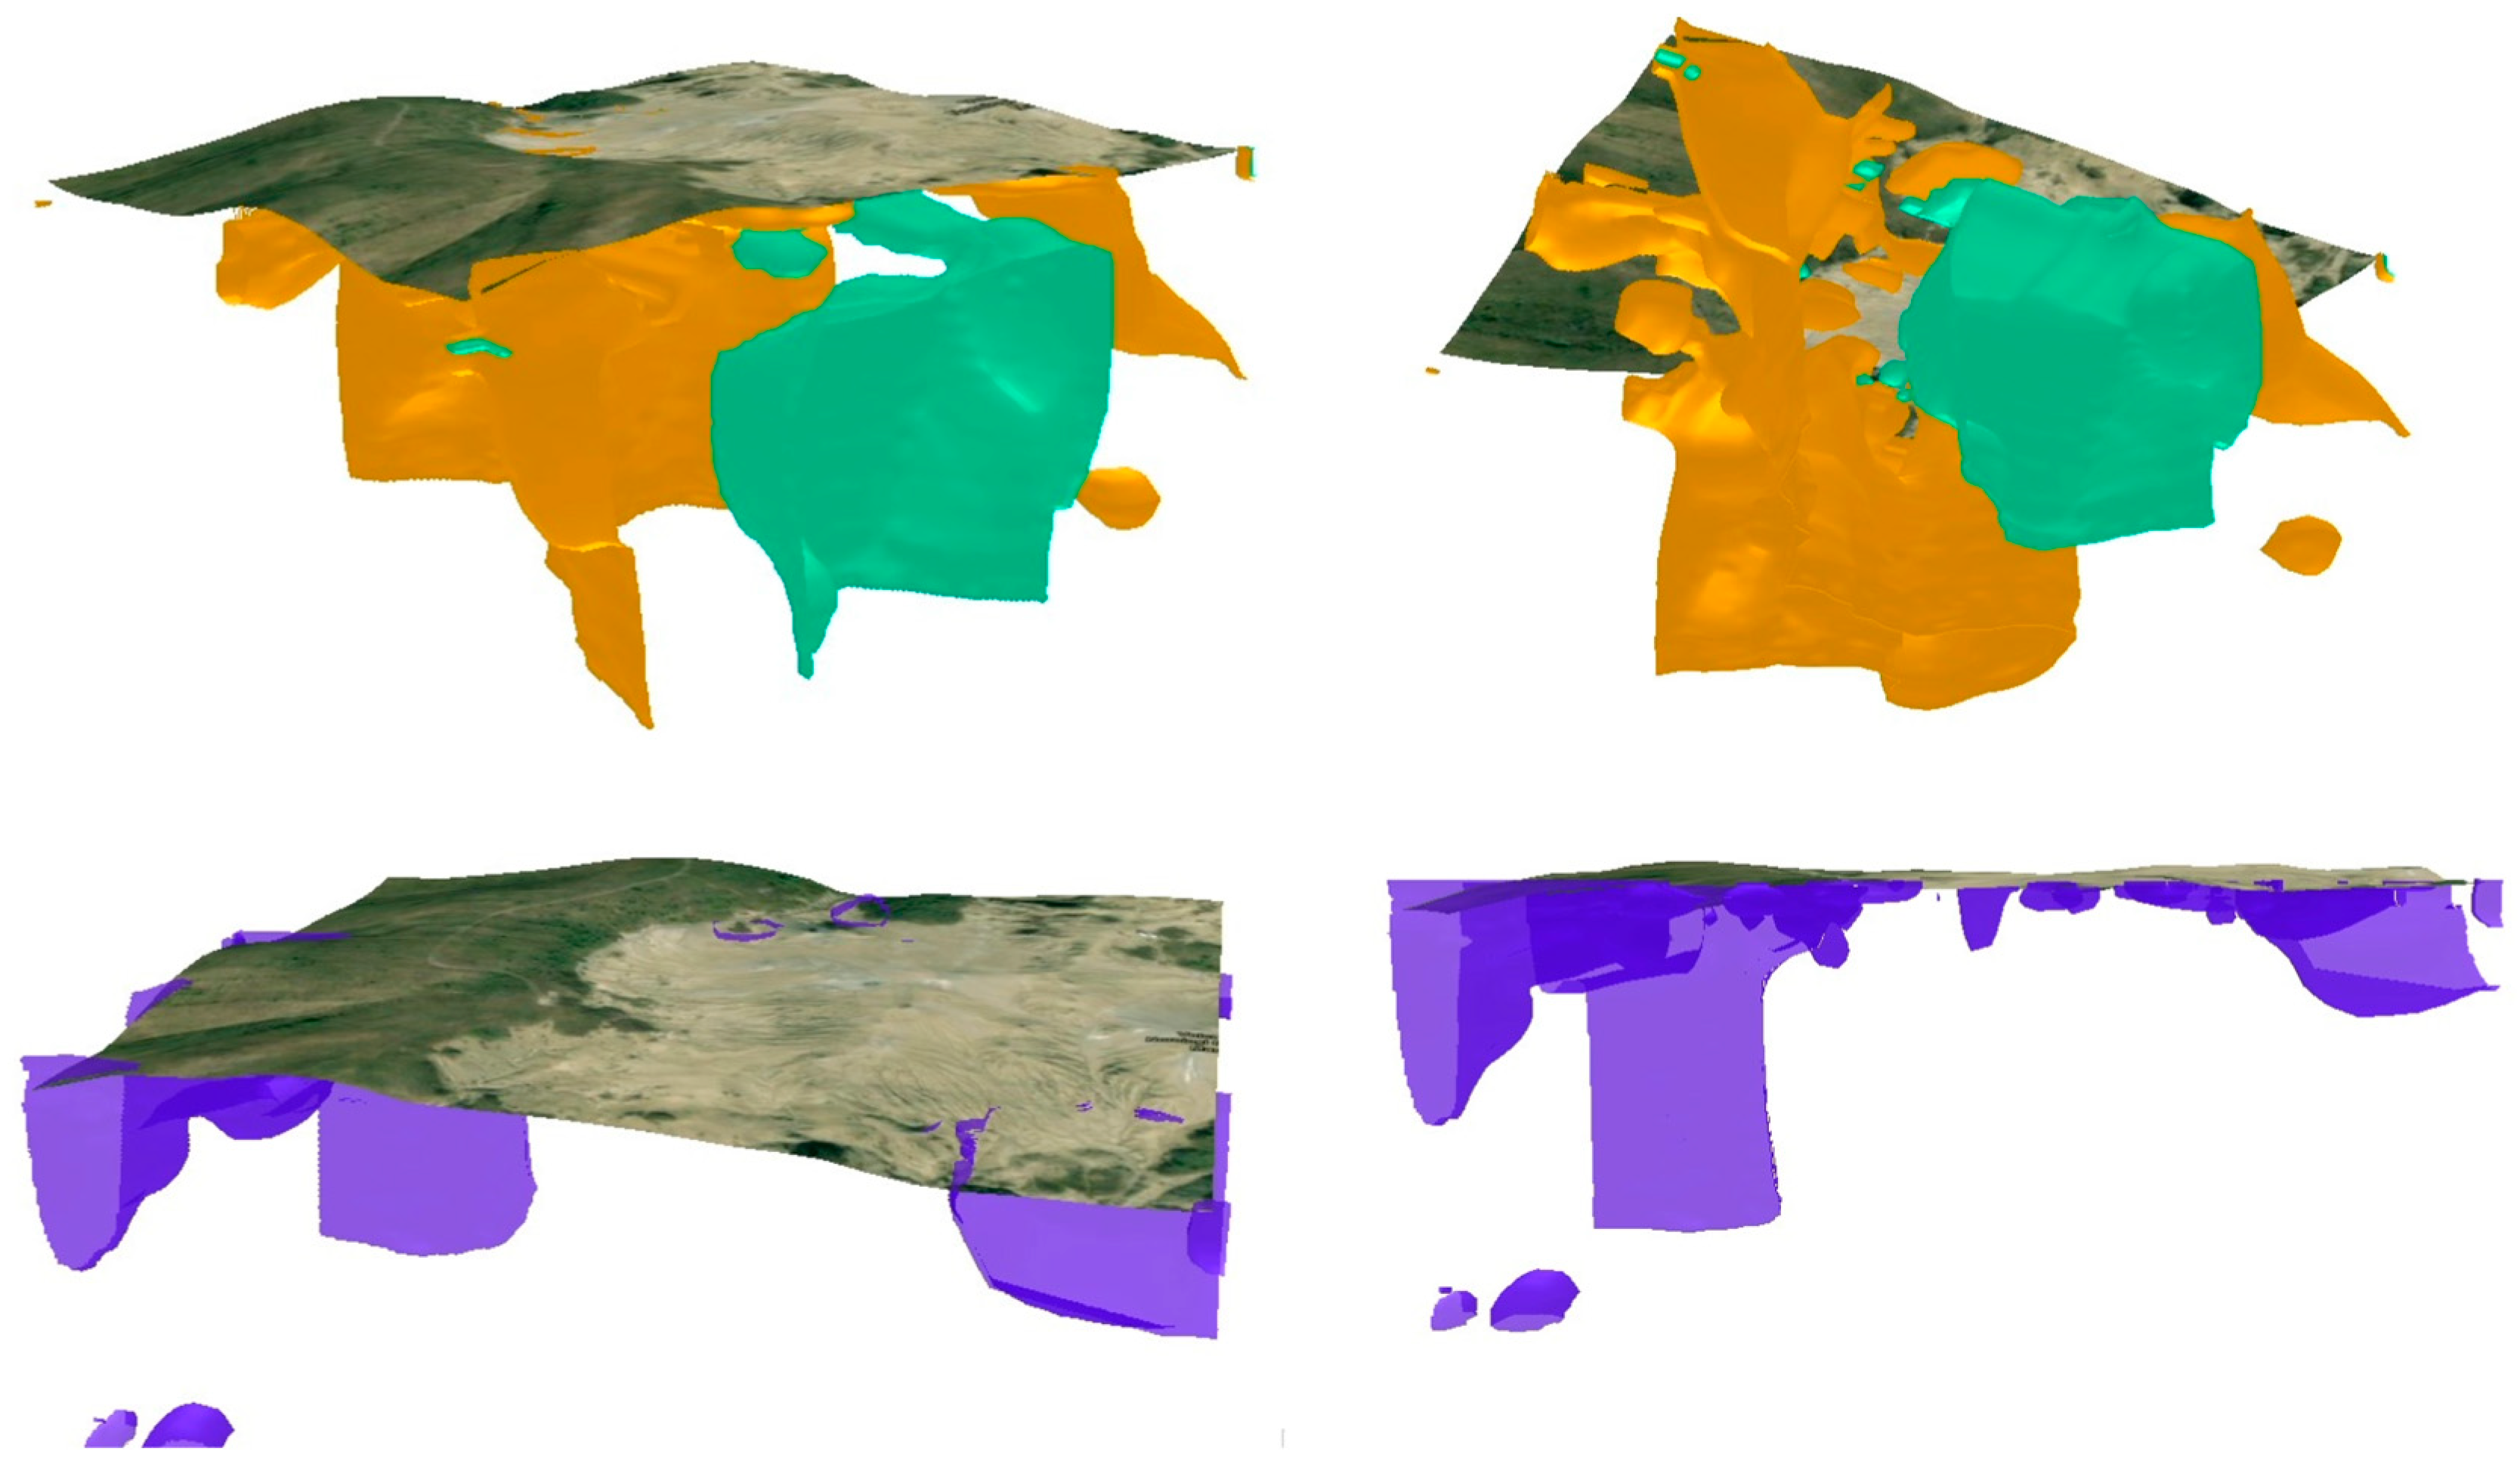
From the same data above, we separate several isosurfaces that are potentially indicative of the mud volcano system. It is unclear what isosurface corresponds to features of interest. However, we emphasize an isosurface of 0.8 ohm.m (Figure 11) as the first isosurface that extends from the surface down to the deeper part and that we consider to be a noteworthy surface. It is plausible (though unconfirmed) that this isosurface is indicative of the mud volcano “plumbing” system.
We also highlight two other isosurfaces of 1.44 and 2 ohm.m, respectively (Figure 12). These cover most of the volume under the mud volcano area and account for the vast majority of data points. These isosurfaces serve as an important basis for our interpretation.
4. Discussion
The observed resistivity values are substantially lower than what was expected. Despite challenging conditions, the FullWaver system appears to offer a reliable 3D method to survey this area from a geoelectrical standpoint, overcoming the difficulties. The strong injected current offered a way to obtain information from up to around a 150 m depth, which would have likely not been possible with conventional ERTs, and having a true 3D model allows for visualizing the data from different angles and areas inside the 3D model, with higher accuracy and less interpolation biases due to the nature of the FullWaver system, as well as the spread of measured points and their direction. In our opinion, it is also important to emphasize the speed of data acquisition—the entire dataset comes from one survey day.
The approach appears well suited when considering the sharp topographic variations as well. Should the distance between stations be increased, even deeper information could be obtained. As the literature only features a few examples of this methodology, and as this site is so unusual from a geoelectrical standpoint, the depth of penetration was challenging to estimate. In terms of data acquisition practices, we note that the longest amount of time was spent on deploying the mobile injection, and this can be significantly reduced with thorough planning and cables of appropriate lengths.
For this type of objective, the resolution provided by this distance between stations appears to be sufficient. In fact, the distance could be increased to obtain deeper penetration at the expense of the resolution—given the investigated objective, this seems reasonable for future campaigns. This approach is particularly recommended as the negative anomaly (which is of interest) continues deeper than the investigated area. A deeper geoelectrical survey is necessary to constrain this anomaly (or another geophysical method).
Nevertheless, the data presented here also highlight some areas of interest.
The area of anomalously low resistivity likely corresponds to an area of mud volcano activity. Different isosurfaces, notably the one around 0.8 ohm.m, could be linked to features of interest, corresponding to the areas richest in conductive brine. The geometry of the isosurface is consistent with what would be expected from subsurface mud volcano features. If indeed indicative of mud volcano plumbing, this would suggest a mostly vertical conduit, as well as one that feeds into surface features, closer to the surface. Several elements on this isosurface also appear nearer the surface, also potentially indicating areas of activity.
However, it is unclear what values would correspond to areas of volcanic activity. We expect the lowest resistivity isosurfaces to be indicative of brine-rich areas of mud volcano activity, but it is unclear what values correspond to what type of feature. The fact that this is not well constrained brings major difficulties in interpreting the geoelectrical data. Another geophysical method could offer a deeper layer of understanding regarding the structure. Nevertheless, based on geoelectrical data alone, some inferences can be made about the general subsurface structure of the mud volcano.
Overall, our findings highlight only a partial correlation between the surface and subsurface structures of the mud volcano. This correlation is crucial for understanding the distribution of the subsurface dynamics of mud volcanoes. However, it is possible that we have only found one area of subsurface activity, and others may be in the yet-unsurveyed area.
In addition to providing insights into the structure and dynamics of the Pâclele Mici mud volcano, this study also demonstrated the effectiveness of the V-FullWaver system in challenging geophysical environments. The system’s ability to capture detailed subsurface data in an area with high conductivity and complex topography was particularly noteworthy. This opens up new possibilities for studying similar geological features in other parts of the world.
Nevertheless, we acknowledge the limitations of this work. Our focus was primarily on demonstrating the feasibility of this particular geoelectrical approach and creating a true 3D model of the subsurface rather than providing a comprehensive understanding of the entire mud volcano system. We also provide no other validation method. Future research should aim to integrate this approach with other geophysical and geochemical methods to achieve a more holistic understanding of mud volcanoes—and this is already an ongoing project.
Additionally, the study was constrained to a single site—the Pâclele Mici mud volcano—and even for that mud volcano, only a part was covered (see Figure 4), so there may be some information missing. Extending this research to the rest of the Pâclele Mici mud volcano and the other nearby mud volcanoes, especially those with differing geological and geochemical characteristics, would be beneficial in validating and refining our findings and methodologies.
5. Conclusions and Future Work
In conclusion, we must note the challenges of conducting geoelectrical surveys in the context of mud volcanoes but also highlight the considerable potential of these methods in unraveling the intricate details of this type of geological phenomenon. The resistivity values obtained in this survey are comparable to those in previous geoelectrical surveys discussed in the literature, and we obtain a significant depiction of the subsurface resistivity parameters that are indicative of the mud volcano’s plumbing system.
This work represents a pioneering effort in the geophysical exploration of mud volcanoes in Romania, focusing on the Pâclele Mici mud volcano in Buzău County. The findings demonstrate the efficacy and challenges of using deep geoelectrical surveys in such environments. Despite the inherent difficulties associated with high soil conductivity and topographic variations, our research provides a significant advancement in understanding the subsurface characteristics of mud volcanoes.
Strong currents are required for a deeper investigation, and the V-FullWaver is a good solution for this task. This is still a relatively new geophysical approach, and the methodological challenge of optimizing the method is still an ongoing challenge.
We also highlight the practical implications of this. Covering a large area, in significant depth, at satisfying resolution, with a small team, and in a relatively short period of time, is significant. We estimate this to be substantially faster and offer more information than conventional ERT measurements or Vertical Electrical Sounding.
Our work at the Pâclele Mici mud volcano contributes to the broader understanding of these geological structures, revealing the potential complexity of their subsurface dynamics which can be vastly different from their surface manifestations. It underscores the importance of employing advanced geophysical techniques to study such features, especially in regions where traditional methods face significant limitations.
Importantly, this research opens avenues for further exploration and study of mud volcanoes, not only in Romania but globally. The methodology and findings presented here can be adapted and applied to other mud volcanoes, enriching our understanding of these fascinating natural phenomena. Such studies are essential not only for academic curiosity but also for practical reasons, such as assessing geological hazards, understanding methane emissions, and exploring potential hydrocarbon reservoirs.
This marks only the first stage of a longer, multiyear project that will deploy various geophysical and geodetic methods for a more holistic understanding of the mud volcano system at Pâclele Mici (and other nearby sites). The immediate steps are the creation of a more precise DTM using LiDAR and the expansion of the surveyed area using the FullWaver.
Afterward, further geophysical data (seismic, gravity) will be acquired, along with UAV data (thermal, magnetic), using all the available instrumentation at our lab. Ultimately, the plan is to integrate all these geophysical data and produce a geological interpretation of them. We note that the most significant limitation of this work is the lack of either a direct proofing of the findings (not feasible in this context) or an additional subsurface geophysical method, which will be addressed in the future.
Author Contributions
Conceptualization, A.M., A.G., D.T., E.N. and B.G.; methodology, A.M., A.G., D.T., E.N. and B.G.; software, A.M. and A.G.; investigation, A.M. and A.G.; resources, D.T. and E.N.; writing—original draft preparation, A.M.; writing—review and editing, A.G.; visualization, A.G. and A.M.; supervision, D.T.; project administration, D.T.; funding acquisition, D.T. All authors have read and agreed to the published version of the manuscript.
Funding
This work is supported by the SETTING Project (Integrated thematic services in the field of Earth observation—a national platform for innovation), co-financed by the Regional Development European Fund (FEDR) through the Operational Competitivity Programme 2014–2020 (contract no. 336/390012).
Data Availability Statement
The datasets presented in this article are not readily available because they are part of a larger ongoing study.
Acknowledgments
We would like to thank Fabrice Vermeersch for his advice and valuable and knowledgeable input. We would also like to thank Răzvan Popa and the Buzău Land Geopark for their support.
Conflicts of Interest
The authors report no conflict of interest.
References
- Hong, W.-L.; Etiope, G.; Yang, T.F.; Chang, P.-Y. Methane Flux from Miniseepage in Mud Volcanoes of SW Taiwan: Comparison with the Data from Italy, Romania, and Azerbaijan. J. Asian Earth Sci. 2013, 65, 3–12. [Google Scholar] [CrossRef]
- Grassi, S.; De Guidi, G.; Patti, G.; Brighenti, F.; Carnemolla, F.; Imposa, S. 3D Subsoil Reconstruction of a Mud Volcano in Central Sicily by Means of Geophysical Surveys. Acta Geophys. 2022, 70, 1083–1102. [Google Scholar] [CrossRef]
- Nanni, T.; Zuppi, G.M. Acque salate e circolazione profonda in relazione all’assetto strutturale del fronte adriatico e padano dell’Appennino. Mem. Soc. Geol. Ital. 1986, 35, 979–986. [Google Scholar]
- Kopf, A.J. Significance of mud volcanism. Rev. Geophys. 2002, 40, 2-1–2-52. [Google Scholar] [CrossRef]
- Rainone, M.L.; Rusi, S.; Torrese, P. Mud Volcanoes in Central Italy: Subsoil Characterization through a Multidisciplinary Approach. Geomorphology 2015, 234, 228–242. [Google Scholar] [CrossRef]
- Mazzini, A.; Carrier, A.; Sciarra, A.; Fischanger, F.; Winarto-Putro, A.; Lupi, M. 3D Deep Electrical Resistivity Tomography of the Lusi Eruption Site in East Java. Geophys. Res. Lett. 2021, 48, e2021GL092632. [Google Scholar] [CrossRef]
- Brighenti, F.; Carnemolla, F.; Messina, D.; De Guidi, G. UAV survey method to monitor and analyze geological hazards: The case study of the mud volcano of Villaggio Santa Barbara, Caltanissetta (Sicily). Nat. Hazards Earth Syst. Sci. 2021, 21, 2881–2898. [Google Scholar] [CrossRef]
- Hui, G.; Li, S.; Wang, P.; Zhu, J.; Guo, L.; Wang, Q.; Somerville, I.D. Neotectonic implications and regional stress field constraints on mud volcanoes in offshore southwestern Taiwan. Mar. Geol. 2018, 403, 109–122. [Google Scholar] [CrossRef]
- Cummins, P.R. Geohazards in Indonesia: Earth science for disaster risk reduction—Introduction. Geol. Soc. Lond. Spec. Publ. 2017, 441, 1–7. [Google Scholar] [CrossRef]
- Remizovschi, A.; Carpa, R.; Drăgan-Bularda, M. Biological and geological traits of terrestrial mud volcanoes—A review. Analele Univ. Oradea Fasc. Biol. 2018, 25, 102–114. [Google Scholar]
- Melinte-Dobrinescu, M.C.; Brustur, T.; Jipa, D.; Macaleţ, R.; Ion, G.; Ion, E.; Popa, A.; Stănescu, I.; Briceag, A. The Geological and Palaeontological Heritage of the Buzău Land Geopark (Carpathians, Romania). Geoheritage 2017, 9, 225–236. [Google Scholar] [CrossRef]
- Sandulescu, M. Tectonica Romaniei; Editura Tehnică: Bucharest, Romania, 1984. [Google Scholar]
- Bonini, M.; Ruldoph, M.; Manga, M. Long- and short-term triggering and modulation of mud volcano eruptions by earthquakes. Tectonophysics 2016, 672–673, 190–211. [Google Scholar] [CrossRef]
- Etiope, G. Natural emissions of methane from geological seepage in Europe. Atmos. Environ. 2009, 43, 1430–1443. [Google Scholar] [CrossRef]
- Sencu, V. The Mud Volcanoes from Berca; Bucharest Sport-Turism Publ.H.: Bucharest, Romania, 1985. [Google Scholar]
- Madeja, G.; Mrowczyk, P. Phenomenon of mud volcanoes in western Romania as a geoturism object. In Proceedings of the XIX-th Congress of the CarpathoBalkan Geological Association, Thessaloniki, Greece, 23–26 September 2010; pp. 491–502. [Google Scholar]
- Chitea, F.; Mitrofan, H.; Fikos, I.; Stanciu, I.M.; Diacopolos, C.; Stochici, R. Geophysical and Geochemical observations on mud volcanoes from Paclele Mici, Romania. Rev. Roum. Geophys. 2019, 61–62, 57–68. [Google Scholar]
- Marunteanu, C.; Ioane, D. Muddy Volcanoes. In Natural Heritage from East to West; Evelpidou, N., Figueiredo, T., Mauro, F., Tecim, V., Vassilopoulos, A., Eds.; Springer: Berlin/Heidelberg, Germany, 2009. [Google Scholar] [CrossRef]
- Gunther, T.; Rucker, C.; Spitzer, K. Three-dimensional modelling and inversion of dc resistivity data incorporating topography—II. Inversion. Geophys. J. Int. 2006, 166, 506–517. [Google Scholar] [CrossRef]
- Blake, O.O.; Ramsook, R.; Iyare, U.C.; Moonan, X.R.; Gopaul, R.C. Integrating Pseudo-3D ERT and DEM to Map the near-Surface Structures and Morphology of the Piparo Mud Volcano, Trinidad. J. Appl. Geophys. 2021, 194, 104442. [Google Scholar] [CrossRef]
- Holz, S.; Marion, J. The resistivity structure of the North Alex Mud Volcano as derived from the interpretation of CSEM data. In Proceedings of the EGU General Assembly, Vienna, Austria, 2–7 May 2010; p. 9841. [Google Scholar]
- Carrier, A.; Fischanger, F.; Gance, J.; Cocchiararo, G.; Morelli, G.; Lupi, M. Deep Electrical Resistivity Tomography for the Prospection of Low- to Medium-Enthalpy Geothermal Resources. Geophys. J. Int. 2019, 219, 2056–2072. [Google Scholar] [CrossRef]
- Chitea, F. Electrical signatures of mud volcanoes—Case studies from Romania. In Proceedings of the SGGEM 2106, Albena, Bulgaria, 30 June–6 July 2016; Conference Preceedings. Volume 1, p. III. [Google Scholar]
Figure 1.
A measuring station on the mud volcano surface.

Figure 2.
A measuring station on an area with sharp topography.
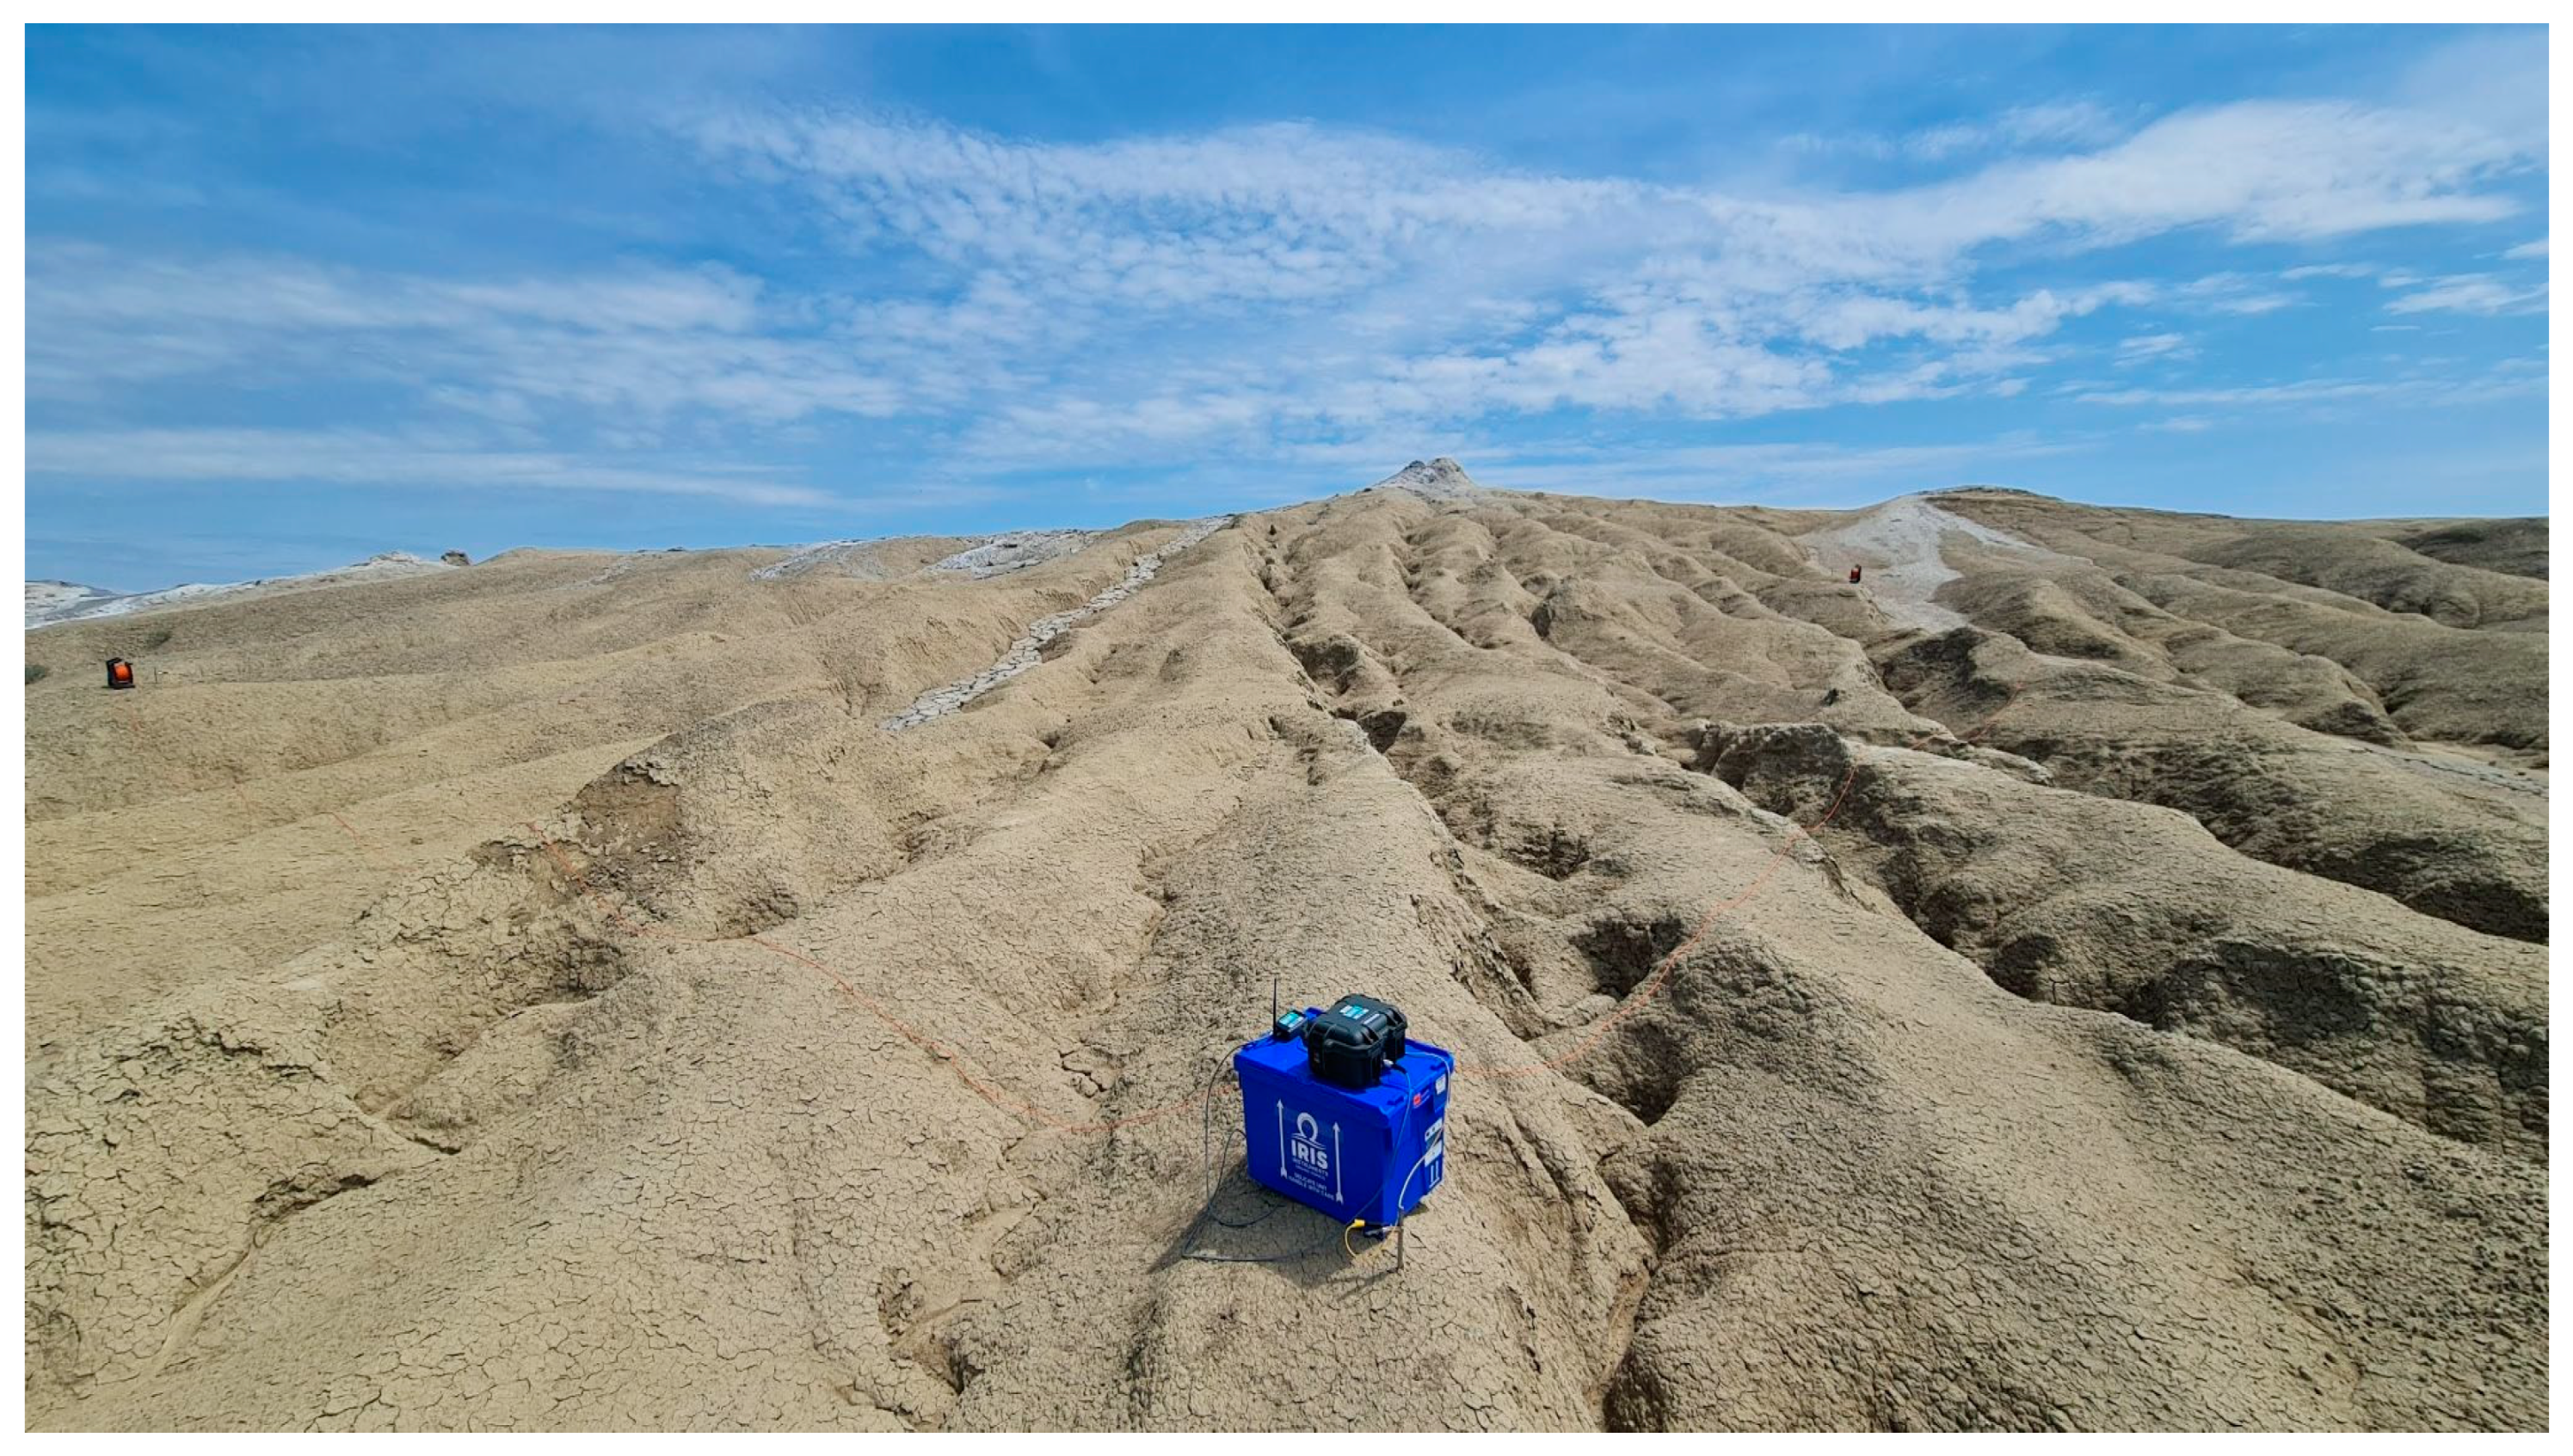
Figure 3.
Positioning of a representative ERT profile on the Pâclele Mici mud volcano, featuring low resistivity values.
Figure 3.
Positioning of a representative ERT profile on the Pâclele Mici mud volcano, featuring low resistivity values.
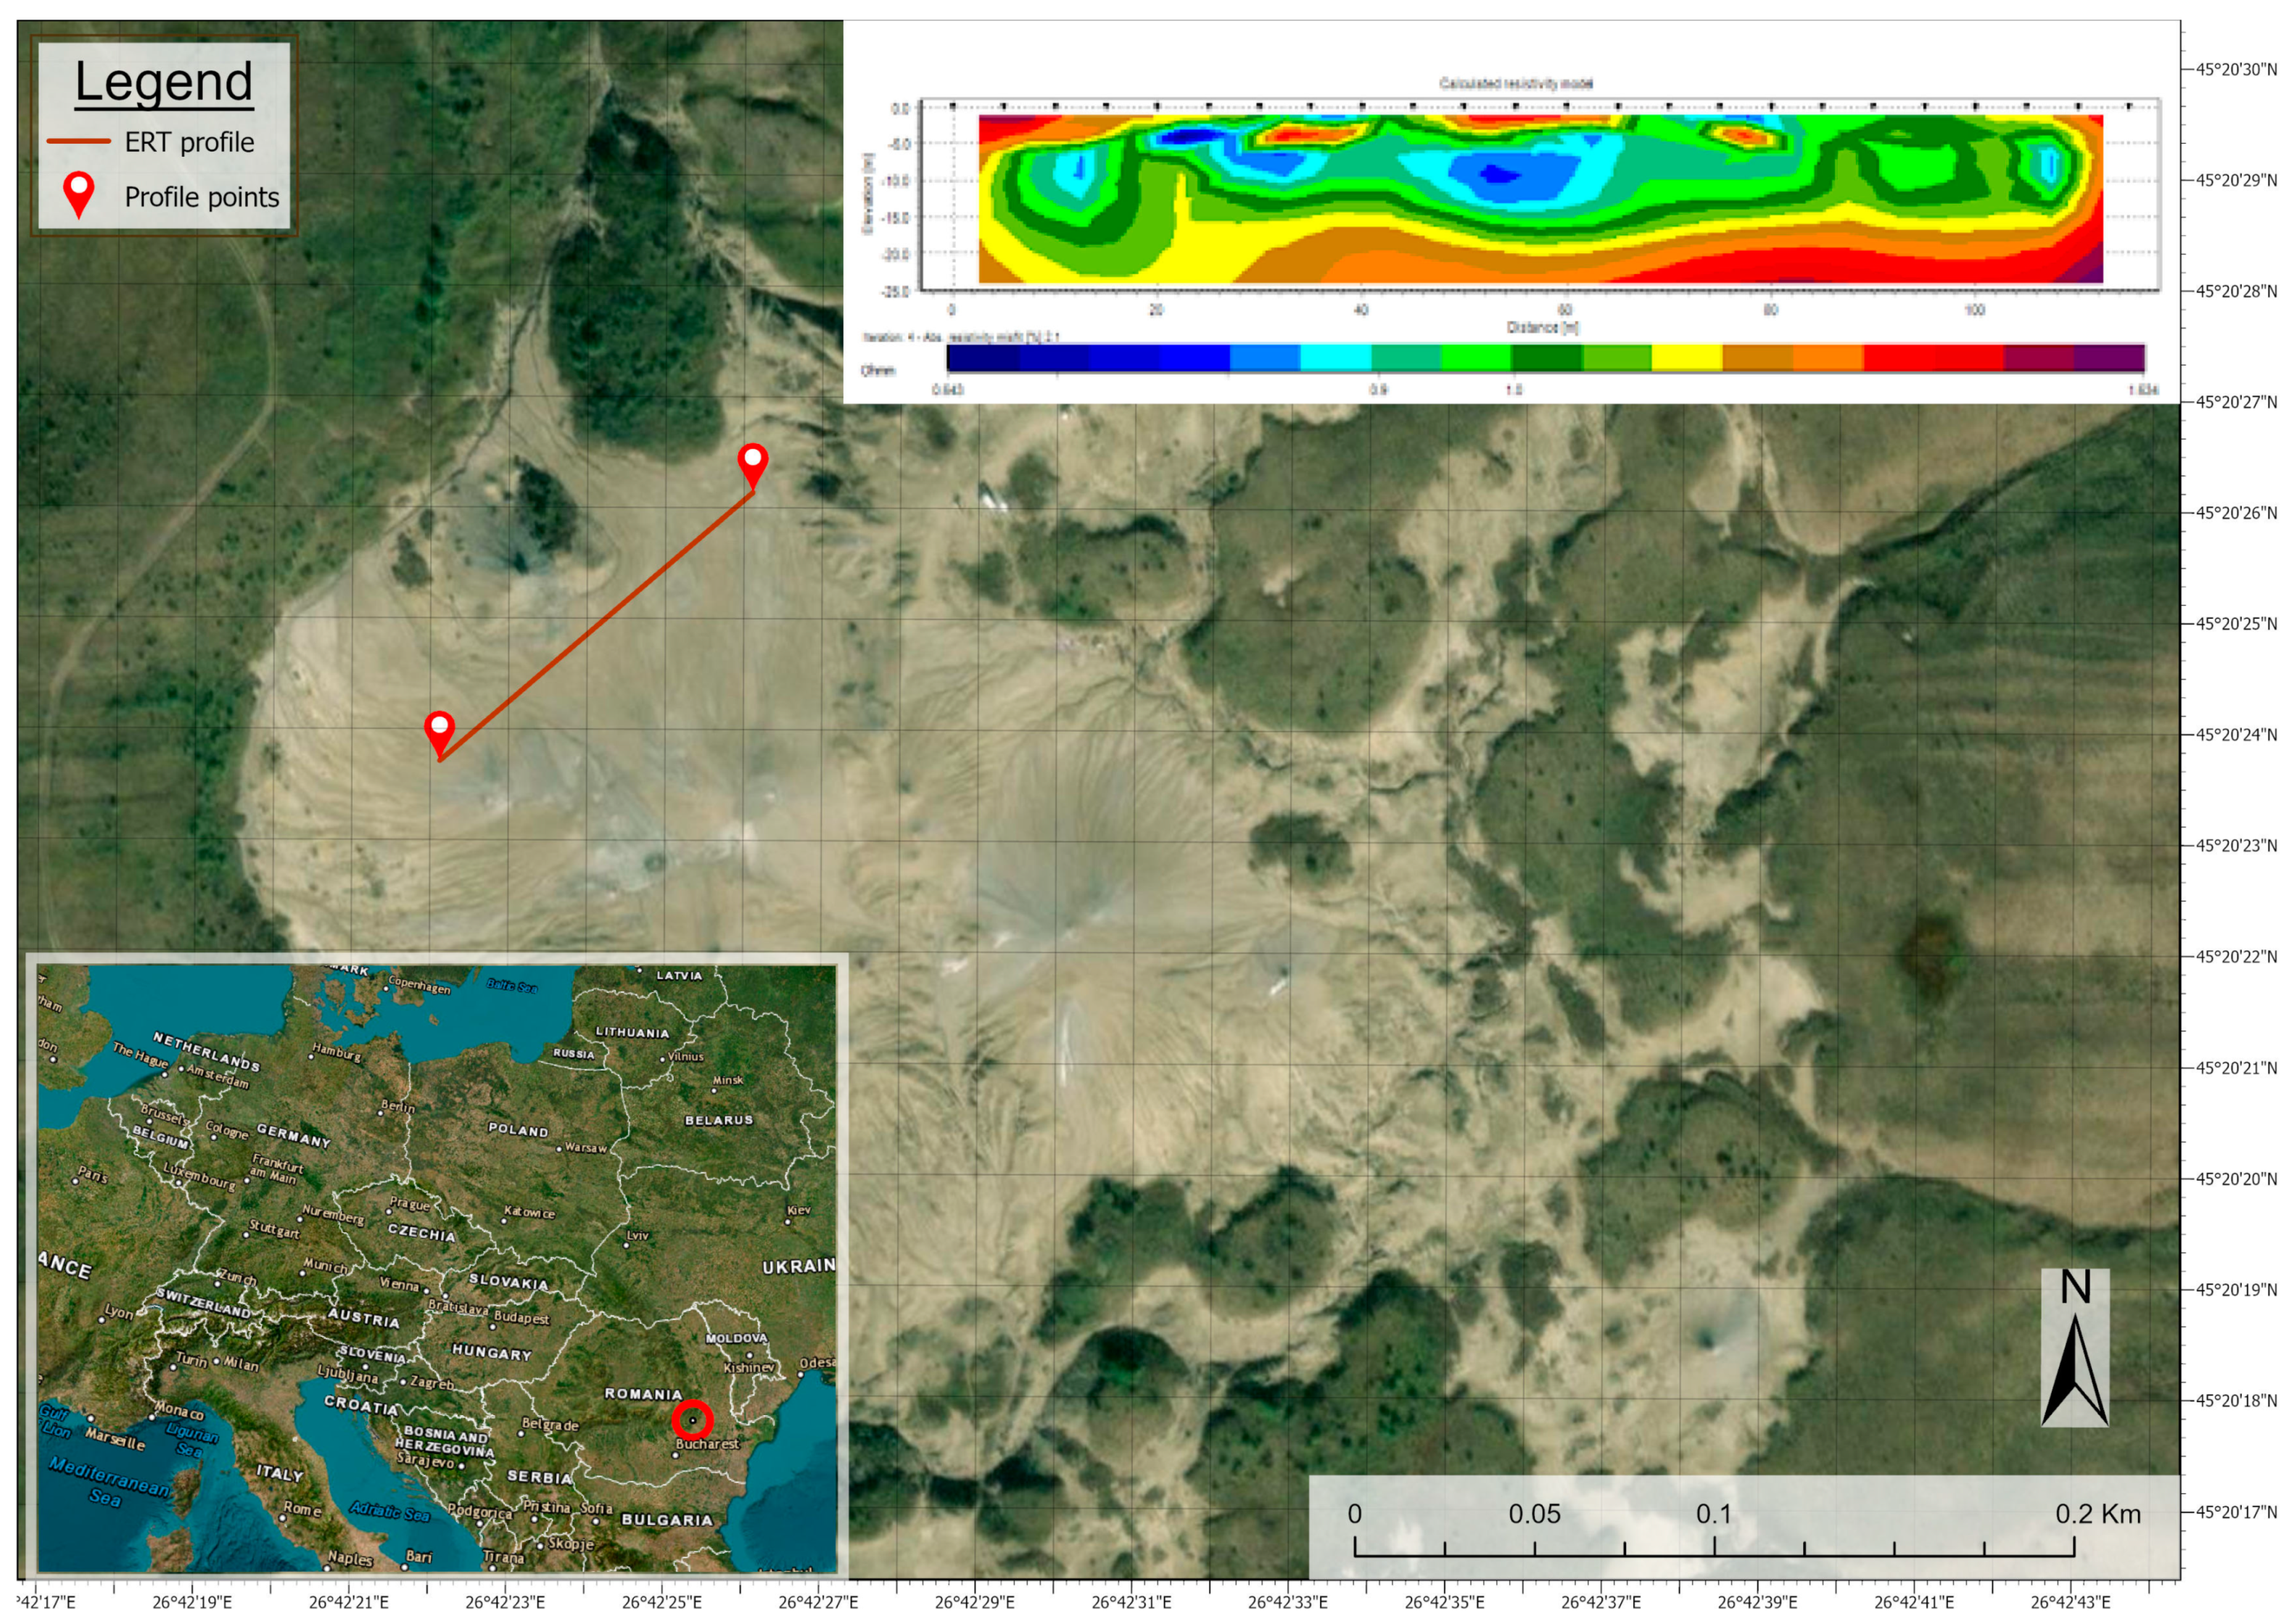
Figure 4.
A map displaying the distribution of measuring stations (in blue) and current injection stations (in red), overlaid on a local DEM.
Figure 4.
A map displaying the distribution of measuring stations (in blue) and current injection stations (in red), overlaid on a local DEM.

Figure 5.
Representation of measured data points and their resistivity values and a histogram of the values.
Figure 5.
Representation of measured data points and their resistivity values and a histogram of the values.
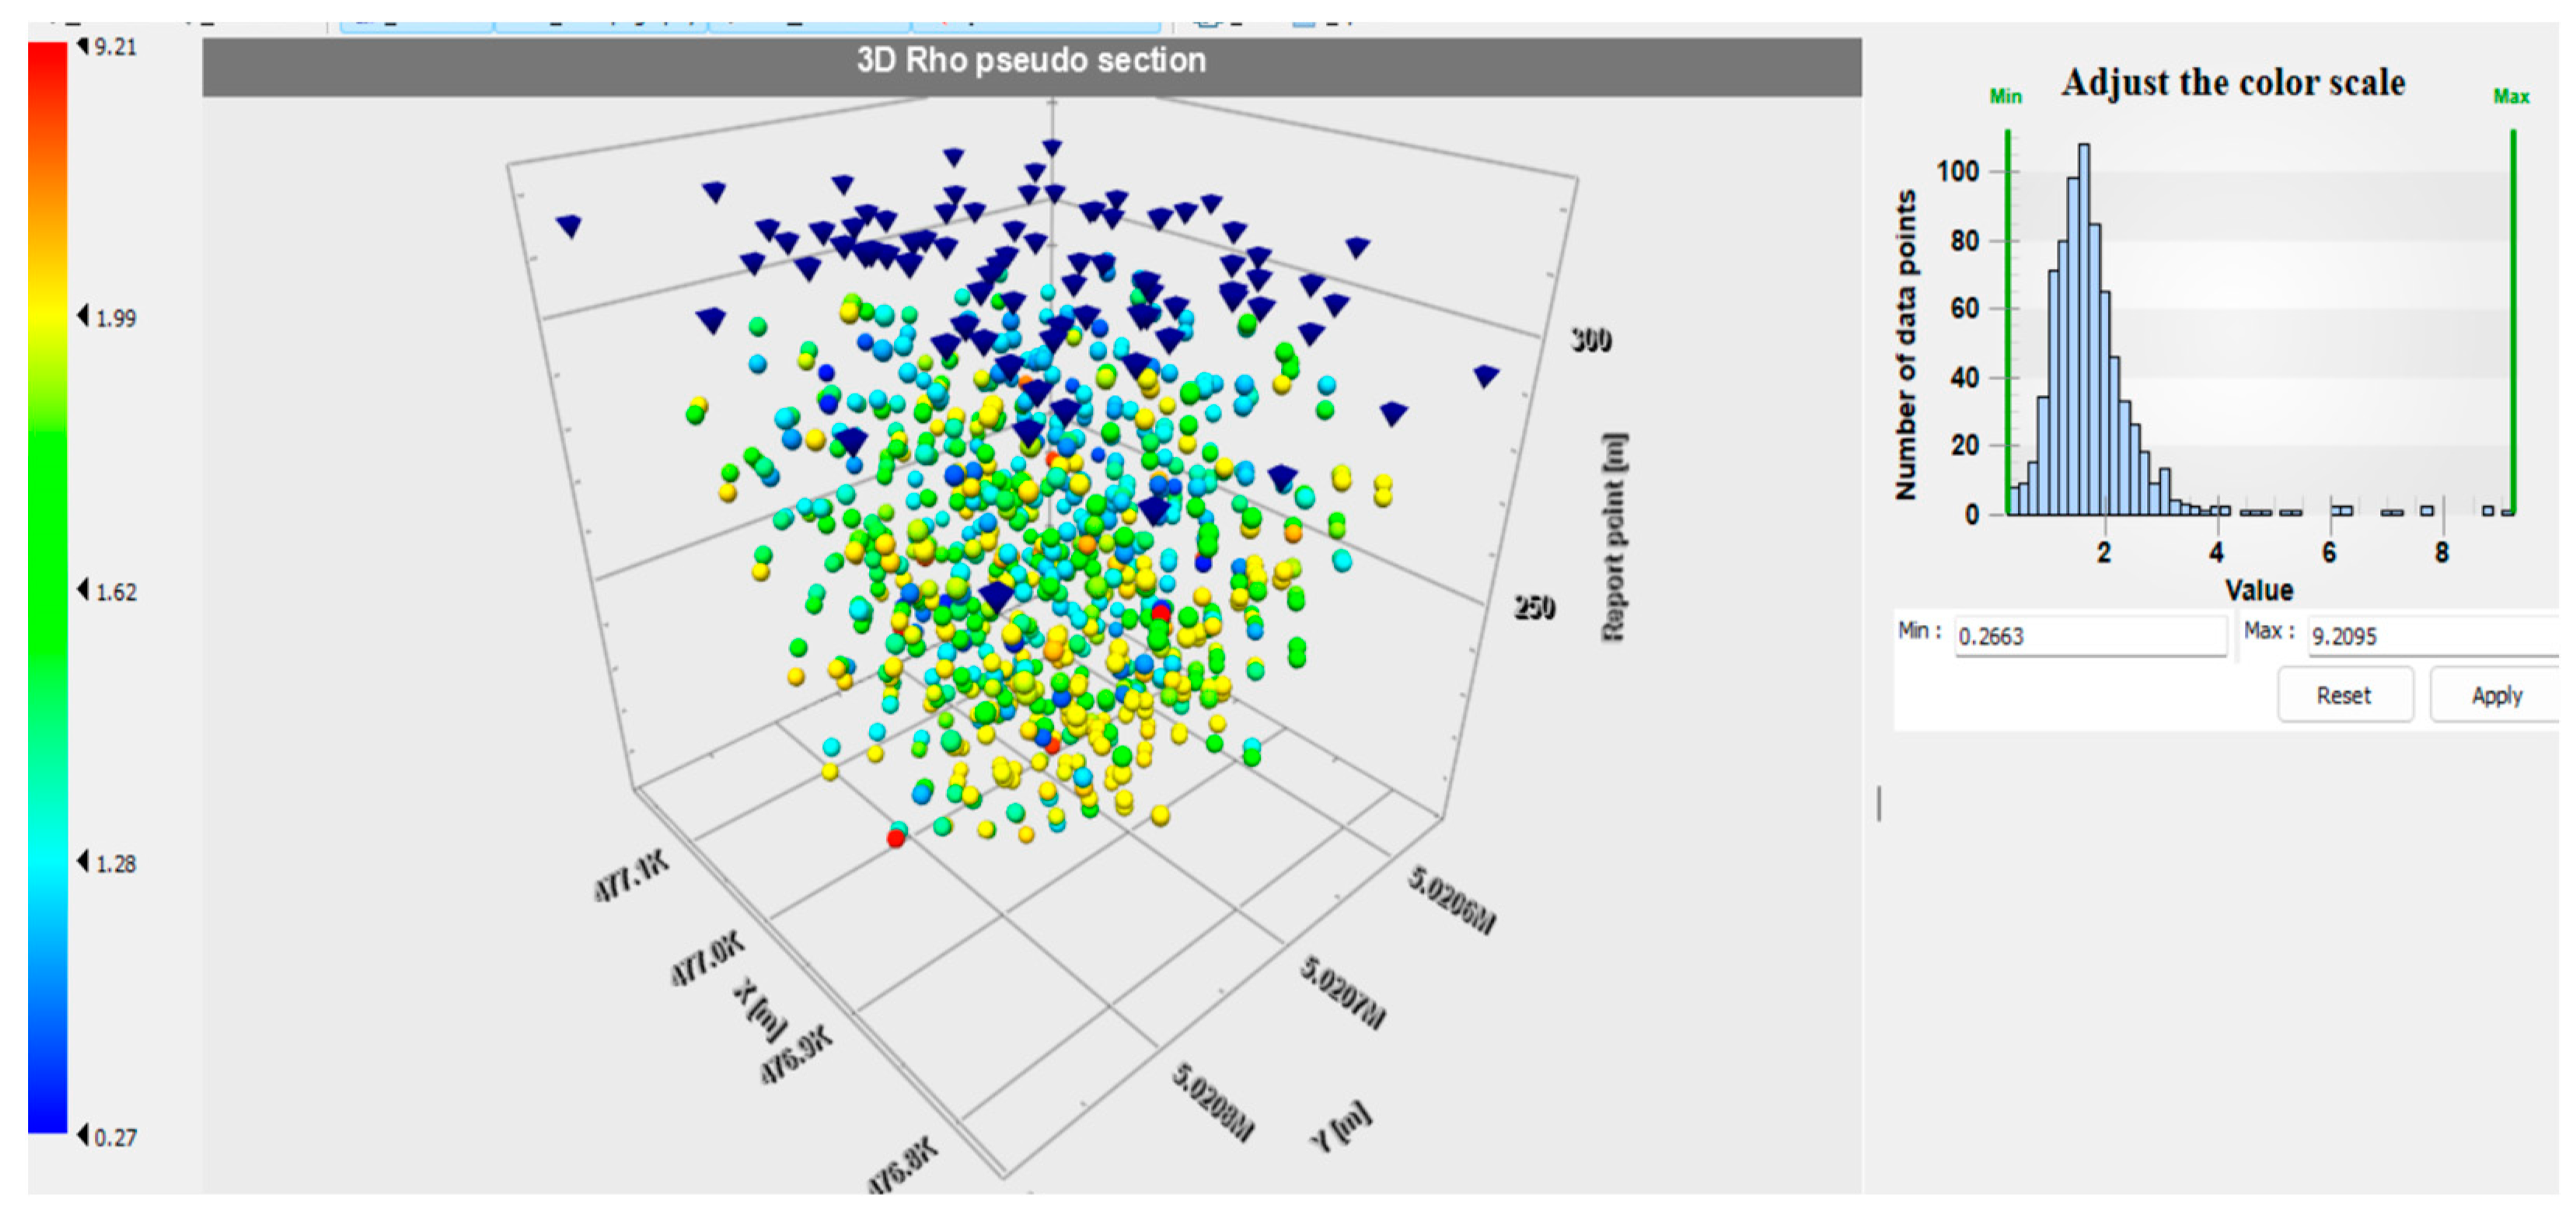
Figure 8.
Resistivity slices (horizontal) from the shallower part of the site.
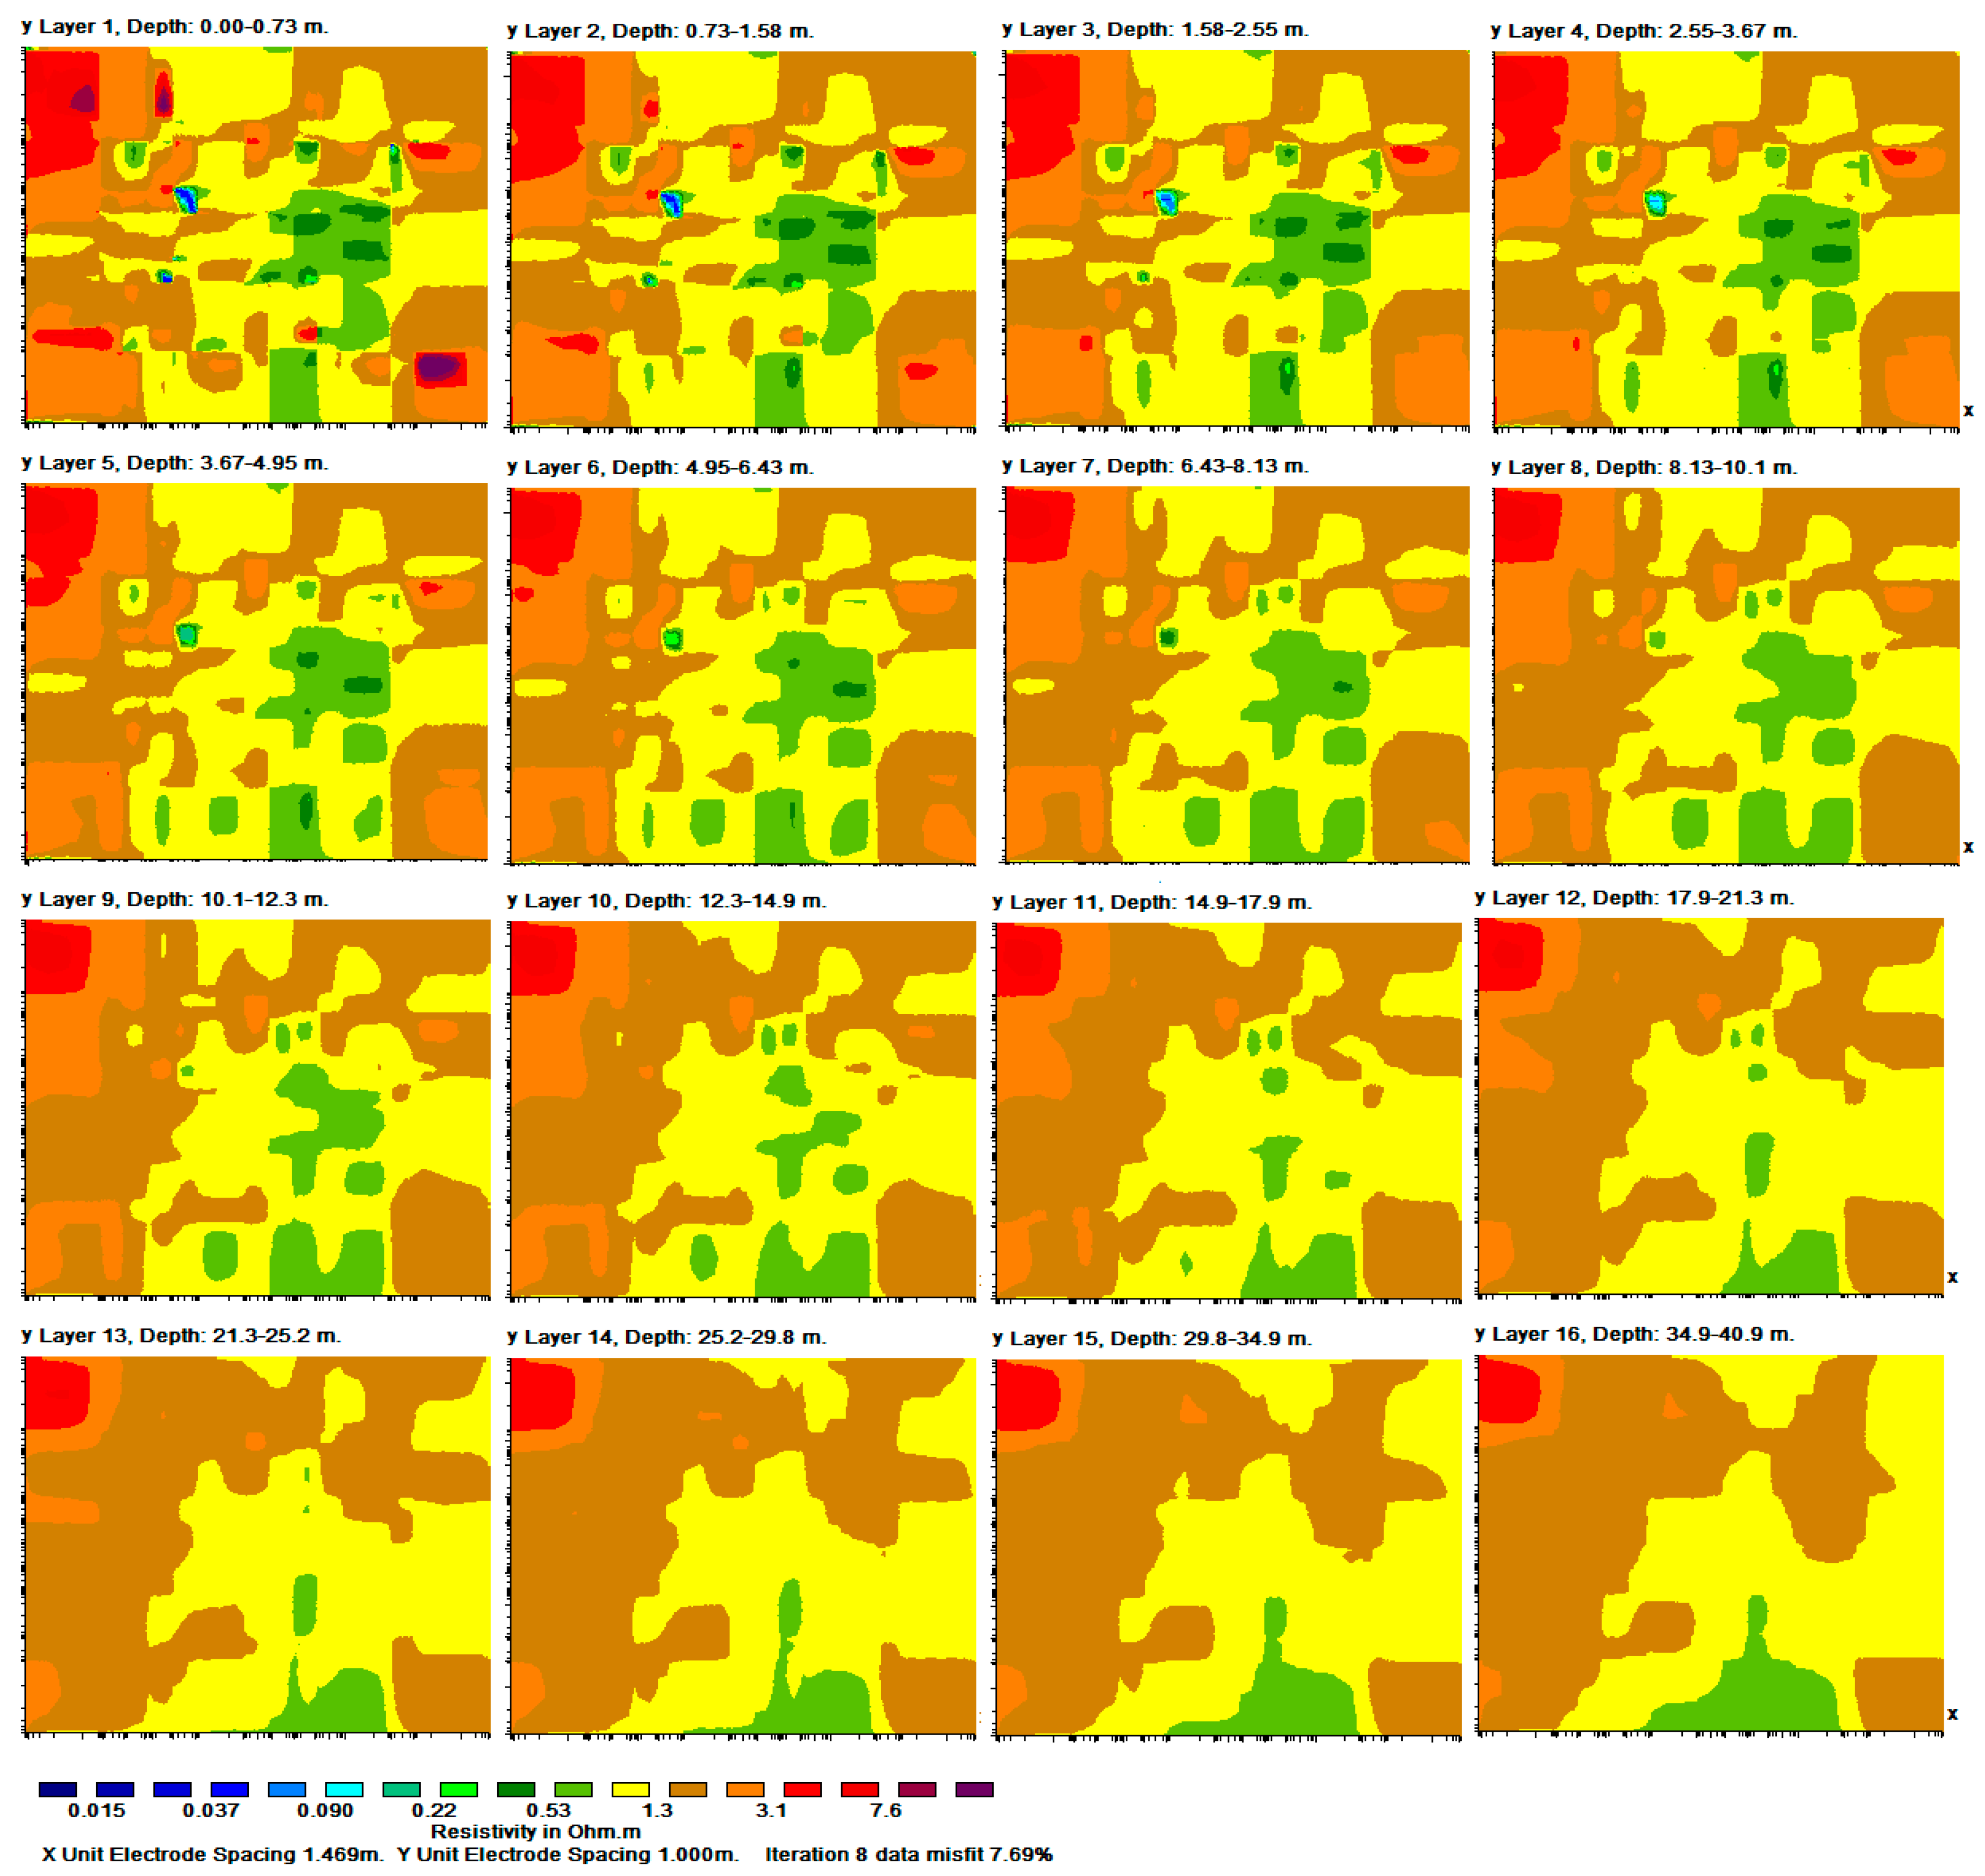
Figure 9.
Resistivity slices (horizontal) from the deeper part of the site.
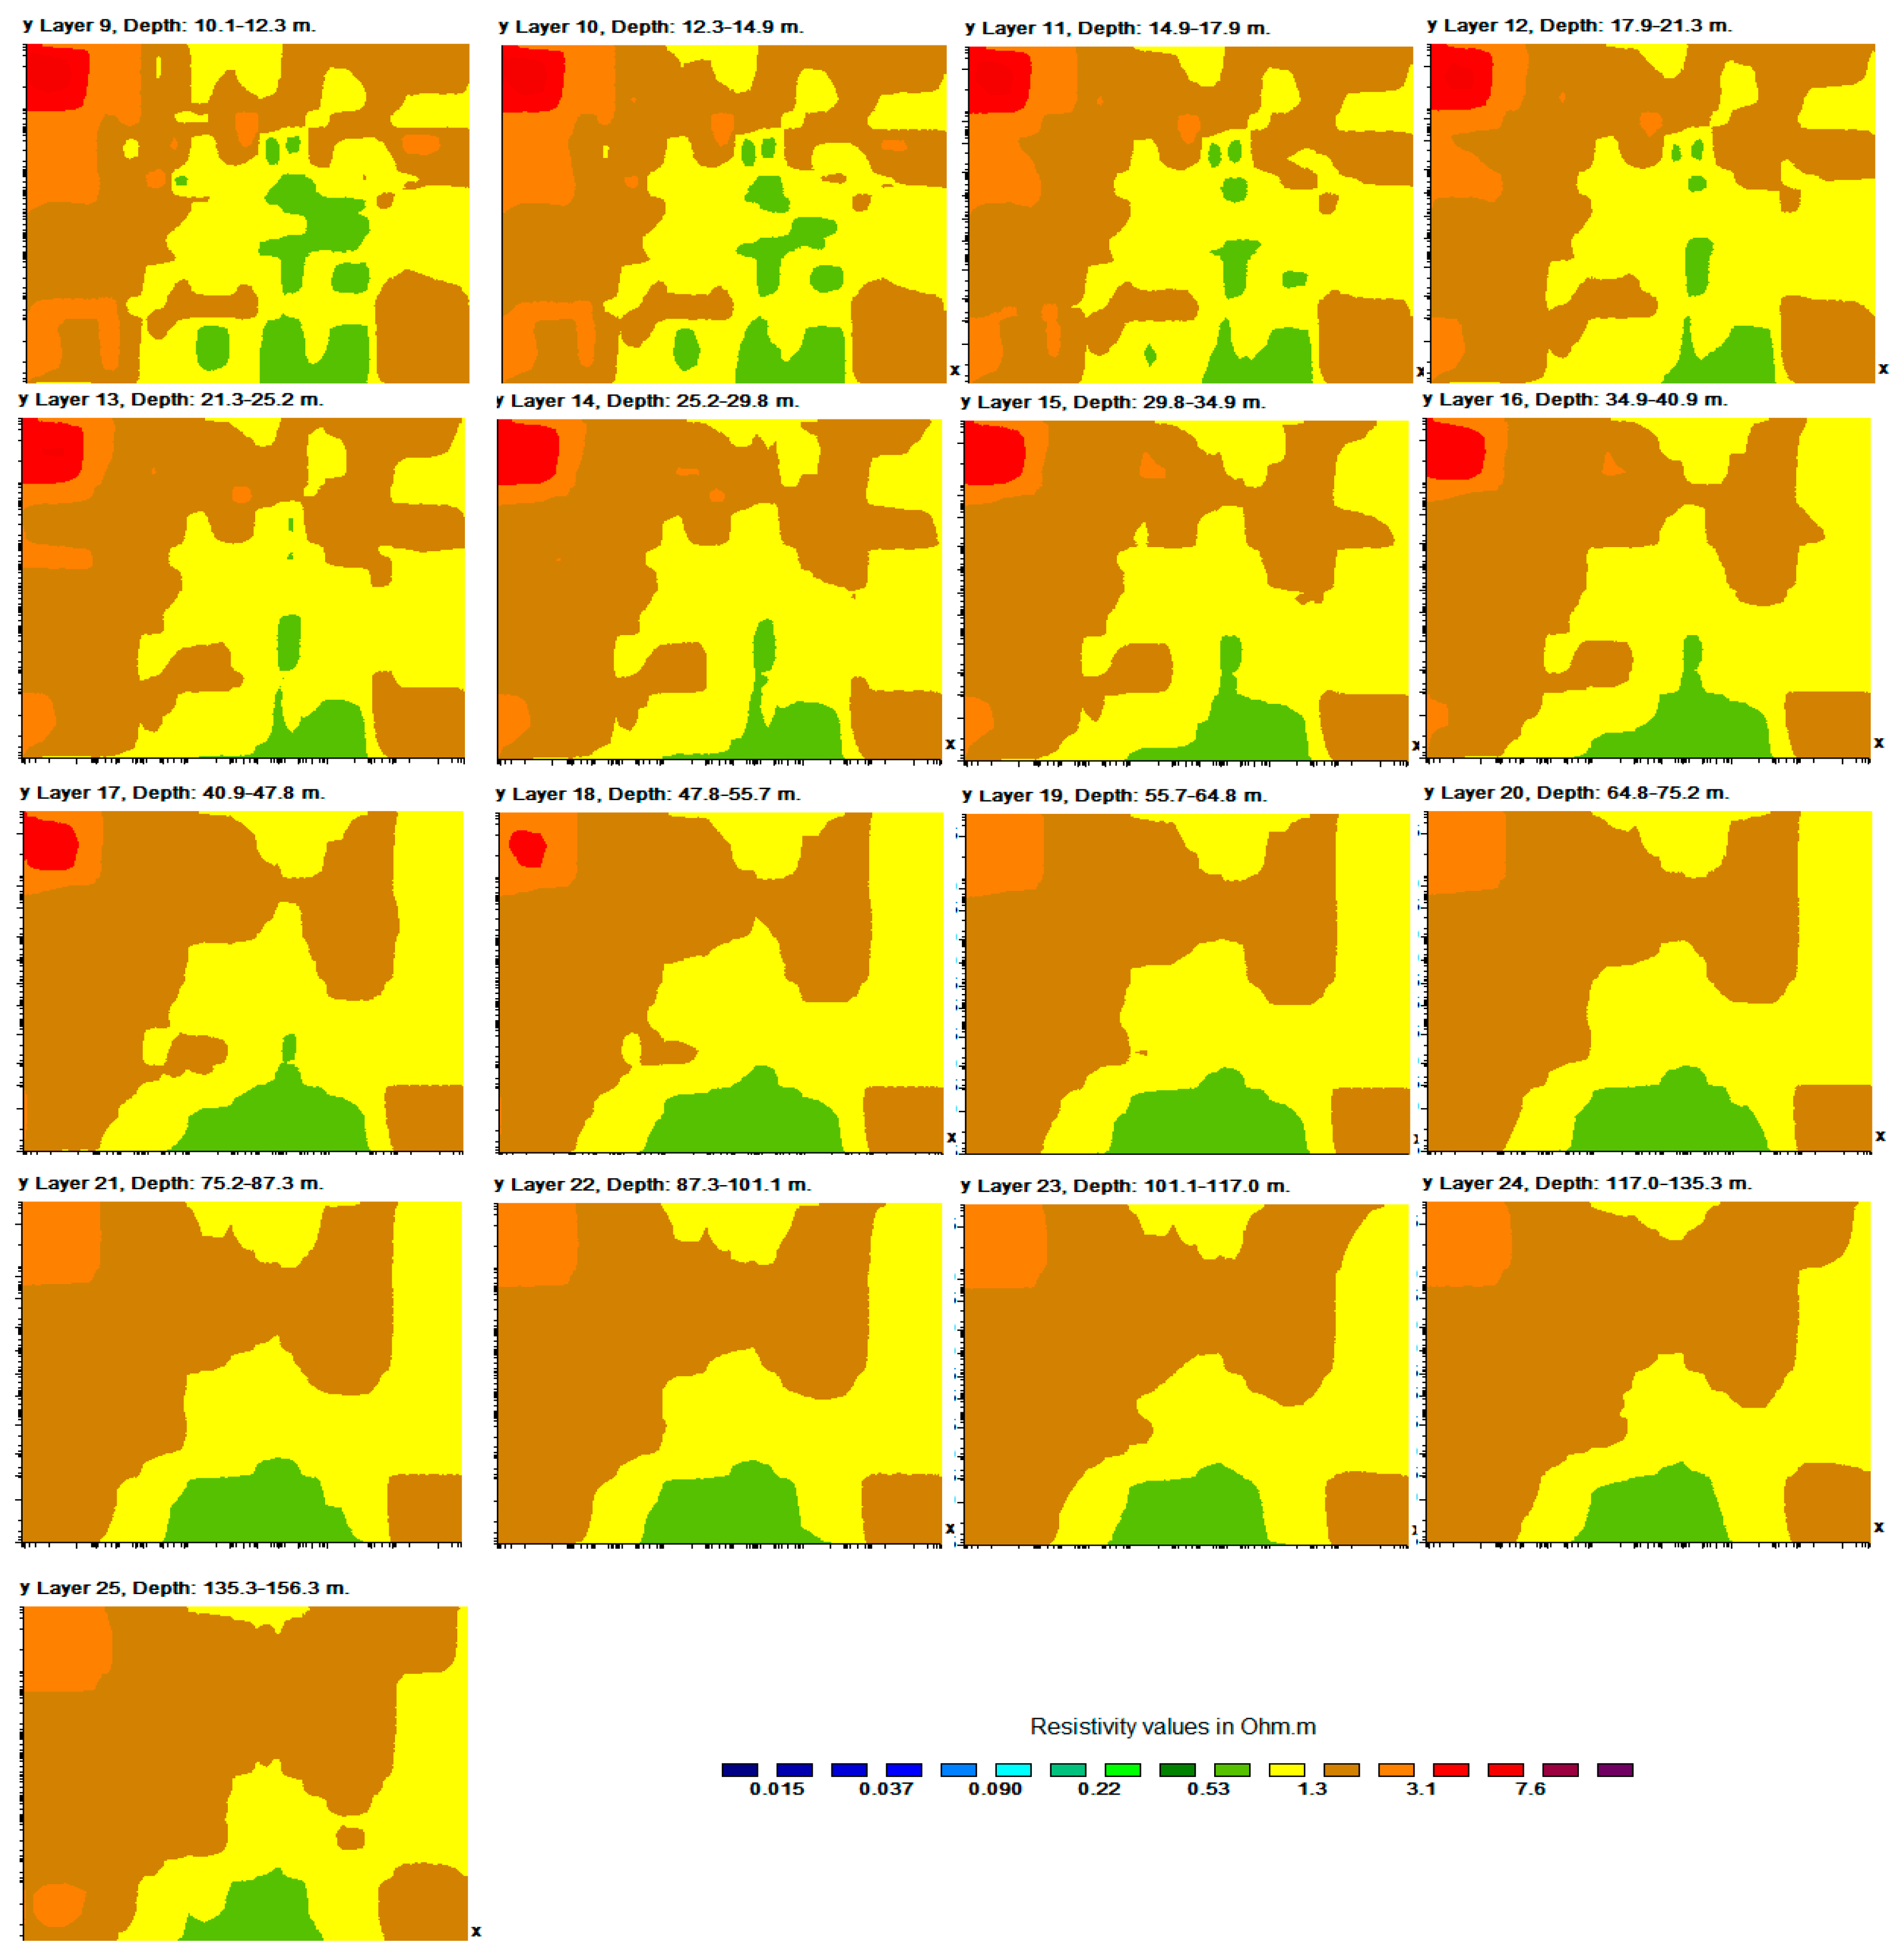
Figure 10.
Vertical slices also showcase a similar area of interest—an area of negative contrast, under 1 ohm.m. Representative vertical slices starting from 0,0.
Figure 10.
Vertical slices also showcase a similar area of interest—an area of negative contrast, under 1 ohm.m. Representative vertical slices starting from 0,0.
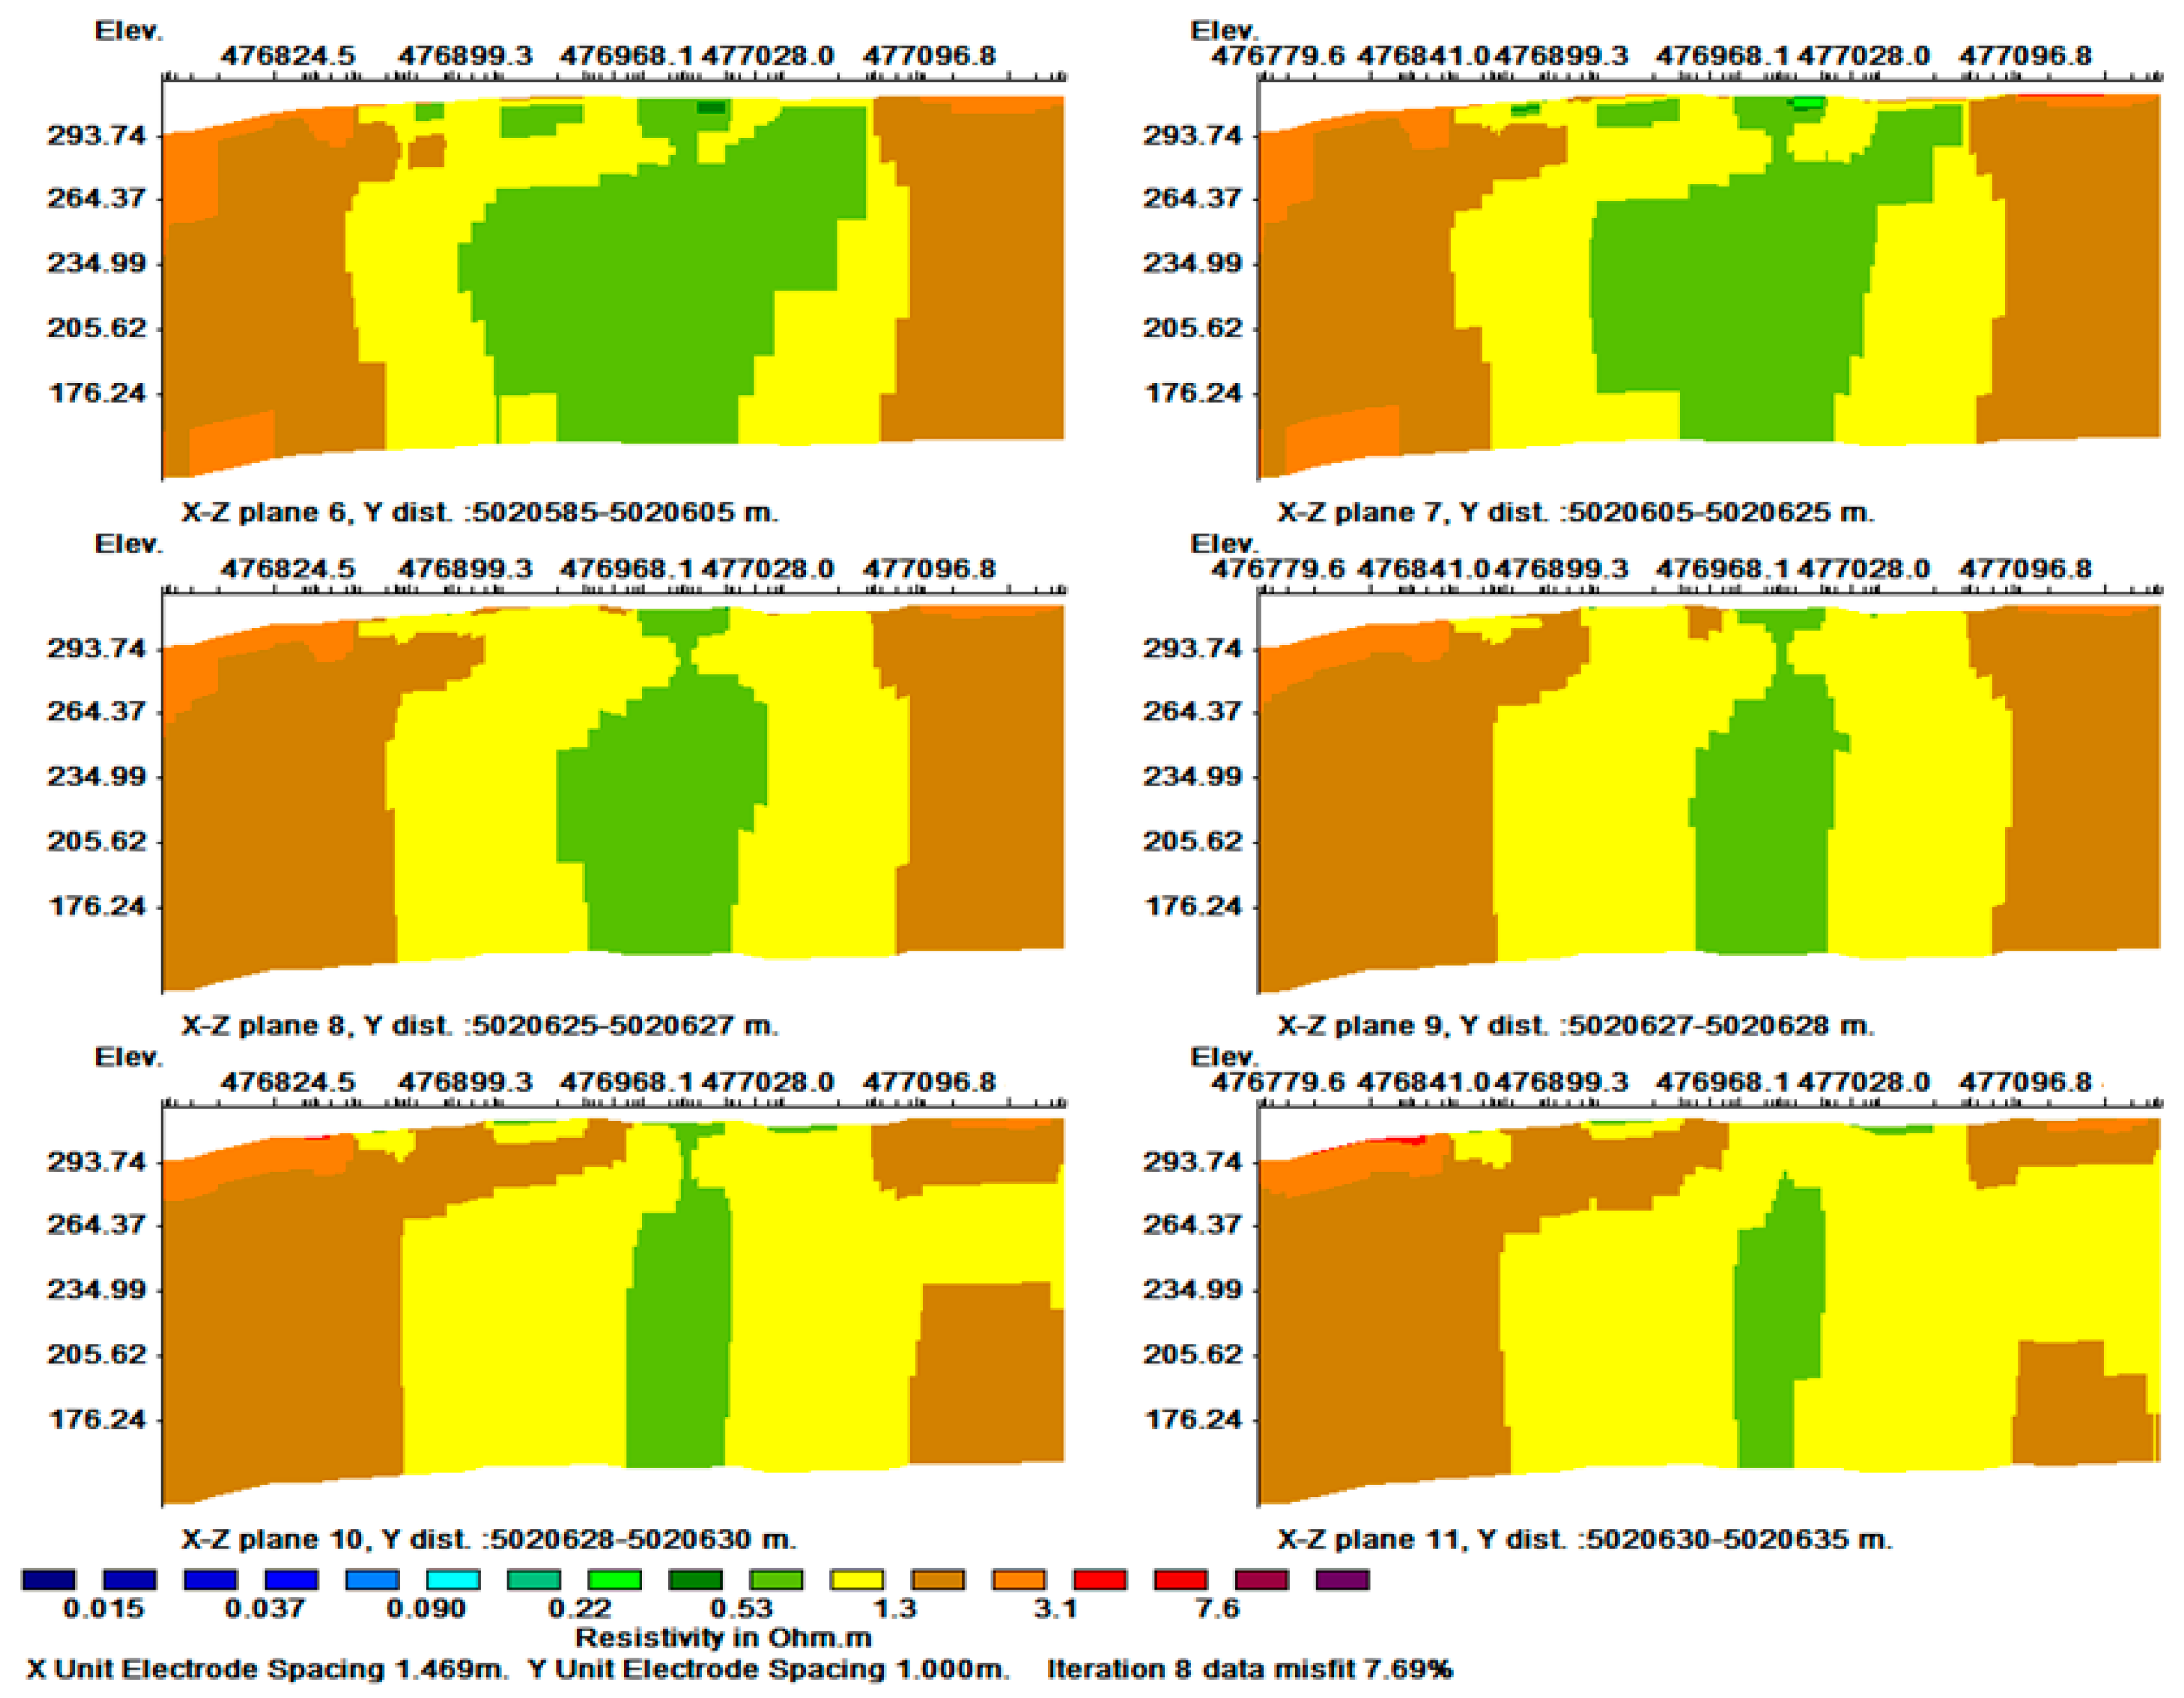
Figure 11.
Two isosurfaces highlighted from different angles: the 0.8 ohm.m isosurface in green (top left, top right) and the red 1.2 ohm.m isosurface (bottom left, bottom right).
Figure 11.
Two isosurfaces highlighted from different angles: the 0.8 ohm.m isosurface in green (top left, top right) and the red 1.2 ohm.m isosurface (bottom left, bottom right).
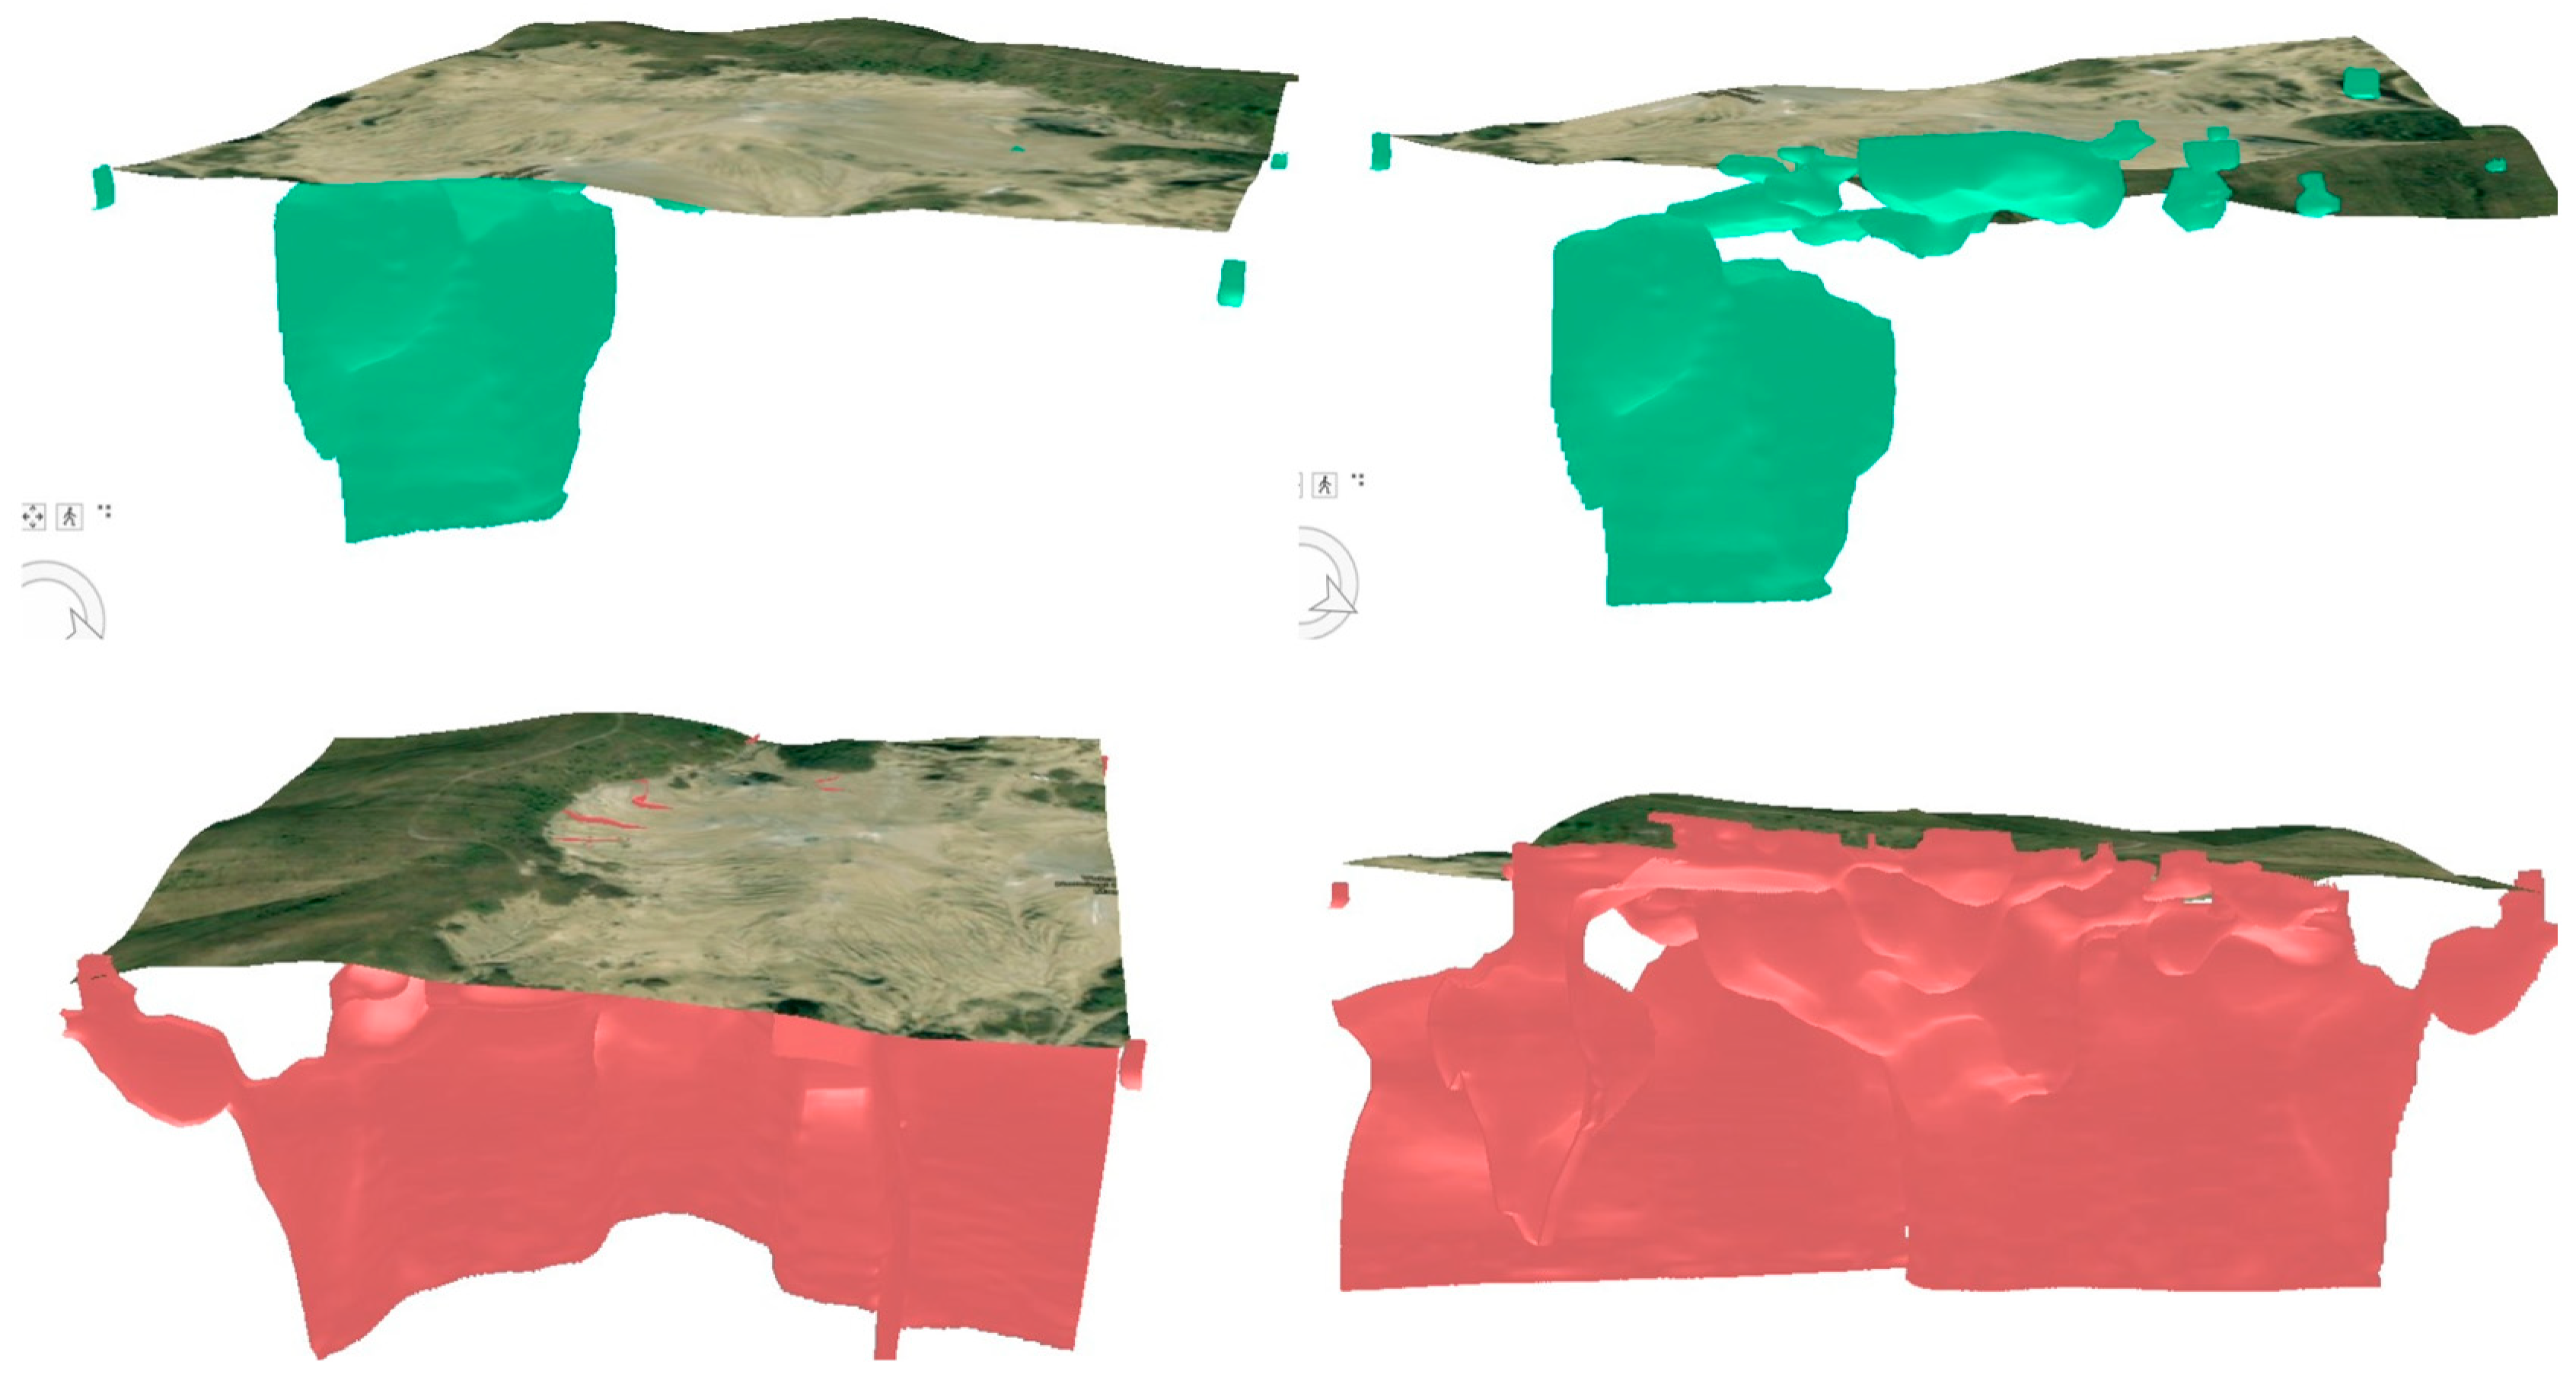
Figure 12.
(Top) (left; right): the isosurfaces of 0.8 (green) and 1.44 ohm.m (yellow) visualized from two different angles. (Bottom) (left; right): the 2 ohm.m isosurface (purple) visualized from different angles.
Figure 12.
(Top) (left; right): the isosurfaces of 0.8 (green) and 1.44 ohm.m (yellow) visualized from two different angles. (Bottom) (left; right): the 2 ohm.m isosurface (purple) visualized from different angles.
Disclaimer/Publisher’s Note: The statements, opinions and data contained in all publications are solely those of the individual author(s) and contributor(s) and not of MDPI and/or the editor(s). MDPI and/or the editor(s) disclaim responsibility for any injury to people or property resulting from any ideas, methods, instructions or products referred to in the content. |
© 2024 by the authors. Licensee MDPI, Basel, Switzerland. This article is an open access article distributed under the terms and conditions of the Creative Commons Attribution (CC BY) license (https://creativecommons.org/licenses/by/4.0/).
Share and Cite
MDPI and ACS Style
Mihai, A.; Gerea, A.; Tataru, D.; Nastase, E.; Grecu, B. A Geophysical Investigation of the Pâclele Mici Mud Volcano in Romania Using Deep Geoelectrical Surveys. Appl. Sci. 2024, 14, 2463. https://doi.org/10.3390/app14062463
AMA Style
Mihai A, Gerea A, Tataru D, Nastase E, Grecu B. A Geophysical Investigation of the Pâclele Mici Mud Volcano in Romania Using Deep Geoelectrical Surveys. Applied Sciences. 2024; 14(6):2463. https://doi.org/10.3390/app14062463
Chicago/Turabian StyleMihai, Andrei, Alexandra Gerea, Dragoș Tataru, Eduard Nastase, and Bogdan Grecu. 2024. "A Geophysical Investigation of the Pâclele Mici Mud Volcano in Romania Using Deep Geoelectrical Surveys" Applied Sciences 14, no. 6: 2463. https://doi.org/10.3390/app14062463
Note that from the first issue of 2016, this journal uses article numbers instead of page numbers. See further details here.