Article

Research on Multi-UAV Task Assignment Based on a Multi-Objective, Improved Brainstorming Optimization Algorithm

1
Faculty of Civil Aviation and Aeronautical, Kunming University of Science and Technology, No. 727, Jingming South Road, Kunming 650500, China
2
Faculty of Transportation Engineering, Kunming University of Science and Technology, No. 727, Jingming South Road, Kunming 650500, China
*
Author to whom correspondence should be addressed.
Appl. Sci. 2024, 14(6), 2365; https://doi.org/10.3390/app14062365
Submission received: 7 February 2024 / Revised: 27 February 2024 / Accepted: 4 March 2024 / Published: 11 March 2024
(This article belongs to the Special Issue AI Technology and Application in Various Industries)

Abstract

:
In response to the practice of rescue channel blocking and a shortage of emergency materials in the event of sudden significant disasters, a multi-UAV collaborative distribution scheme was designed based on the demand for rapid and accurate distribution of materials. This paper constructed a multi-UAV collaborative task assignment and routing problem with simultaneous delivery and pick-up and time windows (MVTARPSDPTW), considering the factors of UAV load, energy consumption, cargo quality, and volume to minimize the total cost of UAV distribution and the full penalty of the task, as well as optimizing the balance of UAV efficiency. This paper proposes a multi-objective, improved brainstorming optimization algorithm based on Pareto dominance (MIBSO) to solve the MVTARPSDPTW problem. With DTLZ4, DTLZ5, and DTLZ6 benchmarks, this work tests the algorithm performance according to the characteristic attributes of the model sought, selecting the four indicators of GD, the Spacing metric, HV, and IGD, concerning convergence, solution distribution, and comprehensive performance. Case validation is based on a COVID-19 scenario in Changchun, China, and the results show that the model algorithm designed in this paper has good performance and feasibility in convergence and distribution of reconciliation. Finally, the multi-UAV emergency material distribution solution provides practical, theoretical support for rescue tasks in sudden significant disasters.

1. Introduction

Sudden and frequent natural disasters (such as earthquakes, mudslides, infectious diseases, etc.) have damaged the economy and society of all countries worldwide, making people suffer double losses of life and property. In the initial stage of a disaster, the key to rescue operations is how to quickly make rescue action plans, meet the needs of the public for emergency materials to the greatest extent, and reduce the losses caused by disasters. Due to the suddenness and unpredictability of a disaster, the materials in the disaster area are often insufficient to ensure the development of emergency relief work, and emergency materials need to be transported from outside the disaster area to the disaster area in a short time. However, due to the damage to the road network and the poor environment in the disaster area, it is difficult for traditional truck transportation to meet the needs of each disaster-stricken area in time. Meanwhile, the timeliness and effectiveness of the distribution of emergency materials also enhance the difficulty of emergency logistics. It is of great practical significance to study the problem of multi-UAV cooperative delivery under such circumstances.
Amazon first introduced the concept of drone delivery in 2013. In recent years, UAV equipment has been used to distribute emergency materials at home and abroad. Google X LABS first experimented with using drones for disaster relief and delivering aid to remote areas in 2014 and completed its first real-world delivery in rural Queensland, Australia, where it successfully delivered first aid kits, food, and water to local farmers. In the early days of the COVID-19 outbreak, Google used drones to provide contactless delivery of medicines and food to customers [1], and achieved good results. In China, Jingdong delivered supplies to sealed towns through drones [2], and the drones developed by SF Express also successfully delivered epidemic prevention supplies to hospitals [3].
With the continuous development of intelligent manufacturing and UAV technology, the wide application of UAVs has become the focus of researchers. Many studies have highlighted the critical role of drones in delivering medical supplies, helping to save more lives and reduce emergency response times [4,5]. Ling et al. [6] evaluated the efficiency of UAVs in different application scenarios, such as medical equipment delivery, blood transportation, and drug distribution. According to Rodriges et al. [7], using drones to deliver small packages is more efficient than traditional trucking methods in terms of cost and total service time.
Current research on the distribution of emergency materials includes the location of the distribution center, task allocation, flight path planning, and so on. Researchers are generally keen on mathematical modeling and model optimization, mainly focusing on time, cost, efficiency, and other factors as goals, paying more attention to an intelligent optimization algorithm to propose new solutions that will be applied to practical transportation problems. For example, Chauhan et al. [8] propose a multi-period formula for facility locations to maximize coverage while meeting reliability constraints. Caunhye et al. [9] consider simultaneously optimizing site selection and path planning and developing a joint model to minimize disaster losses and rescue time. Chauhan et al. [10] solved the facility location problem and online demand allocation by dividing UAVs into two phases. Various constraints, such as vehicle capacity, time window, route length, etc., usually accompany the material distribution problem. To ensure that the generated solution can meet these constraints, researchers usually introduce penalty functions in the model to improve the feasibility and operability of the solution. For example, Xiao et al. [11] proposed an improved genetic tabu search algorithm and introduced the penalty factor into the fitness function. Monami et al. [12] and Yang et al. [13] specified a delivery time range and imposed early and delayed delivery penalties on deliveries beyond that time range to establish a realistic coordination mechanism in the supply chain system. Zhang et al. [14] introduced the transportation mode conversion penalty cost in the objective function when constructing a multimodal transportation logistics model. Traditional algorithms commonly used to solve UAV task assignment and track planning problems include integer linear programming, the simulated annealing algorithm, etc., which can be solved by combining modern heuristic and swarm intelligence algorithms, such as a genetic algorithm, particle swarm optimization algorithm, ant colony algorithm, and fish swarm algorithm. Among the traditional algorithms, a combination of local search and dynamic programming is used to solve the travel agent task assignment model with UAV participation [15]. Considering the multi-target problem, a linear weight method is proposed to transform it into a single-target UAV task planning problem, and then a hybrid algorithm combined with a real-coded fireworks algorithm are used to solve the multi-target UAV task assignment problem [16]. It has been proposed to use GridGSA for UAV track planning, apply the grid method to build an environment model, assign probability to corresponding grids, and then optimize the number and position of return points through a gravity search algorithm [17]. In modern algorithms, to solve the multi-target task assignment problem of a UAV, it is proposed that based on a rapid search by a quantum ant colony algorithm, the crossover and clone replication factors of the clonal selection algorithm are fused to improve the global search capability of the algorithm and avoid premature convergence in the search process [18]. A mixed population RRT UAV flight path planning method has been proposed to solve the flight path optimization problem. Based on a rapidly extended random tree (RRT) algorithm based on an environmental potential field, a self-optimizing population and co-optimizing population are introduced to improve the flight path segment so that the algorithm has local and global optimization capabilities [19]. There are algorithms based on the combination of a cooperative particle swarm algorithm, cooperative function, and suitable variables to discuss task allocation and track planning [20]. To avoid the “deadlock” phenomenon caused by the task assignment of heterogeneous UAVs, an improved genetic algorithm based on multi-type gene coding was adopted for task assignment, and the Dubins path coordination method was adopted to generate the flyable track of the minimum turning radius of UAVs [21].
In summary, scholars’ research on emergency logistics distribution is relatively complete, but it still needs to be improved in the following aspects:
  • Based on research directions, existing research on drone delivery mainly focuses on the following three aspects: first, optimization model and algorithm research; the second is to explore more ways of operating drones; and the third is to study the impact of different parameters of a UAV on delivery [22]. However, in research on drone delivery services, recycling services are given little consideration [23].
  • Most research on drone delivery uses non-real technical parameters. Only a few scholars use accurate technical parameters for research [24].
  • Currently, to simplify the problem, most literature ignores some practical factors when constructing models or considers relatively few single factors. Only a few pieces of literature have proposed the expansion problem of combined distribution with multi-factor fusion [25].
  • The standard FSTSP (Flying Sidekick Traveling Salesman Problem) model has no payload management constraints to control customers’ orders on each drone route because without them, drone routes might not be feasible.
  • The standard FSTSP model has a small maximum number of possible stops per drone strike, and there is still much room for improvement in saving potential service time and drone utilization.
This paper makes the following contributions to the field of emergency logistics:
  • Consider returning missions to improve the efficiency and sustainability of payloads. Traditional FSTSPs do not fully utilize the payload capabilities of UAs.
  • Consider the dynamic energy consumption of the UAV to make it more suitable for the actual delivery of the UAV.
  • Comprehensively consider the constraints of UAV energy consumption, load, volume, flight speed, and time window, and establish a multi-UAV collaborative task assignment and path planning model. It integrates multiple factors and considers them simultaneously to supplement research on collaborative optimization of task assignment and path planning.
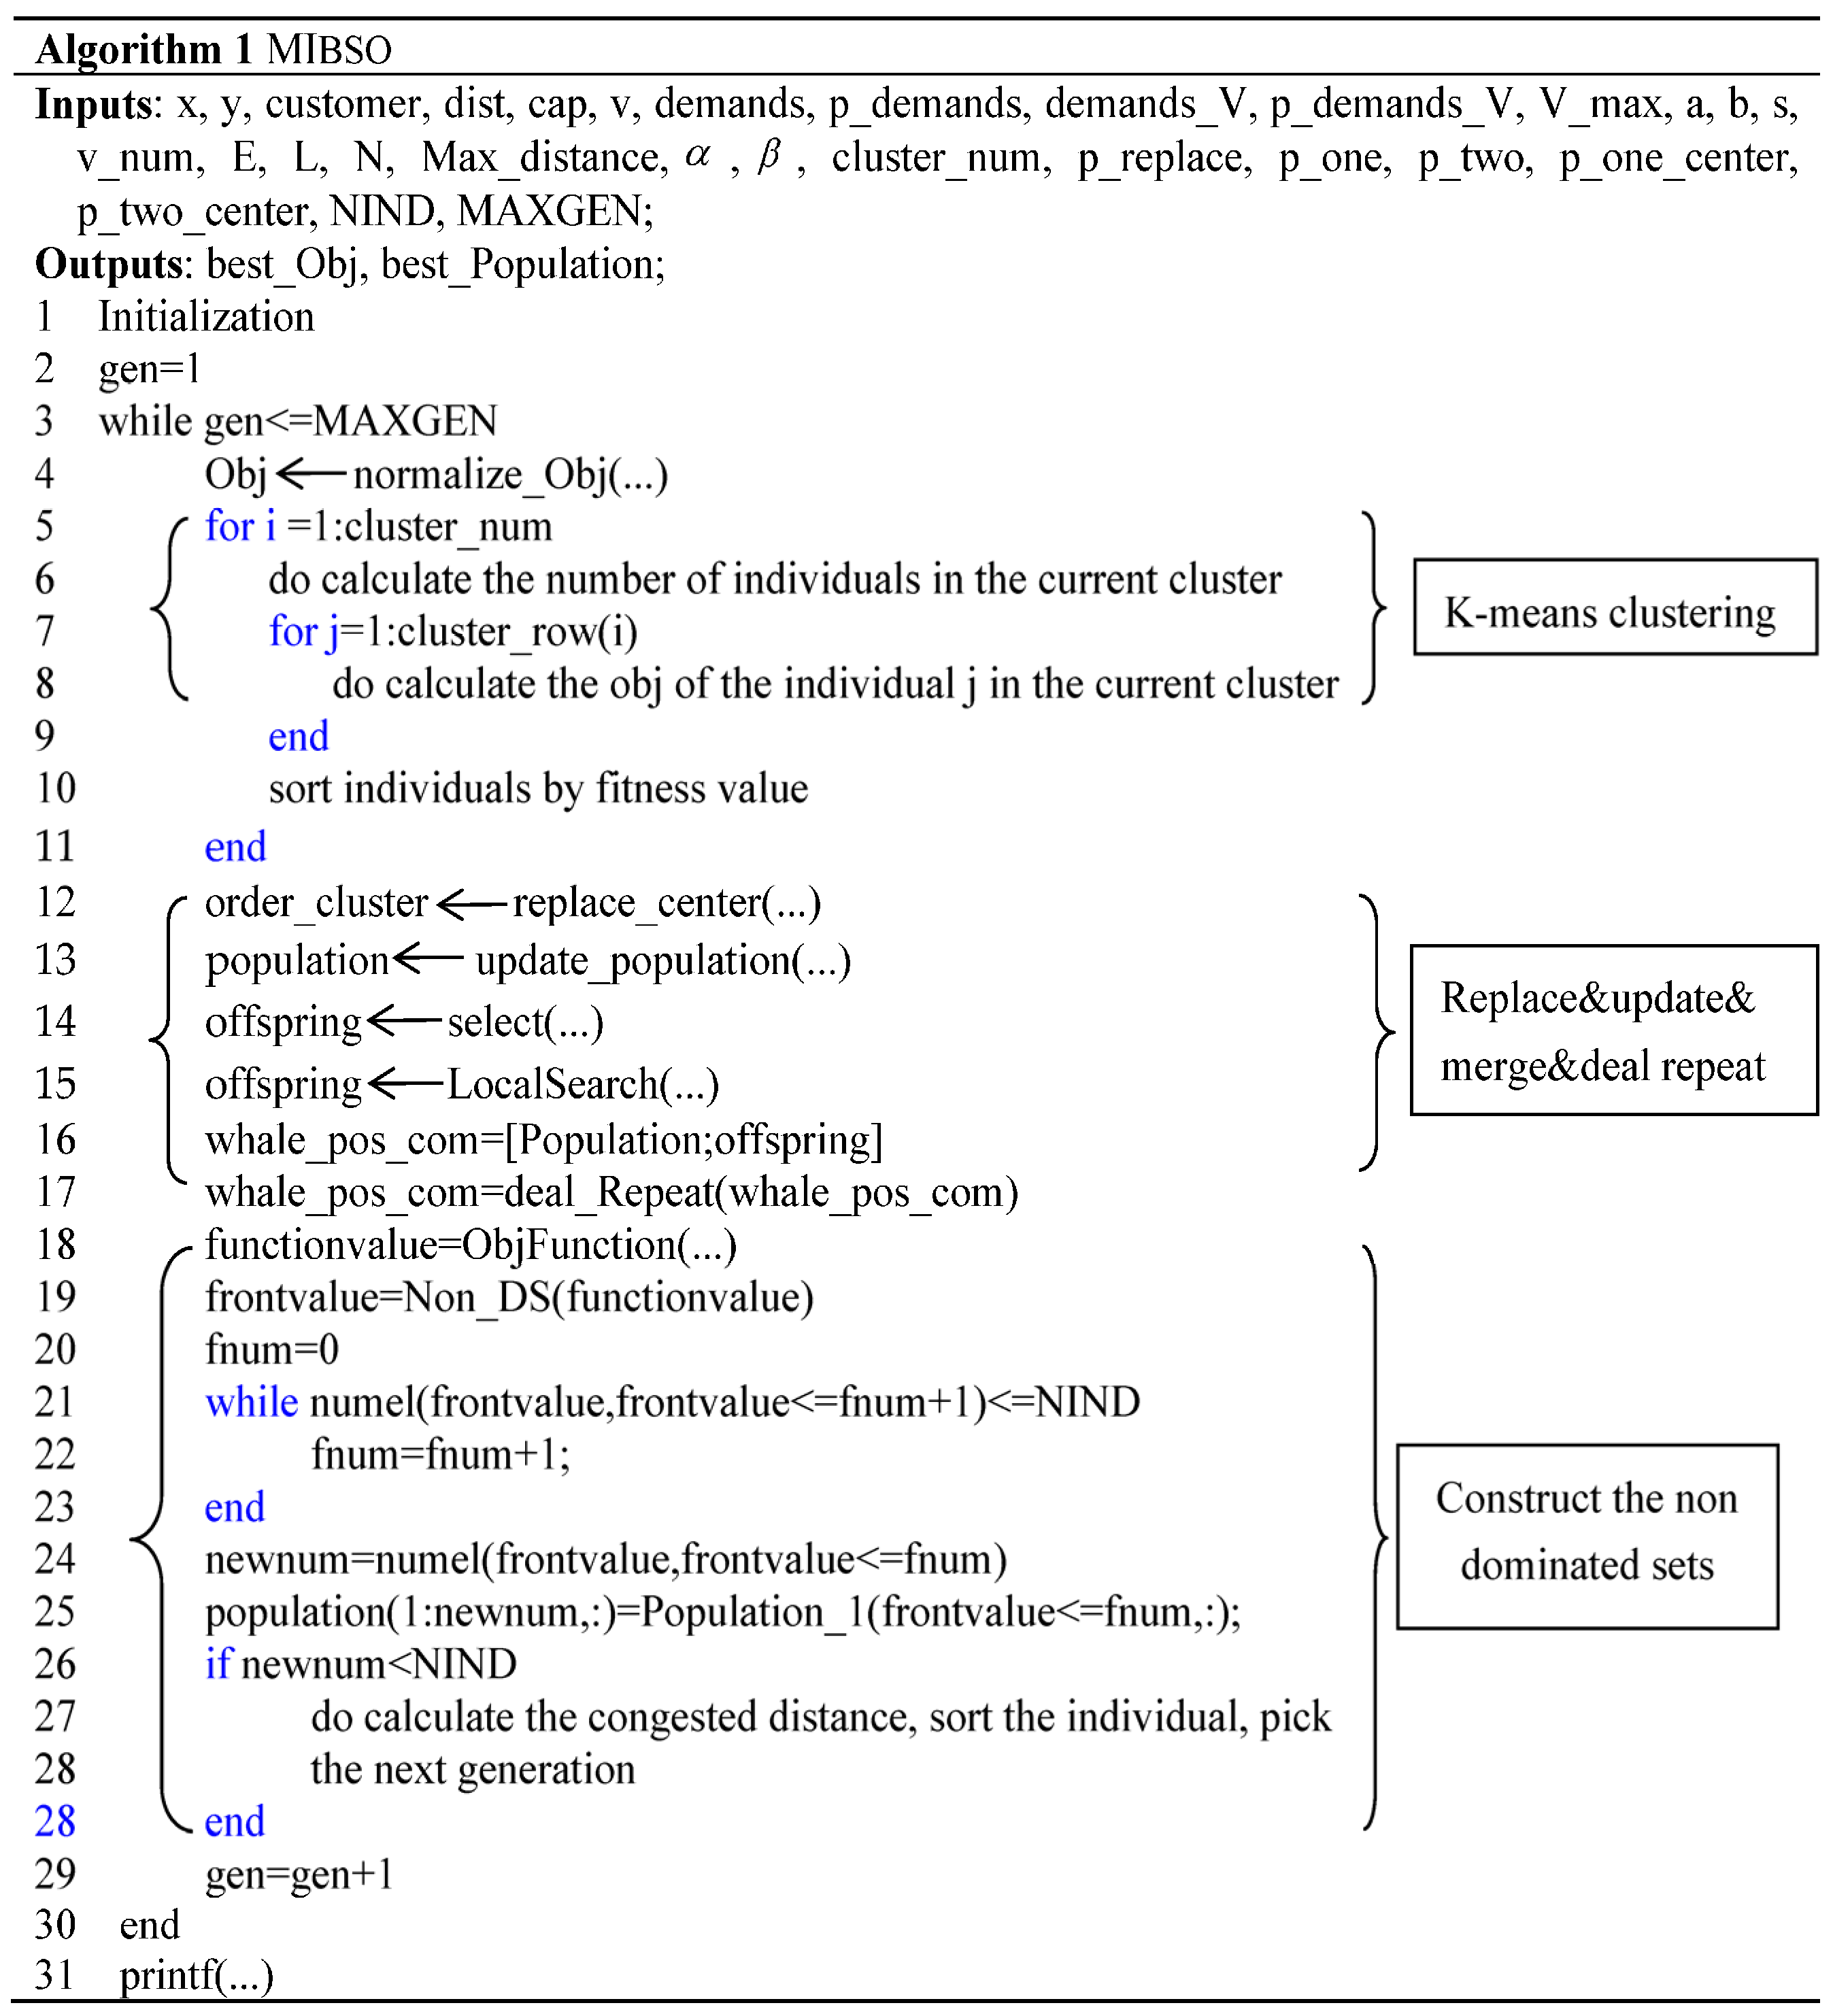
  • Develop a multi-objective, improved brainstorming optimization algorithm based on Pareto dominance (MIBSO) to solve cases of reasonable size, and make up for the problem of unreasonable weight assignment and a single result in applying a linear weight method to transform multiple goals into single goals proposed in the literature [16].
  • Taking “Ehang” Falcon B (Logistics version) UAV as the target model and taking the distribution of materials during the outbreak of COVID-19 in Changchun, China, as an example, an empirical analysis was conducted to form a general technical scheme for the delivery of emergency materials by UAV, providing scientific reference for emergency materials distribution and rescue tasks under major disaster scenarios.

2. Methods

2.1. Modeling

2.1.1. Problem Description and Hypothesis

In the multi-UAV cooperative task assignment problem, the distribution task assignment and flight path planning of a multi-UAV in the multi-demand point scenario are studied. Assume that there are UAVs K = K 1 , K 2 , , K m and demand points B = B 1 , B 2 , , B n , and the UAVs K need to perform a delivery service for each demand point B j . Because the UAV is constrained by its performance, such as load, volume, and mileage, each UAV can only complete a limited number of demand point distribution tasks.
Under the premise that each UAV meets the load constraint, load volume constraint, and time window constraint, the distribution center assigns several UAVs to deliver materials for the demand point. Each UAV starts from the distribution center, provides materials for the demand point, and recovers materials from the demand point simultaneously. After completing the established task, it returns to the distribution center. The distribution scheme is planned with a minimum total cost, minimum total task penalty, and optimal balance of using UAVs.
In this paper, we make the following assumptions:
  • There are multiple drones and one distribution center.
  • The speeds of the drones are known and constant.
  • Drones can serve all customers.
  • The drone flight endurance is known and fixed regarding travel time.
  • The drone must leave customer locations immediately after delivering or picking up parcels.
  • The UAV must be able to fulfil the service demand of at least one demand point.
  • The UAV has an entire initial power supply and does not consider any midway charge or change.
  • The distribution center’s cargo reserves are deemed unlimited.

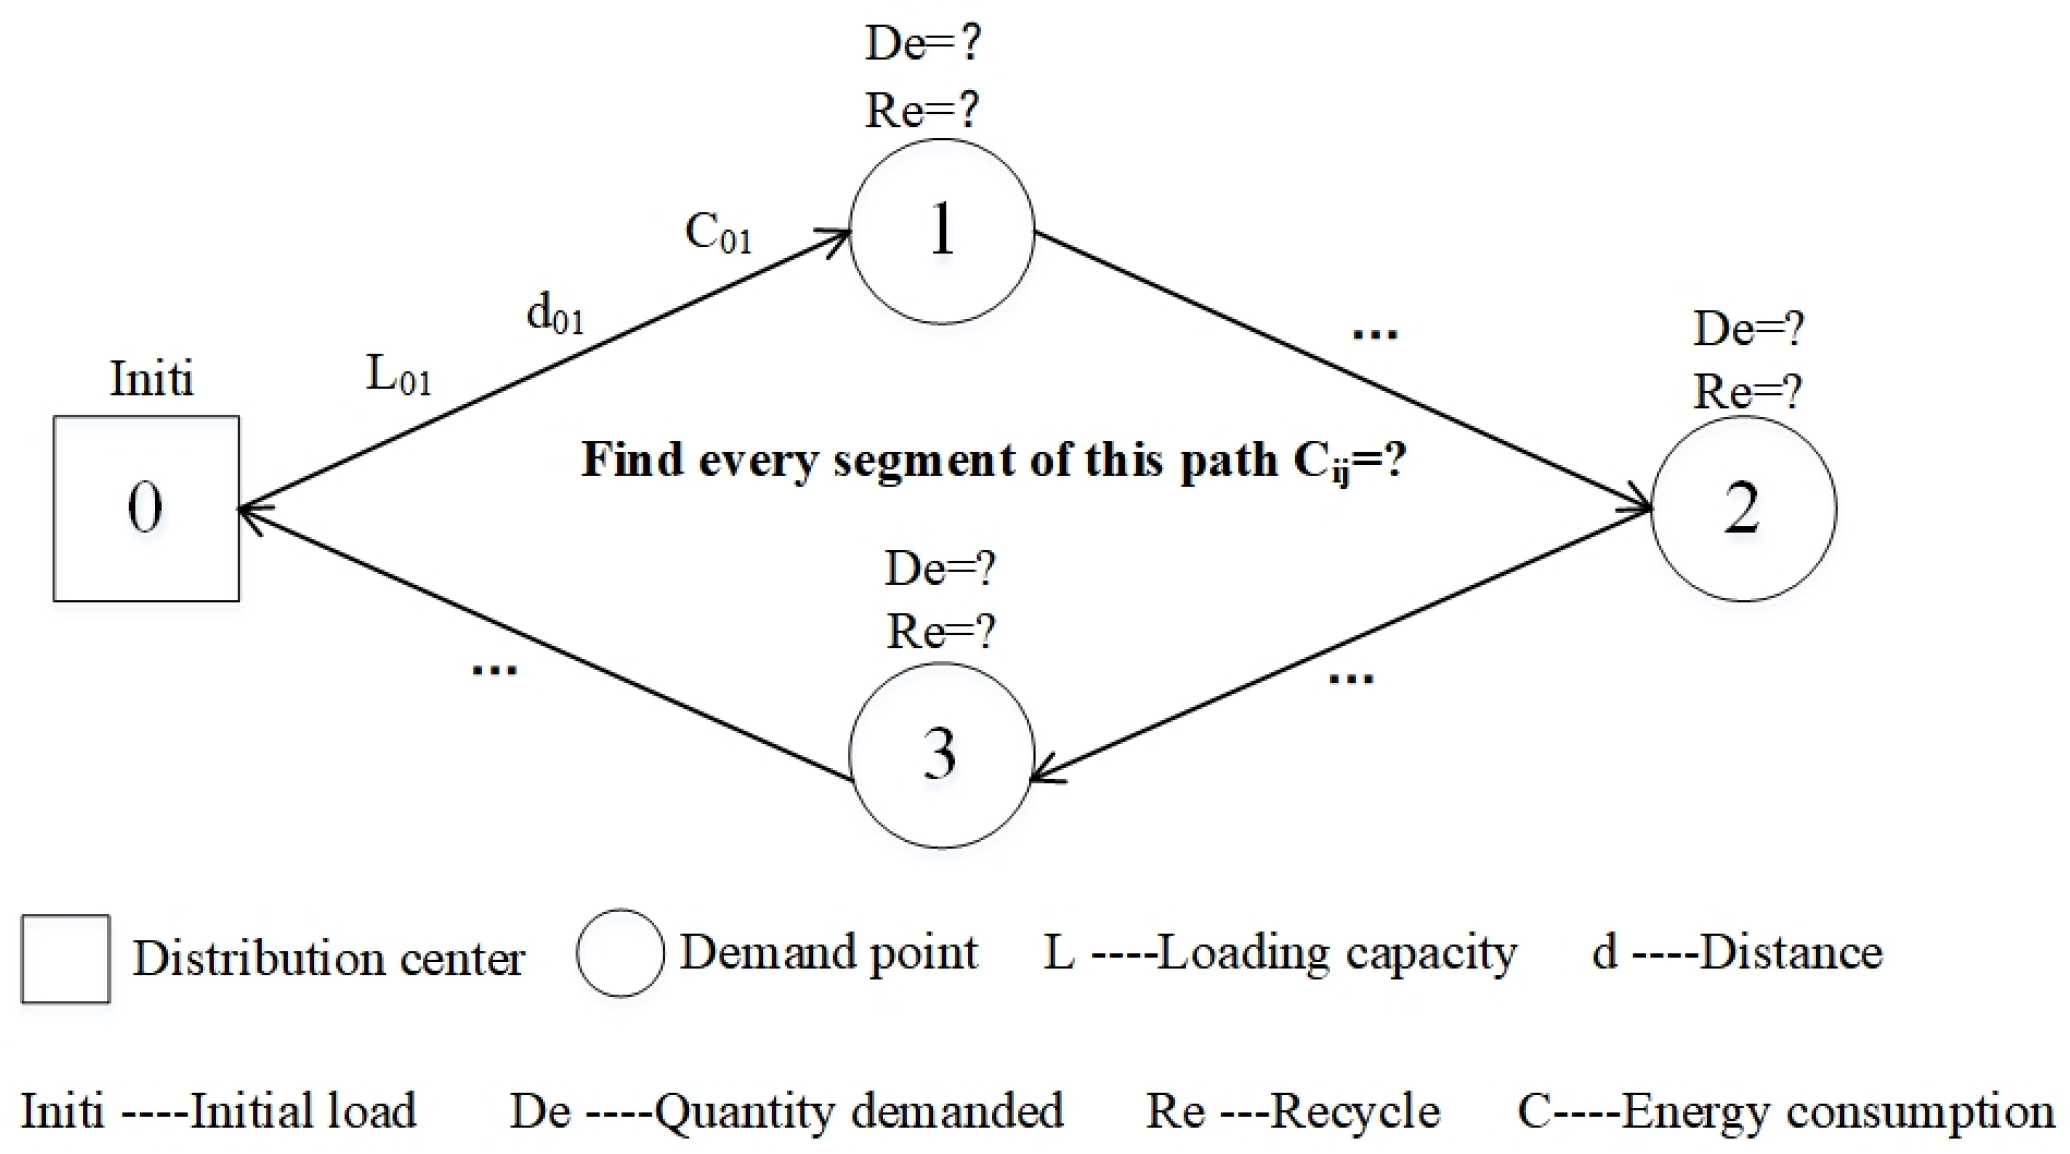
2.1.2. Model Construction

Under the above assumptions, this paper constructed a multi-UAV collaborative task assignment and routing problem with simultaneous delivery and pick-up and time windows (MVTARPSDPTW), considering the factors of UAV load, energy consumption, cargo quality, and volume. The descriptions of relevant symbols in the model are shown in Table 1.
1. Objective
First, consider the minimum cost of all UAV delivery tasks, which consists of three parts: UAV transportation, start-up, and maintenance. The sub-objectives are as follows:
s u m T D = min ϖ ( k K ( i , j ) B x i j k d i s ( i , j ) L o a d i j k ) + N V ( ψ + )
x i j k = 1 , d r o n e   k   starts   from   node   i   to   node   j 0 , o t h e r s
x k = 1 , f o r   ( i , j ) B , o n l y   x i j k = 1 0 , o t h e r s ; k K
N V = k K x k
where, s u m T D is the total cost. Equation (1) calculates the total cost of UAVs performing delivery tasks. Equations (2) and (3) represent the range of values for decision variables. Equation (4) calculates the number of drones used to perform delivery tasks.
When using UAVs, it is essential to find the right balance. To measure this balance, we can look at the remaining power of each UAV after completing delivery tasks. If the remaining power is evenly distributed among all UAVs, their utilization rates are similar, and there is no overuse or underuse of any UAV. The sub-goals for achieving this balance are as follows:
E n d i f f e r = min k = 1 m ( E n l e a v e k E n l e a v e a ) m
E n l e a v e k = E n k E n c k , k K
E n c k = ( i , j ) B E n c i j k x i j k
E n c i j k = ( m U A V k + L o a d i j k ) 3 2 g 3 2 ρ ξ n d i j v k , ( i , j ) B , k K
L o a d i j k = L c i k = L c i 1 k R i + L d i k , i 1 , i B , k K
L 0 k = i B R i j Δ + ( i ) x i j k , k K
where, E n d i f f e r is an indicator used to measure the balance of drone usage. Equation (5) first calculates the difference between the remaining energy of each drone after executing the task and the average remaining energy; then, these differences are summed up, and the average value is taken. The data obtained from this can indicate the degree of use of each drone in a specific distribution plan. Equation (6) calculates the remaining energy value of drone k after completing the task. Equation (7) calculates the energy consumption of drone k in executing tasks. Equation (8) calculates the energy consumption of each small segment of the drone delivery route. Equation (9) indicates that the actual cargo loading weight of the drone on section i j is equal to the cargo loading weight when the drone leaves point i , which is equal to the loading weight when leaving node i 1 minus the required weight at node i plus the recovered weight at node i . Equation (10) represents the weight of the cargo carried by the drone when departing from the starting point.
To more genuinely reflect the power consumption of the actual delivery of the UAV, consider the dynamic change of the power consumption of the UAV during the distribution process and calculate the power consumption of each section of the distribution route using Formula (8) [26], as shown in Figure 1.
The minimum punishment in the UAV distribution process is ensuring timely and safe material delivery to the demand point. These penalties include punishment for exceeding the time window, load weight, and load volume limits. The sub-objectives are as follows:
s u m L W = min k K i B T w i k λ + T l i k β + T v i k γ
x i k = 1 , f o r   ( i , j ) B , o n l y   x i j k = 1 0 , o t h e r s
λ = 0 , a i < T i m e i k < b i λ 1 , T i m e i k < a i λ 2 , b i < T i m e i k
T w i k = 0 , a i < T i m e i k < b i ( a i T i m e i k ) x i k , T i m e i k < a i ( T i m e i k b i ) x i k , b i < T i m e i k ; i B , k K
T l i k = max L c i k C k , 0 , i B , k K
T v i k = max L v i k V k , 0 , i B , k K
T i m e i k = w i 1 k + s i 1 + x i 1 , i k d i 1 , i v k , i 1 Δ ( i )
where, s u m L W is the total penalty. Equation (11) calculates the sum of the time window penalty, loading weight penalty, and loading volume penalty. Equation (12) determines whether node i is on the path of drone k . Equation (13) represents the value of the time window penalty coefficient λ . Equation (14) calculates the duration of delay/early completion (the task was not completed within the time window). Equation (15) calculates the drone’s weight overloaded at node i . Equation (16) calculates the volume of drone k overloaded at node i . Equation (17) calculates the time for drone k to reach node i .
2. Constraints
(1)
The number of drones carrying out tasks shall not exceed the total number of drones owned.
N V m
(2)
UAV’s service rules: Equation (19) indicates that each demand point can only be assigned to one path. Equation (20) indicates that a demand point can only be served by one drone. Equation (20) indicates that a drone can serve multiple demand points and at least one demand point.
k K j Δ + ( i ) x i j k = 1 ; i , j B
k K x i k = 1 , i B
1 i B x i k , k = 1 , 2 , , r
(3)
Traffic constraints of a UAV on the path: Equation (22) indicates that the drone can only reach one node from the starting point, meaning only one drone can be on that path. Equation (23) indicates that drones returning from a particular node to the starting point can only have one drone on that path. Equation (24) constrains the flow balance on this path.
j Δ + ( 0 ) x 0 j k = 1 , j B , k K
i Δ ( 0 ) x i 0 k = 1 , i B , k K
i Δ ( j ) x i j k i Δ + ( j ) x j i k = 0 , ( i , j ) B , k K
(4)
Continuous constraints on UAV travel time: During the process of the drone completing the task from the previous to the current demand point, there is no other time consumption except for service and travel time. Equation (25) can ensure no time loss for the drone during the process, ensuring the continuity of time.
w i k + s i + d i j v k w j k ( 1 x i j k ) M
(5)
Load relation constraint: Equation (26) represents the actual loading weight of the drone k after serving the first demand point on the route. Equation (27) represents the actual loading weight of the drone k after completing service at any demand point on the route (excluding the first demand point).
L c j k L c 0 k R j + L d j k M ( 1 x 0 j k )
L c j k L c i k R j + L d j k M ( 1 k K x i j k )
(6)
The drone’s flight speed cannot exceed the maximum speed limit.
v k v k _ max , k K
(7)
The drone’s flight time cannot exceed the maximum time limit.
x i j k d i j v k t max k , ( i , j ) B , k K
(8)
The flying distance of drones shall not exceed the maximum distance limit.
( i , j ) B x i j k d i j S max k , k K
(9)
The total volume of cargo loaded by drones shall not exceed the maximum capacity of the drone cargo hold.
i B x i k V i = V max k , k K
(10)
Ensure that all demand points can be served, assuming the number of demand points is p .
k K x i k = p , i B

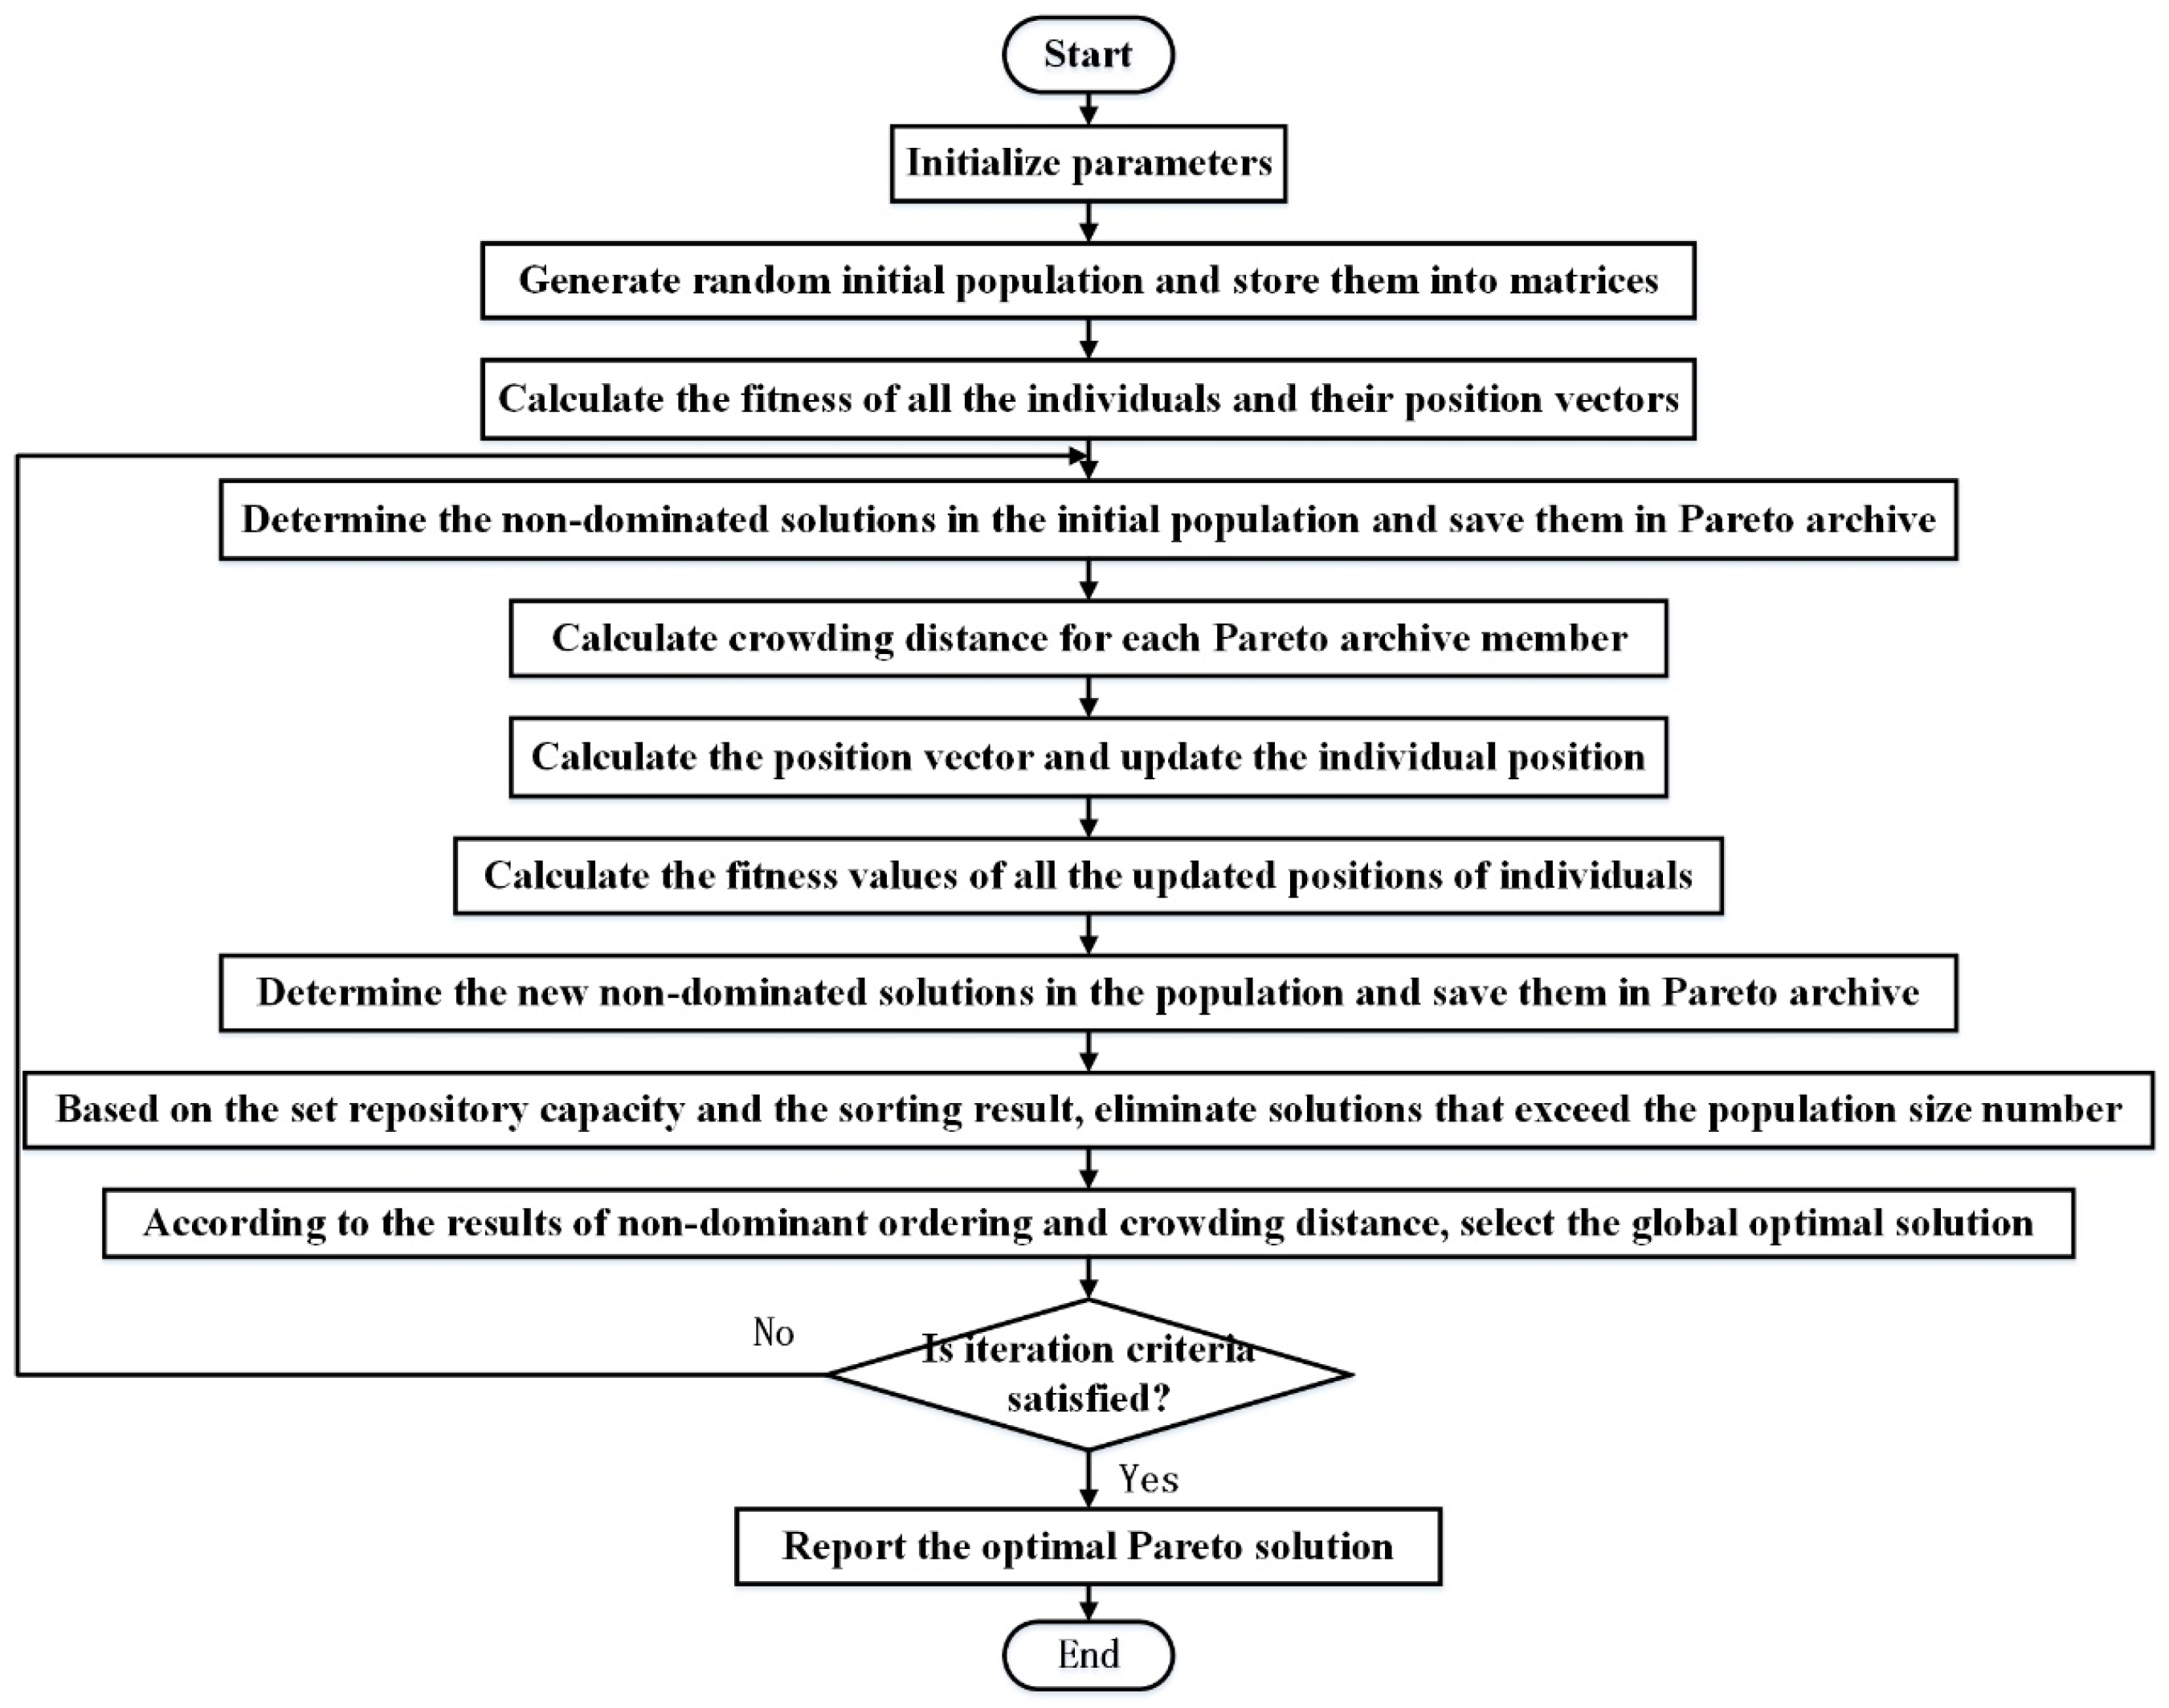
2.2. Optimization Algorithm Design

The model mentioned above is a type of multi-objective programming model. Many scholars currently use the linear weighting sum method to convert multi-objective problems into single-objective ones for solving. However, this method can only produce one solution at a time, and cannot provide diversified scheme choices according to decision-makers’ preferences. This method’s weight setting is subject to subjective human influence, which is not highly scientific. On the other hand, the success of the NSGA-II algorithm has shown the benefits of non-dominated sorting in multi-objective optimization [19]. As a result, this paper uses this method to develop a multi-objective, improved brainstorming optimization algorithm based on Pareto dominance (MIBSO) to solve the MVTARPSDPTW problem. Algorithm 1 displays the pseudo-code for MIBSO, and Figure 2 illustrates the MIBSO algorithm flow.
Applsci 14 02365 i001
Figure 2. Algorithm flowchart of MIBSO.
Applsci 14 02365 g002

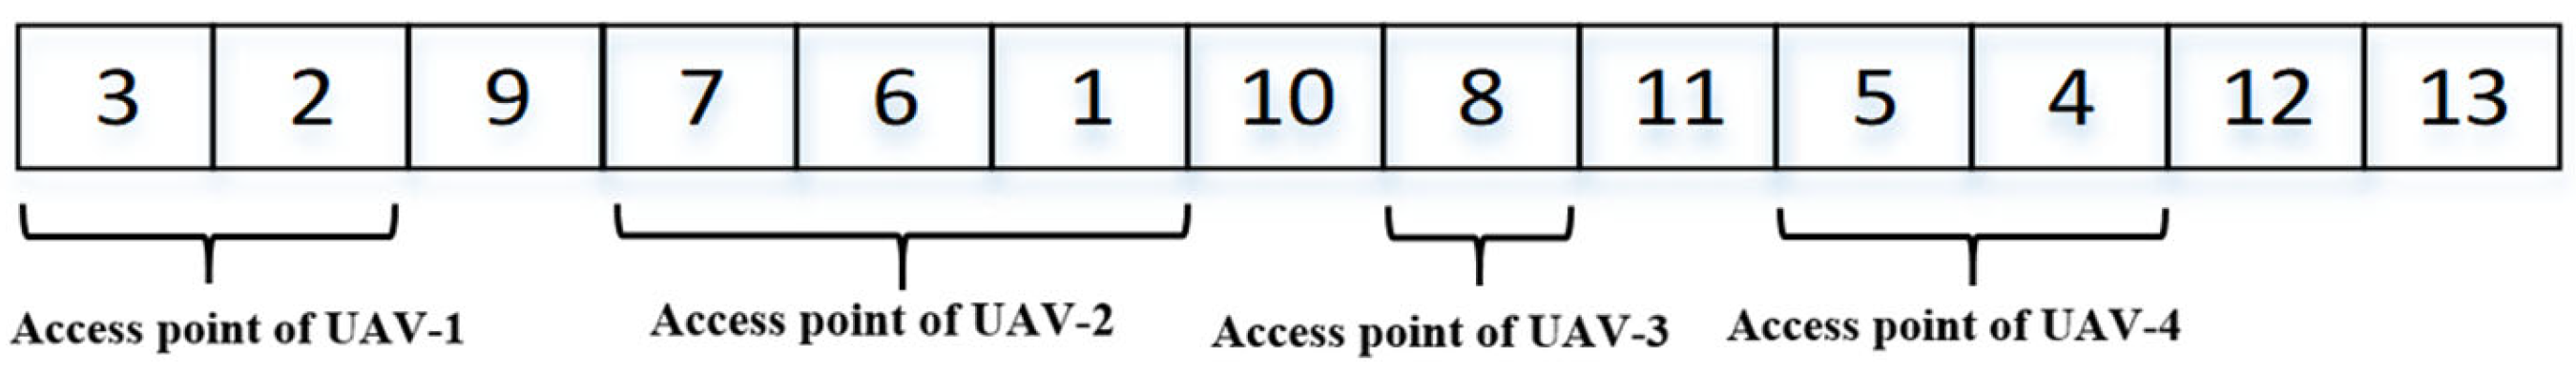
2.2.1. Encoding and Decoding

It is assumed that the number of demand points is eight, ID is 1–8, the maximum number of drones used is four, ID is 9–13, and all drones start from city 0. The coding adopted by MIBSO to solve the MVTARPSDPTW problem is shown in Figure 3. It can be seen that a total of four UAVs (9, 10, 11, and 12) are used (<= maximum UAV usage), and one (13) is free. The distribution route of UAV-1 is 0→3→2→0, and the distribution route of UAV-2 is 0→7→6→1→0. The distribution route of UAV-3 is 0→8→0, and the distribution route of UAV-1 is 0→5→4→0. If the number of demand points is N, and a maximum of K drones are allowed to deliver, then MIBSO solves the MVTARPSDPTW problem by representing the individual as a random arrangement of 1~(N + K−1).

2.2.2. Elite Retention Strategy

Merge the parent population and child population to generate population_1, and generate a new parent population, population_2, from population_1 according to the following rules: (1) According to the order of Pareto rank from low to high, the whole layer population was put into the parent population population_2 until the individuals in a particular layer could not all be put into the parent population population_2. (2) The individuals in this layer were successfully placed into the parent population population_2 according to the crowding degree from large to small until the parent population population_2 was filled.

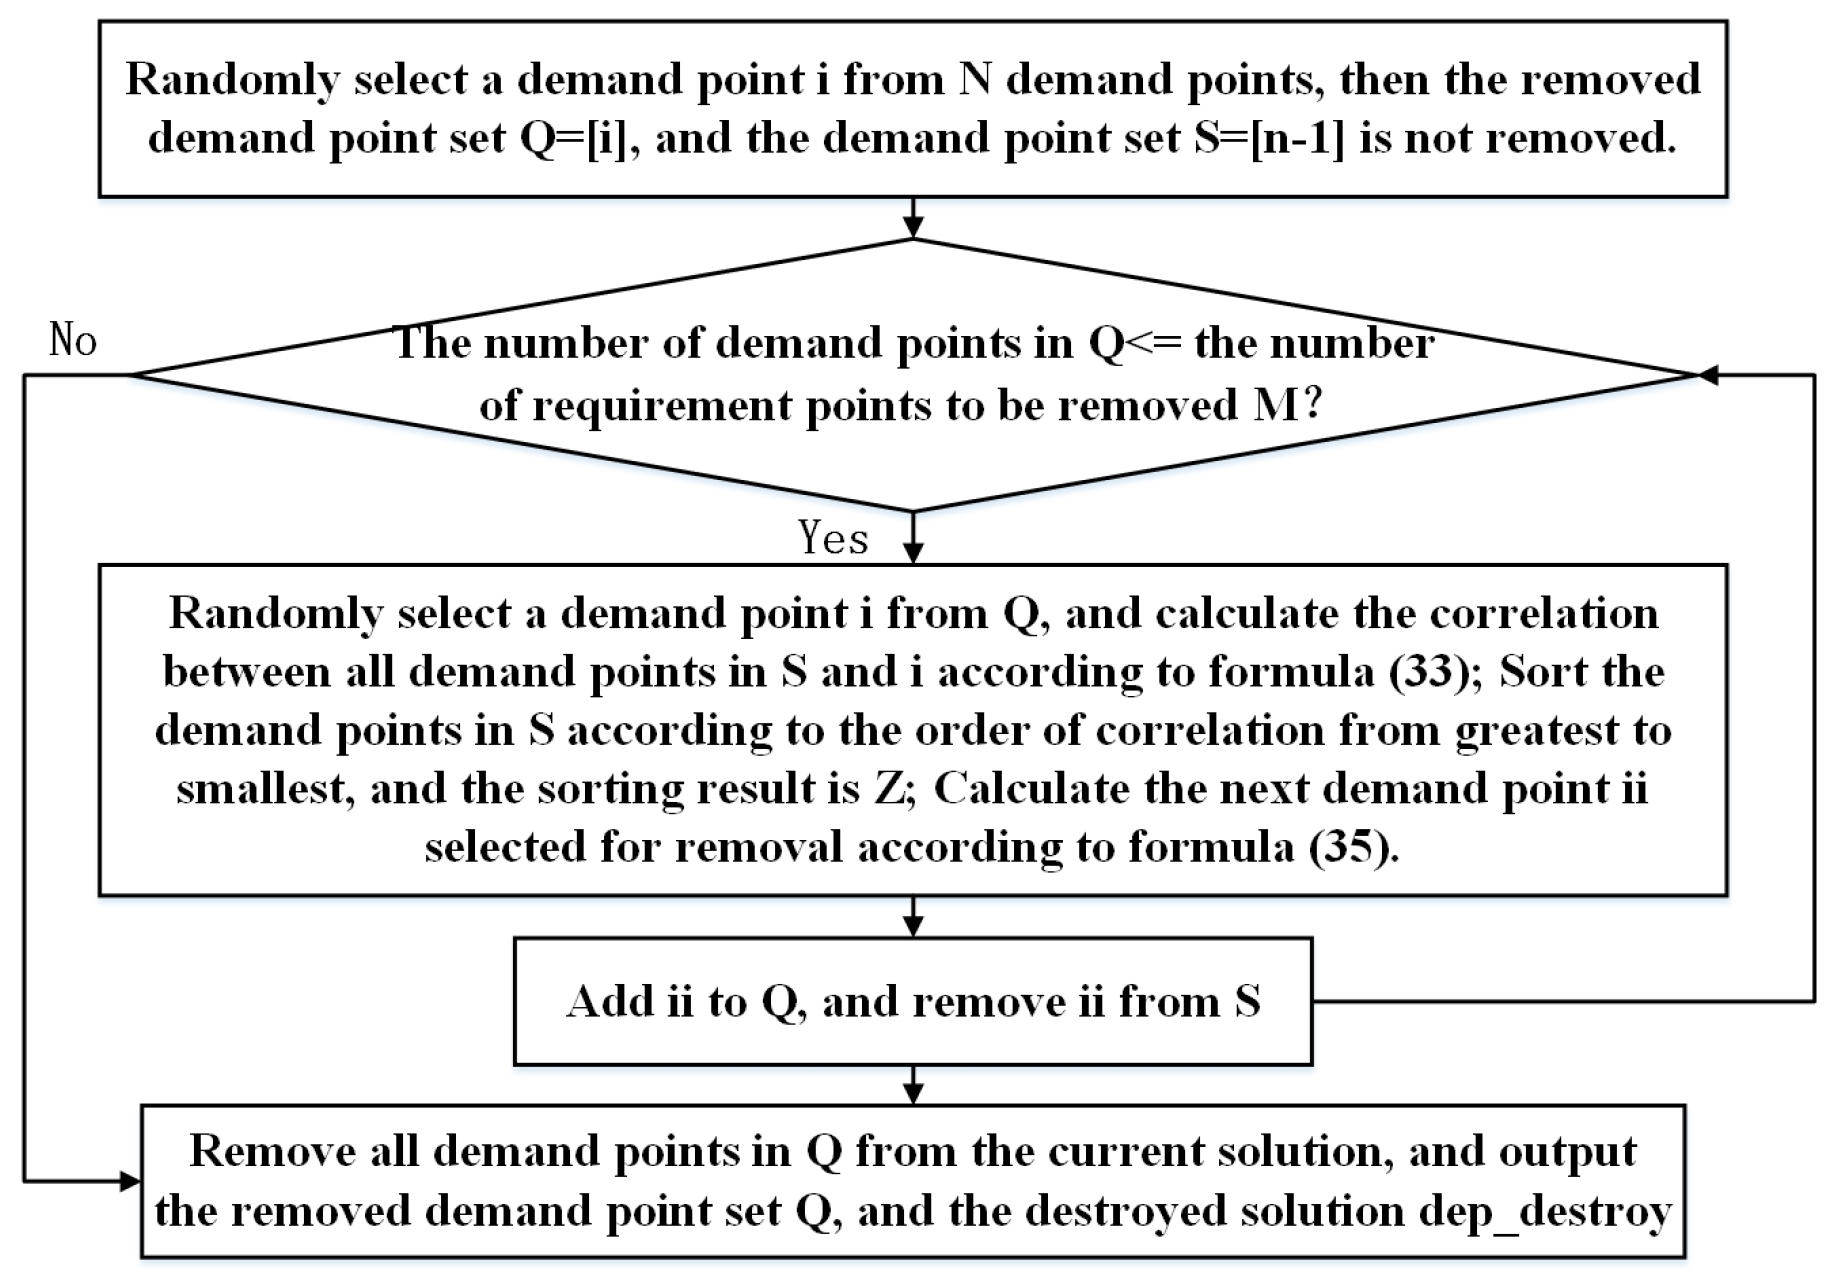
2.2.3. Local Search Operation

Based on standard BSO, the “destroy” and “repair” ideas in the LNS algorithm are introduced. The local search operation is carried out on the individuals whose objective function value is in the top 50% of the population obtained after the update operation to obtain more optimal individuals and update the population in a better direction.
The destruction operator removes several related demand points according to Formula (33).
R ( i , j ) = 1 c i j + V i j
c i j = c i j max c i j
r a n d D × S , r a n d ( 0 , 1 )
where c i j is the standardized value of c i j , c i j is the Euclidean distance between i and j , and V i j is whether i and j are on the same path, and if they are on the same path, it is 0, otherwise it is 1. S is the number of demand points in set S .
As can be seen from the above formula, the larger R ( i , j ) , the more significant the correlation between demand points i and j . Suppose the number of demand points is N, the number of demand points to be removed is M, and the random element is L. Then, the destruction operator step is shown in Figure 4. Based on obtaining the removed demand point set Q and destroying solution P_destroy, the operator repair is carried out, as shown in Figure 5.
Insertion cost: Under the condition of not violating constraints, randomly select a demand point in Q and insert it back to a certain insertion position in P_destroy, forming the repaired solution P_repair. The insertion cost calculation formula for inserting the demand point into this position is shown in Equation (36).
C o s t _ i n s e r t = F P _ r e p a i r F P _ d e s t r o y
where, C o s t _ i n s e r t represents the insertion cost, F P _ r e p a i r represents the objective function value of the repaired solution, and F P _ d e s t r o y represents the objective function value of the damaged solution.
Regret value: Under the condition of not violating the constraint, if the total number of feasible insertion positions for demand point i in Q that can be inserted back into P _ d e s t r o y is l , then l insertion positions correspond to l insertion costs. The insertion costs are sorted from small to large, and the sorted insertion costs are defined as C o s t _ n e w _ i n s e r t . The formula for calculating the regret value of inserting demand point i back into P _ d e s t r o y is shown in Equation (37).
V a l u e _ r e g r e t = C o s t _ n e w _ i n s e r t ( 2 ) C o s t _ n e w _ i n s e r t ( 1 )
where, V a l u e _ r e g r e t represents the regret value, C o s t _ n e w _ i n s e r t ( 2 ) represents the insertion cost of ranking second in the back row, and C o s t _ n e w _ i n s e r t ( 1 ) represents the insertion cost of ranking first in the back row.

3. Results

3.1. Case Analysis

3.1.1. Relevant Data

The basic attribute of emergency materials is emergency, so it is required that emergency materials be delivered to the disaster area in the shortest time with the fastest speed to play the role of emergency materials. During the new coronavirus epidemic, home isolation is adopted for patients with solid bodies and mild symptoms. Traditional manual door-to-door delivery is highly risky and has a significant risk of infection, and vehicle delivery cannot complete accurate door-to-door delivery service. At this time, the use of drones for “last kilometer” emergency supplies distribution is essential. Based on this, this paper takes Ehang Falcon B (Logistics version) as an experimental UAV to analyze the distribution of materials during the COVID-19 outbreak in Changchun, China. The relevant parameters are shown in Table 2, the specifications of emergency materials are shown in Table 3, and the data of demand points are shown in Table 4.

3.1.2. Simulation

Before studying task allocation and track planning for multi-UAV distribution, this paper tackles the issue of determining the location of a material distribution center. The optimization goal is to minimize transportation costs using all the demand points in the region as potential distribution centers. The transportation cost is calculated using a formula C = W e i g h t d , and the clustering algorithm is used to find the coordinates of the distribution center, which are (57, 61) or position 0 in Table 4. The resulting transportation cost is 213.9480029.
To conduct this study, MATLAB R2021a programming was utilized on a computer with an Intel(R) Core(TM) i5-10210U CPU (Asus Computer Co., Ltd., Guangzhou, China), 8GB of memory, and a 64-bit operating system. The simulation and training were conducted on a total of 1409 demand points in nine districts of Changchun, with a population size of 30, and a maximum iteration limit of 200.

3.1.3. Results and Analysis

We inputted the data into the model and utilized the MIBSO algorithm to solve a calculation example. Then, we ran the algorithm independently 30 times and received the following outcomes: Figure 6 depicts the distribution of the optimal Pareto solution, Table 5 displays the most optimal Pareto solution, Figure 7 presents an analysis of the optimal Pareto solution, and Figure 8 and Table 6 offer visualization of the optimal Pareto solution.
It can be seen from Table 4 and Figure 6 that the MIBSO solutions are obtained from multiple non-dominant solutions by running the program once, and decision-makers can choose these solutions (schemes) according to their preferences for different goals. For instance, Option 6 has better values for Objective 1 and Objective 2 than Option 3, but its Objective 3 value is worse. Therefore, decision-makers prioritizing the economy and UAV utilization can opt for Option 6, while those prioritizing safety and punctuality can opt for Option 3.
Figure 7 provides three solutions for decision-makers to reference. The solution in the rectangular box labeled (a) is ideal for those who prioritize the balance of UAV use. If time requirements are stringent, the answer in box (b) should be considered. For decision-makers who value the balance of drone use and time requirements, the solution in box (c) is recommended. Table 5 shows the Pareto optimal scheme. Figure 8 is a visualization of Pareto’s optimal solution.
Figure 9 is a curve of the changing trend of the objective function value drawn by using the average value obtained after running the MIBSO algorithm 30 times, representing the algorithm’s process of searching for the optimal solution. It can be seen from the figure that with the increase in the number of iterations, the values of multiple objective functions show a continuous optimization direction.

4. Algorithm Performance Analysis

This section mainly tests and evaluates the designed algorithm’s convergence, distribution, and comprehensive performance (MIBSO).
This paper’s objective function and the independent variables’ attributes led to the selection of three test functions from the DTLZ series [27]: DTLZ4, DTLZ5, and DTLZ7. These functions are variable tests of any scale concerning the number of decision variables and targets.
Select generational distance (GD) and the Spacing metric as the algorithm’s convergence and distribution evaluation index, respectively. Moreover, select Hypervolume (HV) and Inverted Generational Distance (IGD) as comprehensive evaluation indicators of the algorithm, which are described as follows:
GD [28]: Used to represent the interval distance between the solved Pareto frontier (PFobtained) and the true Pareto frontier (PFtrue), obtained by calculating the average minimum distance between each point in the solution set Pobtained and the reference set Ptrue. The smaller the GD value, the better the convergence. The function is Formula (38).
G D Δ ¯ ¯ ( i = 1 n d i p ) 1 / p n
Spacing metric [28]: Used to evaluate the distribution of individuals in an approximate solution set in the target space by calculating the standard deviation of the minimum distance from each solution to the other solutions. The smaller the Spacing value, the more uniform the solution set. The function is defined as in Formula (39).
Δ = i = 1 P F d i d ¯ P F
HV [29]: Used to calculate the volume of the space region enclosed by the non-dominated solution set and the reference point. The larger the HV value, the better the comprehensive performance of the algorithm. The function is Formula (40).
H V = λ i = 1 S v i
IGD [29]: Inverted generation distance is the inverse mapping of generation distance, obtained by calculating the distance average from each reference point Ptrue to the nearest solution Pobtained. The smaller the IGD value, the better the comprehensive performance of the algorithm. The function is Formula (41).
I G D = j ¯ P F d j ¯ n
Figure 10, Figure 11 and Figure 12 are the test results of each function, respectively. Table 5 shows the index values of the test function. The above three figures, f1, f2, and f3, represent the three objective function values. True Pareto front (true PF) corresponds to the black surface in the figure, and the hollow circle in the figure is the Pareto frontier solved by MIBSO in this paper.
Based on the observations in Figure 10, it is evident that the Pareto frontier of the MIBSO solution is very close to the true Pareto frontier, which indicates that the MIBSO algorithm has an excellent ability to converge to a curve with good convergence performance.
It can be seen from Figure 11 that all solution individuals are distributed in the f1–f2 plane, and some solution individuals are distributed in the Pareto optimal plane, indicating that the MIBSO algorithm can maintain a good distribution of solutions.
Figure 12 shows that the Pareto frontiers solved by MIBSO are discretely distributed in the four regions of the true Pareto frontiers, and the number of solutions in each area are similar, indicating that the MIBSO algorithm can maintain good distribution in different Pareto optimal surfaces.
From Table 7, it can be seen that overall, MIBSO performs better than NSGA-Ⅱ. MIBSO has good performance in convergence and distribution and is feasible. On DTLZ4, MIBSO outperforms NSGA-2 in all four indicators. On DTLZ5, MIBSO exceeds NSGA2 in three indicators, and on DTLZ7, MIBSO surpasses NSGA2 in two indicators.

5. Conclusions

(1)
Model: This paper comprehensively considers factors of UAV load, energy consumption, cargo quality, and volume, intending to minimize the total cost of drone distribution and the full punishment of tasks, as well as optimize the balance of drone usage. A multi-UAV collaborative task assignment and routing problem with simultaneous delivery, pick-up, and time windows (MVTARPSDPTW) is constructed.
(2)
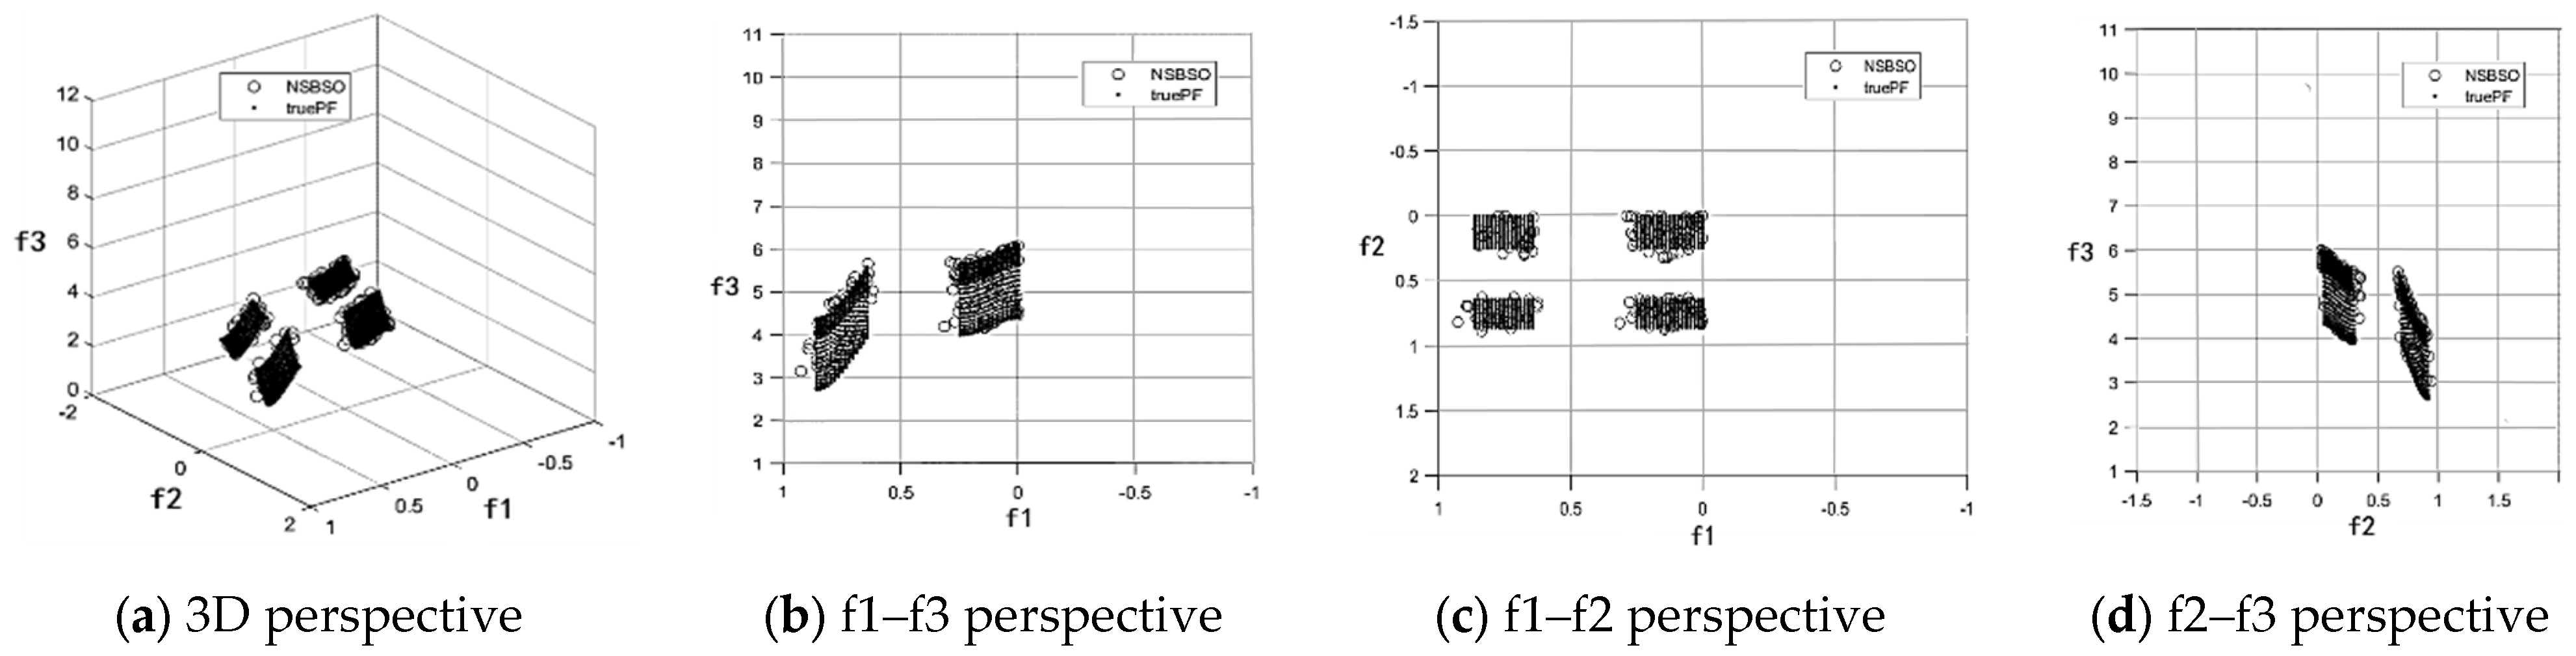
Algorithm: This work proposes a multi-objective, improved brainstorming optimization algorithm based on Pareto dominance (MIBSO) to solve the MVTARPSDPTW problem, and selected DTLZ4, DTLZ5, and DTLZ6 as benchmarks to test the algorithm performance based on the model attributes. From algorithm convergence, solution distribution, and comprehensive performance, GD, the Spacing metric, HV, and IGD are selected to evaluate the algorithm performance. The test results show that MIBSO in this paper performs well in terms of convergence and distribution and is feasible.
(3)
Application: This paper involves three aspects: location selection of distribution centers, task allocation of drone distribution, and travel planning in the material distribution process, fully covering the main task links of material distribution, considering comprehensive factors. These can solve practical engineering problems in challenging environments. This research finally forms a general-purpose technology scheme for UAV emergency supplies distribution, which can provide scientific reference for rescue tasks in significant disasters.
(4)
Future work: To consider more diversified distribution scenarios integrating heterogeneous UAVs, heterogeneous goods, demand uncertainty, and multi-task modes.

Author Contributions

Conceptualization, L.L. and X.Q.; methodology, X.W. and S.Y.; software, X.W.; validation, X.W. and X.Q.; formal analysis, X.W. and S.Y.; investigation, L.L.; resources, S.Y.; data curation, X.W. and X.Q.; writing—original draft preparation, X.W.; writing—review and editing, X.W. and S.Y.; visualization, X.W. and X.Q. All authors have read and agreed to the published version of the manuscript.

Funding

This work is supported by Yunnan Fundamental Research Projects (grant NO. 202101AU070041) and Talent training project (grant NO. KKZ3202065057) of the natural science research foundation of Kunming University of Science and Technology.

Institutional Review Board Statement

Not applicable.

Informed Consent Statement

Not applicable.

Data Availability Statement

Data are contained within the paper.

Conflicts of Interest

The authors declare no conflicts of interest.

References

  1. Tabusca, A.; Garais, G.E. IoT and the flying answer to COVID-19. J. Inf. Syst. Oper. Manag. 2020, 14, 162–174. [Google Scholar]
  2. During the Epidemic, JD’s Unmanned Delivery “Technology to Fight the Epidemic”. Available online: https://baijiahao.baidu.com/s?id=1663848656464964799&wfr=spider&for=pc (accessed on 13 October 2023).
  3. Wu, G.; Mao, N.; Luo, Q.; Xu, B.J.; Shi, J.M.; Suganthan, P.N. Collaborative truck-drone routing for contactless parcel delivery during the epidemic. IEEE Trans. Intell. Transp. Syst. 2022, 23, 25077–25091. [Google Scholar] [CrossRef]
  4. Nyaaba, A.A.; Ayamga, M. Intricacies of Medical Drones in Healthcare Delivery: Implications for Africa. Technol. Soc. 2021, 66, 101624. [Google Scholar] [CrossRef]
  5. Euchi, J. Do Drones Have a Realistic Place in a Pandemic Fight for Delivering Medical Supplies in Healthcare Systems Problems? Chin. J. Aeronaut. 2021, 34, 182–190. [Google Scholar] [CrossRef]
  6. Ling, G.; Draghic, N. Aerial Drones for Blood Delivery. Transfusion 2021, 59, 1608–1611. [Google Scholar] [CrossRef] [PubMed]
  7. Rodrigues, T.A.; Patrikar, J.; Oliveira, N.L.; Matthews, H.S.; Scherer, S.; Samaras, C. Drone flight data reveal energy and greenhouse gas emissions savings for very small package delivery. Patterns 2022, 3, 100569. [Google Scholar] [CrossRef] [PubMed]
  8. Chauhan, D.R.; Unnikrishnan, A.; Figliozzi, M.A.; Boyles, S.D. Robust Multi-Period Maximum Coverage Drone Facility Location Problem Considering Coverage Reliability. Transport. Res. Rec. 2023, 2677, 98–114. [Google Scholar] [CrossRef]
  9. Caunhye, A.; Zhang, Y.D.; Li, M.Z.; Nie, X.F. A Location-Routing Model for Prepositioning and Distributing Emergency Supplies. Transp. Res. Part E Logist. Transp. Rev. 2016, 90, 161–176. [Google Scholar] [CrossRef]
  10. Chauhan, D.R.; Unnikrishnan, A.; Boyles, S.D. Maximum Profit Facility Location and Dynamic Resource Allocation for Instant Delivery Logistics. Transp. Res. Rec. 2022, 2676, 697–710. [Google Scholar] [CrossRef]
  11. Xiao, Y.M.; Zhou, J.C.; Zhu, X.Y.; Yu, F.J. Research on Optimization Method and Algorithm Design of Green Simultaneous Pick-up and Delivery Vehicle Scheduling under Uncertain Demand. Sustainability 2022, 14, 12736. [Google Scholar] [CrossRef]
  12. Monami, D.R.; Bhaba, R.S. Optimizing a supply chain problem with nonlinear penalty costs for early and late delivery under generalized lead time distribution. Comput. Ind. Eng. 2021, 160, 107536. [Google Scholar]
  13. Yang, J.Y.; Xing, X.Y. Optimizing a Time-Sensitive Supply Chain with a Power Function Penalty Cost. J. Eng. Proj. Prod. Manag. 2023, 13, 113–124. [Google Scholar]
  14. Zhang, D.Z.; He, R.Z.; Li, S.Y.; Wang, Z.W. A multimodal logistics service network design with time windows and environmental concerns. PLoS ONE 2017, 12, e0185001. [Google Scholar] [CrossRef]
  15. Agatz, N.; Bouman, P.; Schmidt, M. Optimization approaches for the traveling salesman problem with drone. Transp. Sci. 2018, 52, 965–981. [Google Scholar] [CrossRef]
  16. Min, G.L.; Duanmu, J.S.; Zhang, B.; Zhang, L. Multi-target UAV mission planning in military logistics. Chin. Comput. Simul. 2017, 33, 85–89. [Google Scholar]
  17. Wang, H.; Chen, H.T.; Li, Y.; Li, H.C. Route planning method of plant protection UAV based on Grid-GSA algorithm. Chin. Trans. Agric. Mach. 2017, 48, 29–37. [Google Scholar]
  18. Xiao, G.; Chen, W.W.; Li, J.Q. Uav cluster task assignment algorithm based on improved QACA. Chin. Mod. Navig. 2019, 10, 28–33. [Google Scholar]
  19. Gao, S.; Ai, J.L.; Wang, Z.H. Mixed population RRT UAV track planning method. Chin. Syst. Eng. Electron. 2020, 42, 101–107. [Google Scholar]
  20. Yan, F.; Zhu, X.P.; Zhou, Z. Real-time task assignment of multi-heterogeneous UAVs with simultaneous attack constraints is considered. Chin. Sci. 2019, 49, 555–569. [Google Scholar]
  21. Tian, Z.; Wang, X.F. Collaborative task assignment of heterogeneous multi-UAV based on multi-gene genetic algorithm. Chin. Flight Mech. 2019, 37, 39–44. [Google Scholar]
  22. Zhang, Z.F. Research on Optimization of Collaborative Delivery of Trucks and Drones under Urban Floods. Master’s Thesis, Xi’an Technological University, Xi’an, China, 2024. [Google Scholar]
  23. Yanpirat, N.; Silva, D.F.; Smith, A.E. Sustainable last mile parcel delivery and return service using drones. Eng. Appl. Artif. Intell. 2023, 124, 106631. [Google Scholar] [CrossRef]
  24. Wei, H.C.; Shi, J.M.; Liu, Z.; Zhang, J.; Liu, C.H. Overview of drone delivery mode and path planning for last mile delivery. Chin. Comput. Syst. Appl. 2023, 32, 1–18. [Google Scholar]
  25. Ren, X.; Huang, H.; Yu, S.W.; Feng, S.; Yu, G.Q. A review of research on the combination of vehicles and drones for delivery. Chin. Control. Decis. 2021, 36, 2313–2327. [Google Scholar]
  26. Dorling, K.; Heinrichs, J.; Messier, G.G.; Magierowski, S. Vehicle routing problems for drone delivery. IEEE Trans. Syst. Man Cybern. Syst. 2017, 47, 70–85. [Google Scholar] [CrossRef]
  27. Deb, K.; Thiele, L.; Laumanns, L.M.; Zitzler, E. Scalable Multi-Objective Optimization Test Problems. In Proceedings of the 2002 Congress on Evolutionary Computation, Honolulu, HI, USA, 2–17 May 2002; Volume 1, pp. 825–830. [Google Scholar]
  28. Li, W.H.; Yao, X.Y.; Zhang, T.; Wang, R.; Wang, L. Hierarchy Ranking Method for Multimodal Multi-Objective Optimization with Local Pareto Fronts. IEEE Trans. Evolut. Comput. 2023, 27, 98–110. [Google Scholar] [CrossRef]
  29. Chen, H.K.; Cheng, R.; Pedrycz, W.; Jin, Y. Solving many-objective optimization problems via multistage evolutionary search. IEEE Trans. Syst. Man Cybern. Syst. 2021, 51, 3552–3564. [Google Scholar] [CrossRef]
Figure 1. Schematic diagram of energy consumption calculation.
Applsci 14 02365 g001
Figure 3. The coding adopted by MIBSO to solve the MVTARPSDPTW problem.
Applsci 14 02365 g003
Figure 4. Destroy operator description graph.
Applsci 14 02365 g004
Figure 5. Repair operator description graph.
Applsci 14 02365 g005
Figure 6. The spatial distribution of the Pareto optimal solution.
Applsci 14 02365 g006
Figure 7. Analysis of Pareto optimal solution. (a) Suggested plan 1; (b)suggested plan 2; (c) suggested plan 3.
Applsci 14 02365 g007
Figure 8. Visualization of Pareto optimal solution.
Applsci 14 02365 g008
Figure 9. The curve of the index changes the trend. (a) The trend curve of the total cost with the number of iterations; (b) the variation curve of the variance of the UAV energy residual with the number of iterations; (c) the trend curve of the task penalty value with the number of iterations.
Applsci 14 02365 g009
Figure 10. DTLZ5 Pareto boundary.
Applsci 14 02365 g010
Figure 11. DTLZ4 Pareto boundary.
Applsci 14 02365 g011
Figure 12. DTLZ7 Pareto boundary.
Applsci 14 02365 g012
Table 1. Descriptions of relevant symbols.
SymbolDescriptionSymbolDescription
B Set of all demand points. L c i 1 k Loading weight (including the starting point) when UAV k leaves node i 1 .
K Set of all UAVs. R i Required weight at node i .
x i j k Decision variable: determine whether drone k is from node i to node j . L d i k Retrieve the weight of goods at node i .
ϖ Unit transportation cost of drones. L 0 k Loading weight when UAV k leaves the starting point.
L o a d i j k The real loading weight of UAV k on the path from node i to node j . T w i k T l i k T v i k Represent the sum of the time window, the sum of the loading weight, and the sum of the loading volume violated by drone k at node i , respectively.
d i s ( i , j ) Euclidean distance between node i and node j . λ , β , γ Represent the penalty coefficients of the violation of the time window, the loading weight, and the loading volume, respectively.
x k Be used to judge whether drone k is used. x i k Be used to judge whether node i is served by drone k .
NVThe number of drones used. T i m e i k Represents the time when the drone k arrives at node i .
ψ Unit start-up cost. [ a , b ] The left and right time windows of node i .
Unit maintenance cost. L c i k The loading weight of drone k at node i .
E n l e a v e k The energy remaining of UAV k after completing the delivery task. C k The maximum loading weight of drone k .
E n l e a v e a Average of UAV energy remaining. V k The maximum loading volume of drone k .
m Number of drones. L v i k The loading volume of drone k at node i .
E n k The initial energy of UAV k . w i 1 k The service start-time of drone k to node i 1 .
E n c k Energy consumption of UAV k . s i 1 The service time of node i 1 .
E n c i j k Energy consumption of UAV k along the path from node i to node j . Δ ( i ) Set of arcs pointing to node i .
m U A V k The weight of UAV k . Δ + ( i ) Set of arcs pointed by i .
g Acceleration of heavy force. x i 1 , i k Determine whether drone k is from node i 1 to node i .
ρ Air density. d i 1 , i Distance from node i 1 to node i .
ξ The area of the rotating blade disc. x 0 j k Determine whether drone k is from the starting point and reaches node j .
n The number of UAV rotors. x i 0 k Determine whether drone k is from other nodes and returns to the starting point.
d i j Distance from node i to node j .MAn infinite number.
v k Speed of drone k . V i The volume of cargo i .
v k _ max Maximum flight speed of drone k . V max k The maximum volume allowed to be loaded by drone k .
t max k Maximum flight time of drone k . p The number of all demand points.
S max k Maximum flight distance of drone k .
Table 2. Relevant parameters of the drone.
Performance IndexValue
Maximum flying speed80 km/h
Maximum flight time with a full load17 min
Maximum flight distance with a full load19 km
Maximum payload5 kg
UAV’s warehouse size40 cm × 40 cm × 32 cm
Table 3. Data related to emergency supplies and transportation methods.
Medical SuppliesWeight/kgLength/mWidth/mHeight/mVolume/m3Transport Type
Therapeutic drug0.150.150.080.100.0012UAV
Detection reagent0.050.150.080.050.0006
Medical protective products0.030.250.100.010.00025
Note: For the novel coronavirus pneumonia, the emergency supplies delivered by drones this time are mainly treatment drugs (Lianhua Qingwen), detection reagents (antigen/five pieces per set), medical protective products (masks/ten pieces per set), and small-sized, lightweight, urgent items. Data are accurate drug data.
Table 4. Data related to demand points.
NumberXYDemandRecycling Quantity/kgRecycling Volume/m3Left Time WindowRight Time WindowService Time/min
ABC
05761000009:0011:0010
1526241430.250.006419:009:3010
255551713110.850.004269:109:4012
354683161310.007899:109:3014
45862179200.50.004309:209:5015
54866151540.20.005009:5010:2015
65859117201.50.006409:159:3515
754691011170.80.006299:4010:1017
85568151640.30.004859:009:3018
961661017231.50.005019:2010:0018
10596320590.150.004699:0010:0018
114661123710.007519:3010:0020
126249910200.250.006559:109:4021
135063561010.008989:009:4022
14545618830.550.005219:009:4022
1564571011150.50.0044010:0010:3023
Note: This information pertains to question F from the 2022 China Postgraduate Mathematical Contest in Modeling. The table displays serial number 0 as the distribution center, while numbers 1–15 represent the demand points. X indicates the horizontal coordinate, and Y represents the vertical coordinate. A denotes the demand for medical and drug materials, B for testing reagents, and C for protective materials. Each UAV’s loading time in the distribution center is 10 m, which remains constant.
Table 5. Pareto optimal solution set (Partial).
Dominant HierarchyObjective 1Objective 2Objective 3The Number of UAVs UsedOptimal Task Assignment Scheme and Flight Path Planning Scheme
1204.58335208.4763010Option 1: 0-14-3-0; 0-10-0; 0-2-4-0; 0-9-0; 0-5-0; 0-1-15-13-0; 0-7-12-0; 0-8-0; 0-6-0; 0-11-0;
1204.05604785.5881010Option 2: 0-14-3-0; 0-10-0; 0-6-4-0; 0-9-0; 0-5-0; 0-1-15-13-0; 0-7-12-0; 0-8-0; 0-2-0; 0-11-0;
1199.03702569.968309Option 3: 0-14-0; 0-5-0; 0-1-15-13-0; 0-7-12-0; 0-4-3-0; 0-10-8-0; 0-6-0; 0-2-0; 0-9-11-0;
1200.62873397.4345010Option 4: 0-14-0; 0-5-0; 0-1-15-13-0; 0-7-12-0; 0-4-3-0; 0-10-8-0; 0-6-0; 0-2-0; 0-9-0; 0-11-0;
1200.61502576.698509Option 5: 0-14-0; 0-5-0; 0-1-15-8-0; 0-7-12-0; 0-4-3-0; 0-10-13-0; 0-6-0; 0-2-0; 0-9-11-0;
1157.28812283.9717248Option 6: 0-13-0; 0-2-0; 0-1-15-12-0; 0-7-9-0; 0-4-3-0; 0-10-8-0; 0-6-0; 0-5-11-14-0;
1193.92311967.10581838Option 7: 0-14-0; 0-5-0; 0-1-15-13-0; 0-7-12-0; 0-4-3-0; 0-10-8-0; 0-6-0; 0-9-2-11-0;
Note: Objective function values 1, 2, and 3 correspond to total cost value, UAV energy residual variance value, and task penalty value, respectively. The smaller the three objective function values are, the better.
Table 6. Pareto optimal scheme.
UAVs’
Number
Demand PointTime WindowArrival TimeDeparture TimeLoad on Arrival/kgLoad at
Departure/kg
Volume on ArrivalVolume at
Departure
-0[9:00, 11:00]------
No. 114[9:00, 9:30]9:159:252.370.20.0270.005
No. 25[9:10, 9:40]9:189:304.293.350.0280.005
No. 31[9:10, 9:30]9:149:283.351.850.0480.041
15[9:20, 9:50]9:309:451.851.750.0410.023
13[9:50, 10:20]9:5710:124.062.80.0230.020
No. 47[9:15, 9:35]9:179:322.81.050.0450.028
12[9:40, 10:10]9:4910:063.111.990.0280.013
No. 54[9:00, 9:30]9:129:301.991.50.0350.021
3[9:20, 10:00]9:369:544.942.570.0210.012
No. 610[9:00, 10:00]9:139:312.570.450.0580.033
8[9:30, 10:00]9:369:562.051.50.0330.010
No. 76[9:10, 9:40]9:129:332.680.850.0220.006
No. 82[9:00, 9:40]9:149:364.13.060.0310.004
No. 99[9:00, 9:40]9:159:373.062.50.0460.023
11[10:00, 10:30]9:5010:132.290.550.0230.013
Table 7. The average metric value of each test function run 30 times.
Test FunctionEvaluation Index
GDSpacingHVIGDSuperior Proportion
MIBSONSGA-IIMIBSONSGA-IIMIBSONSGA-IIMIBSONSGA-II
DTLZ40.17500.26910.51800.80351.00000.47730.57350.5983100%
DTLZ50.04260.43800.11450.28480.23540.82570.04000.140175%
DTLZ70.03080.01270.30120.22090.59810.24090.05880.163850%
Superior proportion66.7%66.7%66.7%100%\
Note: Indicators are GD, Spacing, IGD value as small as possible, and HV value as immense as possible. Superior proportion represents the proportion of the number of indicators with better values for MIBSO compared to NSGA-II in the total number. Orange indicates MIBSO is more dominant; green indicates NSGA-II is more prevalent.
Disclaimer/Publisher’s Note: The statements, opinions and data contained in all publications are solely those of the individual author(s) and contributor(s) and not of MDPI and/or the editor(s). MDPI and/or the editor(s) disclaim responsibility for any injury to people or property resulting from any ideas, methods, instructions or products referred to in the content.

