Abstract
Crop yield prediction is essential for tasks like determining the optimal profile of crops to be planted, allocating government resources, effectively planning and preparing for aid distribution, making decisions about imports, and so on. Crop yield prediction using remote sensing data during the growing season is helpful to farm planning and management, which has received increasing attention. Information mining from multichannel geo-spatiotemporal data brings many benefits to crop yield prediction. However, most of the existing methods have not fully utilized the dimension reduction technology and the spatiotemporal feature of the data. In this paper, a new approach is proposed to predict the yield from multispatial images by using the dimension reduction method and a 3D convolutional neural network. In addition, regions with similar crop yields should have similar features learned by the network. Thus, metric learning and multitask learning are used to learn more discriminative features. We evaluated the proposed method on county-level soybean yield prediction in the United States, and the experimental results show the effectiveness of the proposed method. The proposed method provides new ideas for crop yield estimation and effectively improves the accuracy of crop yield estimation.
1. Introduction
Crop yield prediction [1] refers to giving the average yield of a particular crop in an area before its crop is harvested. Crop yield prediction is essential for tasks like determining the optimal profile of crops to plant, allocating government resources, effective planning and preparation of aid distribution, and decision making about imports and exports in more commercialized systems and is becoming more important because of the growing concern about food security under the impact of the Russian-Ukrainian War.
Based on the development of space satellite technology, remote sensing data are widely used for agricultural applications. The reason for its success is due to large global and temporal availability and easy accessibility. Other traditional methods are based on statistical data that rely heavily on manpower to estimate crop yields based on many characteristics. The labor cost is higher, and the timeliness is poor. However, the characteristics of changes in weather, environment, and other factors can be reflected in remote sensing data captured at different time periods. Therefore, crop yield estimation based on remote sensing data is fast, timely, and has strong application prospects. This is also the starting point of the research content of this article.
However, there are many challenges for crop yield prediction based on remote sensing data. Many factors that affect crop yield are shown in Figure 1. Among the factors that can be obtained from remote sensing data are the land temperature and growth of the crop in the area where the crop is grown. However, some factors are still unavailable through remote sensing data, which makes the prediction of crop yield using remote sensing data a challenging problem. Thus, a powerful method is needed to achieve a satisfactory result. Deep learning-based algorithms [2,3] have shown excellent performance in many fields, and currently, they have become the predominant method in crop prediction.
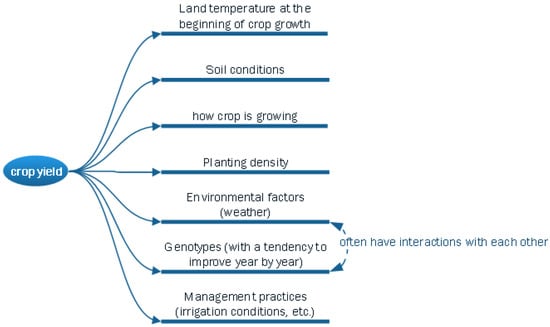
Figure 1.
Graphical analysis of factors affecting crop yield.
But there are also some difficulties in using deep-learning methods for crop yield estimation:
- (1)
- The inconsistency of the input data’s dimensions. The input to a typical crop yield prediction task is a satellite image of a specific region, such as a county. The size of this area can vary greatly. However, the deep-learning method requires that the dimensions of the input data be fixed. Most previous studies have avoided dealing with the full spatiotemporal data directly through various dimensionality reduction techniques. Therefore, a feature embedding method is needed that can map input data with different dimensions to a fixed dimension.
- (2)
- Methods with time series processing capabilities are required. The growth of crops is a dynamic process that has to be assessed serially. It is essential to design a method capable of modeling crops’ long-term growth dynamics. Some research has shown that the accuracy of the results using CNN is better than those using LSTM [1,2,3,4,5], indicating that the growth dynamics of crops are so complex that it is not feasible to simply apply time series neural networks to crop yield prediction tasks.
- (3)
- Lack of labeled data. Remote sensing data [6,7] are widely available at a relatively low cost. The scarcity of labeled training data becomes an even more severe issue for deep-learning models that deal with high-dimensional data. However, crop yield data are relatively scarce. For example, crop yield data in the United States are more detailed, while in other regions, especially in developing countries, data are less available and at a coarser granularity (only accurate to the provincial administrative area).
In this paper, we propose a crop yield prediction method that uses a 3D convolutional neural network with dimension reduction and metric learning. The proposed method is evaluated on county-level soybean yield prediction in the United States, and the experimental results show the effectiveness of the proposed method. The contributions of this work are summarized as follows:
- We propose the crop yield prediction method by using time series multispatial images [8,9,10] and a 3D convolutional neural network [11,12], which has been proven to be effective.
- We believe that regions with similar crop yields should have similar features learned by the network. Thus, the triplet constraint is used for the penultimate feature learned by the 3D convolutional neural network. As a result, the discriminative feature learning in the crop yield prediction task can be facilitated by the above constraints.
- We propose a multitask learning method to simultaneously learn regression and deep feature embedding for crop yield prediction.
2. Related Works
The research of crop yield prediction is mainly based on two kinds of data. One is statistical data (locally sensed data), mainly genetic characteristics (data from seeds (with a tendency to improve year by year)), soil conditions, environmental factors that changes in time and space (weather, etc.), planting density, management specifications (irrigation conditions, etc.). The other is remote sensing data, such as multispectral remote sensing images. Currently, leading crop yield prediction techniques mostly rely on locally sensed data since the locally sensed data can provide detailed information [13]. But locally sensed data are expensive to collect, often noisy, and extremely difficult to scale. Remote sensing data, on the other hand, is a cheap and globally accessible resource that is more suitable for surveying large areas and monitoring national and regional agricultural changes. Thus, crop yield prediction based on remote sensing data is a hot research topic. Currently, the deep learning-based method is the predominant method in the crop prediction task since it has shown excellent performance in many fields. There are many papers based on deep-learning approaches.
Jiaxuan You et al. from Stanford University published “Deep Gaussian Process for Crop Yield Prediction Based on Remote Sensing Data” in 2017 [1], which won the Best Student Paper Award in the Computational Sustainability Track of AAAI 2017, and the work also won the Best Big Data Solution in the World Bank Big Data Innovation Challenge. They used multispectral remote sensing images (nine bands) from MODIS satellites [6,14] to estimate soybean and corn yields in 11 U.S. states. Their contributions to the technical solution are threefold. Firstly, the raw data are embedded using a histogram. The embedding method is motivated by the author’s belief that the location of spectral information is not related to yield estimation. However, the method in this paper also has some problems: The spectral information of different bands at the same location should be correlated with each other, which is equivalent to a feature vector, but the paper constructs separate histograms for different spectral bands and then stitches these histograms together, which separates the correlation between different spectral information at the same location. Secondly, the Deep Gaussian Process is combined with a neural network. The motivation for this approach is that yields should obey the continuity assumption. The reason is that the remote sensing data alone cannot cover all the factors that affect crop yield. Moreover, these factors, such as land fertility, should have continuity in space and time. Jiaxuan You et al. proposed integrating the continuity assumption of yield into a neural network using the Deep Gaussian Process. Finally, two neural networks based on LSTM and CNN were used to estimate the yield, respectively.
Anna X. Wang et al. of Stanford University conducted corn and soybean yield estimation on remotely sensed images from Argentina and Brazil based on the method of You et al. mentioned above [7]. They also used the MODIS self-contained Land cover mask to determine the planting areas of maize and soybean. Since the MODIS Land cover mask does not distinguish between crop types, they used the setting that all cropland in the major crop production areas is planted with this type of crop. For example, the arable land with the highest soybean production in Argentina’s provinces is all considered soybean growing areas.
Helena Russello of the University of Amsterdam proposed using 3D convolution to estimate crop yields on remotely sensed images [5]. They replicated the work of Jiaxuan You et al. at Stanford University and found that the yield estimation results are prone to high prediction for low yields and low prediction for high yields. We speculate that this may be related to the uneven labeling in the dataset. The labels in the dataset become approximately normally distributed, with most values concentrated around the mean. Potential improvements are increasing the samples’ weights far from the mean. Helena Russello also conducted an experimental analysis of the factors that influence the estimation of yields. His experimental results showed that for soybean yield estimation in 2016, using 2003–2015 as training data progress was only 8.437 (RMSE), while using 2009–2015 as training data, the amount of data became smaller, but the accuracy instead increased to 7.532 (RMSE). The experimental results show that older data do not help much in improving the accuracy of the yield estimation but may also introduce more noise.
Hanzi Mao et al. of Facebook AI proposed a new feature extraction method [15]. They assumed that the features extracted from regions that are closer in geospatial location should also be closer in the feature space. Based on this assumption, they proposed a semi-supervised Context-aware Representation Learning method for the problem of scarcity of labeled data faced in the crop yield prediction problem. We argue that this hypothesis is not reasonable. For crop yield prediction, it should be that for regions with similar yields, the extracted features should be closer in the feature space.
Thus, in this paper, we not only utilize the 3D convolutional neural network to extract the temporal information of crops but also incorporate the triplet constraint to predict the crop yield, which is more effective.
3. Materials and Methods
3.1. Problem Definition
We consider using a series of remote sensing images to predict the average yield of a certain crop (such as soybeans) in an area of interest before the harvest season. Specifically, we will use a multispectral image sequence covering the region of interest as input. Each multispectral image corresponds to images at different time t within a year. And and are the number of horizontal and vertical pixels, and is the number of bands of image. Our goal is to learn a mapping to characterize the relationship between these original images and the average crop yield .
3.2. Framework Overview
In this section, we use the multitemporal and multichannel remote sensing data as the input of the network for crop yield prediction. The architecture of the proposed framework is presented in Figure 2. In the training stage, first, at each time step, the multispectral image is mapped to histogram matrix representation through the global feature extraction part. Then, we stack the extracted histogram matrix representations into the 3D histogram as the input of the 3D convolutional neural network to learn deep features. It is worth mentioning that we believe that regions with similar crop yields should have similar features learned by the network. And the triplet constraint is used for the penultimate feature learned by the 3D convolutional neural network. Finally, we propose multitask learning to learn the regression and the deep feature embedding simultaneously for crop yield prediction. As a result, the discriminative feature learning in the crop yield prediction task can be facilitated by the above constraints. In the test stage, the test multispectral image is mapped to histogram matrix representation through the global feature extraction part at each time step. Then, the extracted histogram matrix representations are stacked into the 3D histogram, which is sent into the trained 3D convolutional neural network to obtain the final crop yield prediction value.
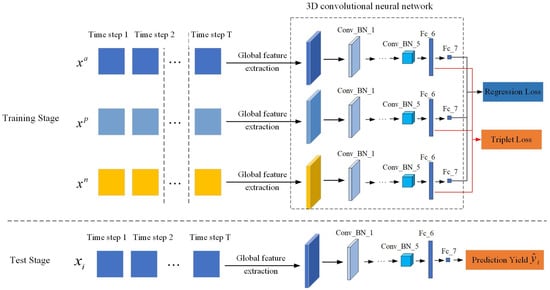
Figure 2.
The architecture of the proposed framework.
3.2.1. Global Feature Extraction
Due to the different sizes of the area in each county used for crop yield prediction, it is not feasible to directly feed different sizes of images that contain an entire county into the network to learn deep features. The strategy adopted in [15] is to extract image patches of the same size from each county. As a result, the county with a larger area can only partially be included in the extracted image patch. Furthermore, for the county with a smaller area, the extracted image includes not only this county but also part of other regions. However, You et al. [1] designed a new dimension reduction algorithm based on the assumption of permutation invariance, which can map a high-dimensional image with different sizes into a histogram with equal dimensions without losing information.
Thus, we perform the transformation using the same procedure as [1], and the operation process of the global feature extraction is shown in Figure 3. Firstly, at every time t, we extract the multispectral images, which is the minimal matrix containing each county. Then, the land cover information is used to mask the pixels that are not masked as croplands. Accordingly, the values of these pixels are set to 0. Thirdly, we discretize the pixel values of each band in the image into bins and produce a b-bins histogram . And is the number of the bands for each image. By concatenating all into , the histogram matrix is produced per image and regarded as a compact representation of the original multispectral image. Thus, the desired mapping is converted to the desired mapping . The sequential nature of the inputs suggests the use of temporal models. And we stack into the 3D histogram as the input of the 3D convolutional neural network in the proposed method.
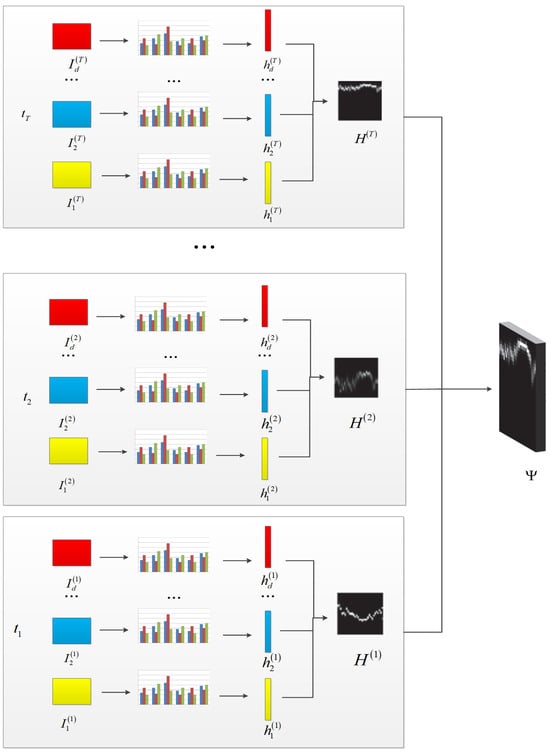
Figure 3.
The operation process of the global feature extraction.
3.2.2. Network Architecture
In recent years, the 3D convolutional neural network has been successfully used in human activity recognition and crop classification tasks. Due to the convolutional kernel covering the receptive field along both spatial and temporal dimensions, the 3D convolutional neural network can extract features from input from spatial and temporal dimensions. Thus, the 3D convolutional neural network has been proven to be well-suited to learning features from spatiotemporal data. Inspired by these works, we used a 3D convolutional neural network for crop yield prediction in this paper. As shown in Figure 4, the 3D histogram is fed into the 3D convolutional neural network to learn deep features. The output Fc_7 of the 3D convolutional neural network is used for crop yield estimation.
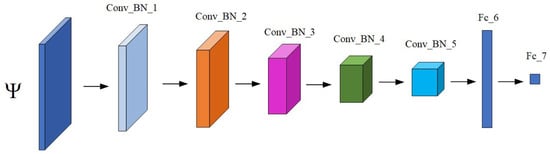
Figure 4.
The architecture of the 3D convolutional neural network.
The suitable structure is arrived at for the data type, dataset size, and learning objective, which are listed in Table 1. The whole network contains five 3D convolutional layers and two fully connected layers. The layer “Conv_BN_ ” means the 3D convolutional layer, which consists of the operations of the 3D convolution and the batch normalization (BN). The layer “Fc_ ” means the fully connected layer. ReLU [16] is used as the non-linear function of the whole network.

Table 1.
The architecture of the 3D convolutional neural network.
3.2.3. Triplet Constraint for Feature Constraint
In [14], the authors make an assumption that spatial images that are close spatially should have similar features to those that are far apart. However, this assumption is not very reasonable. And we believe that regions with similar crop yields should have similar features learned by the 3D convolutional neural network. Conversely, the features learned through the 3D convolutional neural network should be far apart for regions with large differences in crop yield. Thus, the metric learning strategy [17] is applied in this paper to learn discriminative features. The structure of the triplet network for discriminative feature learning is shown in Figure 5.
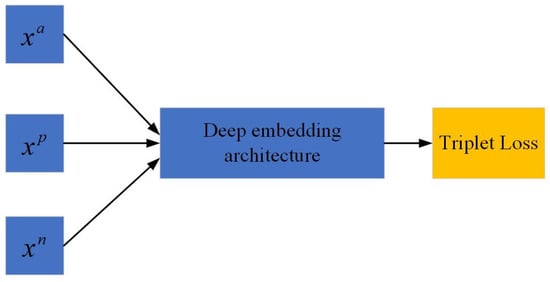
Figure 5.
The structure of the triplet network.
Generally, a triplet contains an anchor image, a positive image and a negative image. In our task, has similar crop yield with , while and have large differences in crop yield. That is to say, is an anchor image, is a positive image, and is a negative image. And by using the embedding function, a triplet is mapped to a high-dimensional space. In the proposed method, , , and are respectively fed into the network to obtain the deep features, i.e., , , and in layer , respectively, for crop yield estimation. The triplets should satisfy the distance constraint in the embedding space:
where is the constant margin value greater than 0. The above formula enforces the Euclidean distance between the positive pair smaller than that of the negative pair by a certain margin . The Euclidean distance between the positive or negative pair can be computed as follows, which has been proven effective for metric learning [18].
Then, the triplet network is optimized by the triplet loss to enforce the features and to get closer and closer, while and have large differences.
where utilizes the hinge loss function, i.e., . And we can see that the triplet loss can enforce the learned features of samples with similar yields to be closer, while the learned features of samples with different yields have larger reparability. Thus, the discriminative feature learning in the crop yield prediction task can be facilitated by the above constraints.
3.2.4. Multitask Learning of Regression Prediction and Deep Feature Embedding
From the above description, it can be seen that the entire network framework includes two loss functions, i.e., regression prediction loss and the triplet loss for training together. By jointly training two loss functions, the features learned by the network can better predict crop yield accurately.
- (1)
- Regression prediction: For a regression task, the regression prediction loss for crop yield prediction is calculated through the mean squared error:
- (2)
- Deep feature embedding learning: The regression prediction loss just penalizes the regression error equally for each county, which cannot enforce the learned deep features discriminatively enough. Thus, inspired by the metric learning strategy, we utilize the triplet loss as the similarity constraint.
- (3)
- Multitask learning: To incorporate the advantages of regression prediction and metric learning, we apply multitask learning to learn more discriminative features for crop yield prediction. The framework is formulated by integrating the two losses above as follows:
Benefiting from the multitask learning of regression prediction and deep feature embedding, the deep neural network is jointly optimized by propagating the regression prediction error information and the similarity constraint information backward simultaneously. In such a way, more powerful deep features suitable for crop yield prediction are obtained.
In this paper, we utilize the stochastic gradient descent (SGD) algorithm [19] to solve the minimization problem of the objective function. As the triplet networks have been trained, we only need one branch for inference. That is to say, the triplet loss is removed during testing. And the test samples are directly fed to the backbone network trained to extract the deep embedding features. Then, the output of the network is used to predict the crop yield of each test sample.
4. Results
4.1. Data Description and Metrics
In this section, extensive experiments were performed to verify the effectiveness of the proposed method. To compare with prior work, we evaluated our method in the United States and chose soybean as the target crop since it has been widely investigated in prior work [6,14]. The input data are remote sensing data with nine channels. The first seven channels contain the remote sensing data on the surface reflectance from seven bands, which are shown in Figure 6. The remaining two-channel data contain the remote sensing data on the surface temperature from two bands, which are shown in Figure 7 [20]. These data are all derived from the MODIS satellite, which are L3-level products of MODIS products. The maturity of these data is usually relatively high. They are generated based on calibrated L1B- or L2-level data. In addition, MODIS L3-level data is usually composed of multiple satellite observation data combinations, and the differences caused by sensors have been corrected accordingly. There is no need to further calibrate the data source to eliminate the differences caused by sensors. In addition, we also use cropland data derived from the USDA website, which is used as mask data to process MODIS remote sensing data to highlight the focus area. The above three types of data are resampled and cropped in counties within the United States administrative region to form the final dataset.
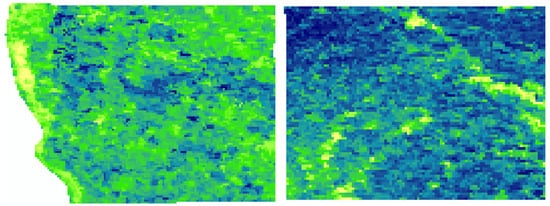
Figure 6.
The remote sensing data on the surface reflectance.
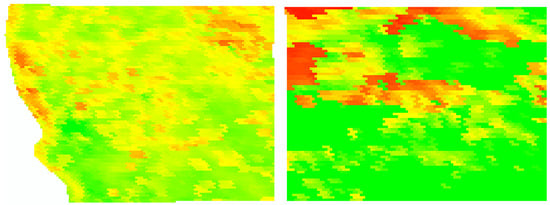
Figure 7.
The remote sensing data on the land surface temperature.
We use multispectral images collected 32 times a year, from the 49th day to the 305th day at 8-day intervals. We discretize all the images using 32 bins to compute the pixel histogram. The resulting input histogram is , with b = 32, d = 9, and T = 32. The ground truth output data are the yearly average soybean yield at the county level measured in bushels per acre, publicly available on the USDA website [21]. We selected 11 states in the U.S. that account for over 75% of the national soybean production and used data from 2010 to 2021. All sources of remote sensing data were cropped according to county borders, while non-soybean pixels were removed with the help of a cropland data layer. To evaluate the generalization ability of the proposed method for unseen data in future years, the temporal nested validation approach was used. We conducted prediction experiments for 6 years, from 2016 to 2021, independently. When a year was selected to collect the test data, data from year were used for validation. And data collected from year to were used for training. was used to control the size of the training data and the performance of a model. In the experiments, the hyperparameters of the proposed method were optimized in cross-validation. Accordingly, the grid search from reasonable hyperparameter combinations was adopted, and 300 epochs were run, with the best model saved based on validation performance. For the triplet margin in (7), a value too large would lead to overfitting, so we properly set this parameter to 0.2. And was set to 6.
In addition, the ground truth crop yield data were downloaded from the Quick Stats database. The Quick Stats database is the most comprehensive tool for accessing agricultural data published by NASS. We used the Root Mean Square Error (RMSE) as the evaluation metric for the experiment, which has been widely used to evaluate the performance of crop yield prediction in previous studies [22]. The smaller the RMSE, the better the performance of the network. When estimating crop yields for a certain year, is the prediction yield learned from the network for state . is the corresponding true crop yield. For N states, the RMSE formula is presented as follows:
4.2. Proposed Method Validation
To verify the effectiveness of the 3D convolutional neural network and triplet constraint, we compare the proposed method with Net_3Dcnn and Net_cnn, which are shown in Figure 8 and Figure 9, respectively. Net_3Dcnn is constructed by removing the triplet constraint of the proposed method. And Net_cnn is the method proposed in [4], which sends the histogram representation to the CNN to predict the crop yield directly.
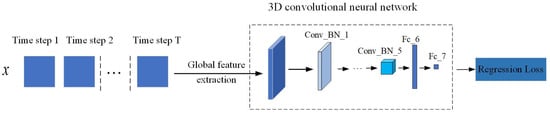
Figure 8.
The structure of the Net_3Dcnn.
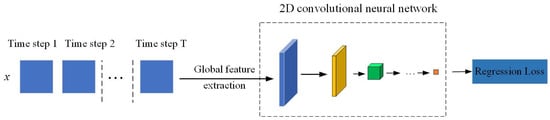
Figure 9.
The structure of the Net_cnn.
Table 2 shows the empirical results of different methods in terms of RMSE. Smaller RMSE implies better performance. Compared with Net_cnn, the RMSE of Net_3Dcnn with the best-performing baseline 3D convolutional neural network is lower for all years, and a 1.7% improvement in terms of average RMSE is observed. The Net_cnn only uses spatial information from the data, while Net_3Dcnn uses both spatial and temporal information to estimate crop yield. The experimental results fully demonstrate the effectiveness of the 3D convolutional neural network replacing the 2D convolutional neural network. Moreover, it can be seen that the proposed method consistently outperforms the other two methods for all years. The proposed method outperforms Net_3Dcnn, with 2.7% improvement in average RMSE, and outperforms Net_cnn with 4.2% improvement, which indicates that it is more effective to utilize the proposed feature constraint and the 3D convolutional neural network.
Table 2.
RMSE comparison of different methods.
In addition, the scatter plots of the predicted yield and the observed yield per county for the different methods are shown in Figure 10. In this figure, the horizontal axis represents the true crop yield value, and the vertical axis represents the prediction crop yield value learned from the network. Each point represents a yield prediction for a county, and the plots indicate the positive linear relationship between the predicted yield and the observed yield. We can see the points of the proposed method are more clustered. Moreover, the points of the proposed method lie closer to the line, which indicates that the predicted yield of the proposed method is closer to the observed yield. This result also demonstrates the effectiveness of the feature constraint and the 3D convolutional neural network of the proposed method from the perspective of data analysis.
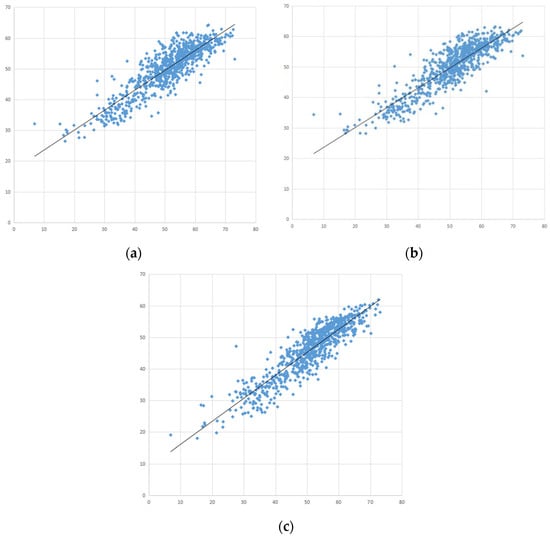
Figure 10.
Scatter plots of the predicted yield and the observed yield per county in 2020 for the different methods. (a) Net_cnn, (b) Net_3Dcnn, and (c) the proposed method.
4.3. Competing Methods
In this section, the proposed method is compared with widely used crop yield prediction methods, i.e., ridge regression [22] and decision trees [13], which are the widely used traditional methods in the field of crop yield estimation. The RMSEs of the different methods are shown in Table 3. The results show that the RMSEs of the ridge regression and the decision trees are unstable in different years. The performance of the decision trees method was outperformed by ridge regression in 2017–2019 and 2021, while the performance of the ridge regression method was outperformed by decision trees in 2016 and 2020. But, the proposed method outperforms competing methods significantly for all years, as 31.9% and 30.0% improvements in terms of average RMSE are observed, respectively. The above results also demonstrate the effectiveness of the proposed method.
Table 3.
RMSE comparison of different methods.
5. Conclusions
In this paper, we propose a deep-learning framework for crop prediction using remote sensing data. Since the spatial information of an image alone cannot help to estimate the crop yield well, the temporal information of consecutive images should be considered. Thus, a series of multispatial images with change information was used as the input for the 3D convolutional neural network proposed in this paper. Moreover, the dimensionality reduction method used in this paper can map the different images to the same dimensional feature and prevent the loss of useful information. In addition, the metric learning and multitask learning strategies make regions with similar crop yields have similar features learned by the network, which can make the learned features better for crop yield prediction. Experimental results on county-level soybean yield prediction in the United States also show the effectiveness of the proposed method. Accurate crop yield estimation has important research significance in the field of agriculture. And the proposed method provides new ideas for crop yield estimation and effectively improves the accuracy of crop yield estimation.
In addition, the effectiveness of the proposed method has been validated on soybean yields in major producing states in the United States. Due to the differences in the characteristics of different crops and regions, it is possibly not entirely applicable and has limitations if directly applying the proposed method to estimate yields of other crops and regions. But, we believe that the strategy of using the temporal network and the feature constraint of the proposed method is still effective. Thus, it is necessary to modify the model based on the target characteristics of different crop types and different regions in order to achieve better yield estimation performance. This is one of the tasks we need to do in the future. For additional future work, using more information from the images and looking for a network with better performance to further improve the accuracy of the crop prediction are considered.
Author Contributions
Methodology, N.W. and P.H.; resources, Z.M.; software, N.W. and P.H.; writing—review and editing, N.W., P.H., Z.M., X.L., Z.H. and K.L. All authors have read and agreed to the published version of the manuscript.
Funding
This research received no external funding.
Institutional Review Board Statement
Not applicable.
Informed Consent Statement
Not applicable.
Data Availability Statement
Data are contained within the article.
Conflicts of Interest
The authors declare no conflict of interest.
References
- You, J.; Li, X.; Low, M.; Lobell, D.; Ermon, S. Deep Gaussian Process for Crop Yield Prediction Based on Remote Sensing Data. In Proceedings of the Thirty-First AAAI Conference on Artificial Intelligence, San Francisco, CA, USA, 4–9 February 2017. [Google Scholar]
- Mao, Z.Q.; Ma, C.H.; Cui, J.L.; Wang, Y. Research on Action Recognition Based on Two-stream Convolution and Double Center Loss. Microelectron. Comput. 2019, 36, 96–100. [Google Scholar]
- Ru, X.Q.; Hua, G.G.; Li, L.H.; Li, L. Handwritten Digital Recognition Based on Deformable Convolutional Neural Network. Microelectron. Comput. 2019, 36, 47–51. [Google Scholar]
- Muruganantham, P.; Wibowo, S.; Grandhi, S.; Samrat, N.H.; Islam, N. A Systematic Literature Review on Crop Yield Prediction with Deep Learning and Remote Sensing. Remote Sens. 2022, 14, 1990. [Google Scholar] [CrossRef]
- Russello, H. Convolutional Neural Networks for Crop Yield Prediction Using Satellite Images. Master’s Thesis, University of Amsterdam, Amsterdam, The Netherlands, 2018. [Google Scholar]
- Bolton, D.K.; Friedl, M.A. Forecasting Crop Yield Using Remotely Sensed Vegetation Indices and Crop Phenology Metrics. Agric. For. Meteorol. 2013, 173, 74–84. [Google Scholar] [CrossRef]
- Wang, A.X.; Tran, C.; Desai, N.; Lobell, D.; Ermon, S. Deep Transfer Learning for Crop Yield Prediction with Remote Sensing Data. In Proceedings of the 1st ACM SIGCAS Conference on Computing and Sustainable Societies, San Jose, CA, USA, 20–22 June 2018. [Google Scholar]
- Maimaitijiang, M.; Sagan, V.; Sidike, P.; Hartling, S.; Esposito, F.; Fritschi, F.B. Soybean Yield Prediction from UAV Using Multimodal Data Fusion and Deep Learning. Remote Sens. Environ. 2020, 237, 111599. [Google Scholar] [CrossRef]
- Nevavuori, P.; Narra, N.; Lipping, T. Crop Yield Prediction with Deep Convolutional Neural Networks. Comput. Electron. Agric. 2019, 163, 104859. [Google Scholar] [CrossRef]
- Ji, S.; Zhang, C.; Xu, A.; Shi, Y.; Duan, Y. 3D Convolutional Neural Networks for Crop Classification with Multi-temporal Remote Sensing Images. Remote Sens. 2018, 10, 75. [Google Scholar] [CrossRef]
- Ji, S.; Xu, W.; Yang, M.; Yu, K. 3D Convolutional Neural Networks for Human Action Recognition. IEEE Trans. Pattern Anal. Mach. Intell. 2013, 35, 221–231. [Google Scholar] [CrossRef] [PubMed]
- Tran, D.; Bourdev, L.; Fergus, R.; Torresani, L.; Paluri, M. Learning Spatiotemporal Features with 3D Convolutional Networks. in Computer Vision (ICCV). In Proceedings of the 2015 IEEE International Conference on Information and Automation, Lijiang, China, 8–10 August 2015; pp. 4489–4497. [Google Scholar]
- Khaki, S.; Wang, L.; Archontoulis, S.V. A CNN-RNN Framework for Crop Yield Prediction. Front. Plant Sci. 2019, 10, 1750. [Google Scholar] [CrossRef] [PubMed]
- Johnson, D.M. An Assessment of Pre-and within-season Remotely Sensed Variables for Forecasting Corn and Soybean Yields in the United States. Remote Sens. Environ. 2014, 141, 116–128. [Google Scholar] [CrossRef]
- Mao, H.; Liu, X.; Duffield, N.; Yuan, H.; Ji, S.; Mohanty, B. Context-Aware Deep Representation Learning for Geo-Spatiotemporal Analysis. In Proceedings of the 2020 IEEE International Conference on Data Mining (ICDM), Sorrento, Italy, 17–20 November 2020; pp. 392–401. [Google Scholar]
- He, K.; Zhang, X.; Ren, S.; Sun, J. Deep Residual Learning for Image Recognition. In Proceedings of 2016 IEEE Conference on Computer Vision and Pattern Recognition (CVPR), Las Vegas, NV, USA, 27–30 June 2016; pp. 770–778. [Google Scholar]
- Weinberger, K.Q.; Saul, L.K. Distance Metric Learning for Large Margin Nearest Neighbor Classification. J. Mach. Learn. Res. 2009, 10, 207–244. [Google Scholar]
- Harwood, B.; Kumar, V.B.G.; Carneiro, G.; Reid, I.; Drummond, T. Smart Mining for Deep Metric Learning. In Proceedings of the 2017 IEEE International Conference on Computer Vision (ICCV), Venice, Italy, 22–29 October 2017; pp. 2840–2848. [Google Scholar]
- LeCun, Y.; Bottou, L.; Orr, G.B.; Müller, K.-R. Efficient Backpro in Neural Networks: Tricks of the Trade; Springer: Berlin/Heidelberg, Germany, 2012; pp. 9–48. [Google Scholar]
- Daac, N.L. The MODIS Land Products. 2015. Available online: http://lpdaac.usgs.gov (accessed on 15 December 2023).
- USDA. USDA National Agricultural Statistics Service. 2016. Available online: https://quickstats.nass.usda.gov (accessed on 15 December 2023).
- Mateo-Sanchis, A.; Piles, M.; Munoz-Mari, J.; Adsuara, J.E.; Perez Suay, A.; Camps-Valls, G. Synergistic integration of optical and microwave satellite data for crop yield estimation. Remote Sens. Environ. 2019, 234, 111460. [Google Scholar] [CrossRef] [PubMed]
Disclaimer/Publisher’s Note: The statements, opinions and data contained in all publications are solely those of the individual author(s) and contributor(s) and not of MDPI and/or the editor(s). MDPI and/or the editor(s) disclaim responsibility for any injury to people or property resulting from any ideas, methods, instructions or products referred to in the content. |
© 2023 by the authors. Licensee MDPI, Basel, Switzerland. This article is an open access article distributed under the terms and conditions of the Creative Commons Attribution (CC BY) license (https://creativecommons.org/licenses/by/4.0/).