Article

An Artificial Intelligence (AI) Framework to Predict Operational Excellence: UAE Case Study

1
College of Engineering, University of Sharjah, Sharjah 27272, United Arab Emirates
2
College of Computing & Informatics, University of Sharjah, Sharjah 27272, United Arab Emirates
3
Business Excellence Department, Dubai Police, Dubai P.O. Box 1493, United Arab Emirates
*
Authors to whom correspondence should be addressed.
Appl. Sci. 2024, 14(6), 2569; https://doi.org/10.3390/app14062569
Submission received: 30 December 2023 / Revised: 9 March 2024 / Accepted: 11 March 2024 / Published: 19 March 2024
(This article belongs to the Special Issue AI Technology and Application in Various Industries)

Abstract

:
Implementing the European Foundation for Quality Management (EFQM) business excellence model in organizations is time- and cost-consuming. The integration of artificial intelligence (AI) into the EFQM business excellence model is a promising approach to improve the efficiency and effectiveness of excellence in organizations. This research paper’s integrated framework follows the ISO/IEC 23053 standard in addressing some of the concerns related to time and cost associated with the EFQM model, achieving higher EFQM scores, and hence operational excellence. A case study involving a UAE government organization serves as a sample to train the AI framework. Historical EFQM results from different years are used as training data. The AI framework utilizes the unsupervised machine learning technique known as k-means clustering. This technique follows the ISO/IEC 23053 standard to predict EFQM output total scores based on criteria and sub-criteria inputs. This research paper’s main output is a novel AI framework that can predict EFQM scores for organizations at an early stage. If the predicted EFQM score is not high enough, then the AI framework provides feedback to decision makers regarding the criteria that need reconsideration. Continuous use of this integrated framework helps organizations attain operational excellence. This framework is considered valuable for decision makers as it provides early predictions of EFQM total scores and identifies areas that require improvement before officially applying for the EFQM excellence award, hence saving time and cost. This approach can be considered as an innovative contribution and enhancement to knowledge body and organizational practices.

1. Introduction

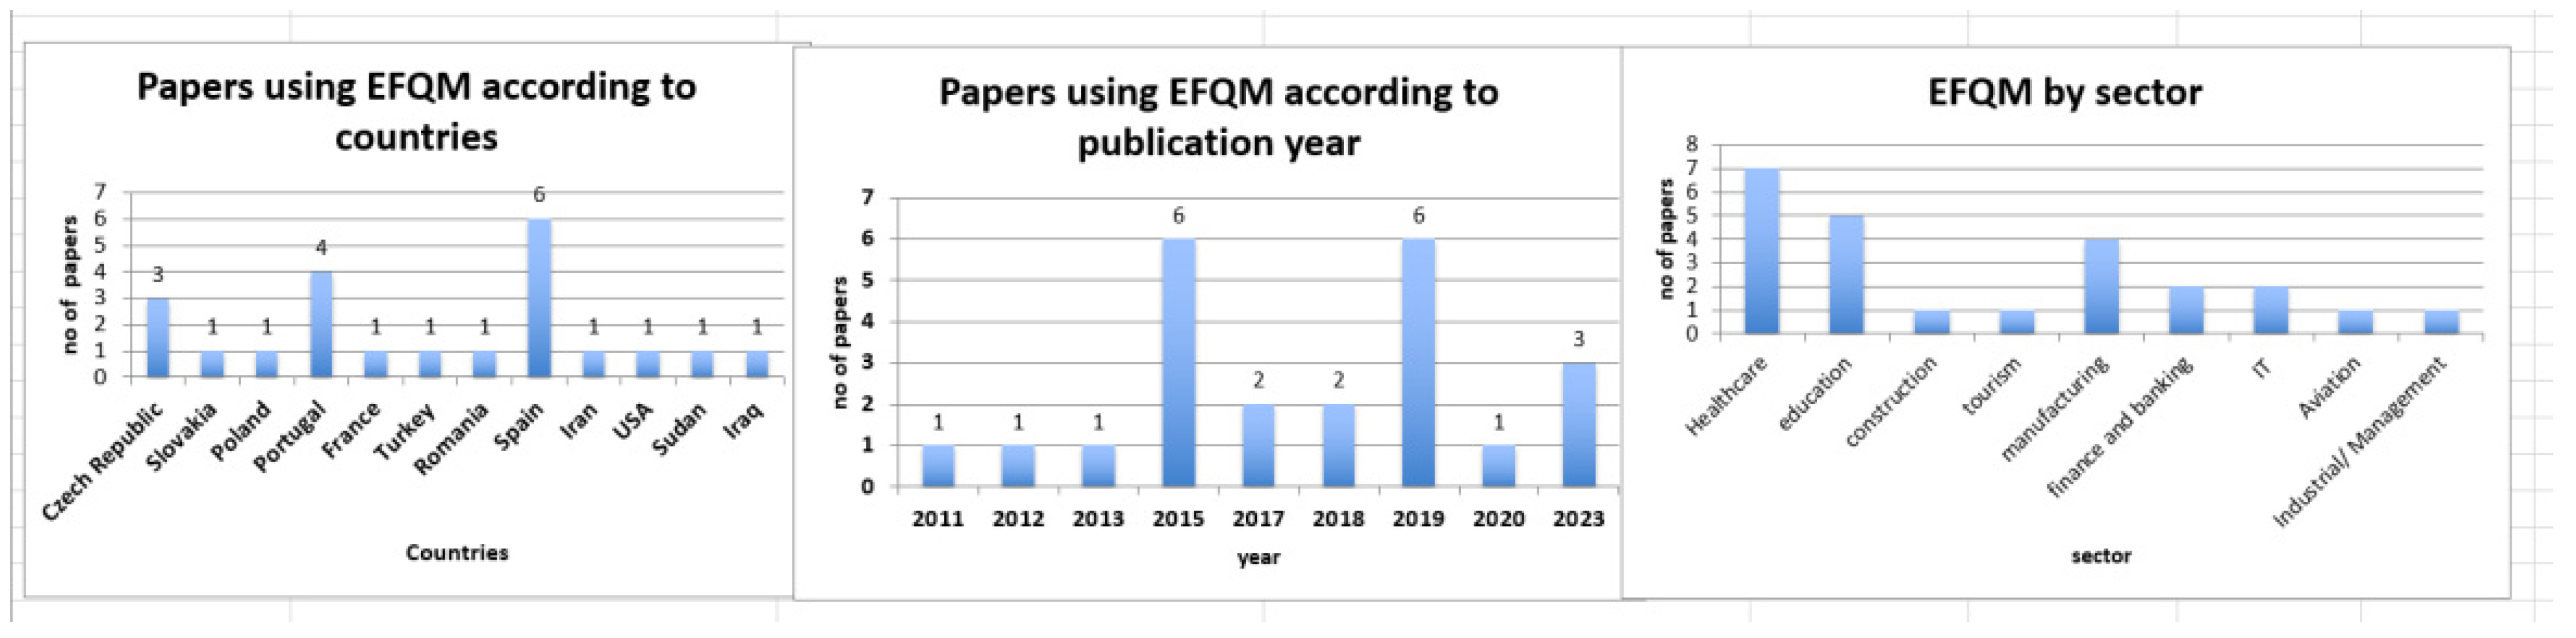
Theoretical Background

Organizations primarily focused on quality and Total Quality Management (TQM) measures to improve their operations before the emergence of business excellence models like the Malcolm Baldrige model and the European Foundation for Quality Management (EFQM) model [1]. These approaches were foundational in promoting a culture of continuous improvement and customer satisfaction. However, business excellence has become a prominent topic in the past few decades, and various models and frameworks have been developed to assess and enhance organizational performance beyond just quality [2].
Figure 1 shows the evolution of quality management concept. Quality inspection (Quality 1.0, 1900s) represented the early days of quality management and inspected finished products to identify defects. Quality was associated with the physical properties of products [3]. Quality control (Quality 1.0, 1920s) emphasized product inspection. During the production process, it introduced more systematic methods for defect identification and correction [3]. Later, quality assurance (Quality 2.0, 1950s) included both product and process quality. This stage witnessed the emergence of ISO standards, which provided guidelines for ensuring consistent quality in manufacturing and other industries. In the 1980s, Total Quality Management (TQM, Quality 3.0, 1980s) included not only product and process quality but also the entire organization’s culture and operations. It focused on customer satisfaction, continuous improvement, and employee involvement. During this era, various ISO standards were developed, and business excellence models like the EFQM gained prominence [3]. Beginning in 2017, Quality 4.0 (2017) represents the latest stage in the evolution of quality management, accompanying the fourth industrial revolution (Industry 4.0). It extends the principles of TQM to include not only product, process, and company aspects but also integrate customer and supplier needs. Quality 4.0 leverages technologies such as artificial intelligence (AI) and machine learning (ML) to improve quality management practices [4].
Quality management standards (Quality 3.0 and Quality 4.0) are integrated into organizations aiming to enhance not only their products and processes, but also their customers’ and suppliers’ satisfaction and happiness [3]. The EFQM is a business excellence model that supports the preceding goals. Therefore, it is crucial to have outstanding EFQM output scores to ensure that the organizations’ targets are achieved. This research paper introduces a novel integrated AI framework following the ISO/IEC 23053 standard to predict these EFQM output scores, hence enhancing operational excellence [5]. The AI framework gives decision makers in organizations feedback to improve their weakness points before applying for the EFQM excellence award. Therefore, the purpose of this research’s framework is to save time and cost for organizations, and provide them with great implications aiming to improve their processes and overall performance.
In the following sections, the materials and methods used in this research are discussed. This section is divided into EFQM, AI, and ISO/IEC 23053 sub-sections. Later on, the Results and Discussion Section demonstrates all results obtained from the research’s AI framework when applied to old and new EFQM score datasets as AI model training inputs. In the final section, conclusions and future work are outlined.

2. Materials and Methods
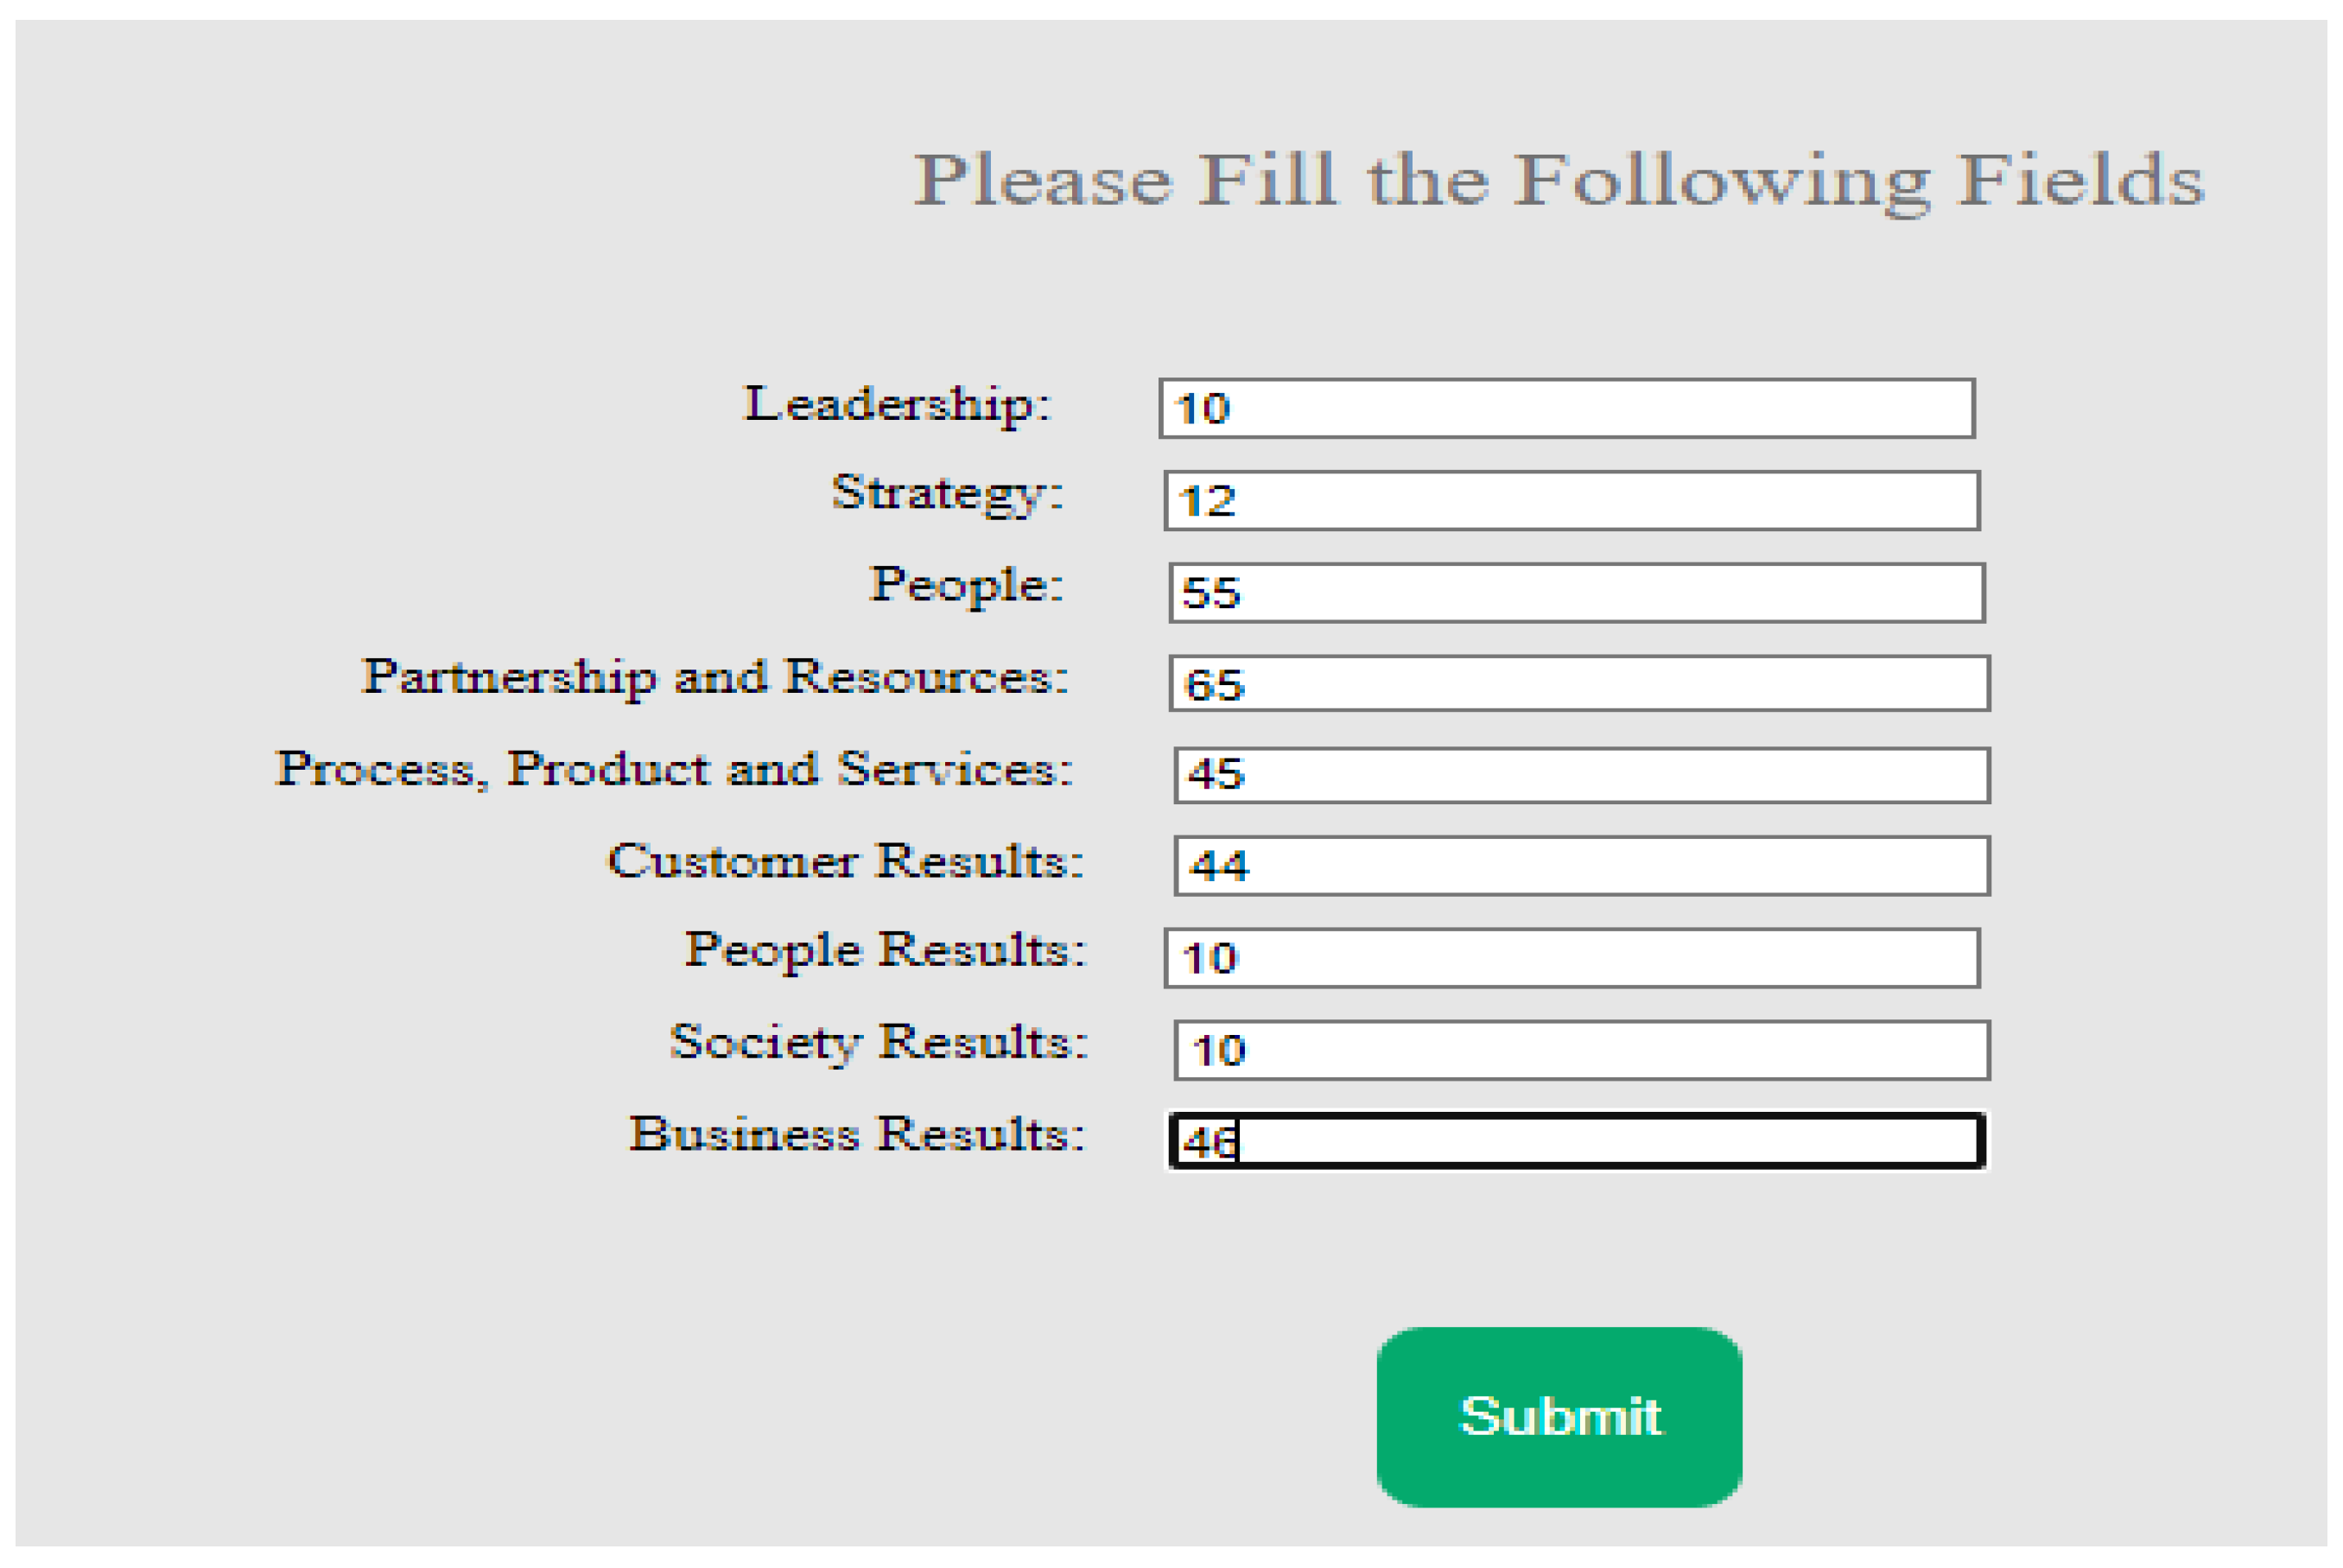
2.1. EFQM Overview

After discussing the evolution of quality in the previous section, the European Foundation for Quality Management (EFQM) is introduced. The EFQM has played a vital role in the field of business excellence and quality management [6]. The EFQM was established in 1992 in European countries as a business excellence model. It was initially created to enhance and assess quality management practices in organizations [7]. Over the years, the EFQM was updated and revised in 1999 and 2003 [8]. These updates likely reflected the evolving understanding of quality management principles and practices.
The EFQM continued changing to adapt to different business environments and management paradigms [9]. It underwent crucial modifications in 2010 and 2013 [10]. The EFQM’s influence extends far beyond Europe to be recognized and adopted not only within Europe but also in other regions of the world, including the Middle East, Asia, South America, and South Africa. This global reach is evidence of the model’s adaptability and applicability in diverse cultural and industry contexts.
The EFQM’s versatility is evident in its applications across various industries, including education [11], information technology [12], healthcare [13], and more. This adaptability reflects its effectiveness as a business excellence model with wide applicability. Applying the EFQM model has a positive effect on the sustainability of stakeholders within organizations [13]. This is in addition to the broader objective of business excellence models, which aim to drive overall organizational improvement and long-term success.
The EFQM has been adopted by numerous global organizations as a business model, related to its success and rapid evolution. Furthermore, it is recognized as a valuable framework for achieving excellence and continuous improvement.
The EFQM has evolved over the years to stay relevant and effective in supporting organizations in their excellence journey. Its global acceptance and application across a wide range of industries represent its enduring value in the field of quality management and business excellence [14].The EFQM model has experienced massive evolution, which is summarized in Figure 2.
The EFQM model appears to have incorporated additional criteria and elements to better address contemporary challenges and organizational needs, as shown in Figure 3 [15]. The criteria in this modified EFQM model from 2013 include leadership, people, strategy, partnership and resources, processes, people results, customer results, society results, and key results [16].
Learning, creativity, and innovation were added to the EFQM model, highlighting the importance of continuous learning, creativity, and innovation in achieving excellence and competitiveness in today’s dynamic business environment [16]. The inclusion of “Learning, Creativity, and Innovation” shows the recognition that organizations must adapt and innovate to stay competitive and address evolving customer and market demands. This modification goes along with the broader trends in business management, focusing on the need for organizations to be agile and forward-thinking [18].
This modified EFQM model provides a more comprehensive framework for assessing and enhancing organizational excellence, considering a wider range of factors that contribute to sustained success and innovation [19].The European Foundation for Quality Management (EFQM) is a business excellence model that considers sustainability needs of stakeholders [20]. It can be used in different sectors like education [11], information technology [12] healthcare [13,21], nursing [22], aviation [23,24], decision making [25], banking [26], public sectors [14], manufacturing [27], and construction [28].
  • The EFQM framework is made up of the following main principles, as described in [29];
  • Result orientation;
  • Customer orientation;
  • Leadership and consistency of objectives;
  • Management by processes and facts;
  • Development and involvement of people;
  • Development of partnerships;
  • Social responsibility of the organizations.
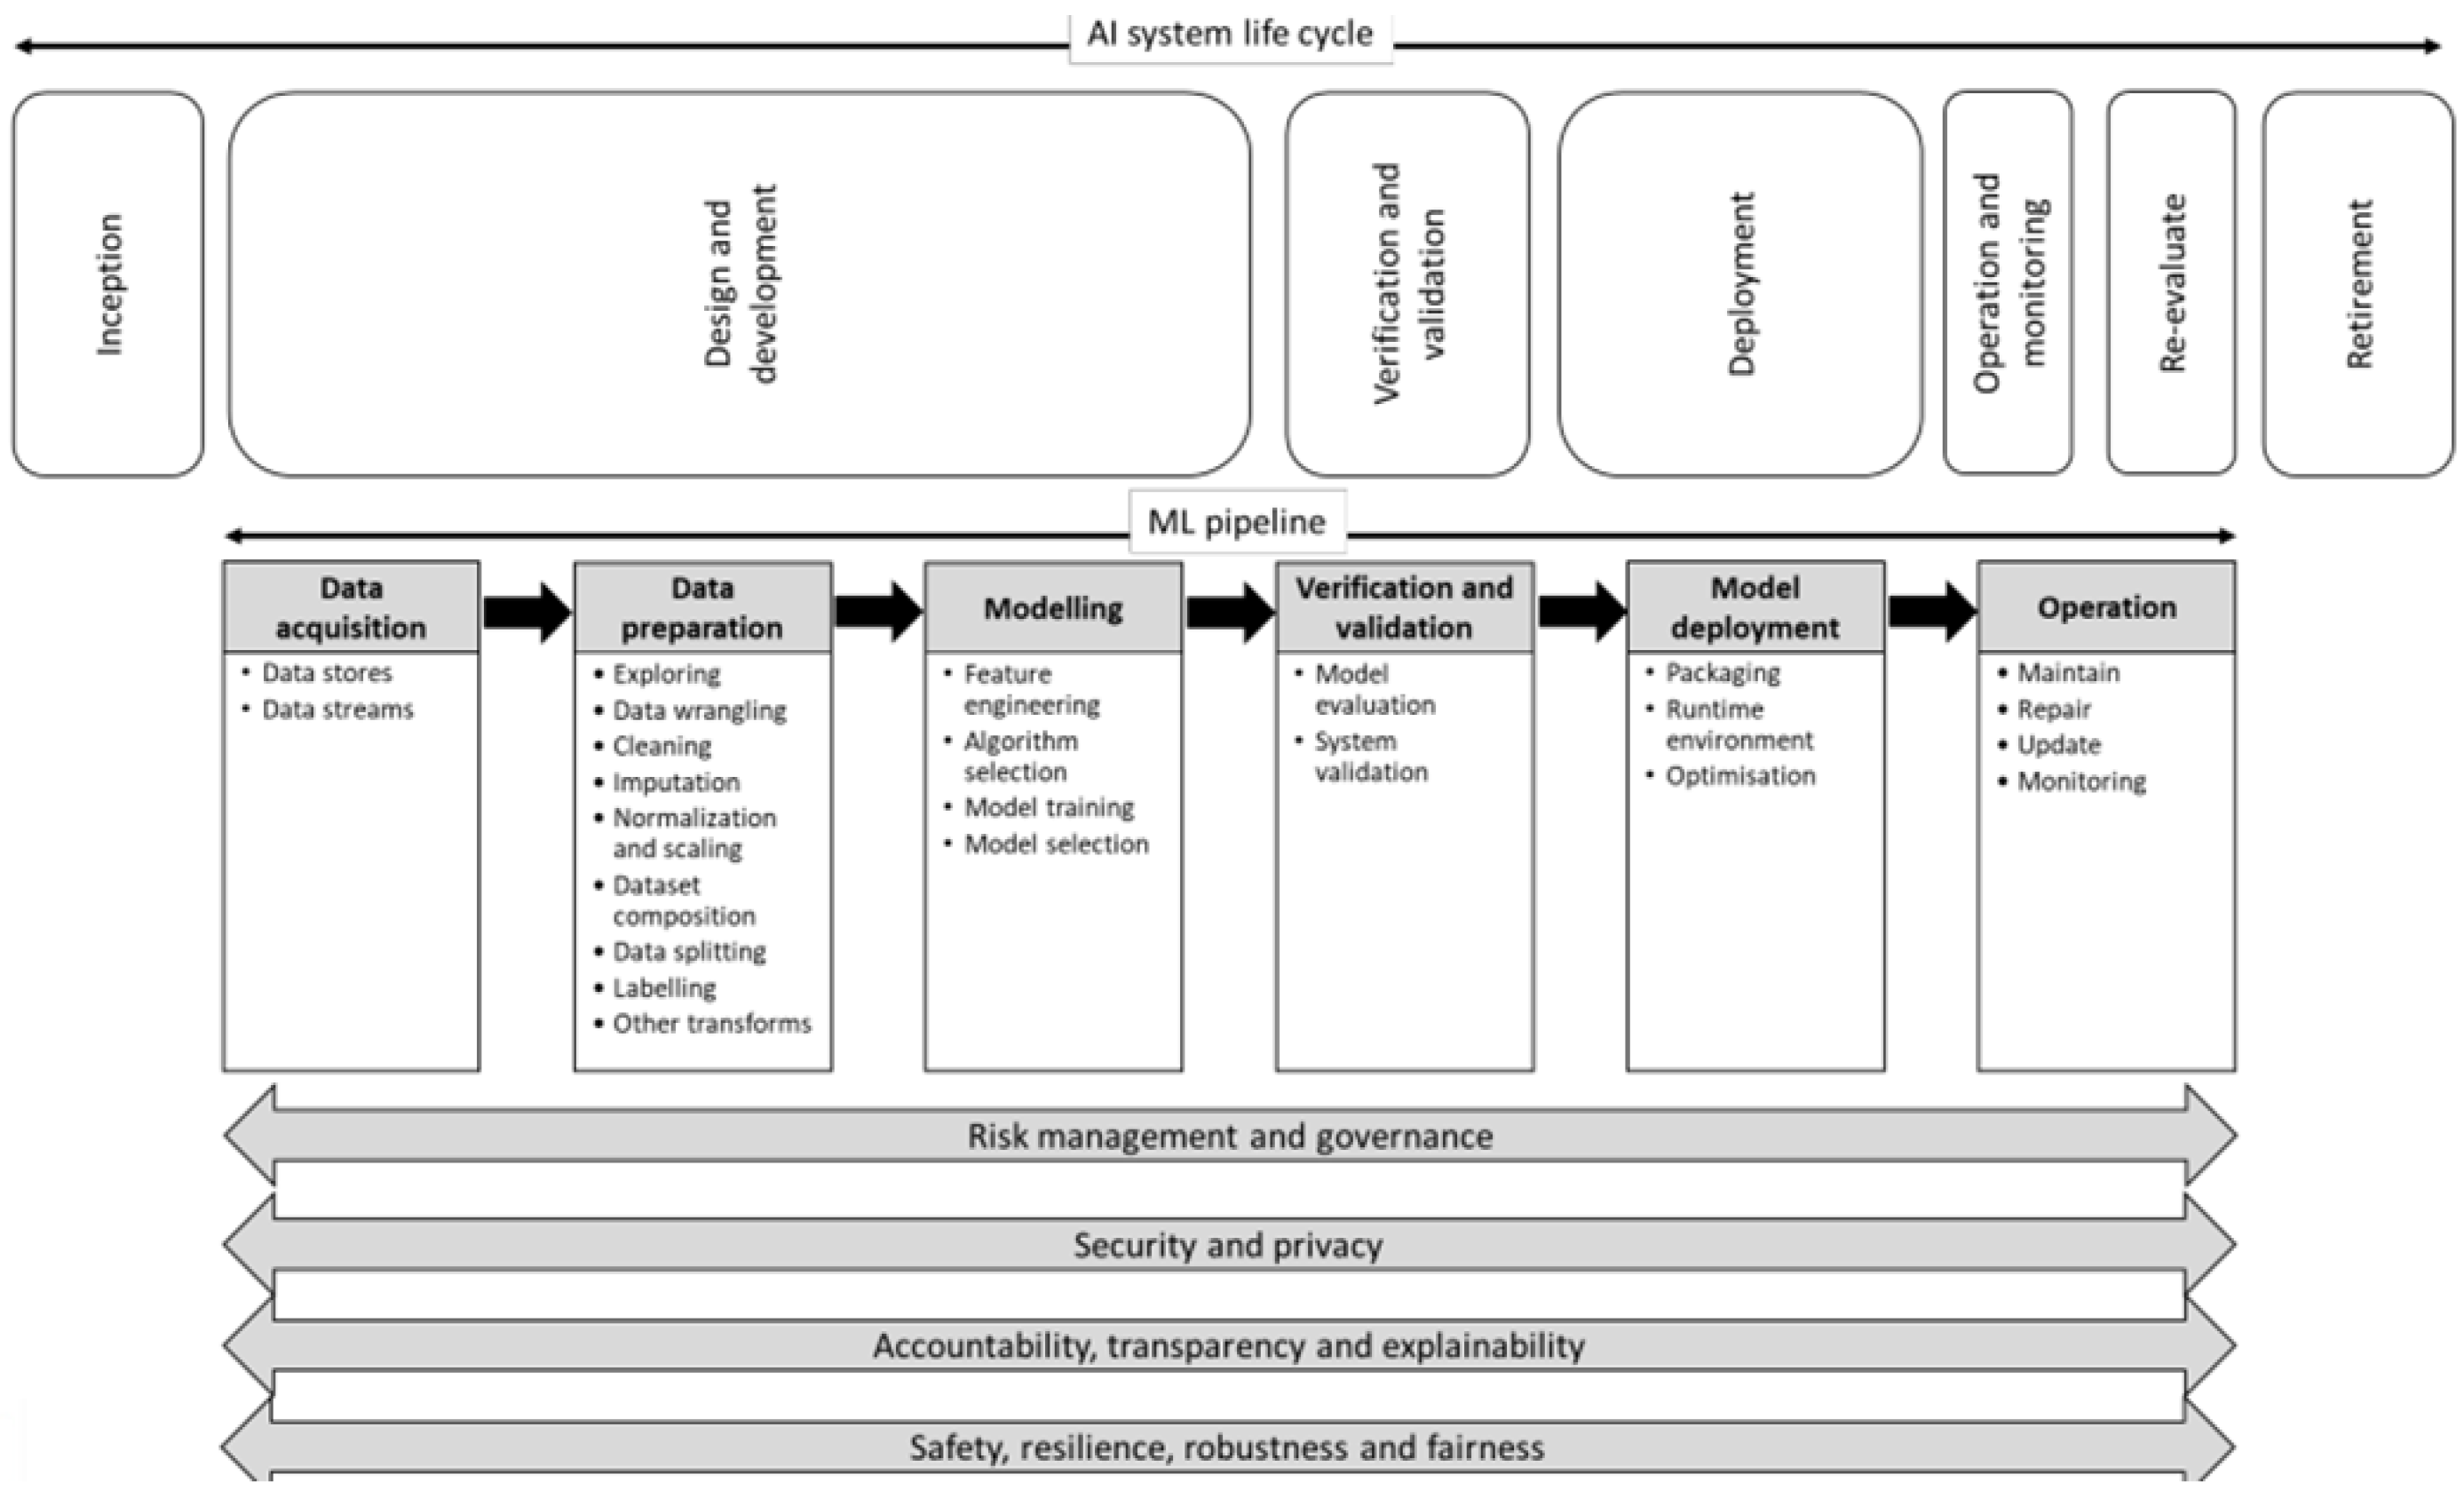
To implement these principles, we need three phases: initiation, realization, and maturity [28]. The EFQM is divided into 2 categories, which are enablers and results. Enabler criteria are responsible for key activity management. The results criteria are responsible for the way the results of an organization are achieved. These criteria include leadership, strategy, people, alliances, resources, processes, products, and services [13].
Most EFQM papers referred to in this paper originated from Spain, were published in 2015 and 2023, and were mostly applied in the healthcare and education sectors, as shown in Figure 4 [15].
After the EFQM discussion, it is clear that EFQM has nine criteria (old EFQM) and so many sub-criteria. These sub-criteria require complex calculations that make it a tedious job to calculate the EFQM output. Furthermore, registering for the EFQM award yearly without prior preparation or testing wastes the time and money of organizations. Therefore, AI implementation is suggested.

2.2. AI Overview

The second major component of this research’s framework is artificial intelligence (AI). In this section, an AI overview is covered. AI is a field of computer science and technology that emphasizes creating systems and machines that can perform jobs requiring human intelligence. These tasks include reasoning, problem-solving, learning, perception, understanding language, and decision-making [20]. AI research began in the 1950s with the target of creating machines that can mimic human intelligence. Early AI systems were rule-based and relied on explicit programming to simulate human reasoning. However, these systems did not work well in complex real-world problems. Therefore, machine learning—a subset of AI—emerged in the 1970s. It introduced a paradigm shift by emphasizing the ability of machines to learn from data and enhance their performance without being explicitly programmed.
Machine learning’s fundamental concept is to allow computers to learn and adapt from data. This is achieved through various algorithms that can specify patterns, make predictions, and make decisions relative to the data they are provided [30]. Machine learning is achieved through training on large datasets, where the machine learns the underlying patterns and relationships in the data [20]. Machine learning is widely applied in terrorism prediction [31], cancer prediction [32], and sports result prediction [33].These applications leverage the ability of machine learning algorithms to find hidden patterns and correlations in data. Machine learning techniques are classified into categories: supervised learning [34], unsupervised learning, semi-supervised learning, reinforcement learning, and deep learning, as shown in Figure 5 [30].
Recently, machine learning has spread over many applications and industries. It can be found in web searches, siri, big data [35], pricing prediction, weather prediction [36], marine work [37], aviation [38], manufacturing [39], transportation, crime prediction [40], predicting COVID-19 cases [41], and healthcare [42]. Unfortunately, few papers have talked about using AI in predicting EFQM scores. Therefore, this paper provides a framework combining AI techniques with the EFQM model. In this framework, the k-means unsupervised machine learning technique is adopted.
Artificial intelligence and machine learning are incorporated in different industries and in different countries, as Table 1 shows.
Machine learning continues to advance rapidly and has become a basic tool in various fields, including healthcare [42], finance, natural language processing, computer vision, robotics [44], decision making [25,45], human resources work [46], and autonomous systems. Its potential to extract valuable patterns from data makes it a powerful technology with a wide range of applications [47].
Unsupervised learning works by finding common input points in the data as previously trained. Clustering of inputs is a good description of this process where the inputs are correlated based on their statistical properties.
Unsupervised data learning methods do not need any labeled output to train the algorithm. They are more subjective, since humans will not interfere as in supervised learning [48]. The main objective of unsupervised learning is to learn more about data by identifying patterns found in the data. In other words, it learns an input pattern by itself and compares it with the following input patterns as shown in Figure 6.
K-means clustering is a simple and powerful unsupervised machine learning technique that works with most industries [49]. It groups similar inputs together to form meaningful clusters. Therefore, clustering is the process of dividing data into groups or clusters sharing the same characteristics and minimizing data distances within the same cluster [49].
In this research, previous old EFQM input criteria were collected and set in a dataset for AI model training. This framework uses K-means clustering (K = 2), which is an unsupervised machine learning algorithm. Output accuracy measures the number of predicted outputs matching the actual values to the total number of predicted outputs in the dataset.
a c c u r a c y = p r e d i c t e d   o u t p u t s   m a t c h i n g   a c t u a l   t o t a l   n u m b e r   o f   p r e d i c t i o n s 100
The old EFQM final scores are calculated using the following equation:
O l d   E F Q M   F i n a l   s c o r e = i = 1 7 x ( i ) + ( 1.5 ) i = 8 9 x ( i )
where x is the old EFQM input criteria and i = input index.
x(1) = Leadership input, x(2) = Strategy, x(3) = People, x(4) = Partnership and Resources, x(5) = Process, Product, and Services, x(6) = People Results, x(7)= Society Results, x(8) = Customer Results, and x(9) = Business Results.
After studying output accuracy for different AI models, K-means clustering (k = 2) was selected for use in this research paper. Table 2 shows the output accuracy for different AI models used along with the hyperparameters used for each model. Therefore, K-means clustering gave the best accuracy. In this research paper, K-means clustering (k = 2), which is an unsupervised machine learning technique, is applied, and accuracy values are calculated.
Figure 7 shows the elbow chart simulated from Google Colab when the old EFQM model was used. The best number of clusters should be chosen just when the graph starts changing slope. Therefore, the best number of clusters k for this dataset is between 2 and just when the curve starts bending. However, Figure 8 shows the accuracy to be 86.73 (k = 2).
The framework of this research paper takes the EFQM results from an organization (196-row dataset) and injects it with k-means unsupervised machine learning to predict operational excellence. The k-value used was 2 due to accuracy problems. To better evaluate K-means clustering performance, the Rand Index adjusted for chance was used.
The Adjusted Rand Index (ARI) is a measure of the similarity between two clustering results, taking into account chance. It adjusts the Rand Index to account for the expected similarity between random clusters by considering all pairs of samples and counting pairs that are assigned in the same or different clusters in the predicted and true clusters.
The Random Index (RI) score is adjusted for chance, resulting in the Adjusted RI (ARI) score which is calculated using the equation below:
A R I = R I E x p e x t e d _ R I max ( R I ) E x p e c t e d _ R I
When the labeling is independent of the number of clusters and samples, the ARI can still be sensitive to the similarity between the two clusters. If the clusters are completely random or unrelated, the ARI would be close to 0. On the other hand, if the clusters are identical, the ARI would be 1.
ARI (old EFQM) = 0.85 for K = 2
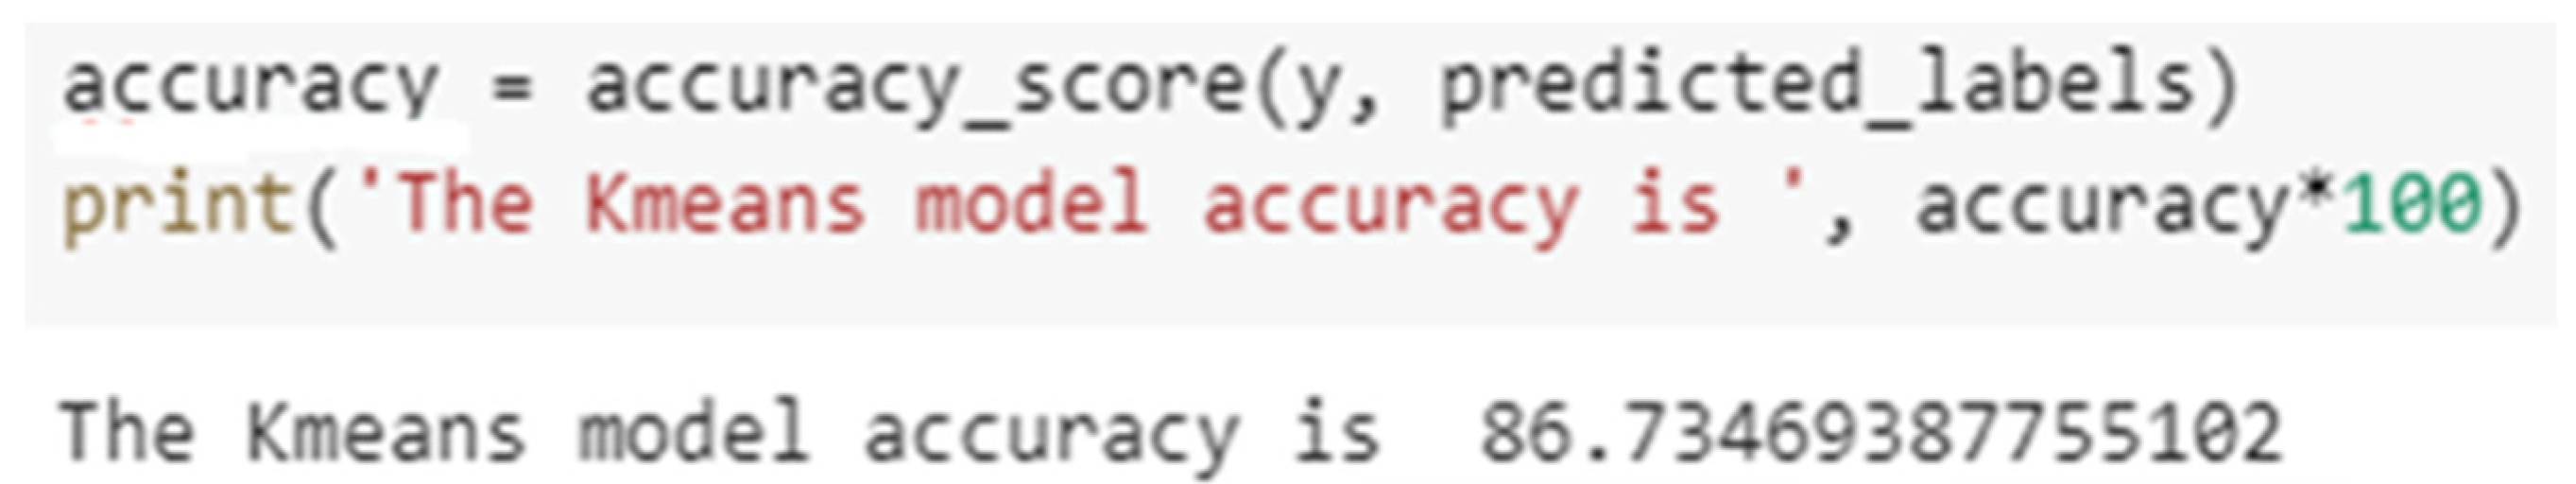
 ARI = (new EFQM) = 0.62 K = 3
Integrating AI into business excellence models represents a crucial need in academia and the marketplace. This integrated framework has the potential to drive efficiency, cost savings, innovation, and competitive benefits for organizations, making it a valuable area of study and application. Therefore, machine learning solved the basic problems of time and money consumption.

2.3. ISO/IEC 23053 Overview

After applying AI in many industries like medicine to predict breast cancer [50], in dental education [51], and its massive use during the COVID-19 pandemic, the crucial need for AI to be ISO-certified arose.
Therefore, the ISO/IEC 23053 standard for AI has emerged to fulfill the necessity of standardization and to regulate and certify AI techniques. This section addresses ISO/IEC 23053 and its application in the research’s framework.
The International Organization for Standardization (ISO), an independent, nongovernmental international organization, has begun to develop standards around AI along with the International Electrotechnical Commission (IEC) through Subcommittee 42 of the two organizations’ Joint Technical Committee (JTC) 1. The ISO/IEC JTC 1/SC 42 [5] process is in its early stages and has produced a number of drafts currently being developed in committees around AI topics, including ISO/IEC WD 22989 [52]:artificial intelligence concepts and terminology, and ISO/IEC WD 23053: framework for artificial intelligence (AI) systems using machine learning (ML). This ISO framework is built on previous ISO standards such as ISO/IEC 22989. It digs deeper into machine learning. It also reshapes AI-related concepts into a framework and explains how machine learning algorithms are developed. This standard is widely used among experts and non-practitioners. This standard has many advantages:
  • It makes more advanced use of AI [53];
  • Machine learning features like accuracy and explainability are interpreted and set in an international frame [54];
  • It gives AI standardization for policing software explored [55].
Therefore, ISO/IEC 23053 emerged to provide standardization for machine learning AI. The ISO/IEC 23053 includes the following stages: task (problem definition), model, data, software tools and techniques [52]. Moreover, ISO/IEC 23053 designed the machine learning framework consisting of an AI system life cycle and machine learning pipeline as shown in Figure 9. The ISO/IEC 23053 standard adds regulations to the properties of AI like risk management, security, explainability, and fairness [52].
AI has been adopted worldwide and in various industries like health [56], manufacturing [57], and marketing [43]. It proved valuable during the COVID-19 pandemic. The emergence of ISO/IEC 23053 is indeed significant, as it provides a standardized framework for AI, which is crucial for ensuring the responsible and effective use of AI technologies. ISO/IEC 23053 also introduces a machine learning framework that includes the AI system life cycle and machine learning pipeline. This framework will likely help decision makers in organizations to structure their AI projects and ensures that they follow a systematic approach from problem definition to deployment.
Figure 9 consists of the AI life cycle and machine learning ML pipeline as described by the new ISO/IEC 23053 standard. This standard adds some properties and regulations to AI concerning risk management, governance, security, privacy, accountability, transparency, explainability, safety, resilience, robustness, and fairness. Figure 9 shows that the AI life cycle is made up of seven stages, which are inception, design and development, verification and validation, deployment, operation and monitoring, re-evaluation, and retirement. These stages are mapped into the ML pipeline cycle in this paper’s research framework [58].
Figure 9. ISO/IEC 23053 AI life cycle [59].
Applsci 14 02569 g009
ISO/IEC 23053 includes several important aspects that should be considered throughout the AI life cycle and ML pipeline, like risk management, governance, security, privacy, accountability, transparency, explainability, safety, resilience, robustness, and fairness [50]. These aspects are crucial for responsible and ethical AI development and deployment.
ISO/IEC 23053 seeks to promote responsible and ethical AI development and deployment [10]. This standardization effort helps establish a common framework for AI development that can be adopted by organizations and industries to ensure the reliability, safety, and fairness of AI systems [60].
After reviewing the literature papers about business excellence models (EFQM), artificial intelligence, and machine learning, gaps are introduced. The main gap lies in integrating artificial intelligence into the EFQM business excellence model to enhance operational excellence. Few papers were found studying the effect of artificial intelligence on operational excellence. Some papers mentioned the effect of AI on economy and marketing. Dirican C. outlines the effects of artificial intelligence on business and economy. He also mentioned human replacement by robots. The AI invasion will result in a higher rate of unemployment, which will affect the economy [61]. So, this research paper’s framework has the following advantages:
  • Enriches the knowledge body by injecting AI into a business excellence model (EFQM);
  • Enhances operational excellence;
  • Can be applied to any sector worldwide;
  • Saves time and money before applying for the EFQM excellence award.
After presenting an overview on EFQM, AI, and ISO/IEC 23053, the research methodology adopted in this research is discussed.

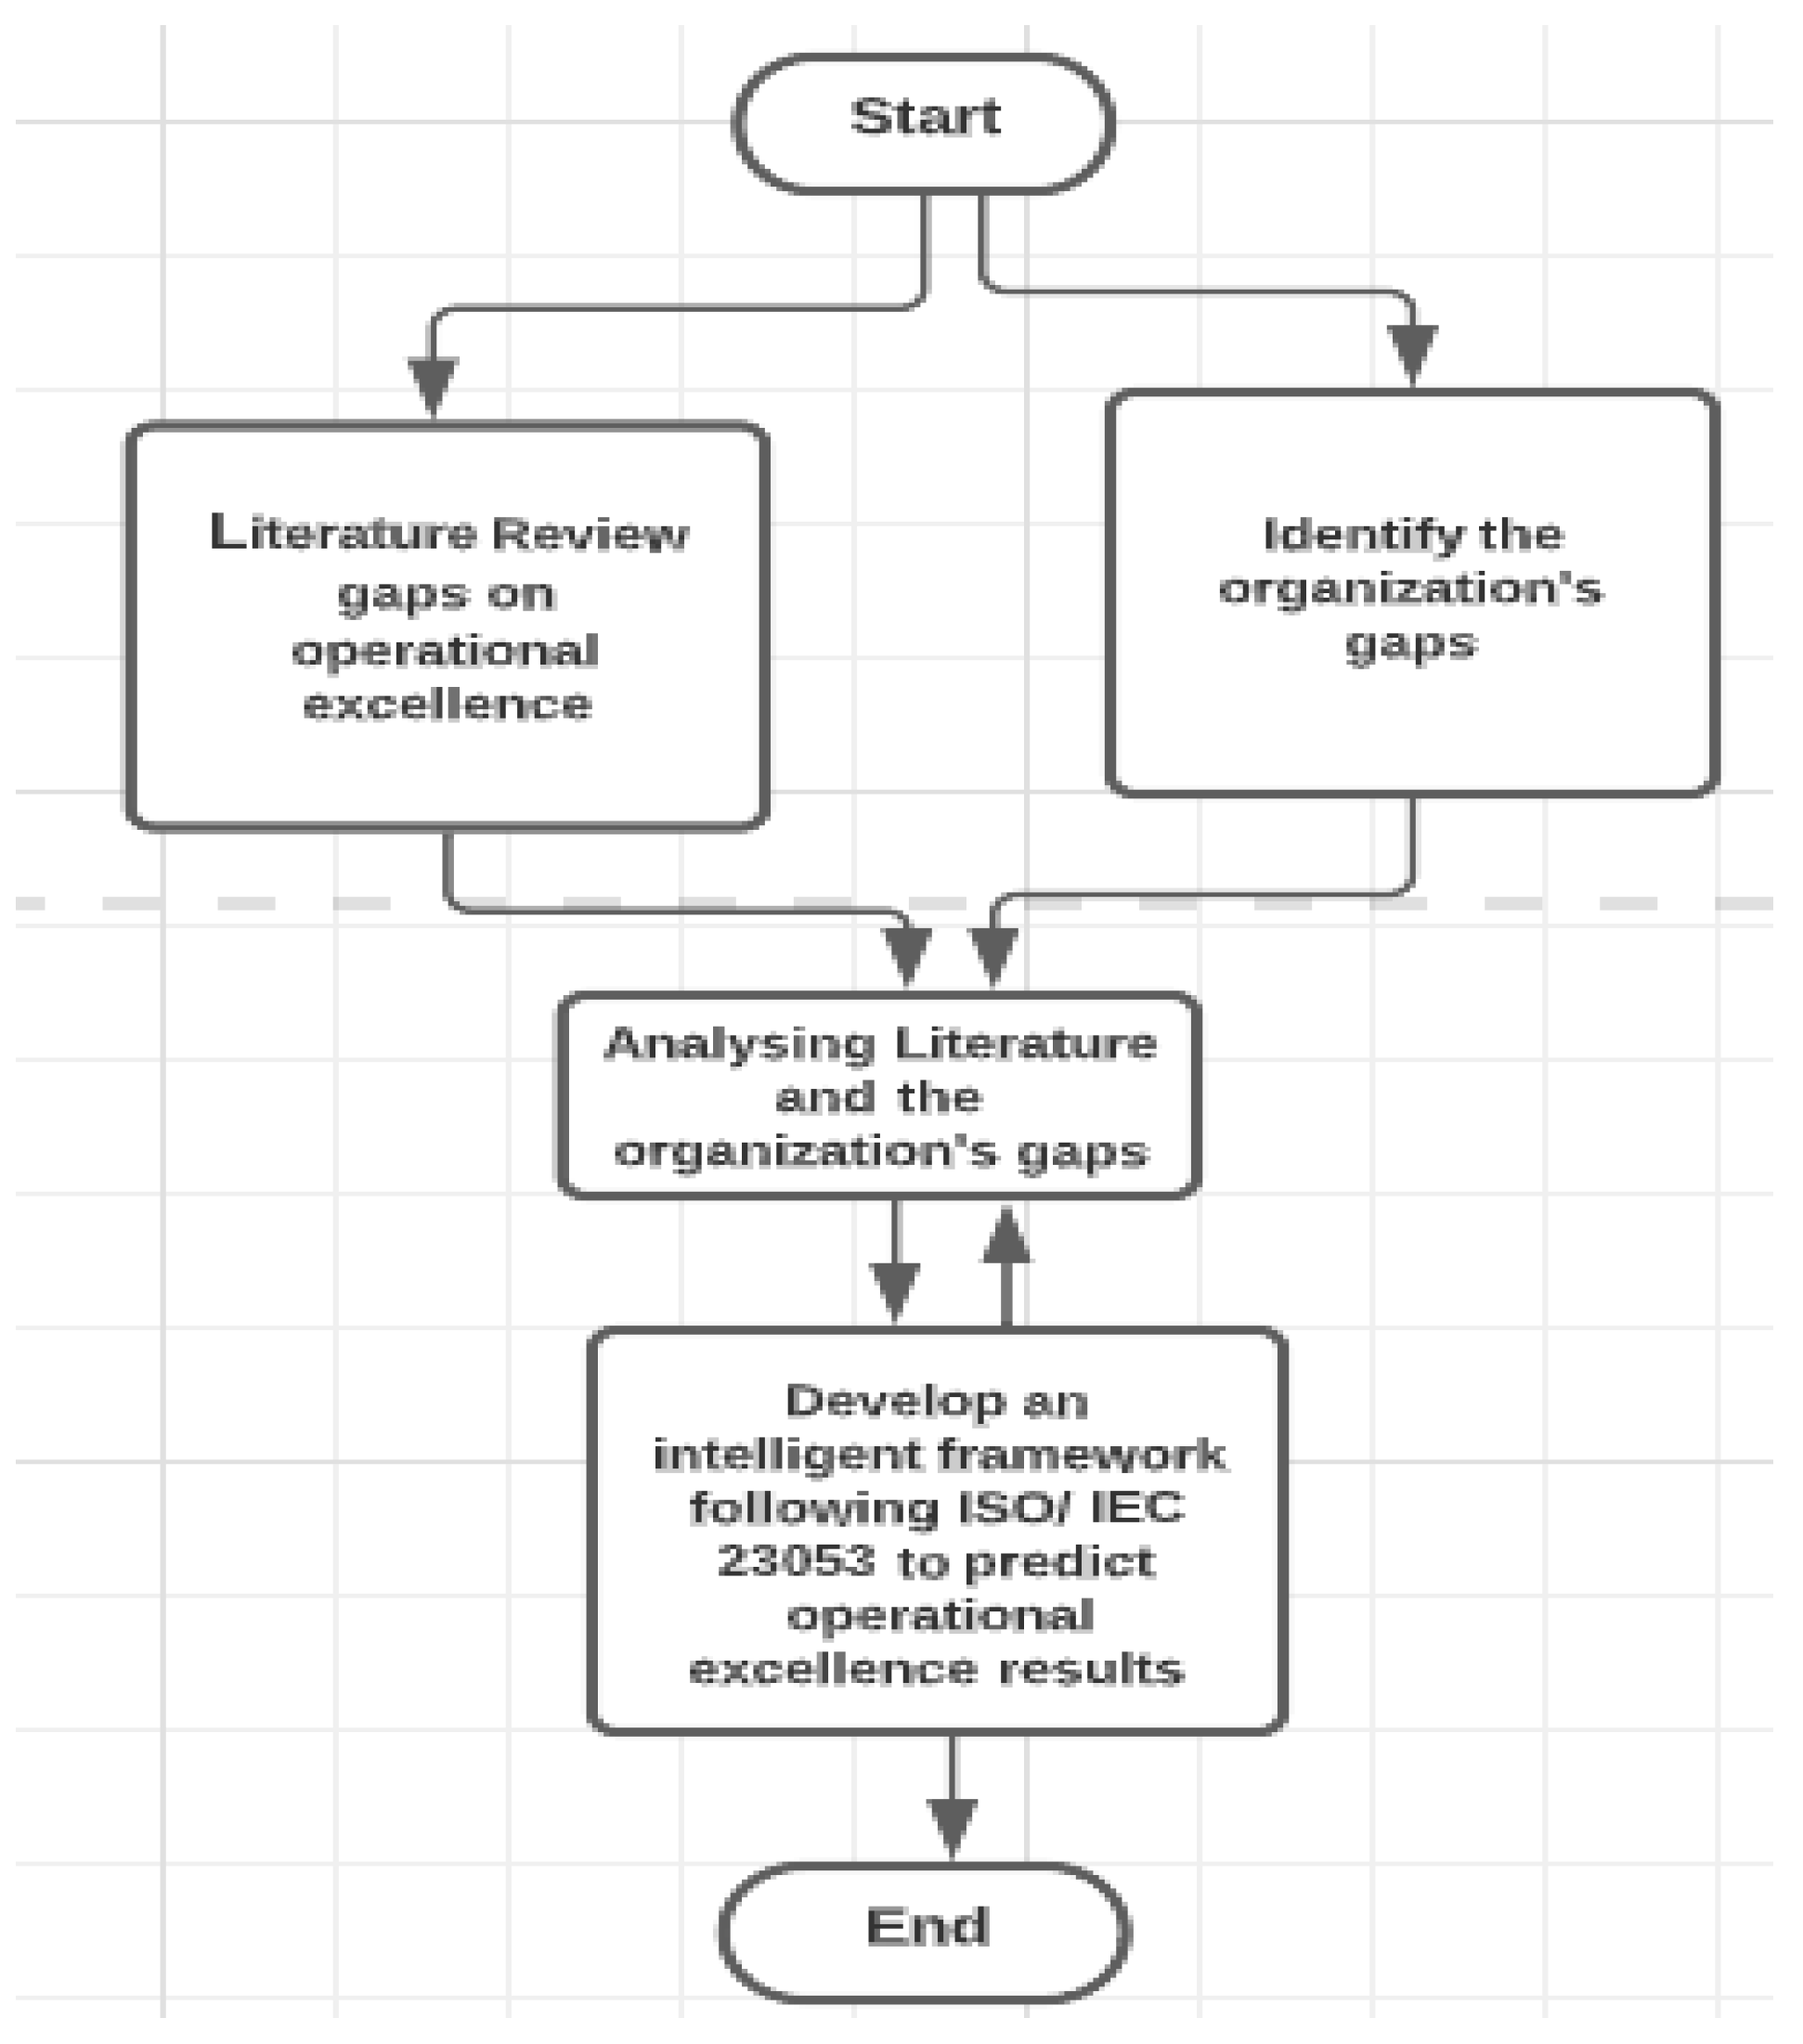
2.4. Research Methodology

AI is injected into the business excellence model (EFQM) to predict future EFQM results. This integrated framework enhances operational excellence in public and private organizations.
EFQM scores were collected and arranged into datasets. These datasets were used as the input of an AI framework (using k-means clustering where k = 2). The AI model used follows the ISO/IEC 23053 standard. Using this framework contributes to the knowledge body and enhances the operational excellence in any organization.
After preparing the datasets, python was used to train, test, and validate the predicted EFQM score results, and then accuracy scores were calculated for the k-means clustering used. Figure 10 shows the three major components of the research’s framework.
The design science research methodology is the methodology used in this paper research. Wieringa explained design science methodology as the creation and search for artifacts in context. Artifacts communicate with any difficulties found in the context or overall environment to ensure continuous improvement [62]. The two types of research problems in design science are design problems and knowledge questions.
Design problem research aims to create an artifact that will improve a problem context, taking into account stakeholder goals. Multiple solutions for a specific design research problem are possible and the effectiveness of these solutions is evaluated with respect to stakeholder goals. Knowledge question research attempts to answer an analytical or empirical knowledge question about an artifact without necessarily changing the artifact itself. Knowledge questions can have multiple answers and involve a level of uncertainty. The answers to a knowledge question have to be evaluated by truth, which is independent from the stakeholders’ goals [62]. Analytical knowledge questions are answered by analyzing concepts, while empirical knowledge questions are answered by collecting and analyzing data [63].
The framework of the design science research methodology is represented in Figure 11 [62]. As shown, the design science framework includes a social context, which consists of stakeholders such as users and operators. In this paper, the social context is any organization following the EFQM scoring standard. The goals are set based on stakeholder (any government/private entity) requirements and the outcome of the research is consequently used by the stakeholders. The framework also includes the knowledge context consisting of the current knowledge of the design, specifications, and practical experience. This knowledge context is used as an input for the design research on existing designs or existing answers to knowledge questions. An example is the input of operational excellence given by any organization to predict future results using AI techniques. The results of the design may enrich the knowledge context with new answers, new problem-solving knowledge, and new designs. In this research, this is shown in the output of the AI-predicted results. The following Figure 11 shows the design science methodology framework in general and Figure 12 shows the design science methodology as it is applied in this research. Figure 13 shows the research methodology flowchart.

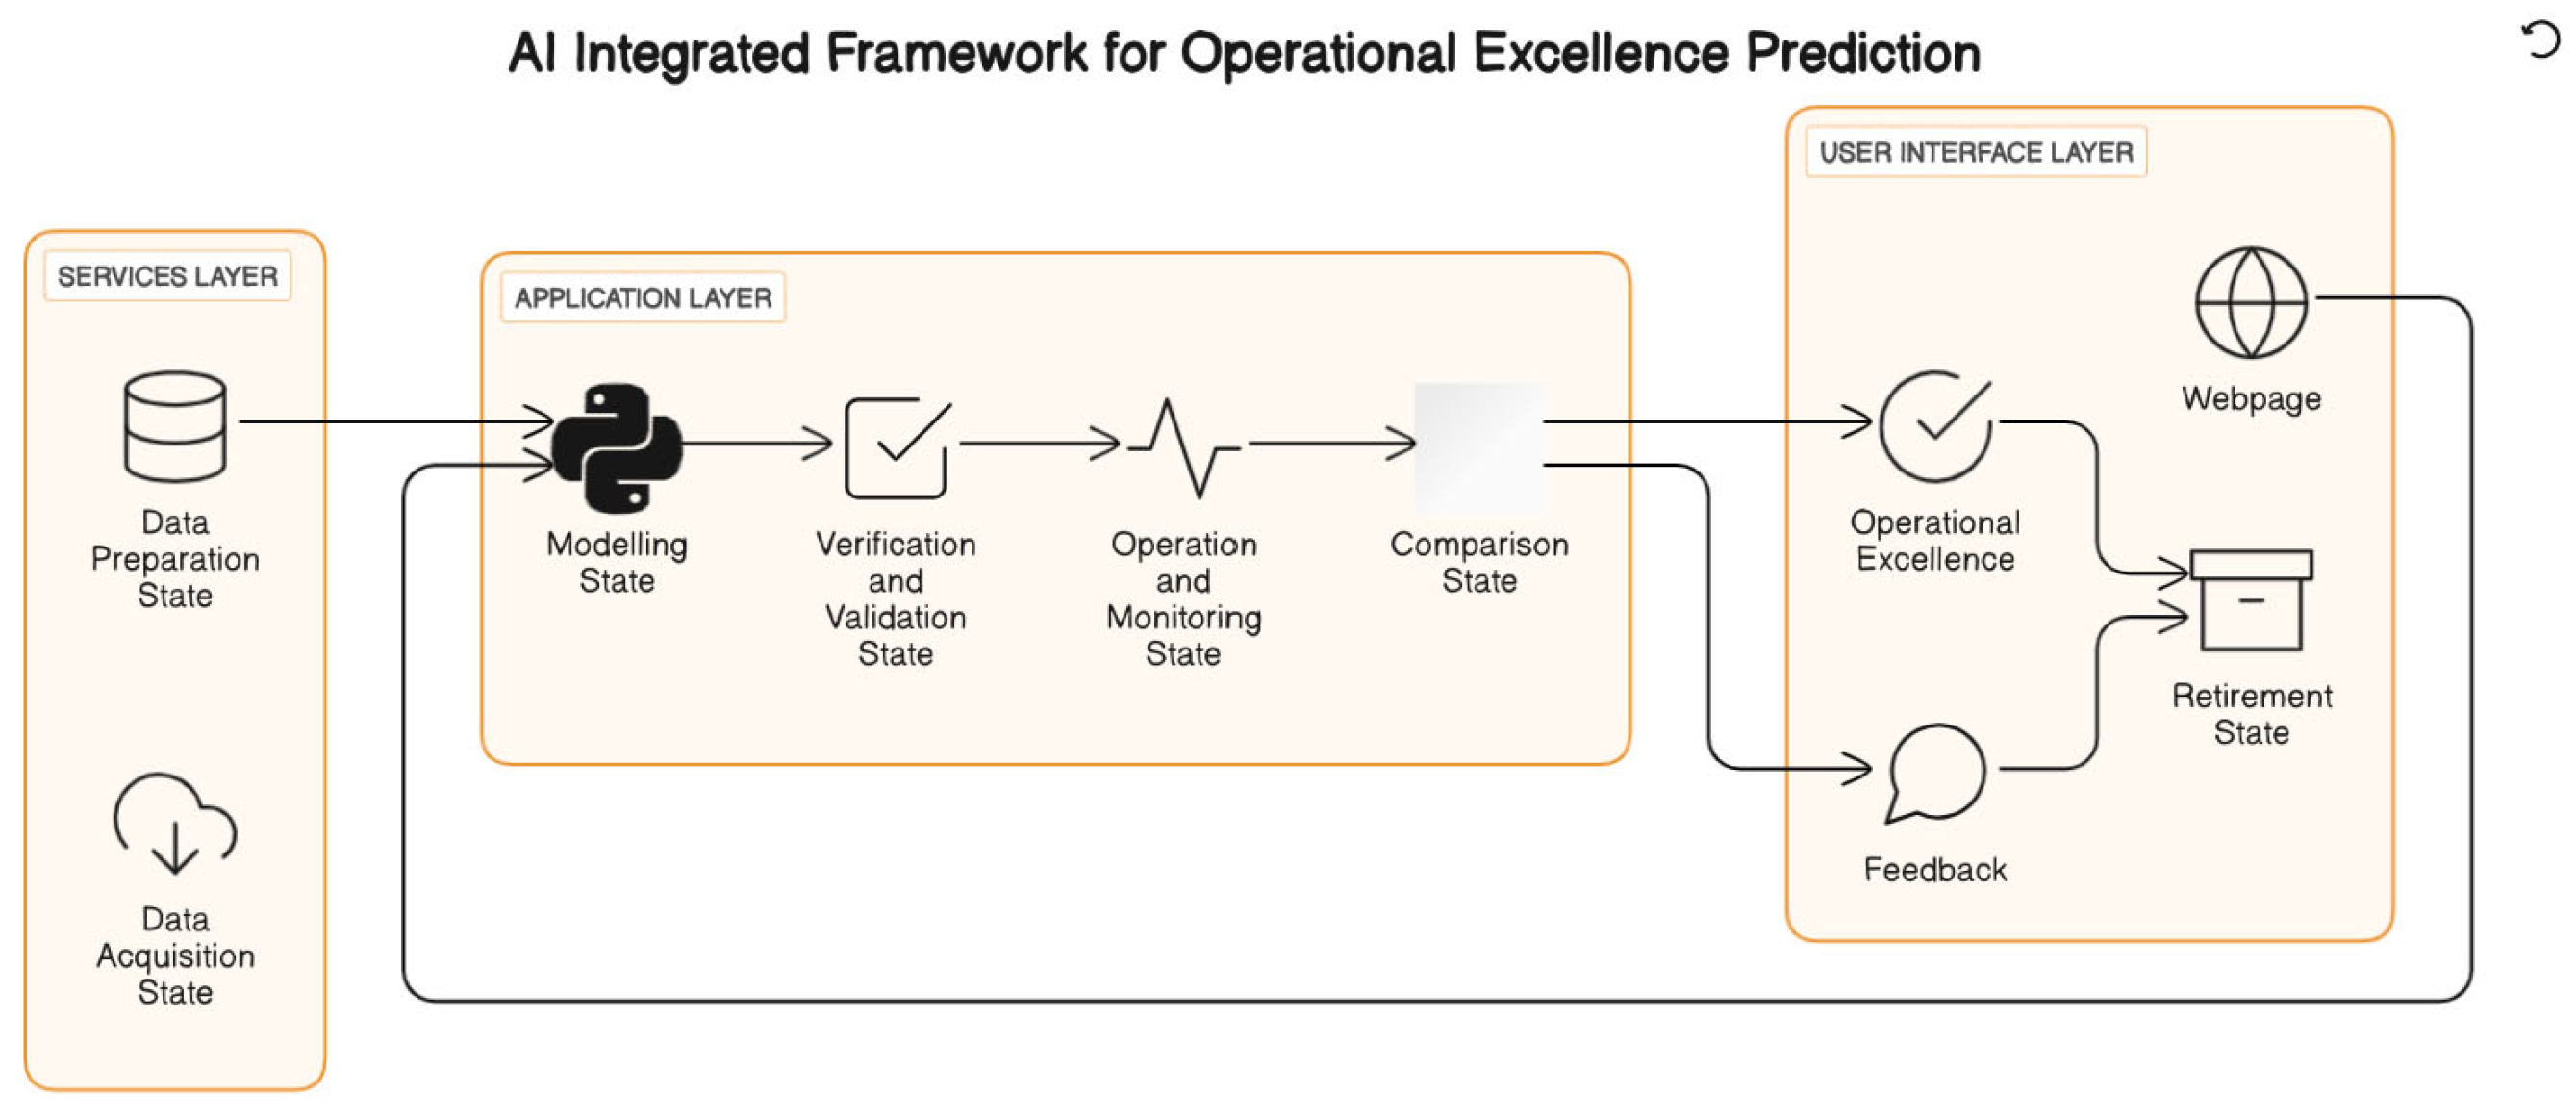
2.5. The Integrated AI Framework

Following all previous sections, we present the integrated AI framework of this research. Figure 14 shows the system architecture diagram with a user interface layer, application logic layer, and technical services layer to represent a framework integrating operational excellence following the EFQM model into artificial intelligence following the ISO/IEC 23053 standard. It represents the integration of AI with the EFQM to achieve operational excellence. This framework also follows the ISO/IEC 23053 standard in its stages. It starts with the data acquisition state, data preparation, modelling, verification and validation, operation and monitoring, comparison, feedback, and retirement states. Each of these stages is fully discussed in Figure 15, Figure 16 and Figure 17.
Anaconda software 2.5.0 is used to run the python code. The k-means clustering technique used in the framework applies the ISO/IEC 23053 standard as follows: in the data acquisition state, data are collected and cleaned, while the design and development modelling stage in the ML life cycle refers to the modelling phase of the above framework. Data in this stage are trained.
The verification and validation phase of the AI life cycle is applied to test and validate the data. In the model deployment phase, the unsupervised ML k-means clustering is applied where k = 2. Accuracy results are calculated to validate results. K-means clustering follows the ISO/IEC 23053 standard in the model deployment phase. In the operation phase, the accuracy of the AI system is monitored and the final score is returned. Two outputs may result: either “High” or “Low”. If the output is “High”, then operational excellence is achieved where the AI model is in the retirement phase; otherwise the output will be “Low”, and then the AI model is in the re-evaluation phase. When the output is low, the framework searches for the lowest score criteria in the comparison state and returns the inputs with the same lowest score. In the feedback state, the AI framework gives suggestions to improve the organization’s weakness points. Now, the framework moves into the termination state. Decision makers can inject input scores again into the framework until the output is high and operational excellence is achieved.
Despite all the benefits of AI, however, it faces certain ethical, moral, social, and security obstacles [64]. Therefore, the ISO developed standards to maintain the healthy development of AI [65]. AI drawbacks can affect human privacy and development [65]. A solution to this problem may be the integration of ISO 26000 [65] at early stages of an AI system. In the above framework, social responsibility is shown when social results are measured and evaluated. Some suggestions are given to improve social results, such as enhancing social perceptions and performance indicators. Furthermore, AI has shown reproducibility, selecting, and reporting biases [66]. AI systems can misbehave in cases of unreliable data, making them unsafe and untrustworthy [59]. ISO 24028 is also used to ensure AI trustworthiness [66].

3. Results and Discussions

3.1. Old EFQM Model Results

In this section, the EFQM is embedded in an AI framework to predict future operational excellence final scores. The training database consists of 196 rows containing nine EFQM input dimensions for the framework. This framework takes these EFQM input dimensions from decision makers in an organization and predicts the total EFQM score as either “High” or “Low”. Organizations with low outputs will try to enhance their scores by enhancing the lowest EFQM inputs until the organizations reach a “High” final scoring, achieving operational excellence. Previous old EFQM input criteria were collected and set in a database for AI model training. This framework uses K-means clustering (K = 2), which is an unsupervised machine learning algorithm. Output accuracy measures the output given in the prepared dataset with the output predicted by the AI framework.
Figure 18 shows the descriptive statistics generated by SPSS software v27 to calculate the row count, minimum, maximum, mean, and standard deviation of the dataset used. This dataset has 196 rows using the old EFQM.
Figure 19 shows the SPSS correlation results of the old EFQM’s dimensions and total score. It is noted that the “People Results” and “Society Results” dimensions are the most correlated to the final total score. However, the “Partnership Resources” dimension has the least effect on the final score.
Figure 20 is a Google Colab heat map simulation showing the same results. The highest correlation is between the “Society Results” dimension and the “People Results” and “Customer Results” dimensions with values of 0.6 and 0.5, respectively.
The algorithm is implemented via Google Colab, which is used to design a code to train, test, and predict operational excellence given a dataset. First, libraries are defined. Then, the 196row database is imported and read. After the code is run, a link will appear for decision makers to use which will forward them into a new tab where they will be asked to train and then test the model. The output is classified as “High” if the final score is greater than or equal to 500; otherwise, it is “Low”. The algorithm generates a graphical user interface webpage to train and then test the data as shown in Figure 21.
First, data are trained using the imported dataset with k-value = 2 as Figure 21 and Figure 22 show. Then, the decision makers need to test the model by importing the input EFQM dimensions’ criteria. Final scores are predicted and a message showing either “High” or “Low” is generated. If the result is “high”, the webpage shows a message that you reached operational excellence, as shown in Figure 23; otherwise, it returns the inputs with the lowest score and gives suggestions to decision makers to improve their final score, as shown in Figure 24.
Next, the case of having more than two dimensions with the same lowest input score is studied, and is shown in Figure 25 and Figure 26.Leadership, people results, and society results have the same lowest input score = 10. The output returns the lowest three dimensions with recommendations for each to improve.

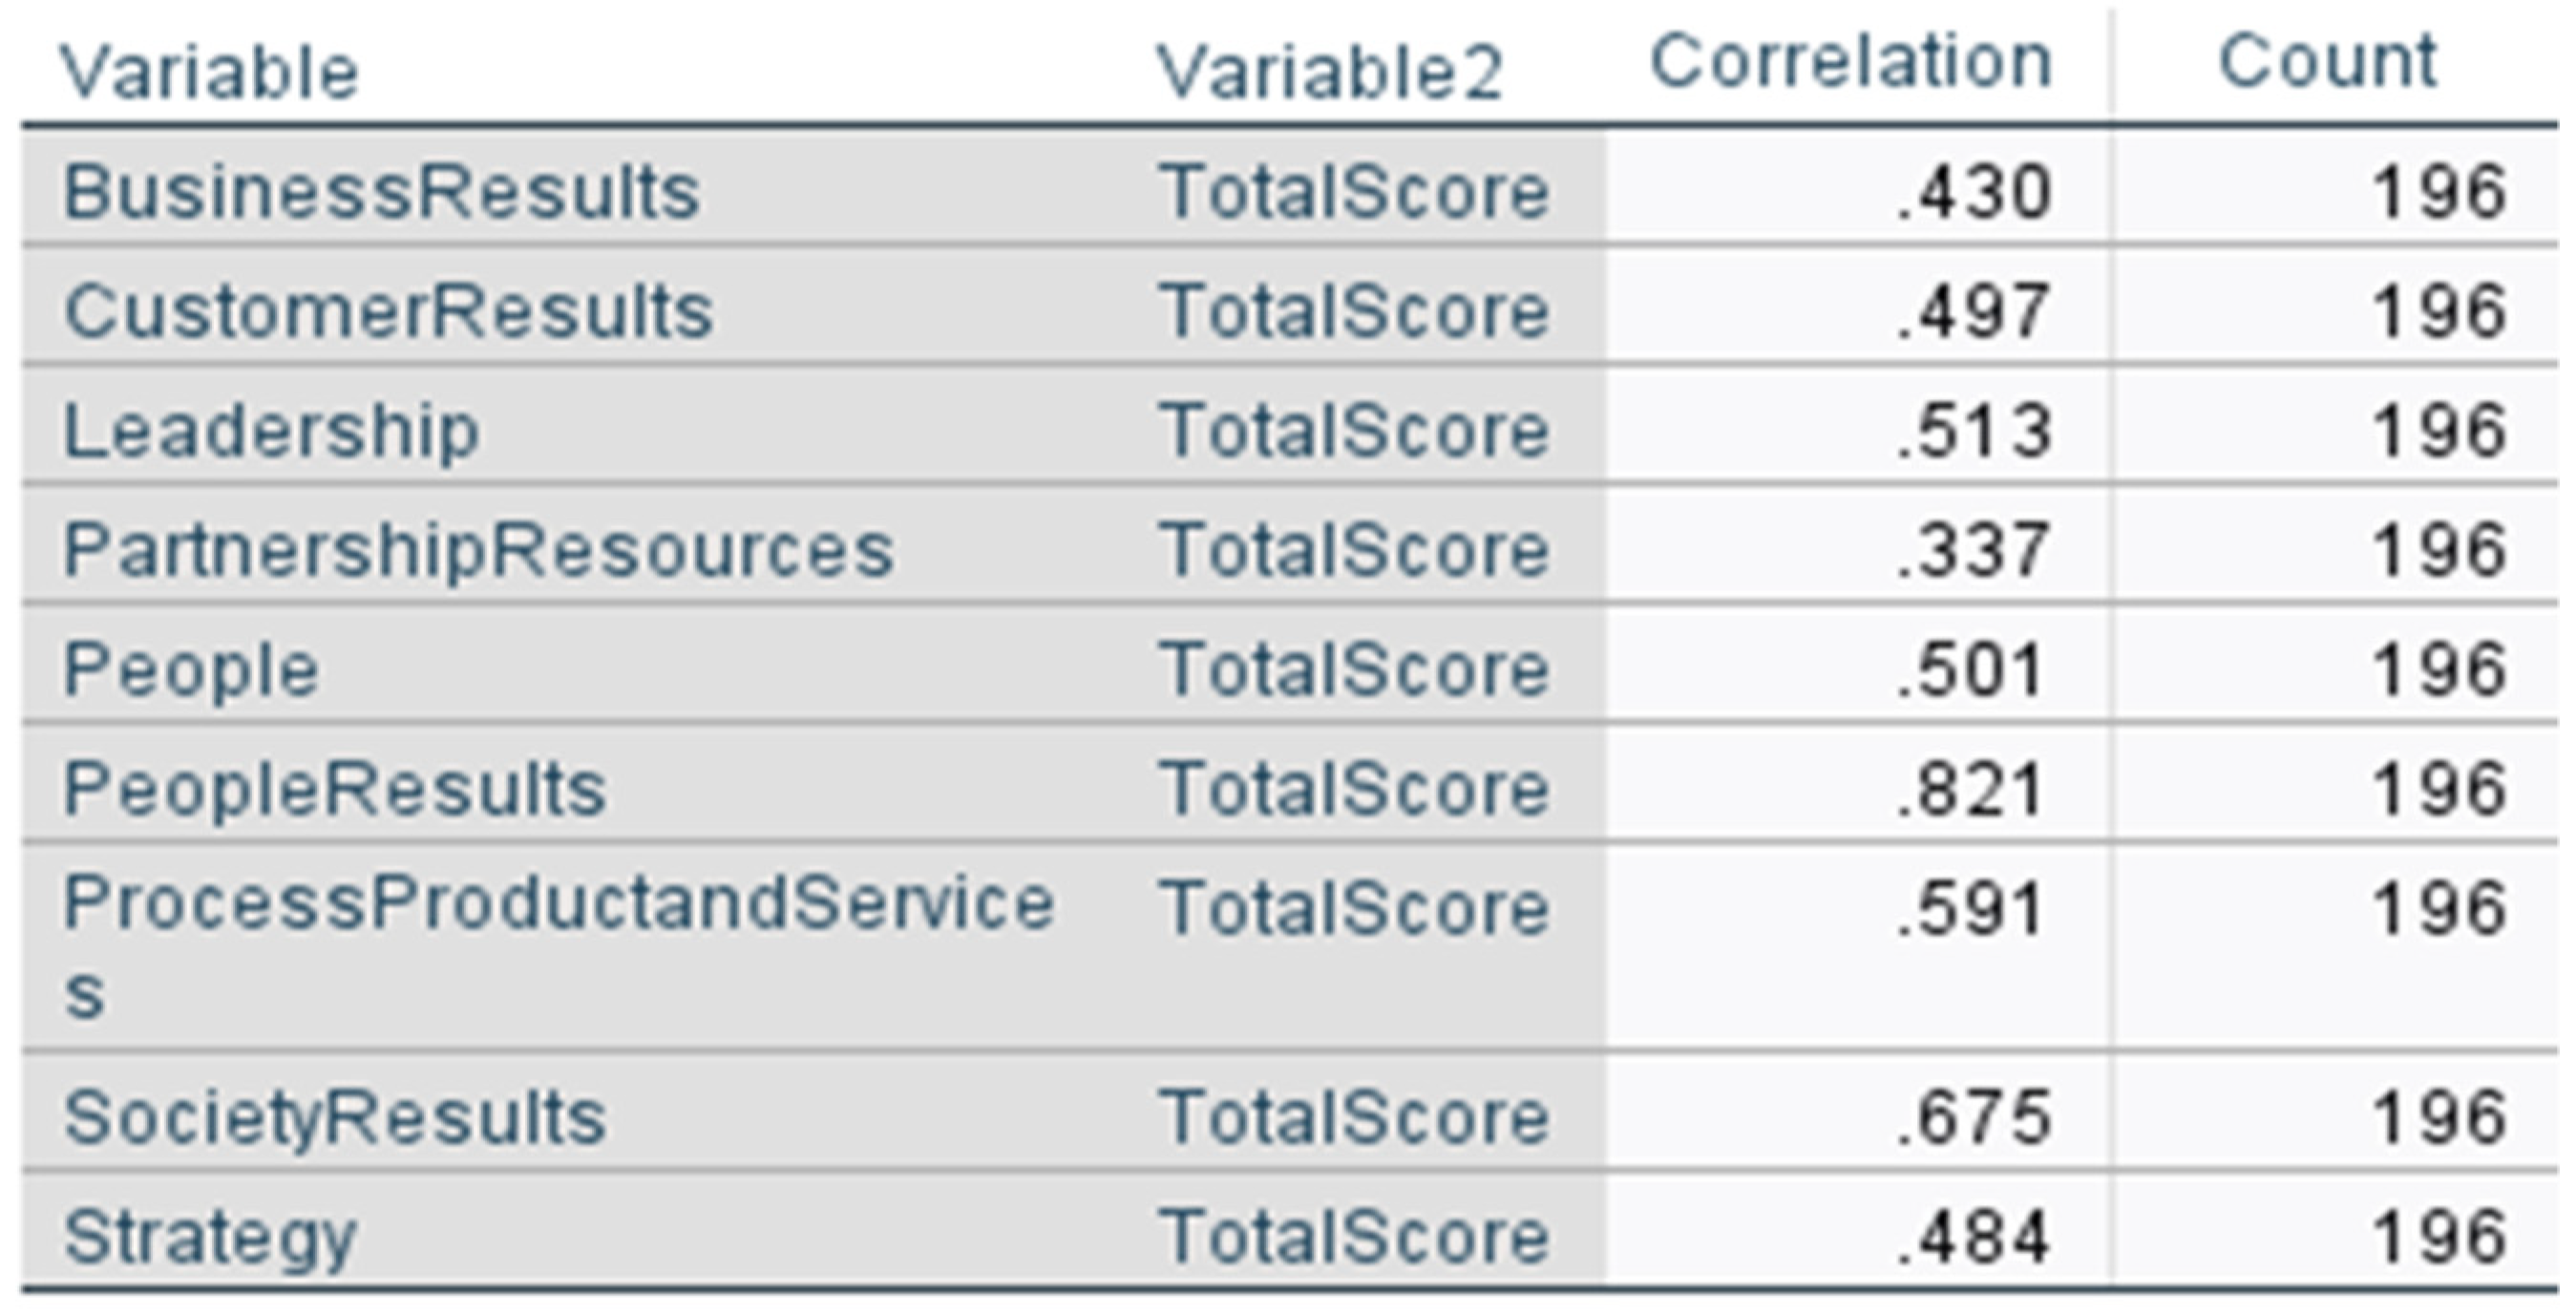
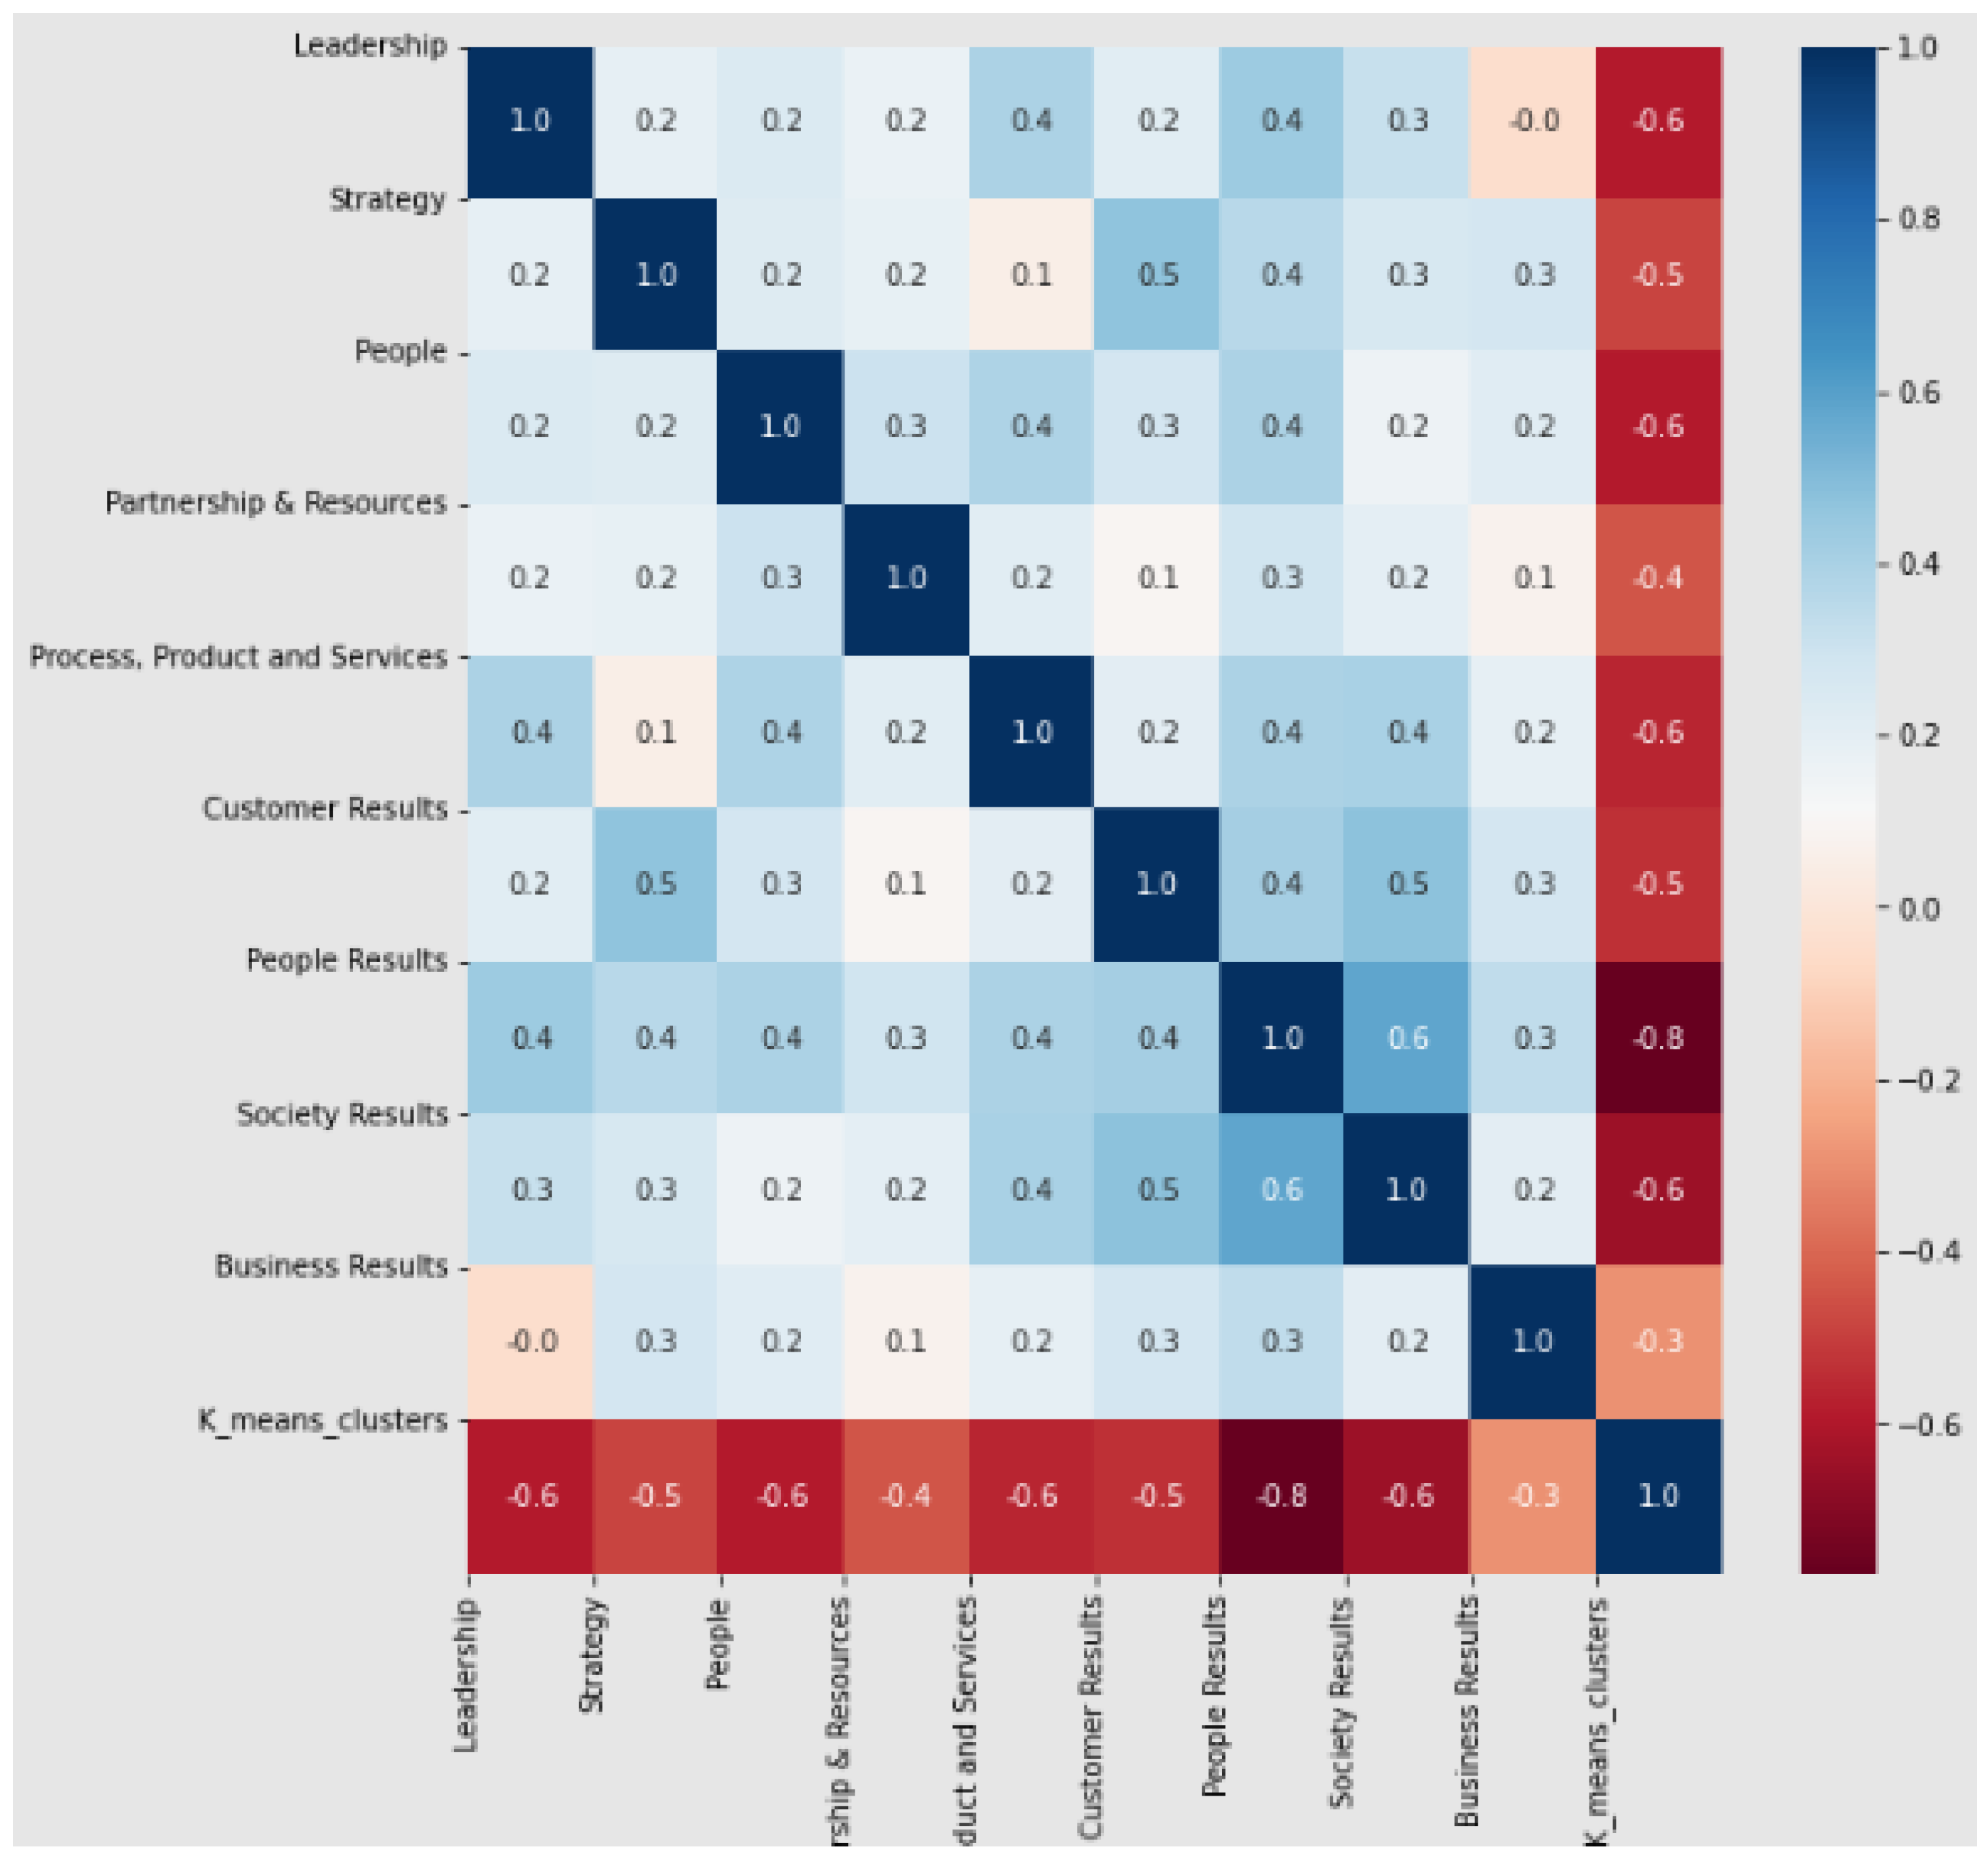
3.2. New EFQM Model Results

The same AI framework used in the previous section is used when the new EFQM dataset is given for the sake of comparison, knowing that the new EFQM has only seven input criteria rather than nine. Different AI models were used to train the framework with the new EFQM dataset. Table 3 shows the output accuracy for these AI models used with the new EFQM.
Figure 27 shows the elbow diagram when the new EFQM is used to choose the suitable k-value for the k-means clustering algorithm, which is where the curve starts to decrease, and before it is steady. In this case, k can be chosen to be between 2 and 5. K = 2 was chosen for accuracy issues. As discussed earlier in the old EFQM section, Random Index adjusted for chance was used to compare similarities between clusters.
ARI (NewEFQM) = 0.5913 for K = 2,
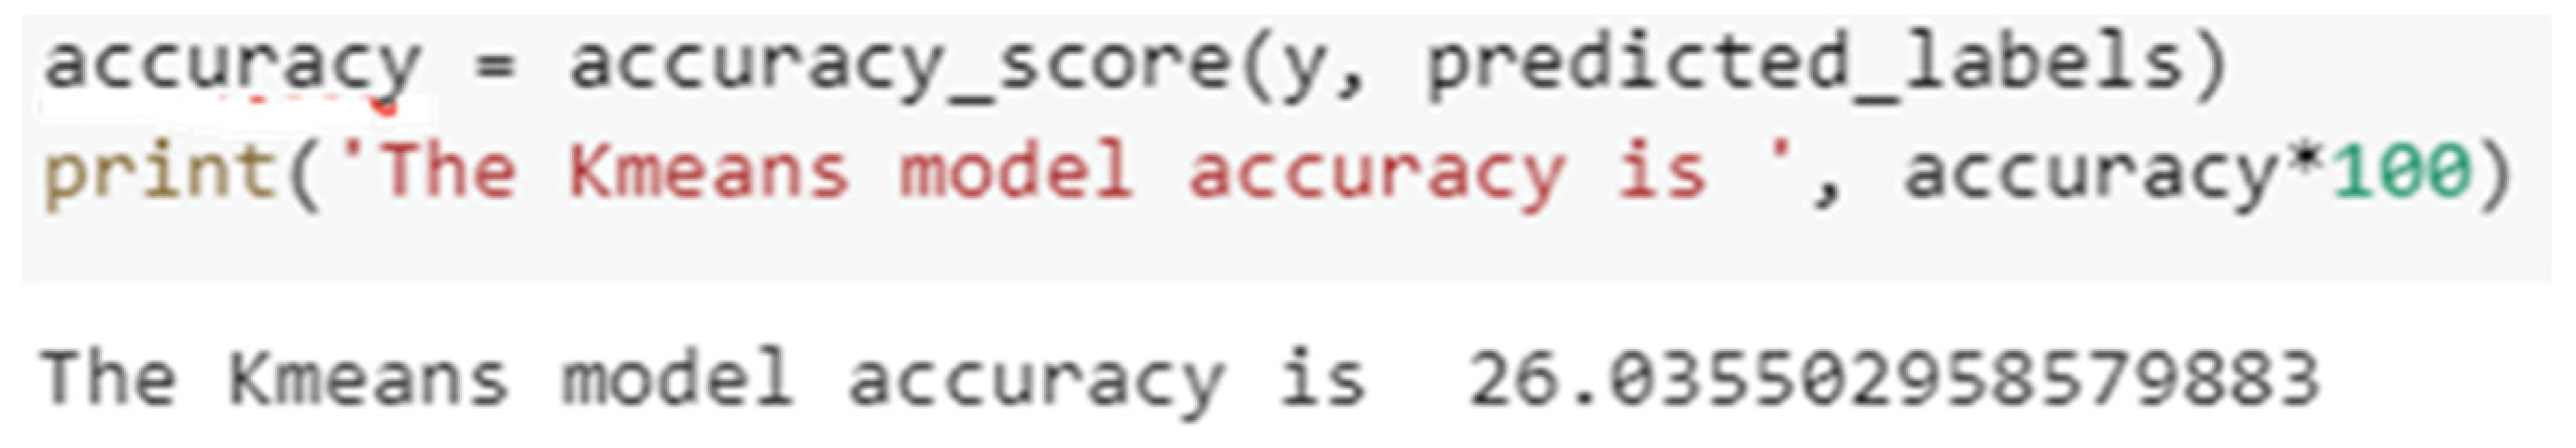
ARI (new EFQM) = 0.41 for K = 3.
Figure 28 shows the correlation between the new EFQM’s dimensions. It shows that the new EFQM dimensions are more correlated with each other than the old EFQM dimensions. There are many strong correlations (0.9), such as rhose between “Organizational Culture and Leadership” and “Purpose, Vision & Strategy”. Figure 29 shows very low accuracy when using the new EFQM model and applying the k-means clustering. This value remained low even when the k-value was changed.

4. Conclusions

In this research, EFQM input criteria are collected and used as training datasets for AI models. After several simulations with different AI models, it was deduced that K-means unsupervised machine learning is the most suitable for the data collected. After the model is trained, the framework can be tested when organizations’ decision makers insert the EFQM input criteria to obtain the framework’s expected output. EFQM output accuracy was calculated and it was found that K-means clustering works better with the old EFQM than with the new EFQM. If more new EFQM data are obtained, then the framework maybe modified into a gradient boosting regression model (according to output accuracy). The k-value used for K-means clustering was chosen to be two after various simulations with different k-values.Different k-values result in lower EFQM output accuracy. The EFQM output predicted score is classified as either “High” or “Low”.
When testing the framework, if the EFQM output score is “Low”, the framework returns the lowest EFQM input criterion with recommendations to decision makers for self-improvement. Using this framework saves time and money before anorganization applies for the EFQM excellence award.
The basic significance of this research is to improve the operational excellence in public and private organizations. This research is innovative since it adds to the knowledge body the new concept of injecting AI following the ISO/IEC 23053 standard into the EFQM, leading to operational excellence. This can be of great value for organizations seeking to enhance their performance and attain recognition in the field of quality management.
This research paper guides the way for future studies. Benchmarking between different business excellence models can be studied when using different machine learning techniques. Quality 4.0, or the new EFQM can also be used to predict operational excellence using different AI techniques. The model can be applied to different industries worldwide, and then benchmarking can be performed.

Author Contributions

Writing—review & editing, R.R.H.; Supervision, M.A.T., F.D. and J.R. All authors have read and agreed to the published version of the manuscript.

Funding

This research received no external funding.

Institutional Review Board Statement

Not applicable.

Informed Consent Statement

Not applicable.

Data Availability Statement

Data used for training and testing the k-means unsupervised machine learning were obtained from a confidential UAE government entity.

Acknowledgments

A special thank you to all hidden soldiers who participated in this research paper, starting with my supervisors who offered help throughout the whole paper. Thanks to Omnia M. Al Mutasim for her continuous technical support with AI techniques.

Conflicts of Interest

The authors declare no conflicts of interest.

References

  1. Miller, J.; Parast, M.M. Learning by applying: The case of the Malcolm Baldrige national quality award. IEEE Trans. Eng. Manag. 2018, 66, 337–353. [Google Scholar] [CrossRef]
  2. Sila, I. Investigating changes in TQM’s effects on corporate social performance and financial performance over time. Total Qual. Manag. Bus. Excell. 2020, 31, 210–229. [Google Scholar] [CrossRef]
  3. Liu, H.C.; Liu, R.; Gu, X.; Yang, M. From total quality management to Quality 4.0: A systematic literature review and future research agenda. Front. Eng. Manag. 2023, 10, 191–205. [Google Scholar] [CrossRef]
  4. Nenadál, J. The New EFQM Model: What is Really New and Could Be Considered as a suitable tool with respect to Quality 4.0 concept? Qual. Innov. Prosper. 2020, 24, 17–28. [Google Scholar] [CrossRef]
  5. ISO/IEC JTC 1/SC 42; Artificial Intelligence. ISO: Geneva, Switzerland, 2017.
  6. Ghufli, A.A. Implementation of Business Excellence Model: A Case Study of UAE Public Sector Organization. Ph.D. Thesis, Faculty of Humanities, University of Manchester, Manchester, UK, 2012. [Google Scholar]
  7. Metaxas, I.N.; Koulouriotis, D.E. Business excellence measurement: A literature analysis (1990–2016). Total Qual. Manag. Bus. Excell. 2019, 30, 1189–1218. [Google Scholar] [CrossRef]
  8. Sadeh, E.; Arumugam, V.C.; Malarvizhi, C.A. Integration of EFQM framework and quality information systems. Total Qual. Manag. Bus. Excell. 2013, 24, 188–209. [Google Scholar] [CrossRef]
  9. Goonan, K.J.; Stoltz, P.K. Leadership and management principles for outcomes-oriented organizations. Med. Care Supply 2004, 42, 31–38. [Google Scholar] [CrossRef] [PubMed]
  10. Quintero-Garzón, M.L.; Carrión-García, A.; Jordá-Rodríguez, M.A.; Rodríguez-Córdoba, M. Corporate social responsibility and the EFQM excellence model as a framework for integration of management systems in organizations. Ing. Compet. 2015, 17, 9–22. [Google Scholar]
  11. Laurett, R.; Mendes, L. EFQM model’s application in the context of higher education: A systematic review of the literature and agenda for future research. Int. J. Qual. Reliab. Manag. 2019, 36, 257–285. [Google Scholar] [CrossRef]
  12. Arezki, S.; Elhissi, Y. Toward an IT Governance Maturity Self-assessment model using EFQM and COBIT. In Proceedings of the International Conference on Geo informatics and Data Analysis—ICGDA ’18, Prague, Czech Republic, 20 April 2018. [Google Scholar]
  13. Pimentel, L.; Ramos Pires, A. The impact of EFQM awards on organizational management. In Proceedings of the 20th Excellence in Services University of Verona International Conference, Verona, Italy, 7–8 September 2017. [Google Scholar]
  14. Rosak-Szyrocka, J.; Roszak, M. The role of the EFQM model in precepting quality in Polish enterprises. Multidiscip. Asp. Prod. Eng. MAPE 2019, 2, 399–406. [Google Scholar] [CrossRef]
  15. Minkman, M.; Ahaus, K.; Huijsman, R. Performance improvement based on integrated quality management models: What evidence do we have? A systematic literature review. Int. J. Qual. Health Care 2007, 19, 90–104. [Google Scholar] [CrossRef]
  16. Jaeger, A.; Matyas, K. Transformation of the EFQM approach from business towards operations excellence. Prod. Eng. 2016, 10, 277–291. [Google Scholar] [CrossRef]
  17. Keshtegar, A.; Ghasemi, M.; Hosseini, A.; Ahang, A.F.; Ghaffari, H. The impact of business intelligence on enablers of EFQM excellence model with mediating role of knowledge sharing ARTICLE INFO 48. Int. J. Hum. Cap. Urban Manag. 2021, 6, 173–184. [Google Scholar] [CrossRef]
  18. Ahire, S.L.; Landeros, R.; Golhar, D.Y. Total quality management: A literature review and an agenda for future research. Prod. Oper. Manag. 1995, 4, 277–306. [Google Scholar] [CrossRef]
  19. Kiraz, A.; Açikgöz, N. A fuzzy-logic-based approach to the EFQM model for performance enhancement. Sādhanā 2021, 46, 43. [Google Scholar] [CrossRef]
  20. Asif, M.; Searcy, C.; Garvare, R.; Ahmad, N. Including sustainability in business excellence models. Total Qual. Manag. Bus. Excell. 2011, 22, 773–786. [Google Scholar] [CrossRef]
  21. Lee, S.; Choi, K.S.; Kang, H.Y.; Cho, W.; Chae, Y.M. Assessing the factors influencing continuous quality improvement implementation: Experience in Korean hospitals. Int. J. Qual. Health Care 2002, 14, 383–391. [Google Scholar] [CrossRef]
  22. Wahyudi, R.E.; Permanasari, V.Y. Analysis of the quality of nursing services according to hospital accreditation 2012 Version, Reviewed from Baldrige Malcolm Criteria in PasarMinggu Jakarta Selatan Hospital in 2017. KnE Life Sci. 2017, 4, 232. [Google Scholar] [CrossRef]
  23. Hong, S.J.; Choi, D.; Chae, J. Exploring different airport users’ service quality satisfaction between service providers and air travelers. J. Retail. Consum. Serv. 2020, 52, 101917. [Google Scholar] [CrossRef]
  24. Brueckner, J.K.; Flores-Fillol, R. Market structure and quality determination for complementary products: Alliances and service quality in the airline industry. Int. J. Ind. Organ. 2020, 68, 102557. [Google Scholar] [CrossRef]
  25. Titu, A.M.; Stanciu, A.; Tarnu, L. Improving the quality of the decision-making process for management and implementation of shared artificial intelligence platforms. In Proceedings of the International Management Conference, Faculty of Management, Academy of Economic Studies, Bucharest, Romania, 5–6 November 2020. [Google Scholar]
  26. Mejbel, M.K.; Abdullah, S.A.; Hussein, I.A. Evaluating the performance of people in the central bank of Iraq (Cbi) According to the European excellence model. Int.J. Prof. Bus. Rev. 2023, 8, 1. [Google Scholar]
  27. Bag, S.; Pretorius, J.H.C.; Gupta, S.; Dwivedi, Y.K. Role of institutional pressures and resources in the adoption of big data analytics powered artificial intelligence, sustainable manufacturing practices and circular economy capabilities. Technol. Forecast. Soc. Change 2021, 163, 120420. [Google Scholar] [CrossRef]
  28. Hıdıroğlu, D. Self-assessment performance measurement in construction Companies: An Application of the EFQM Excellence Model on Processes and Customer stages. Procedia Comput. Sci. 2019, 158, 844–851. [Google Scholar] [CrossRef]
  29. Suárez, E.; Calvo-Mora, A.; Roldán, J.L.; Periáñez-Cristóbal, R. Quantitative research on the EFQM excellence model: A systematic literature review (1991–2015). Eur. Res. Manag. Bus. Econ. 2017, 23, 147–156. [Google Scholar] [CrossRef]
  30. Nassif, A.B.; Shahin, I.; Attili, I.; Azzeh, M.; Shaalan, K. Speech recognition using deep neural networks: A systematic review. IEEE Access 2019, 7, 19143–19165. [Google Scholar] [CrossRef]
  31. Soliman, G.M.; Abou-El-Enien, T.H. Terrorism Prediction Using Artificial Neural Network. Rev. Intell. Artif. 2019, 33, 81–87. [Google Scholar] [CrossRef]
  32. Cruz, J.A.; Wishart, D.S. Applications of machine learning in cancer prediction and prognosis. Cancer Inform. 2006, 2, 117693510600200030. [Google Scholar] [CrossRef]
  33. Bunker, R.P.; Thabtah, F. A machine learning framework for sport result prediction. Appl. Comput. Inform. 2019, 15, 27–33. [Google Scholar] [CrossRef]
  34. Franc, V.; Hlavac, V. Multi-class support vector machine. In Proceedings of the 2002 International Conference on Pattern Recognition, Quebec City, QC, Canada, 11 August 2002. [Google Scholar] [CrossRef]
  35. Zhang, Q.; Yang, L.T.; Chen, Z.; Li, P. A survey on deep learning for big data. Inf. Fusion 2018, 42, 146–157. [Google Scholar] [CrossRef]
  36. Griner, T.E.; Thompson, M.; High, H.; Buckles, J. Artificial intelligence forecasting census and supporting early decision. Nurs. Adm. Q. 2020, 44, 316–328. [Google Scholar] [CrossRef]
  37. Lee, C.; Kim, H.; Lee, S. Analysis of safety considerations for application of artificial intelligence in marine software systems. J. Korean Soc. Navig. Port Stud. 2022, 46, 269–279. [Google Scholar]
  38. Abedelgadir, M.I.O.; Mohammad, R. Operational excellence and performance measurement tool for organization self-assessment in the Sudanese aviation industry. J. Adv. Res. Bus. Manag. Stud. 2023, 30, 34–44. [Google Scholar] [CrossRef]
  39. Rizvi, A.T.; Haleem, A.; Bahl, S.; Javaid, M. Artificial intelligence (AI) and its applications in Indian manufacturing: A review. In Current Advances in Mechanical Engineering: Select Proceedings of ICRAMERD 2020; Springer: Berlin/Heidelberg, Germany, 2021. [Google Scholar]
  40. Cortes, L.L.; Silva, C.F. Artificial intelligence models for crime prediction in urban spaces. Mach. Learn. Appl. Int. J. 2021, 8, 1. [Google Scholar] [CrossRef]
  41. Arpaci, I.; Huang, S.; Al-Emran, M.; Al-Kabi, M.N.; Peng, M. Predicting the COVID-19 infection with fourteen clinical features using machine learning classification algorithms. Multimed. Tools Appl. 2021, 80, 11943–11957. [Google Scholar] [CrossRef]
  42. Mukherjee, A.; Pal, A.; Misra, P. Data analytics in ubiquitous sensor- based health information systems. In Proceedings of the 6th International Conference Next Generation Mobile Application Services Technology (NGMAST), Paris, France, 12 September 2012. [Google Scholar] [CrossRef]
  43. Huang, M.H.; Rust, R.T. A strategic framework for artificial intelligence in marketing. J. Acad. Mark. Sci. 2021, 49, 30–50. [Google Scholar] [CrossRef]
  44. Meng, S.; Zhang, X.; Xu, M.; Pignatari, M.; Gallino, R.; Heil, M. IOP Conference Series: Materials Science and Engineering. In Proceedings of the 3rd International Conference on Automation, Control and Robotics Engineering (CACRE 2018), Chengdu, China, 19–22 July 2018. [Google Scholar]
  45. Thirumalai, C.; Duba, A.; Reddy, R. Decision making system using machine learning and Pearson for heart attack. In Proceedings of the 2017 International conference of Electronics, Communication and Aerospace Technology (ICECA), Coimbatore, India, 20–22 April 2017; IEEE: New York, NY, USA, 2017. [Google Scholar]
  46. Masum, A.K.M.; Beh, L.S.; Azad, M.A.K.; Hoque, K. Intelligent human resource information system (i-HRIS): A holistic decision support framework for HR excellence. Int. Arab J. Inf. Technol. 2018, 15, 121–130. [Google Scholar]
  47. Schlesinger, M.I.; Hlavác, V. Supervised and unsupervised learning. In Ten Lectures on Statistical and Structural Pattern Recognition; Springer: Berlin/Heidelberg, Germany, 2013. [Google Scholar]
  48. Rojas, R. Unsupervised learning and clustering algorithms. In Neural Networks; Springer: Berlin/Heidelberg, Germany, 1996; pp. 99–121. [Google Scholar]
  49. Sharma, P. The Most Comprehensive Guide to K-Means Clustering You’ll Ever Need. 2019. Available online: https://www.analyticsvidhya.com/blog/2019/08/comprehensive-guide-k-means-clustering (accessed on 20 February 2024).
  50. Zhang, Y.; Weng, Y.; Lund, J. Applications of explainable artificial intelligence in diagnosis and surgery. Diagnostics 2022, 12, 237. [Google Scholar] [CrossRef]
  51. Thurzo, A.; Strunga, M.; Urban, R.; Surovková, J.; Afrashtehfar, K.I. Impact of artificial intelligence on dental education: A review and guide for curriculum update. Educ. Sci. 2023, 13, 150. [Google Scholar] [CrossRef]
  52. ISO/IEC 22989:2022(E); Information Technology—Artificial Intelligence—Artificial Intelligence Concepts and Terminology. ISO Standards: Geneva, Switzerland, 2022.
  53. Stark, L.; Greene, D.; Hoffmann, A.L. Critical perspectives on governance mechanisms for AI/ML systems. In The Cultural Life of Machine Learning: An Incursion into Critical AI Studies; Palgrave Macmillan: London, UK, 2021; pp. 257–280. [Google Scholar]
  54. Trenta, F.; Battiato, S.; Ravì, D. An Explainable Medical Imaging Framework for Modality Classifications Trained Using Small Datasets. In Proceedings of the International Conference on Image Analysis and Processing; Springer International Publishing: Berlin/Heidelberg, Germany, 2022. [Google Scholar]
  55. Bertassi, E. Considerations on Predictive Policing Software. Bulletin-Volume 2018, 3, 11. [Google Scholar]
  56. Schwalbe, N.; Wahl, B. Artificial intelligence and the future of global health. Lancet 2020, 395, 1579–1586. [Google Scholar] [CrossRef] [PubMed]
  57. Gao, N.; Liu, Y.; Mai, Y. WITHDRAWN: Manufacturing service innovation platform based on 5G network and machine learning. Microprocess. Microsyst. 2020, 103448. [Google Scholar] [CrossRef]
  58. Liu, L.T.; Wang, S.; Britton, T.; Abebe, R. Reimagining the machine learning life cycle to improve educational outcomes of students. Proc. Natl. Acad. Sci. USA 2023, 120, e2204781120. [Google Scholar] [CrossRef]
  59. ISO 24028; Information Technology—Artificial Intelligence—Overview of Trustworthiness in Artificial Intelligence. ISO: Geneva, Switzerland, 2020.
  60. Fonseca, L. Relationship between ISO 9001 certification maturity and EFQM business excellence model results. Qual. Innov. Prosper. 2015, 19, 85–102. [Google Scholar] [CrossRef]
  61. Dirican, C. The impacts of robotics artificial intelligence on business and economics. Procedia—Soc. Sci. Behav. 2015, 195, 564–573. [Google Scholar] [CrossRef]
  62. Wieringa, R.J. Design Science Methodology for Information Systems and Software Engineering; Springer: Berlin/Heidelberg, Germany, 2014. [Google Scholar]
  63. Wieringa, R. Relevance and problem choice in design science. In Proceedings of the International Conference on Design Science Research in Information Systems, St. Gallen, Switzerland, 4–5 June 2010; Springer: Berlin/Heidelberg, Germany, 2010. [Google Scholar]
  64. Zhao, W. Improving social responsibility of artificial intelligence by Using ISO 26000. IOP Conf. Ser. Mater. Sci. Eng. 2018, 428, 012049. [Google Scholar] [CrossRef]
  65. Zhao, W. Artificial Intelligence and ISO 26000 (Guidance on Social Responsibility). In AI and Learning Systems-Industrial Applications and Future Directions; IntechOpen: London, UK, 2021. [Google Scholar]
  66. Tidjon, N.L.; Khomh, F. Never trust, always verify: A roadmap for Trustworthy AI? arXiv 2022, arXiv:2206.11981. [Google Scholar]
Figure 1. Evolution of quality [3].
Applsci 14 02569 g001
Figure 2. EFQM evolution summary.
Applsci 14 02569 g002
Figure 3. EFQM framework 2013 [17].
Applsci 14 02569 g003
Figure 4. EFQM papers classified by countries, publication year, and sector.
Applsci 14 02569 g004
Figure 5. Machine learning algorithms [30].
Applsci 14 02569 g005
Figure 6. Unsupervised machine learning [30].
Applsci 14 02569 g006
Figure 7. Elbow diagram to determine k-value in old EFQM.
Applsci 14 02569 g007
Figure 8. Accuracy of 196-row dataset.
Applsci 14 02569 g008
Figure 10. Outline for predicting operational excellence.
Applsci 14 02569 g010
Figure 11. Design science framework.
Applsci 14 02569 g011
Figure 12. Design science framework applied to this paper.
Applsci 14 02569 g012
Figure 13. Research methodology flowchart [50].
Applsci 14 02569 g013
Figure 14. System architecture diagram of the AI-integrated framework.
Applsci 14 02569 g014
Figure 15. Data acquisition, data preparation, and modelling states.
Applsci 14 02569 g015
Figure 16. Verification and validation, and operation and monitoring states.
Applsci 14 02569 g016
Figure 17. Comparison, feedback, and retirement states.
Applsci 14 02569 g017
Figure 18. SPSS descriptive statistics for old EFQM (196 rows).
Applsci 14 02569 g018
Figure 19. SPSS correlation of EFQM dimensions and the total score.
Applsci 14 02569 g019
Figure 20. Google Colab simulation for studying EFQM input correlation.
Applsci 14 02569 g020
Figure 21. Training the model.
Applsci 14 02569 g021
Figure 22. Model trained output message.
Applsci 14 02569 g022
Figure 23. “High” output.
Applsci 14 02569 g023
Figure 24. “Low” output.
Applsci 14 02569 g024
Figure 25. Three equal “Low” inputs.
Applsci 14 02569 g025
Figure 26. Three “Low” outputs.
Applsci 14 02569 g026
Figure 27. Elbow diagram for determining k-value for new EFQM.
Applsci 14 02569 g027
Figure 28. The heat map for new EFQM dimensional correlation.
Applsci 14 02569 g028
Figure 29. Accuracy of new EFQM model.
Applsci 14 02569 g029
Table 1. AI applications in different industries.
Name of PaperCountry/YearAuthor/PublisherGeneral DescriptionApplied Area/FieldStrengths of Applied Technique/MethodChallenges/Limitations
1—Artificial Intelligence (AI) and Its Applications in Indian Manufacturing: A ReviewIndia, 2021(Rizvi A. et al., 2021), Springer
[39]
AI integrated into manufacturing firms in IndiaManufacturingImprove quality and reduce errorsHigh installation cost and maintenance
2—A strategic framework for artificial intelligence in marketing.Taiwan, USA, 2020(Huang M., and Rust R., 2020), Springer
[43]
Injecting AI techniques into strategic marketing planningMarketingEnhance strategic marketing processBiased, less human intervention
3—Artificial Intelligence Forecasting Census and Supporting Early Decisions.USA, 2020(Griner T. et al., 2020), Wolters Kluwer Health
[36]
Alex is an AI technique that helps nurses for occupancy prediction and decision making Healthcare, nursingEnhance operational excellence and safetyN/A
4—Predicting the COVID-19 infection with fourteen clinical features using machine learning classification algorithmsChina, 2021(Arpaci I., Huang S., Al-Emran M., Al-Kabi M, 2021) Springer
[41]
AI model is used to predict COVID-19 from 14 criteria with limited testing resourcesMedicine, HealthcareCan predict COVID-19 cases ahead of time when RT-PCT kits are limitedLow sample size. No data about COVID-19 symptoms in predicting the infection
Table 2. Output accuracy values using different AI models for old EFQM.
AI ModelDecision TreeLinear RegressionGradient Boosting RegressionRandom ForestSupport Vector MachineK-Means Clustering
Output Accuracy60.96%68.54%70.37%63.3%3.64%86.73%
HyperparametersDefault
Random_state = 0
Max_depth = 2
Default. Alpha, learning rate= 0.1, max_depth = 3Default
Random_state = 0
Max_depth = 3
Max leaf node = 0
Learning rate = 0.1
Default
Random_state = 0
Max_depth =2
c = 1.0
Epsilon =0.2
k = 2
Table 3. Output accuracy for different AI models used with new EFQM.
AI ModelDecision TreeLinear RegressionGradient Boosting RegressionRandom ForestSupport Vector MachineK-Means Clustering
Output Accuracy57.20%58.54%60.34%53.2%13.65%59.13%
HyperparametersDefault
Random_state = 0
Max_depth = 2
Default
Learning rate = 0.1, alpha, max_depth = 3
Default
Random_state = 0
Max_depth = 3
Max leaf node = 0
Learning rate = 0.1
Default
Random_state = 0
Max_depth = 2
c = 1.0
Epsilon =0.2
k = 2
Disclaimer/Publisher’s Note: The statements, opinions and data contained in all publications are solely those of the individual author(s) and contributor(s) and not of MDPI and/or the editor(s). MDPI and/or the editor(s) disclaim responsibility for any injury to people or property resulting from any ideas, methods, instructions or products referred to in the content.

