1. Introduction
Spinal stenosis is characterized by a reduction in the cross-sectional area of the spinal canal, leading to upper or lower motor neuron deficits and associated neurological symptoms depending on the site of compression [
1].
Spinal stenosis is a relatively common medical problem. It concerns mainly geriatric patients. Spinal stenosis in younger patients is a consequence of congenital malformations. On the other hand, in people over 50 years old, it is the result of progressive degenerative changes. Epidemiological studies have shown that 5/100,000 people and 80% of people over 70 years of age may suffer from spinal stenosis [
2]. Epidemiological trends suggest that, in the coming decades, the number of diagnosed cases of stenosis will increase. In adults over 65 years undergoing spinal surgery, the leading diagnosis is lumbar spinal stenosis (LSS) [
3].
Lumbar foraminal stenosis (LFS) is a common cause of lower limb radiculopathy (8–11%), negatively affecting patients’ quality of life and daily activities [
4,
5].
LFS is common in middle-aged populations, where degenerative changes in the bones and facet joints, hyperplasia of the flava ligament, and herniated discs may contribute to the narrowing of the spinal foramen.
Spinal canal stenosis can affect various anatomical structures within it. Stenosis is diagnosed in the central canal where the spinal cord is located. In such cases, stenosis in the anteroposterior dimension is observed, which leads to the compression of the nerve elements and reduced blood supply to the spinal cord in the cervical section and cauda equina in the lumbar section. The medical problem discussed in this part of the article may also concern the intervertebral canals, i.e., the channels through which the nerve roots exit the spinal cord. In the course of stenosis, compression is observed as a result of a herniated intervertebral disc, the overgrowth of facet joints and ligaments, or the unstable displacement of one vertebral body relative to the level below. The third anatomical structure that can be affected by spinal stenosis is the lateral recess, which occurs only in the lumbar spine. The lateral recess is the area along the epiphyse where the nerve root enters just before exiting through the intervertebral canal, and may be compressed due to hypertrophy of the facet joint [
3].
Symptoms for LFS have been observed in patients with degenerative disc disease, scoliosis, spondylolysis, spondylolisthesis and spondylolytic spondylolisthesis. Hypertrophic ligamentum flavum (LF) and osteophytes are occasionally seen in patients with LFS. However, these types of symptoms do not always indicate the development of LFS. Therefore, it is necessary to improve the diagnostic procedures related to the described disease entity [
6]. It is estimated that stenosis of the intervertebral foramina is a problem for about 8–11% of the population [
7]. Pathologies occurring within the intervertebral disc may lead to changes in the parameters of the intervertebral foramina. With cranial subluxation of the upper articular process of the lower vertebra, the height and area of the intervertebral foramen decrease. Osteophytes of the facet joint and hypertrophic ligamentum flavum contribute to the reduction in the width and area of the foramen in the anterior–posterior dimension [
8]. Changes occurring within the spinal canal may lead to compression of the lumbar nerve and dorsal root ganglion and result in the appearance of symptoms characteristic of spinal canal impingement [
7].
Due to the fact that treatment in the case of LFS does not always mean a return to full fitness and pain relief, research continues, the aim of which is, among others, to learn the importance of the size of the intervertebral foramina in the appearance of spinal stenosis.
An accurate diagnosis of spinal stenosis is difficult to make. This is due to the lack of consensus on definitive diagnostic criteria and the requirement for consistency between physical symptoms and imaging features. In particular, Tominaga et al. [
9] believe that clinicians should make a diagnosis based on a thorough physical examination and consistent imaging findings, including X-ray, computed tomography (CT), and magnetic resonance imaging (MRI) [
9].
The utilization of intervertebral foramen evaluation as a diagnostic tool is relevant in conditions that involve the compression of neurovascular structures within the foramen [
10]. A commonly employed technique for categorizing lesions within the spinal canal was introduced by Lee and colleagues [
11]. This approach relies on magnetic resonance imaging (MRI) to examine the area surrounding the spinal nerve roots, assessing any reduction or absence of free space around these structures that may lead to contact with the elements defining the intervertebral foramen. A more recent classification system refined the accuracy of the previous one [
12]. It should be noted that these categorizations do not denote absolute values but are instead unique analyses of MRI-obtained images.
Computed tomography-based LFS classification (CT Haleem–Botchu) is compatible with the MRI classification system [
13].
The morphological characteristics of the intervertebral foramen of the lumbar spine are described as oval, round, and tear-like; however, variability in the narrowing of the foramen is observed [
14].
The limited number of papers in the presented scope was the starting point for the search for quantitative assessments of the size of the intervertebral foramen. Due to the epidemiology of spinal degeneration, two lower motor segments within the lumbar spine were selected for analysis.
The aim of this study is to present the results of measurements of the intervertebral foramen in various cross-sections, forming the image of the intervertebral canal, and to compare their morphology between the L4/5 and L5/S1 segments.
2. Materials and Methods
2.1. Patients
This research was conducted on a population of 89 patients (44 women and 45 men) of W. Dega University Hospital in Poznan [
15]. The oldest participant was 89 years old and the youngest was 22 years old (mean 53.4 ± 16.4). All patients that qualified for the study reported complaints in the L4/L5 and L5/S1 segment of the spine.
This study included individuals with lower back pain who had undergone lumbar spine CT.
The exclusion criteria were as follows: scoliosis, asymmetry of the position and shape of the pelvis, lumbar spondylolisthesis, lumbar spinal stenosis, spinal deformity, foraminal stenosis, spondylolysis, disc disease, isthmic lysis, herniated disc, root symptoms, history of lower limb pain and numbness, history of lumbar spine trauma, infection, and surgery.
Through verbal communication, individuals were informed that their scans would be anonymized, excluding personally identifiable information (except age and gender). Anonymized images were explicitly designated for research or educational purposes, and rigorous exclusion criteria were applied, excluding scans without explicit consent. No new protocol was used and the CT scans were derived from standard retrospective investigations based on images of patients with lumbar spine-related disorders. We informed local IRB committees.
2.2. Morphometric Measurement
Our CT imaging process involves utilizing a multi-detector CT scanner. The scan parameters include a slice thickness of 1–2 mm, covering the range from L3 to S1. During the procedure, patients were positioned in a supine position with a focus on maintaining a neutral alignment of the spine. The image acquisition followed a standard lumbar spine protocol, ensuring a systematic approach to data collection.
CT scans of the patients were transformed using InVesalius, Meshmixer, 3D Builder, and GOM programs to obtain a three-dimensional image. In the obtained spatial visualization, the space of the root canal and the measurement planes were defined.
The process of defining the root canal involved several steps. Since root canals can vary in their spatial arrangement depending on the evaluated motor segment, the primary factor used to define the root canal was the course of the long axis of the epiphysis that bordered the upper part of the canal. Subsequently, the cross-section of the root canal was determined to align with the axis of the pedicle, which formed the upper opening of the canal. The analysis specifically focused on the bony boundaries, disregarding any soft tissue contours like the intervertebral disc and joint capsule. To complete the outline of the root canal where the intervertebral disc outline was eliminated, a line was added, connecting the lower posterior edge of the upper vertebral body to the posterior upper edge of the lower vertebra.
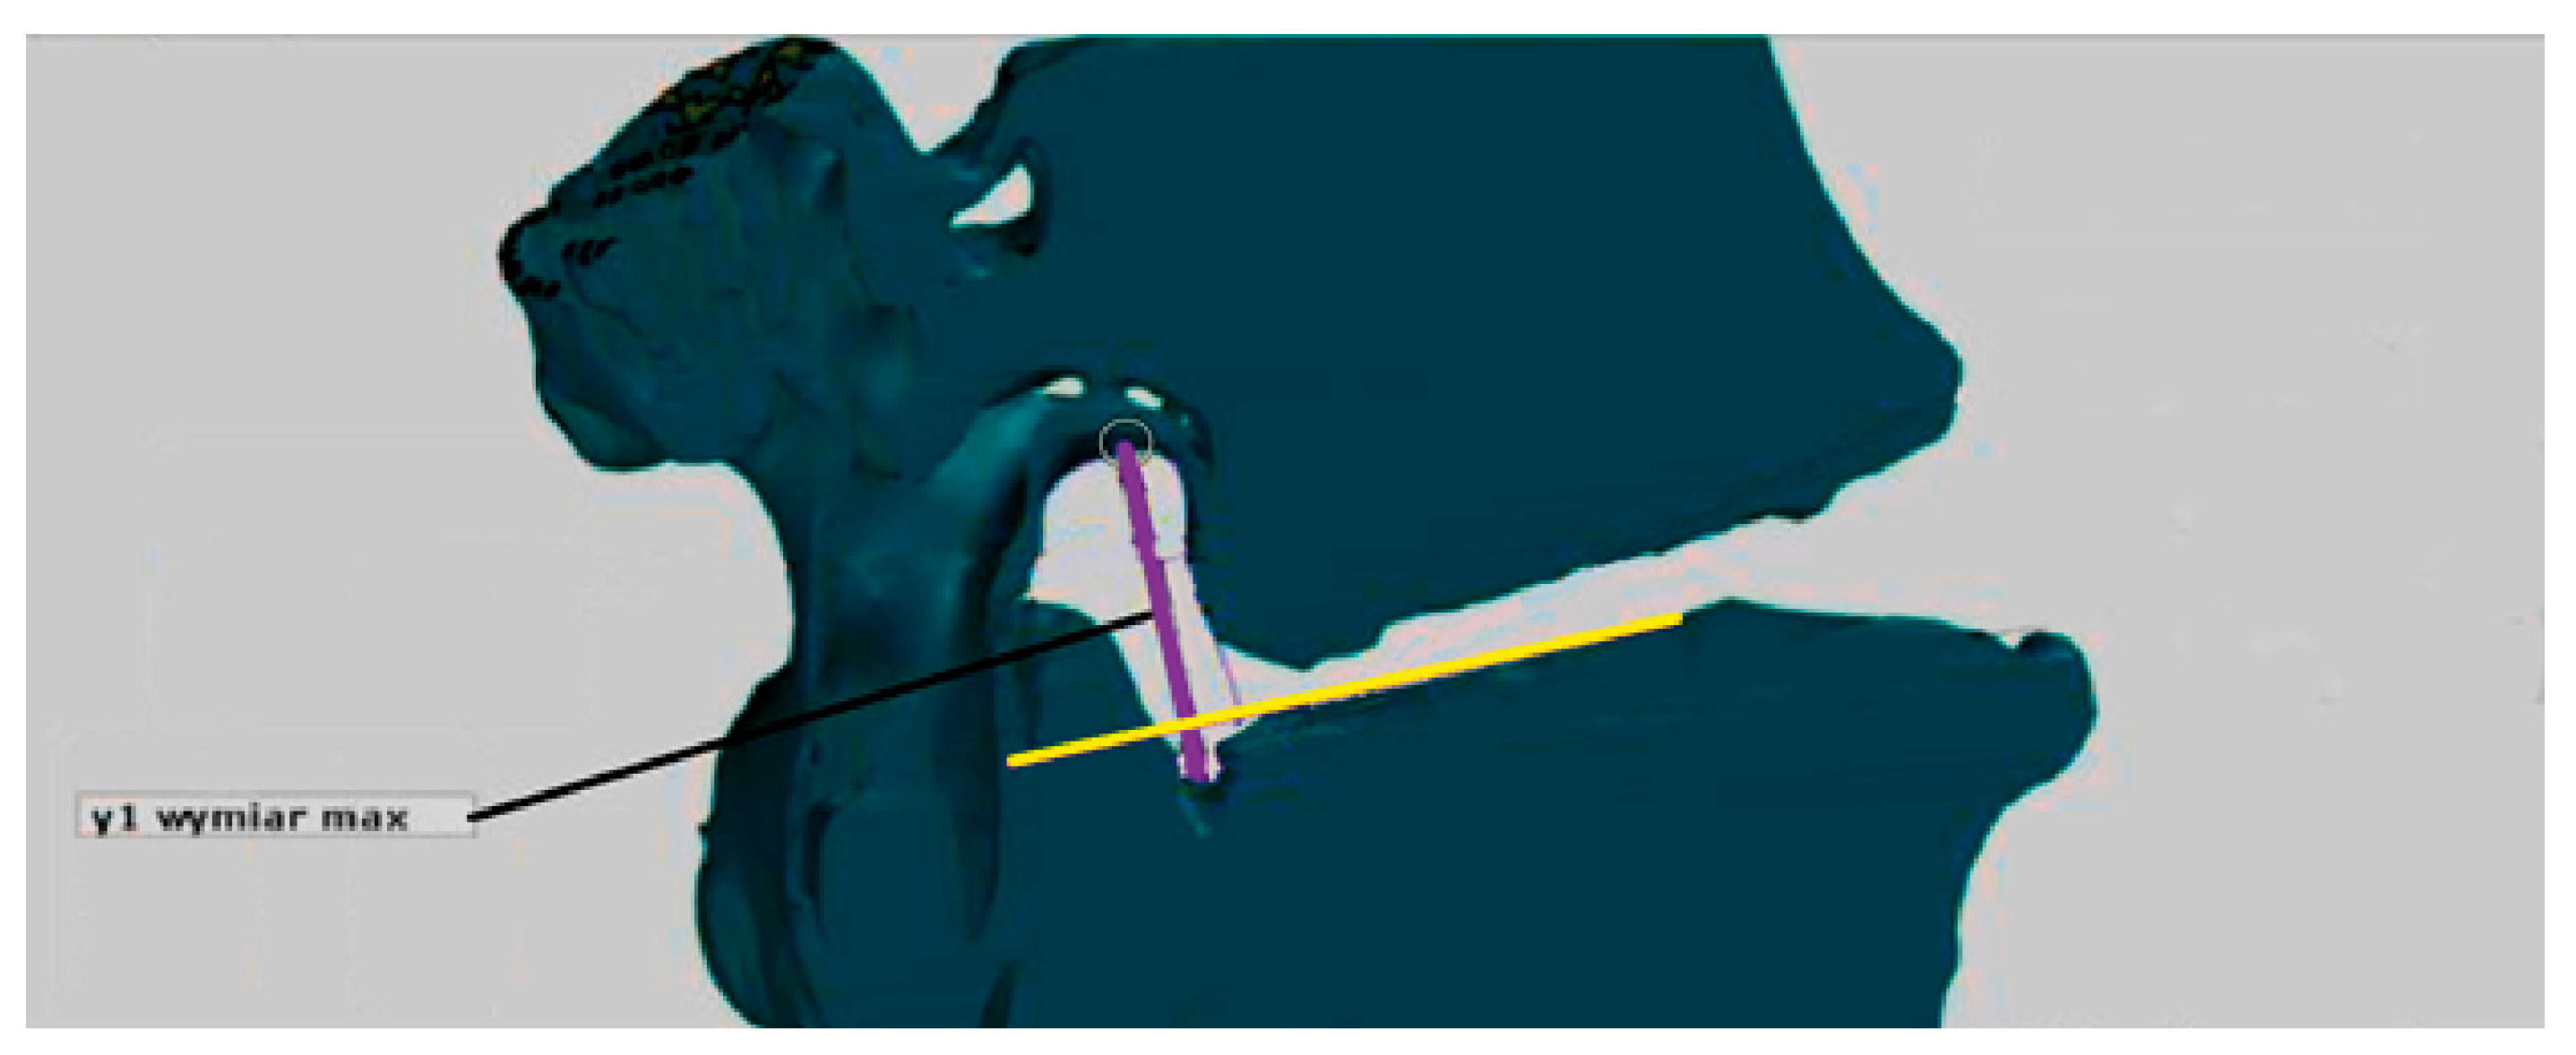
The obtained root canal contour was used to measure its maximum vertical dimension (MaxY). The maximum vertical dimension represents the longest section within the contour, perpendicular to the end plate of the vertebral body below (
Figure 1).
The two senior orthopedic surgeons had an average of 10 years’ experience with CT.
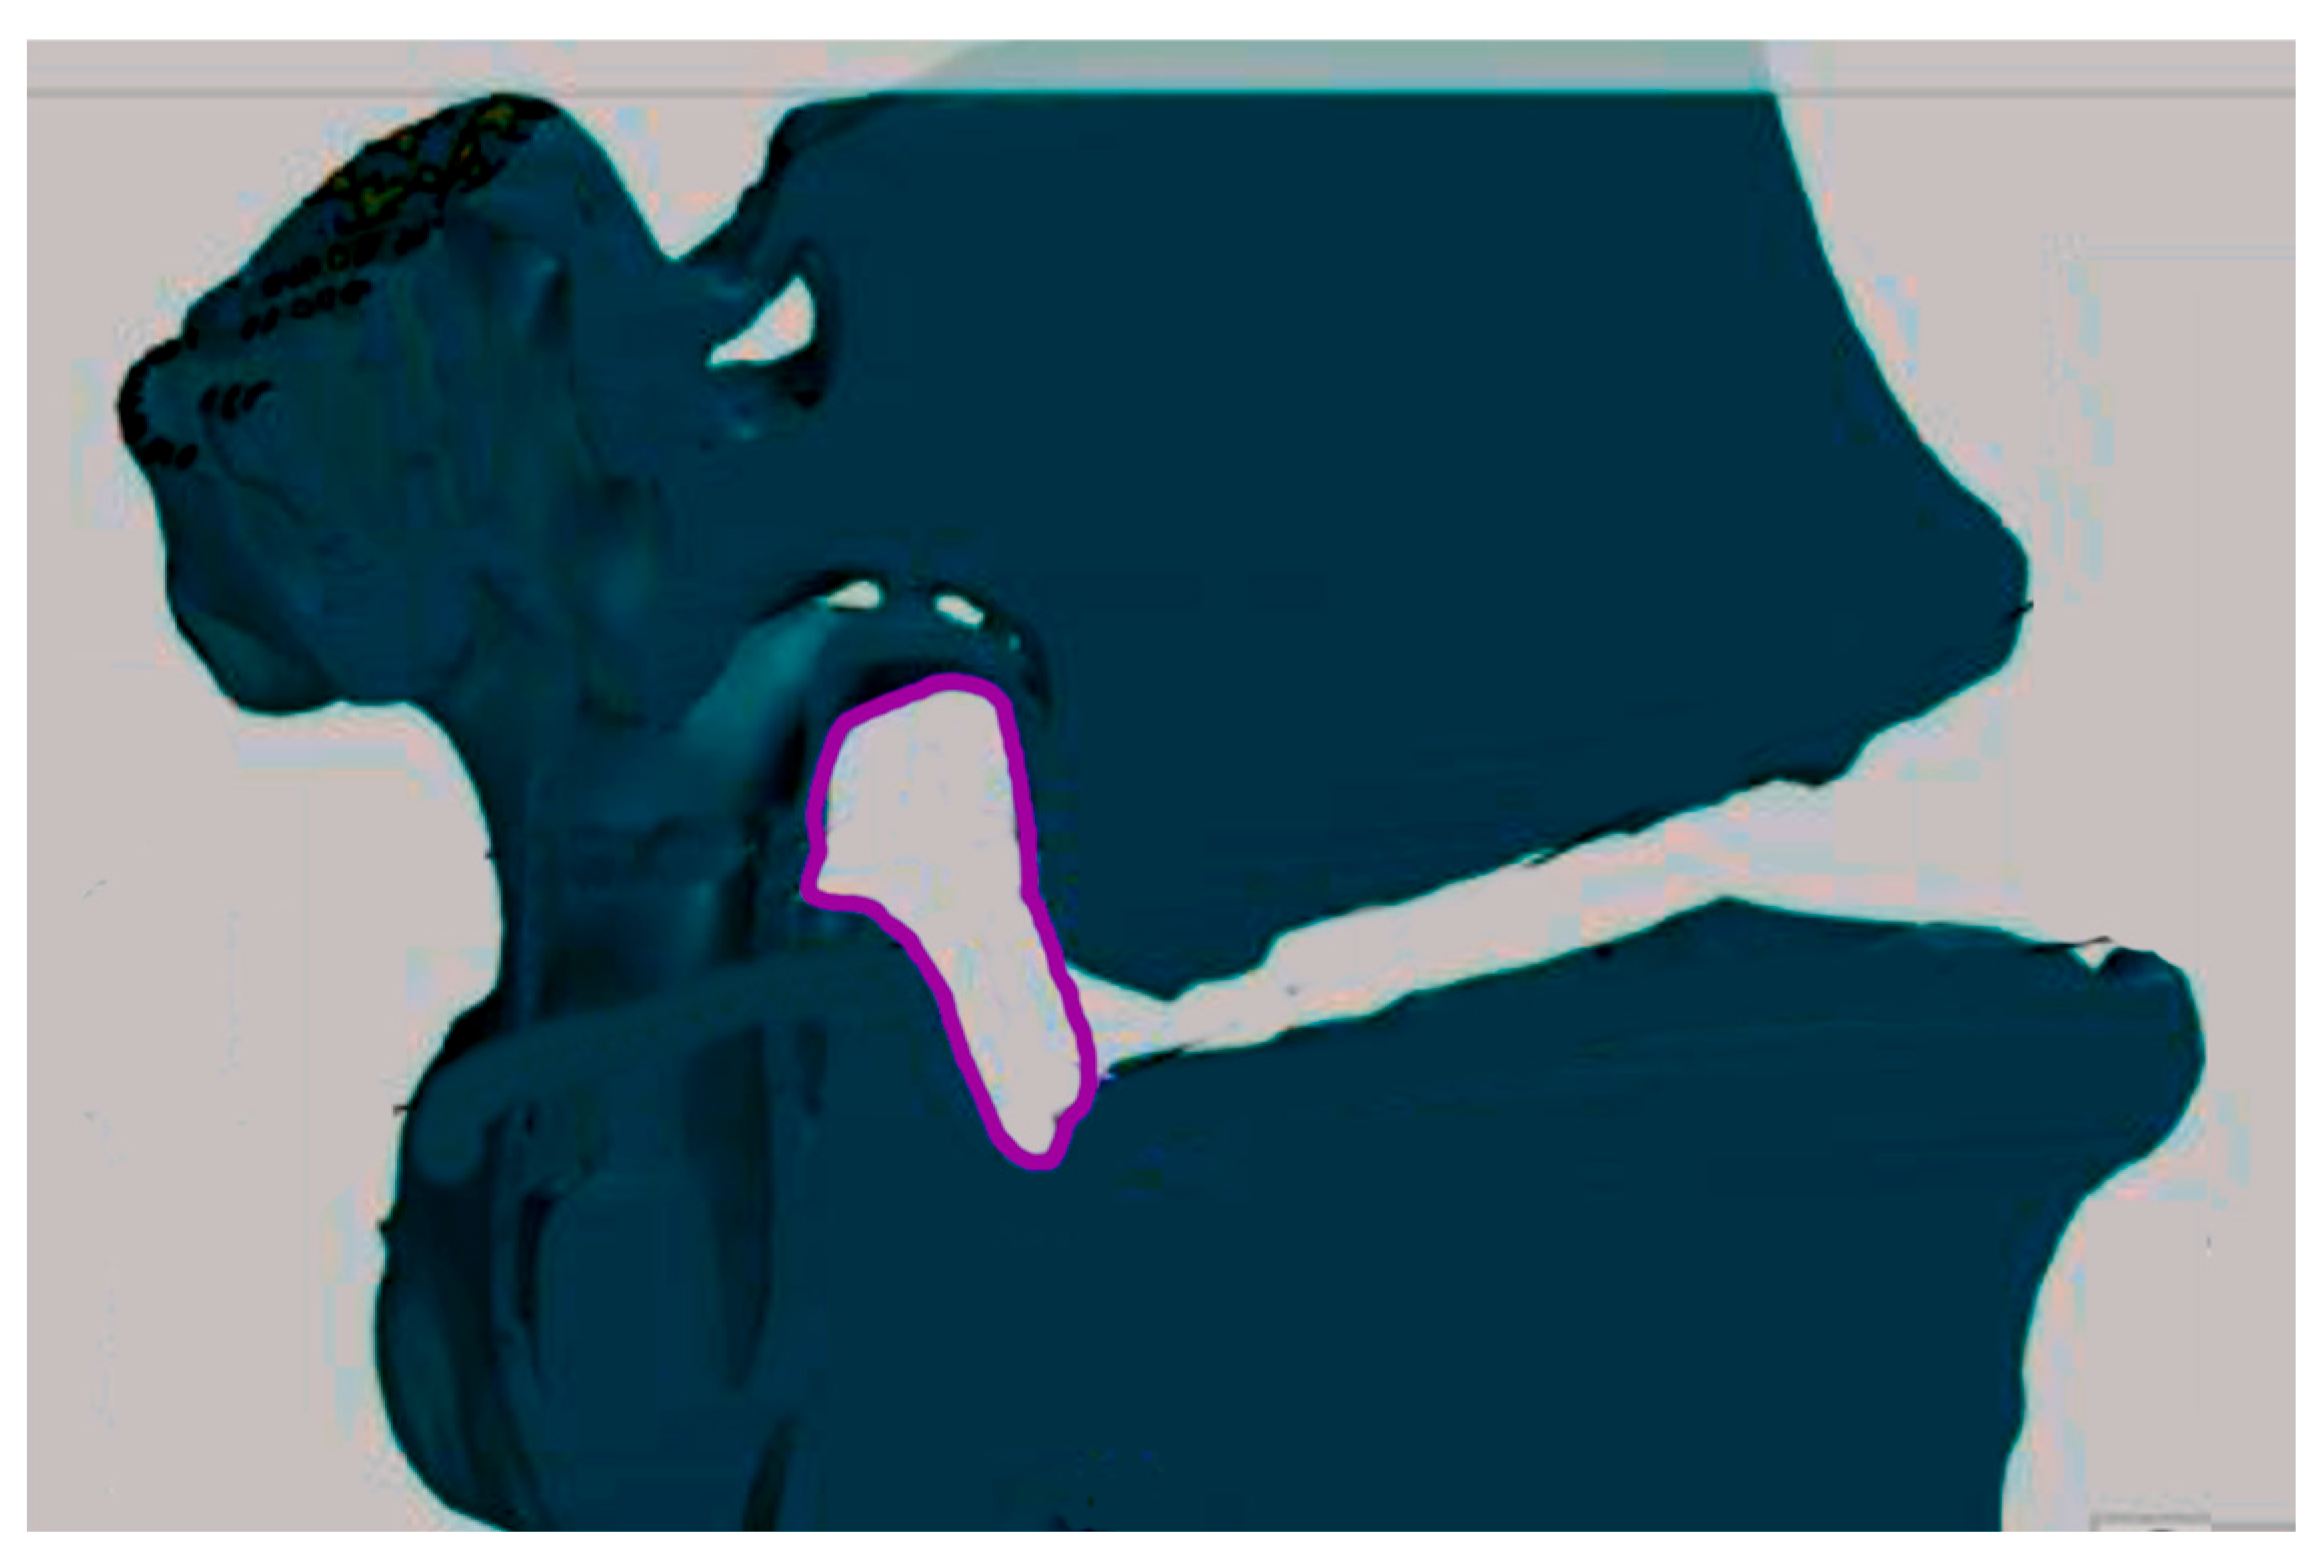
The surface area measurement method consisted of the following steps. In the first phase, the maximum vertical dimension of the L4/L5 root canal was determined. In the next stage of the measurement, the maximum vertical dimension of the root canal L4/L5 was applied to the visualization of the cross-section. Knowing the vertical dimension of the channel is expressed in mm, we calculated how many pixels fit in a square with a side equal to the vertical dimension. In this way, the scale was established as the number of pixels that fit in 1 mm
2 of the area in the cross-section visualization. In the last phase of the research, the cross-sectional area obtained was marked with a loop (
Figure 2) and information on the number of pixels corresponding to the area of the selected area on the visualization was read. Then, using the proportion, the surface area of the intervertebral foramen cross section was calculated. We applied same procedure for L5/S1 root canal.
Sections I–III were defined as follows:
- I.
Halfway from the medial border of the root canal and the medial axis of the pedicle;
- II.
In the medial axis of the vertebral epiphysis;
- III.
Halfway from the lateral border of the root canal and the medial axis of the vertebral epiphysis
The dimensions of the cross-sections are given in mm, and the surface area in mm2. The study population was divided into two age groups. The first was made up of people under 50, the second was made up of people over 50.
2.3. Segmentation
Segmentation was performed with a manual painter (sphere brush) (Slicer 3D). Once the segmentation mask was obtained, it was rendered into a 3D model.
2.4. Statistical Analysis
The analysis used Statistica software (Version 13.0, StatSoft Inc., Tulsa, OK, USA). To compare the impact of various factors on measurements of the intervertebral foramen, we used a Mann–Whitney U-test (p < 0.05). In addition, we determined the Spearman’s rank correlation between measurements of the intervertebral foramen.
3. Results
The study population consisted of 89 people.
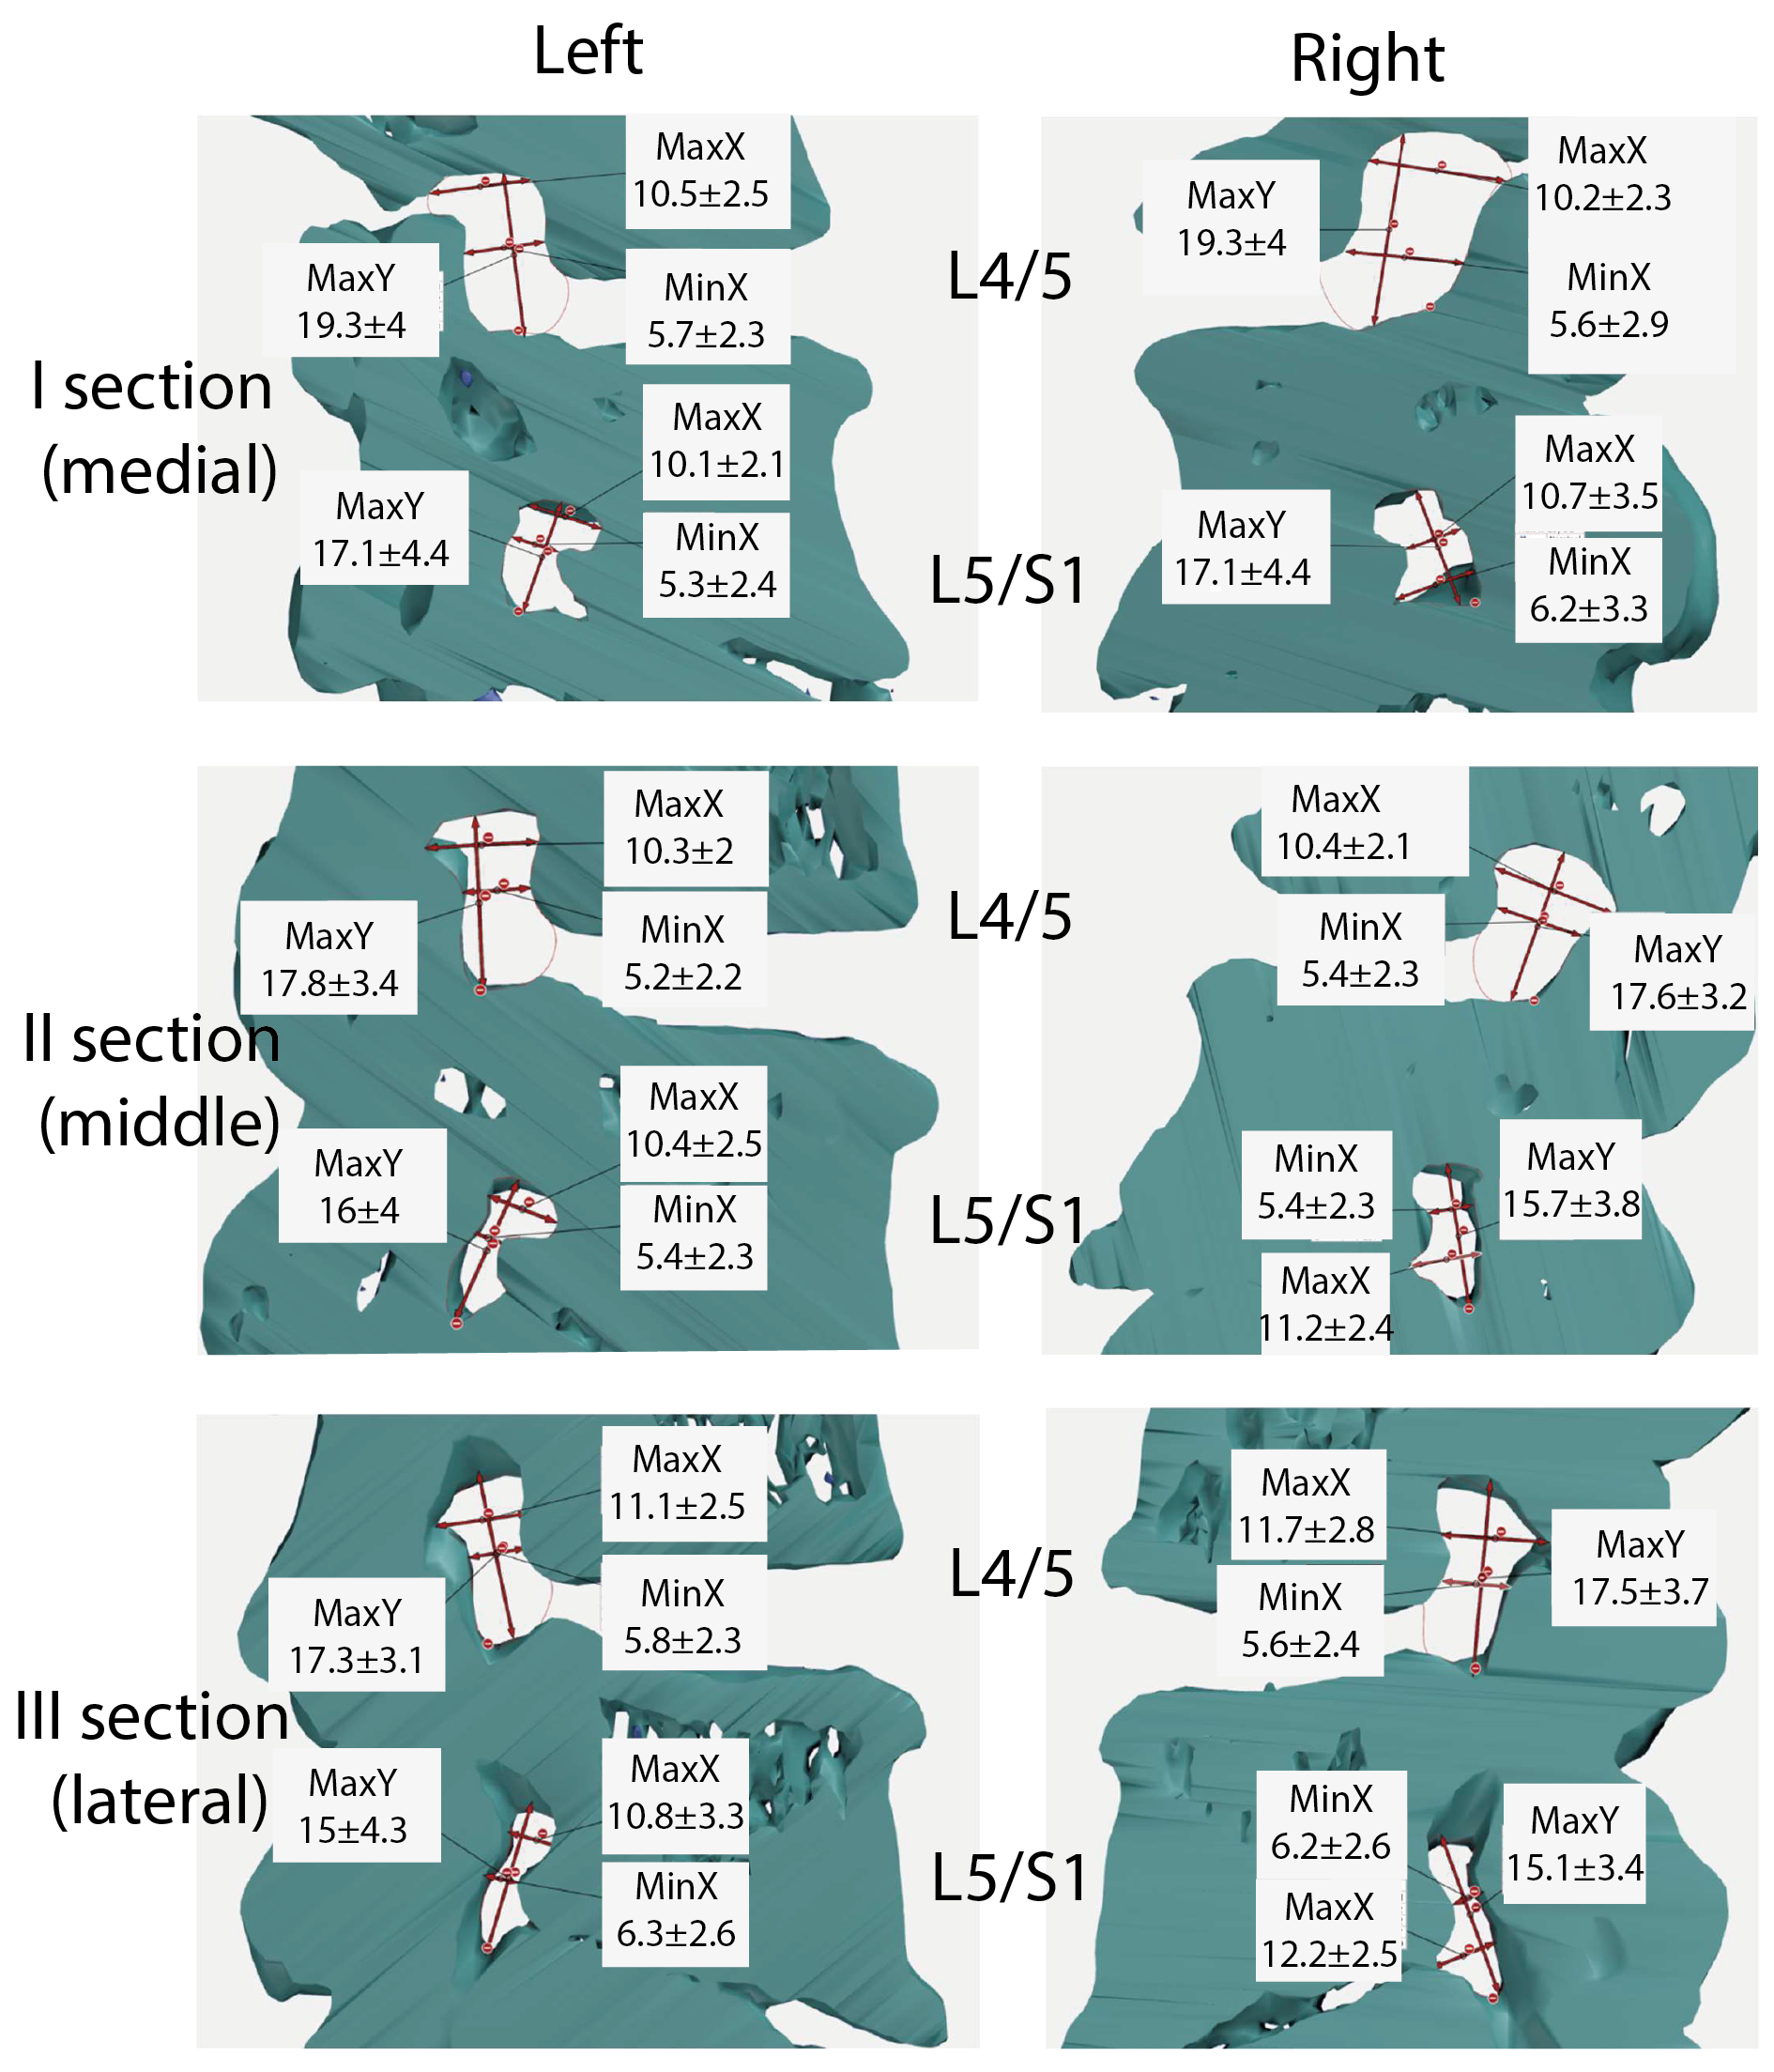
Table 1 presents the general measurement values for motor segments L4/5 and L5/S1. This table includes data on the maximum horizontal value (MaxX), maximum vertical value (MaxY), minimum horizontal value (MinX), perimeter, and area. The left- and right-side results are shown for each segment. I–III indicate the numbers of the cross-sections used for the tests. In the L4/5 motion segment, the maximum value for MaxX was found in section III and was 11.7 mm for the right side and 11.1 mm for the left side. Similar patterns were found in the L5/S1 motion segment. MaxX had the highest value in section III and it was 12.2 mm (right side) and 10.8 mm (left side). The minimum value in the L4/5 movement segment is 10.3 mm, which was found in the second section (left side). For the L5/S1 segment, the minimum value was observed in the first section (left side) and this was 10.1 mm.
For Max Y, the maximum value was observed in I sections. For the L4/5 motion segment, it was 18.8 mm (right) and 19.3 mm (left sides), while in the L5/S1 motion segment, the maximum was 17.2 mm (right side) and 17.1 mm (left side). The smallest dimension was found in section III (left side). Its value was 17.3 mm. On the other hand, for the L5/S1 motion segment, the minimum value of Max Y was 15 mm (left side).
If the MinX parameter is taken into account, its highest L4/5 value was observed in the III section. This was 5.8 mm (right side). On the other hand, in the L5/S1 motion segment, it was 6.7 mm (right side, section II). The minimum MinX value for the L4/5 motion segment was 5.2 mm (left side, section II); in the L5/S1 motion segment, it was 5.3 mm.
The maximum value for the L4/5 circumference was found in segment I and this was 54.8 mm (section I). The minimum was observed in the case of section II and this was 51 mm. In the L5/S1 motor segment, the maximum value was 51× mm (right side, section I) and the minimum value was 47.3 mm (left side, section II).
In the case of surface area, the highest value of this indicator was found in section I and this amounted to 173.9 mm2 (right side); the minimum value was observed on the right side and this was 156.4 mm2 (section II). For the L5/S1 motor segment, the maximum value was 158.9 mm2, which was found in section III (right side). In turn, the minimum value was 140.3 mm2 (left side, II section).
Table S1 presents the results for the L4/5 motor segment, taking into account the gender criterion. Referring to the data related to the perimeter and surface area, differences in the average values of the mentioned parameters can be noticed. In women, in each analyzed cross-section, both the circumference and the surface area had a higher value. The site did not matter in this case.
Table S2 presents the results for the L5/S1 motor segment, taking into account the gender criterion. In the male population, the mean circumference values were higher. For cross-sectional areas, higher values were noted in the female population.
Tables S3 and S4 present the results for the motor segments L4/5 and L5/S1, taking into account the age criterion. In the case of the L4/5 motor segment, age turned out to be a factor that influenced the value of the circumference. In the younger population, the circumference values for individual sections were higher. In the context of surface areas, such a relationship was observed for sections II and III. With regard to the motor segment L5/S1, it can be stated that the values of surface areas were higher in the younger population (excluding section I). The situation was similar in the context of circumference. In the older population, the mean circumference was only higher in section I (left side). Based on these results, it can be concluded that age and gender may be factors that affect the value of dimensions related to surface area and circumference.
In the subsequent part of this study, correlations between dimensions in individual sections will be shown.
Tables S5–S7 present the Spearman’s correlation coefficients for the measurement results (in mm) according to the L4/5 and L5/S1 motor section for sections I–III. In all cross-sections, significant positive correlations (
p > 0.5) were found between the right and left sides between individual measurements in segment L4/5 and L5/S1, except for MaxX in cross-section II in L5/S1 (0.2).
The surface area correlated significantly and positively with the circumference in all cross-sections in the L4/5 and L5/S1 segments. This means that the larger the surface area, the higher the perimeter. Such a relationship is a prognostic indicator helpful in the process of diagnosing a patient with spinal canal stenosis. Based on this correlation, it can be concluded that the bony shape of the canals at individual levels was similar in the study population; greater irregularity would result in a lack of correlation between the surface area and the circumference. However, no such correlation with MinX was demonstrated. MaxX and MaxY positively correlated with the area in the L4/5 segment on the right and left. In the L5/S1 segment, MaxX and MaxY positively correlated with the surface area on the right side, while, on the left side, the values of the coefficient amounted to a maximum of 0.6, and there was no significant correlation between MaxX/Area in sections I and III.
In
Tables S8–S13, the influence of gender on the correlation between individual measurements is analyzed.
Table S8 presents the results of the correlation between the L4/5 and L5/S1 segments (
Section 1) in the female population. The obtained data indicate the occurrence of correlations between measurements. It has been shown that the surface area (on the right side) correlates, among others, with the circumference. The same relationship is observed for the circumference and area on the left side. Positive correlations between individuals in the female population were also observed in
Section 2 and
Section 3 (
Tables S10 and S12). In the male population (
Tables S9, S11 and S13), there were also correlations between measurements for individual segments.
Tables S14–S19 contain data that present the strength of the correlation between individual segments, taking into account the age criterion. In individual sections, the occurrence of positive correlations between individual measurements in the age groups created for the purpose of the analysis was demonstrated. Such data made it possible to determine that age is an element that can affect the correlations between individual dimensions.
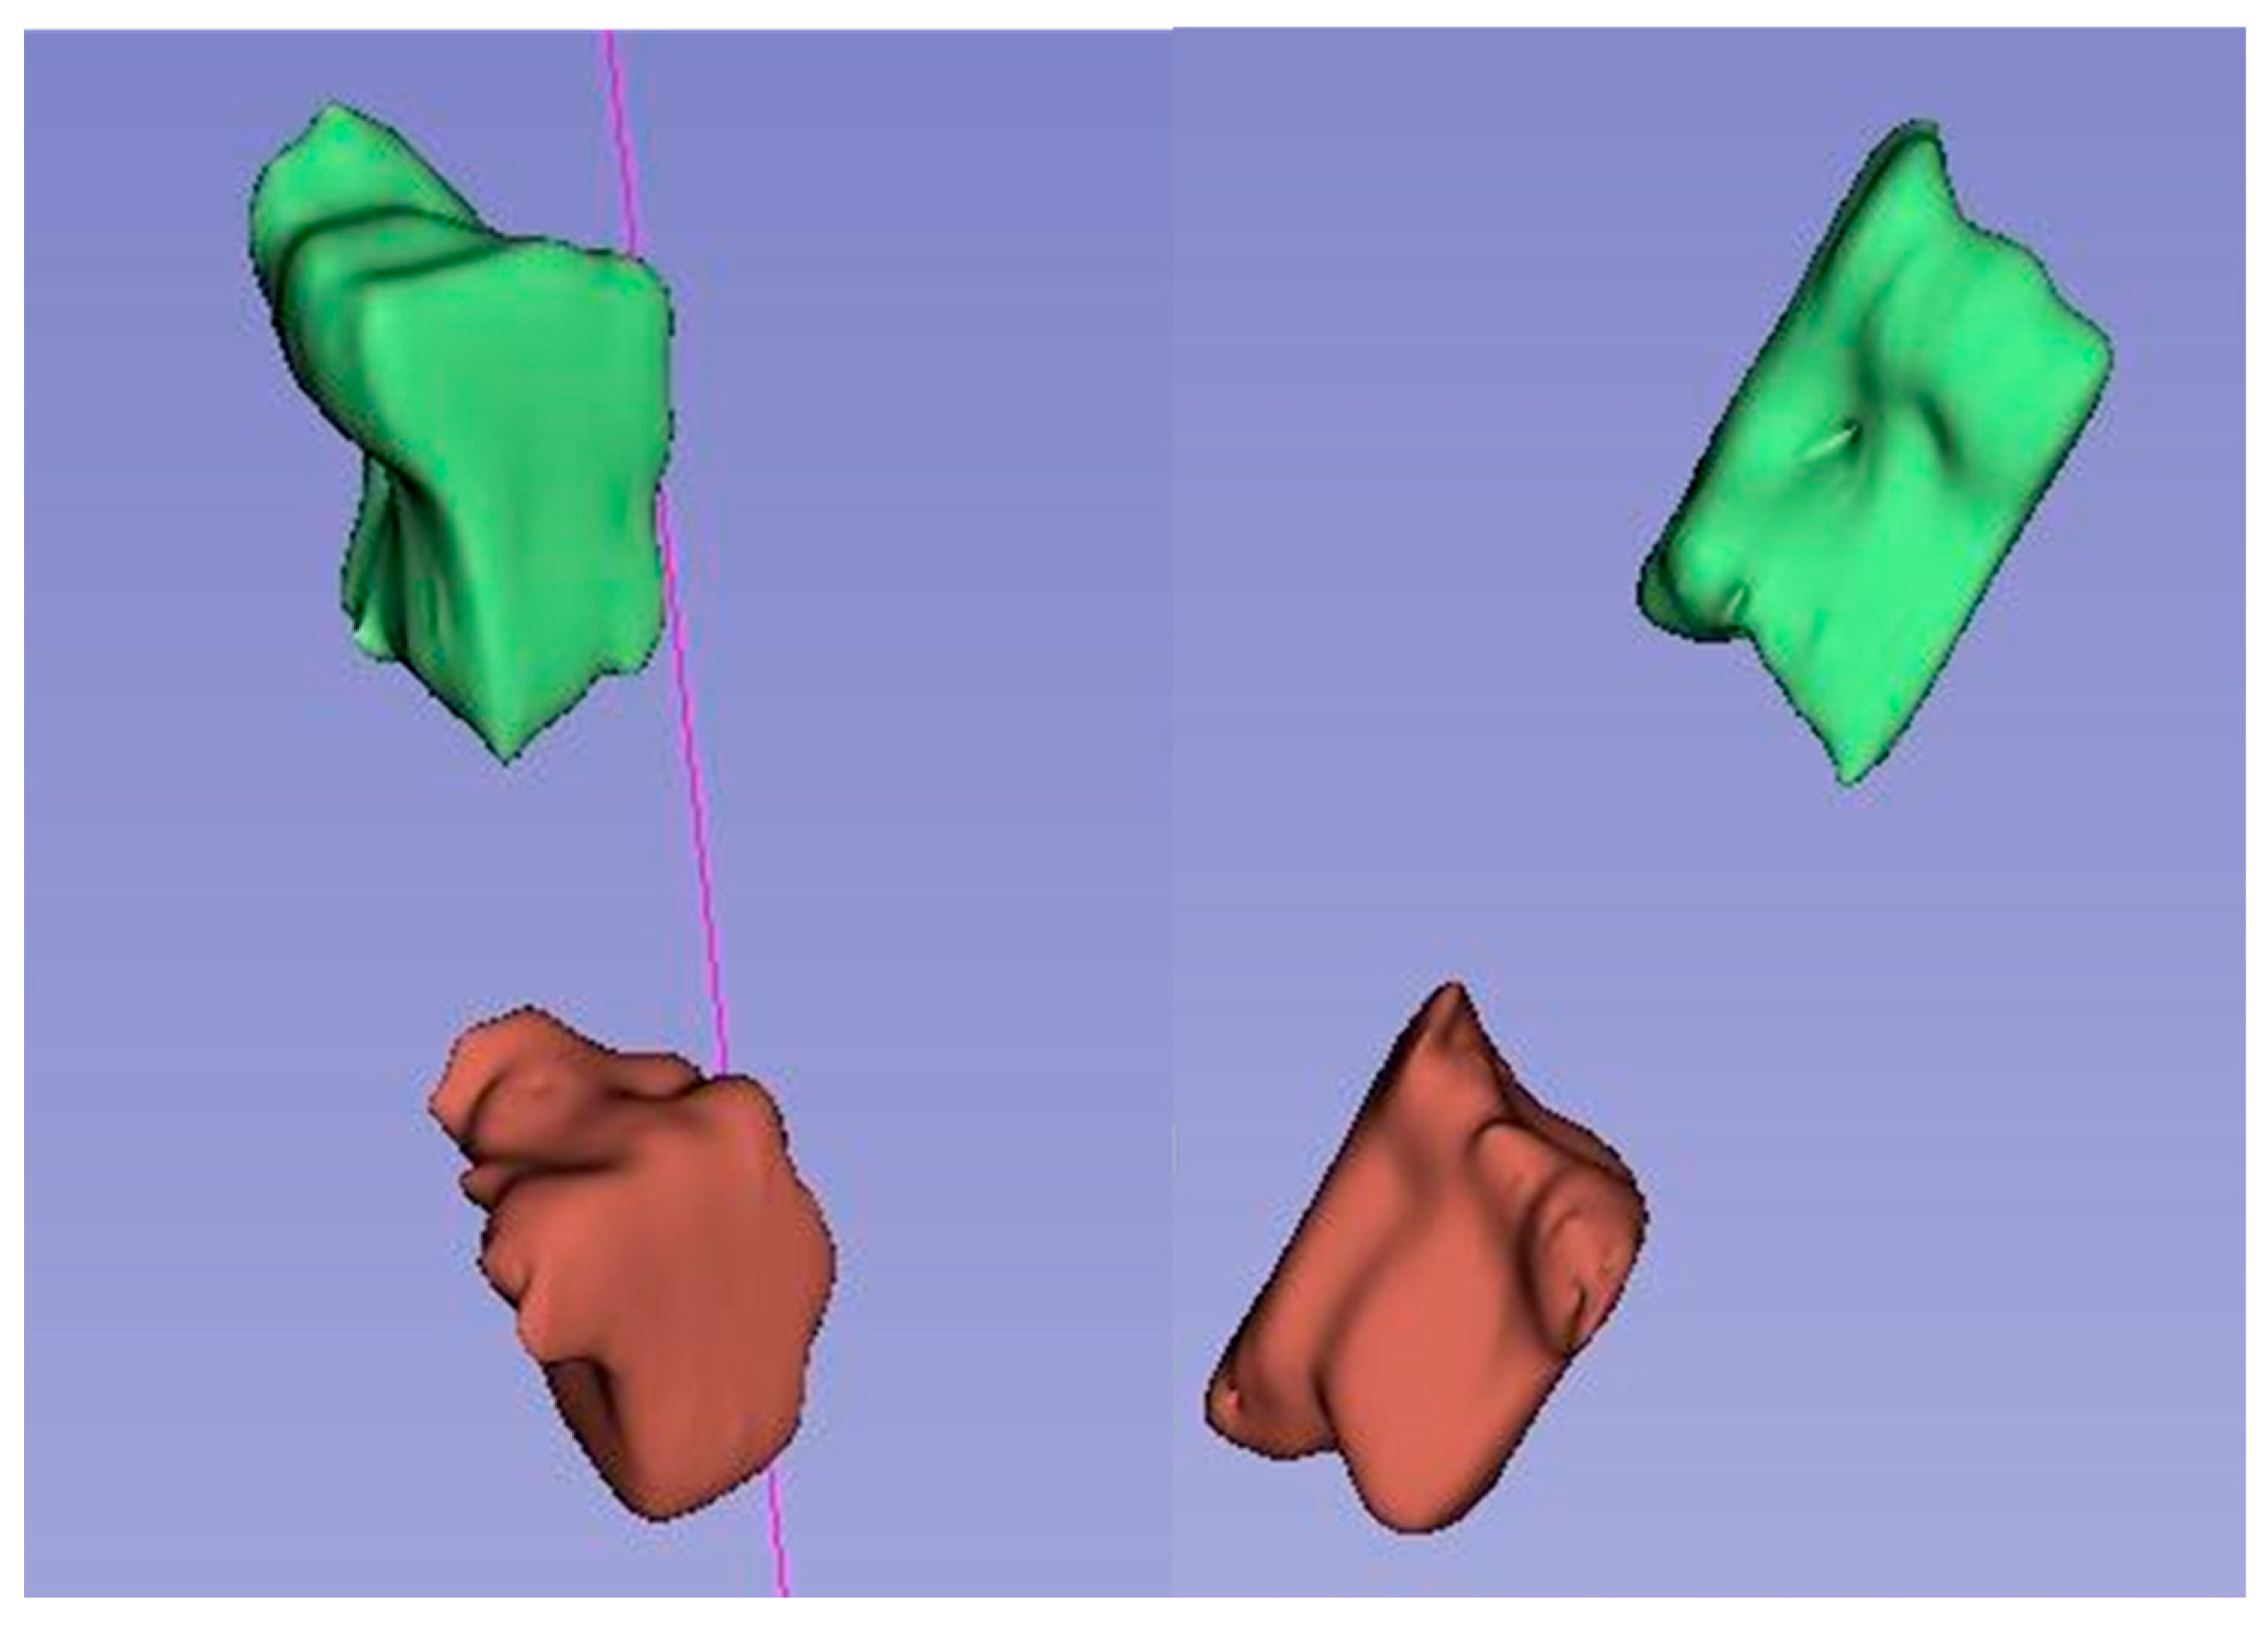
Based on the obtained average measurement results, three-dimensional models of intervertebral canals at individual levels were created in order to better visualize their complicated spatial structure and the variability in dimensions in their course.
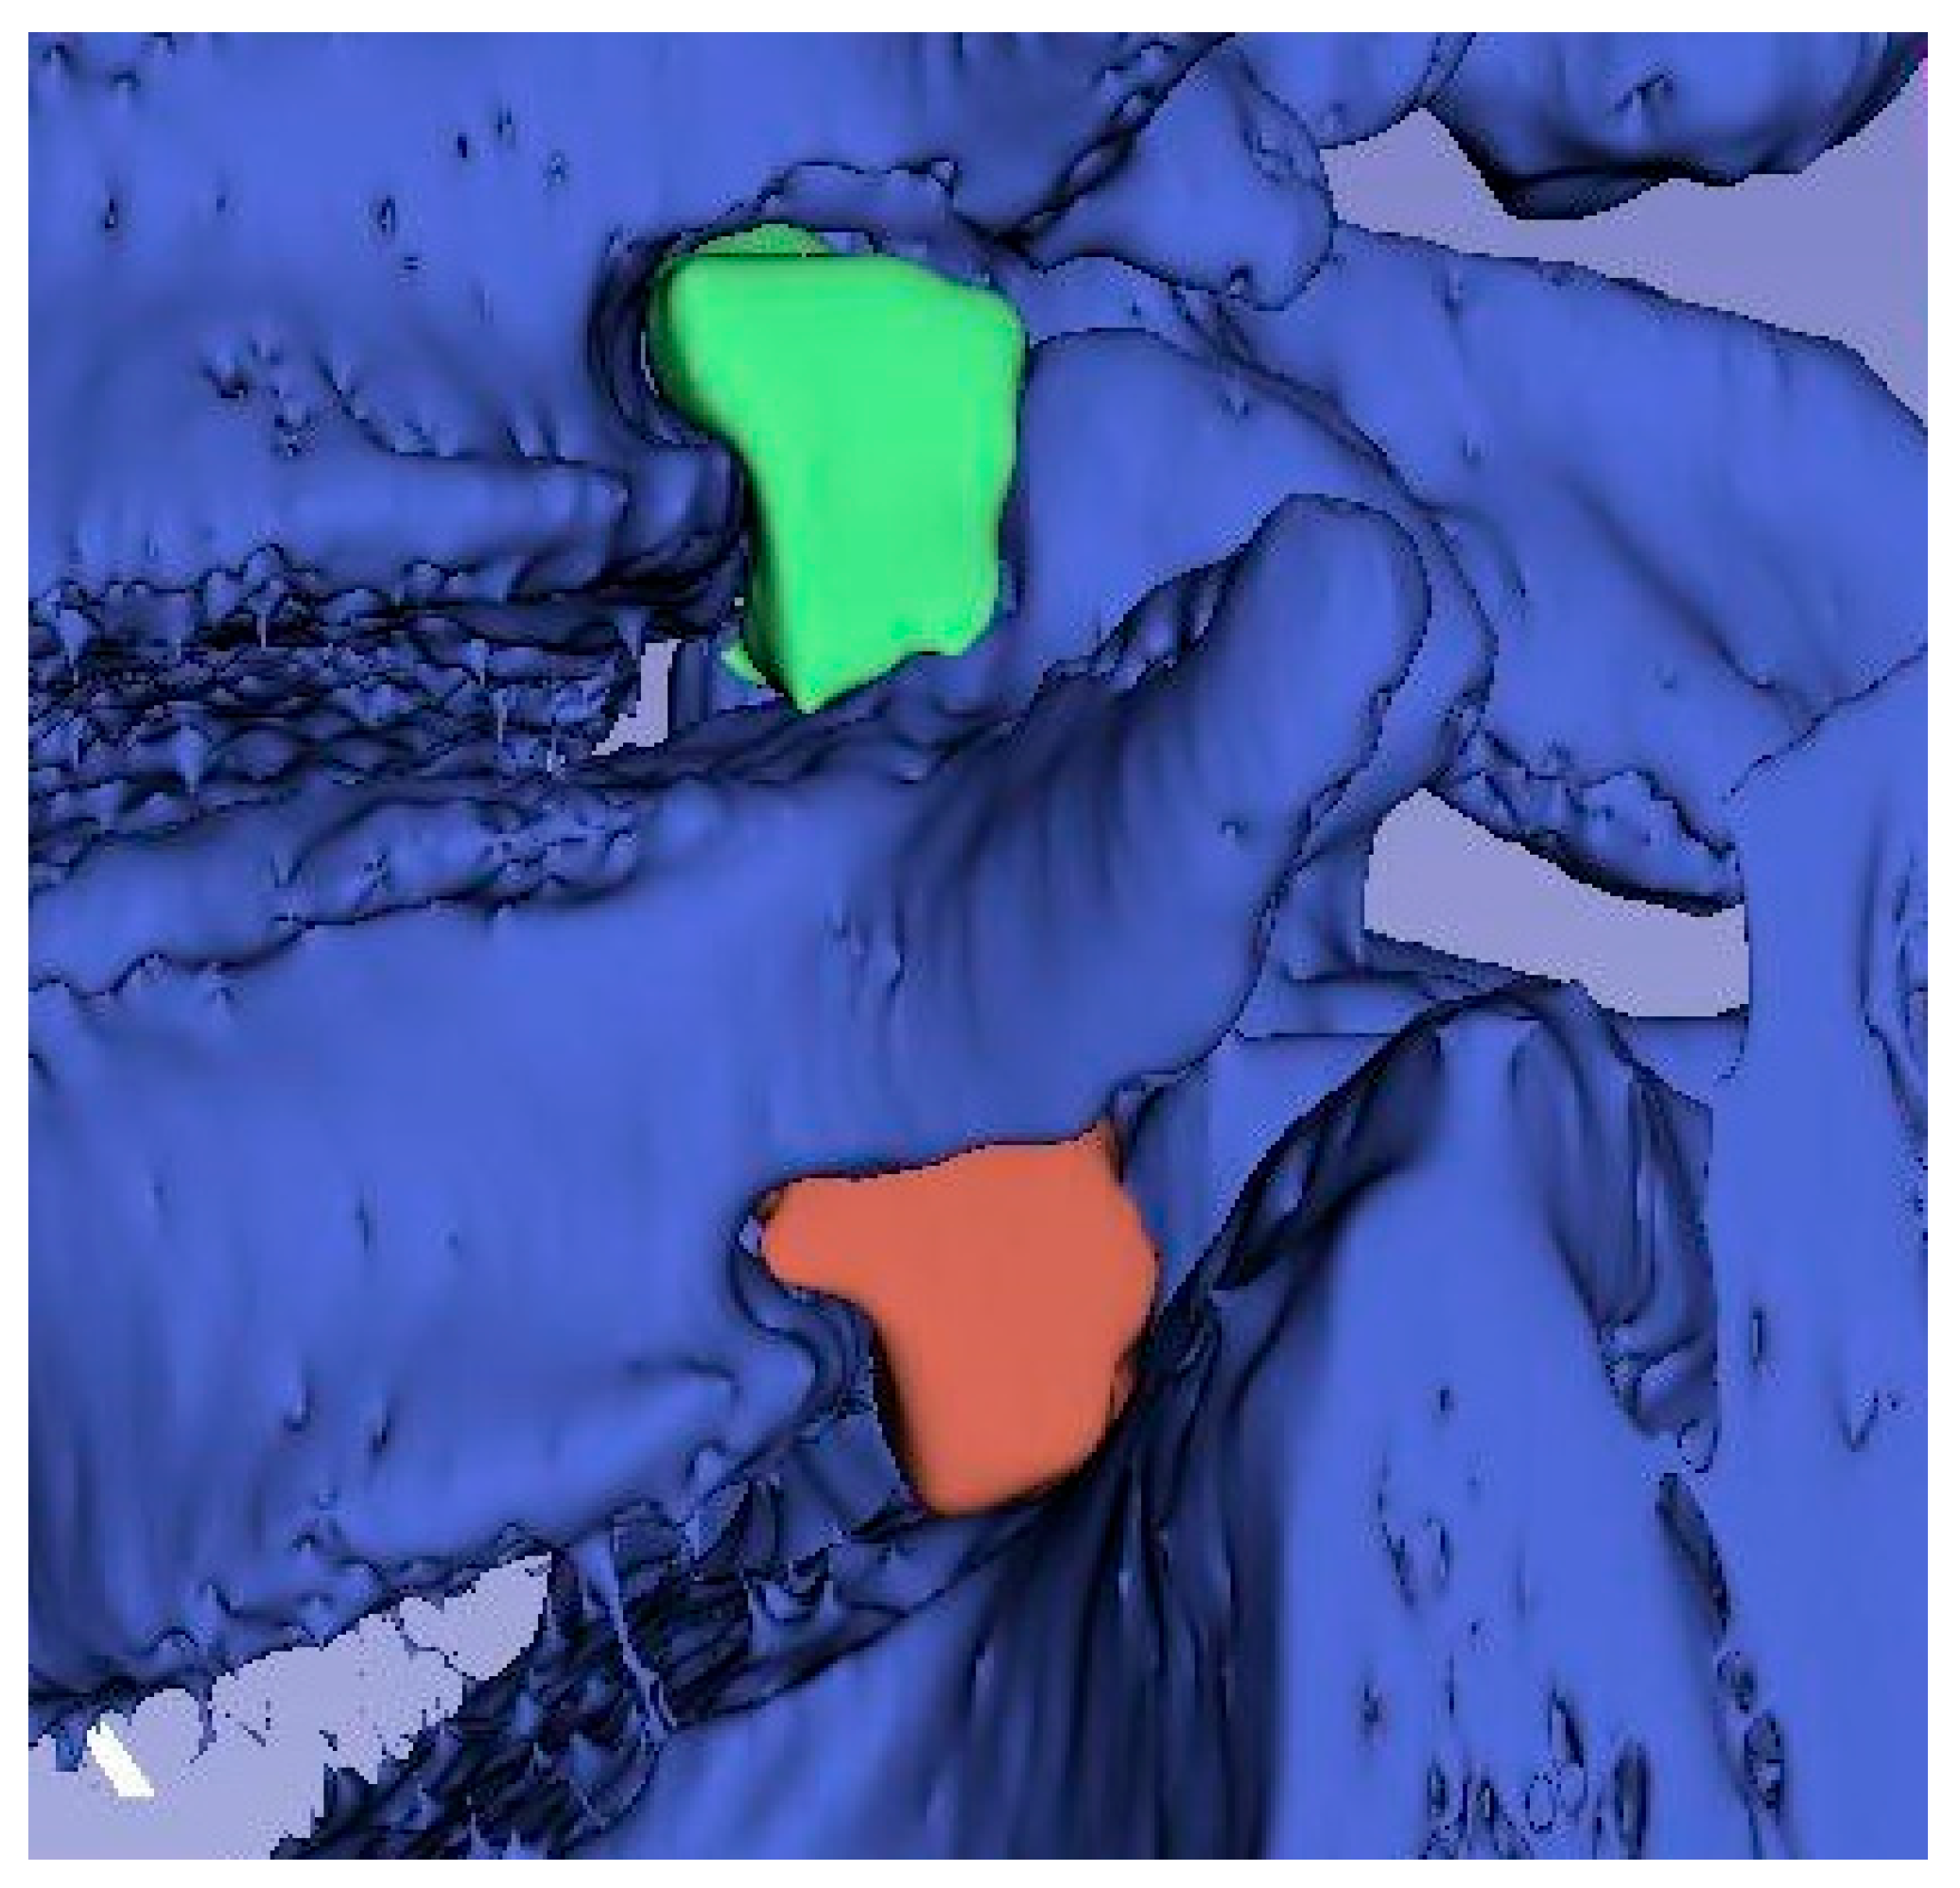
Figure 3 visualizes the average dimensions of the canals at individual levels and cross-sections, while
Figure 4,
Figure 5 and
Figure 6 show exemplary 3D reconstructions of intervertebral canals at each level. According to the researchers, the obtained shape of the models correlates with the previous measurement results.
4. Discussion
Osteoarthritis of the spine is currently a significant medical problem, especially in the context of the growing problem of an aging population. It is also important to strive to improve the quality of life of patients struggling with this disease. The main goal of the interventions undertaken is to relieve pain or significantly reduce it. However, surgical procedures do not always bring the expected results. This is due to inadequate qualifications for the procedure and the presence of individual risk factors in patients, such as comorbidities, factors related to mental state (depression), high BMI or smoking [
16].
An important problem is also the correlation of anatomical abnormalities observed in radiological examinations with clinical symptoms [
17].
In improving diagnostics, the possibility of using modern technologies in this process are important elements determining research activities in which attention is focused on the dimensions of the intervertebral foramens. It becomes important to establish the pathological factors that contribute to the compression of the nerve roots and thus the appearance of pain in the patient. Over the decades, the process of diagnosing back pain has developed significantly.
This was related to the greater availability of modern technologies in research practice. Morphometry has also benefited from the use of modern tools. The correlation between the results of radiological examinations and symptoms reported by patients is poorly recognized in the literature. There are no studies dealing with this topic in more detail. The ambition of the research conducted in this work was to establish such relationships. The authors were aware that identifying prognostic factors could influence the decision to perform surgery, as well as improve the clinical results of the procedures performed and thus have a positive impact on the quality of life of patients.
This article presents the results of research conducted on a group of 89 patients struggling with lower back pain. The main attention was focused on the surface area of individual cross-sections of the intervertebral foramen. Three cross-sections were developed with the help of 3D reconstruction tools and these were left- and right-sided cross-sections. The collected research material proved the correlation between the surface area and the circumference. The occurrence of such a relationship likely causes less pressure on the nerve root, which may prove useful in the process of diagnosing patients complaining of back pain. Attention was also paid to the age and gender of the patients participating in the study. In the studies in which the values of radiological parameters were analyzed, it was indicated that the individual characteristics of patients may be elements that interfere with diagnostic procedures [
16]. In the course of our own research, we decided to analyze the influence of the sex and age of the respondents on the measurement values.
It has been shown in our study that there were positive correlations between individual measurements in the age groups created for the purpose of the analysis. Such data made it possible to determine that gender and age may affect the correlations between individual dimensions, which also have diagnostic value.
The prevalence of back pain is an important reason for conducting research aimed at even more accurately diagnosing the etiology of this type of disease. So far, the topic of the surface area of the intervertebral foramen, and its correlation with the other dimensions of this anatomical structure, have been poorly recognized. The research conducted shows that this is a direction that should be continued. Thanks to these, one can better understand the cause of pain, as well as the location of the pathology.
The issue of intervertebral foramen and their surface area has not been widely discussed in the literature. There is a lack of comprehensive research that addresses this issue in a holistic way. The topic of the dimensions of the intervertebral foramen appeared in the studies of Khalaf et al. [
18]. The authors assessed the surface area, vertical, and horizontal dimensions of the intervertebral foramen. They tried to determine whether gender could be a factor differentiating these dimensions. The topic of intervertebral foramen was also reported by Giles [
19], Fujiwara [
20], and Lin [
7]. The last of the studies cited showed that the anatomical parameters of the intervertebral foramen, assessed by preoperative MRI, were independently correlated with the results reported by patients with degenerative lumbar foramen stenosis. Reducing the width of the superior foramen was associated with better improvement in both functional status and quality of life after transforaminal lumbar interbody fusion (TLIF). The studies to date lack publications that would suggest significant associations between the anatomical parameters obtained from preoperative MRI and preoperative VAS results for leg pain, ODI, and EQ-5D. Sigmundsson et al. [
21] showed a weak correlation between the area of the dural sac and walking distance, ODI, SF-36, EQ-5D, and the level of back and leg pain in patients with spinal canal impingement [
21]. Kuittinen et al. (2014) also found no correlation between MRI results and symptoms or walking ability in patients with lumbar spinal stenosis [
22].
Yan et al. reported a change in the geometry of the L4/5 foramen with age in men. They showed that the height of the hole decreased in each sagittal plane with age, while the width of the hole showed no significant difference [
23].
Zhaoyang Qiu et al. analyzed the LS spine X-ray of healthy patients between 18 and 80 years of age. They found that the greatest changes in the shape of the intervertebral foramen occur in patients over 60 years of age compared to the population in the 40–60 bracket. The main changes were the parameters determined in relation to the upper articular process [
24].
According to some authors, the measurements of the intervertebral canals made on cadavers are very similar to those obtained using imaging methods such as CT and MRI. However, cadaver studies are usually limited by small research samples and results are inconsistent across different authors. In contrast, imaging studies provide the ability to assess larger groups of patients relatively more easily and reproducibly, and thus allow more reliable results for further comparisons and analyses [
24].
The measurement of intervertebral foramen (IVF) in the lumbar spine can be useful in clinical practice for several reasons, but its clinical significance may vary depending on the specific context and the patient’s clinical presentation. Surgeons may measure the IVF to plan surgical procedures. Accurate measurements of the IVF can help determine the surgical approach and guide the removal of any obstructions causing nerve compression. Measuring the intervertebral foramen can also be valuable for tracking the progress of a patient’s condition over time. It provides objective data to assess the effectiveness of treatments and whether the foramen has changed in size. In the field of spinal research, measurements of the intervertebral foramen can be valuable for studying spinal anatomy, pathophysiology, and treatment outcomes. Researchers can use these measurements to assess the impact of various interventions and contribute to the development of evidence-based clinical guidelines.
Research on the impact of surface area on the occurrence of pain should be continued. They should focus on issues related to the surface area of the intervertebral foramen and their impact on the nerve roots. Findings from such studies may help surgeons identify patients who will have a better prognosis after surgery.
The research carried out as part of this work had some limitations. The first was related to the relatively small research population. This fact was determined by the use of restrictive inclusion criteria in the study. The classification carried out at the inclusion stage in the studies made it possible to select patients who would fit their purpose. Another limitation of the study is the exclusive assessment of the bony morphology of the hole, which does not include the intervertebral disc and ligaments. Soft tissues should be included in future studies in order to gain more knowledge about the intervertebral foramen. Moreover, the primary CT data were only collected in the supine position, with no dynamic or axial positions. The morphology of the intervertebral foramen would change with position. A certain limitation is that the literature on the subject lacks data to which it would be possible to refer to for obtained results. Despite this, our research is of great value as it indicates a potential cause of pain and it should therefore be developed more widely.
5. Conclusions
This research aimed to investigate the relationships between the morphometric characteristics of intervertebral foramina at specific spinal levels and how factors such as age and sex affect these dimensions. The results demonstrated a significant correlation between the size and shape of the intervertebral foramina and these demographic variables, suggesting that understanding these variations is crucial for diagnosing and treating spinal conditions. Utilizing measurements and three-dimensional imaging techniques, the study mapped out the anatomical structure of the intervertebral foramina at the L4/L5 and L5/S1 motor segments, focusing on their bony configurations. Further exploration into how dynamic spinal movements and physiological loads influence these structures could provide deeper insights, potentially leading to more effective interventions for conditions affecting the intervertebral foramen.


