Article

Low-Light Mine Image Enhancement Algorithm Based on Improved Retinex

1
College of Communication and Information Technology, Xi’an University of Science and Technology, Xi’an 710054, China
2
Xi’an Key Laboratory of Network Convergence Communication, Xi’an 710054, China
*
Author to whom correspondence should be addressed.
Appl. Sci. 2024, 14(5), 2213; https://doi.org/10.3390/app14052213
Submission received: 28 January 2024 / Revised: 27 February 2024 / Accepted: 29 February 2024 / Published: 6 March 2024
(This article belongs to the Section Electrical, Electronics and Communications Engineering)

Abstract

:
Aiming at solving the problems of local halo blurring, insufficient edge detail preservation, and serious noise in traditional image enhancement algorithms, an improved Retinex algorithm for low-light mine image enhancement is proposed. Firstly, in HSV color space, the hue component remains unmodified, and the improved multi-scale guided filtering and Retinex algorithm are combined to estimate the illumination and reflection components from the brightness component. Secondly, the illumination component is equalized using the Weber–Fechner law, and the contrast limited adaptive histogram equalization (CLAHE) is fused with the improved guided filtering for the brightness enhancement and denoising of reflection component. Then, the saturation component is adaptively stretched. Finally, it is converted back to RGB space to obtain the enhanced image. By comparing with single-scale Retinex (SSR) algorithm and multi-scale Retinex (MSR) algorithm, the mean, standard deviation, information entropy, average gradient, peak signal-to-noise ratio (PSNR), and structural similarity (SSIM) are improved by an average of 50.55%, 19.32%, 3.08%, 28.34%, 29.10%, and 22.97%. The experimental dates demonstrate that the algorithm improves image brightness, prevents halo artifacts while retaining edge details, reduces the effect of noise, and provides some theoretical references for low-light image enhancement.

1. Introduction

Video monitoring is one of the several important means of coal mine safety management; however, the quality of the video monitoring images is poor due to the influence of light, dust, and water mist. Traditional algorithms for enhancement are liable to halo blurring, unclear edge details, and noise pollution, which reduces the effectiveness of the information contained in the image [1], thereby affecting the performance of the video monitoring system. Therefore, improving the visibility of mine images in low-light conditions is essential, which is also a prerequisite for improving the performance of the subsequent analysis and recognition of video images.
In recent years, many methods have been suggested by researchers to address the problem of enhancing mine images, which can be roughly divided into two types, those in the spatial domain and those in the frequency domain. Among them, the introduction of the Retinex algorithm has significantly enhanced the performance of image enhancement in coal mines, and researchers have conducted many studies based on this algorithm. Most of the coal mine image enhancement algorithms are rooted in the theory of Retinex, predominantly include single-scale Retinex [2], multi-scale Retinex [3], and multi-scale Retinex with color restoration (MSRCR) [4]. The Retinex algorithm can improve image contrast and enrich detail in images [5], but it results in excessive enhancement and color imbalances. Wang et al. [6] introduced a method based on a nonlinear function that is based on the Retinex algorithm. Using a Gaussian filter to obtain the illumination component and constructing a nonlinear function for contrast enhancement, the enhanced image and the initial image are integrated to improve the contrast and reduce the impact of uneven lighting. Liu et al. [7] used a linear function to stretch the grayscale range of the brightness component, which was based on the Retinex algorithm model, and used a mapping function to perform color correction on the saturation component, avoiding the problem of low image contrast and achieving global enhancement. Wang et al. [8] proposed a method that combines Gabor filter with the principles of Retinex theory, which isolates the intensity component from the HSI space and enhances it with MSRCR, and then the SSR algorithm is applied using Gabor filter on the image in the RGB space. The weighted fusion of the images is consequently enhanced by the two different methods, which avoids an over-enhancement of the image. Lin et al. [9] proposed a Retinex framework that utilizes bilateral filtering to extract the reflection component in the HSI space, then transfers the image back to the RGB space to enhance it by combining a modified framework model with Gaussian pyramid transform, which reduces the blurring phenomenon and improves the quality of the image. Shang et al. [10] presented an adaptive image enhancement technique that utilizes the Retinex algorithm along with guided filtering to process the V component in the HSV space; it performs color compensation for saturation component, histogram equalization on the initial image to improve the contrast, and a fusion processing of the two, which is richer in information and increases the details. The above analysis shows that, although the current algorithms have the capability to improve the image brightness, they still have problems, such as the blurring of local halos and difficulty in retaining edge details.
To address the above problems, this paper proposes an improved image enhancement algorithm. The algorithm processes the different components separately in HSV color space, and finally converts them back to the RGB space. The above process mainly includes three parts: (1) an estimation of the illumination and reflection components from the brightness component; (2) brightness enhancement and denoising on illumination and reflection components; and (3) color correction is applied to the saturation component. The main contributions of this paper are as follows:
(1)
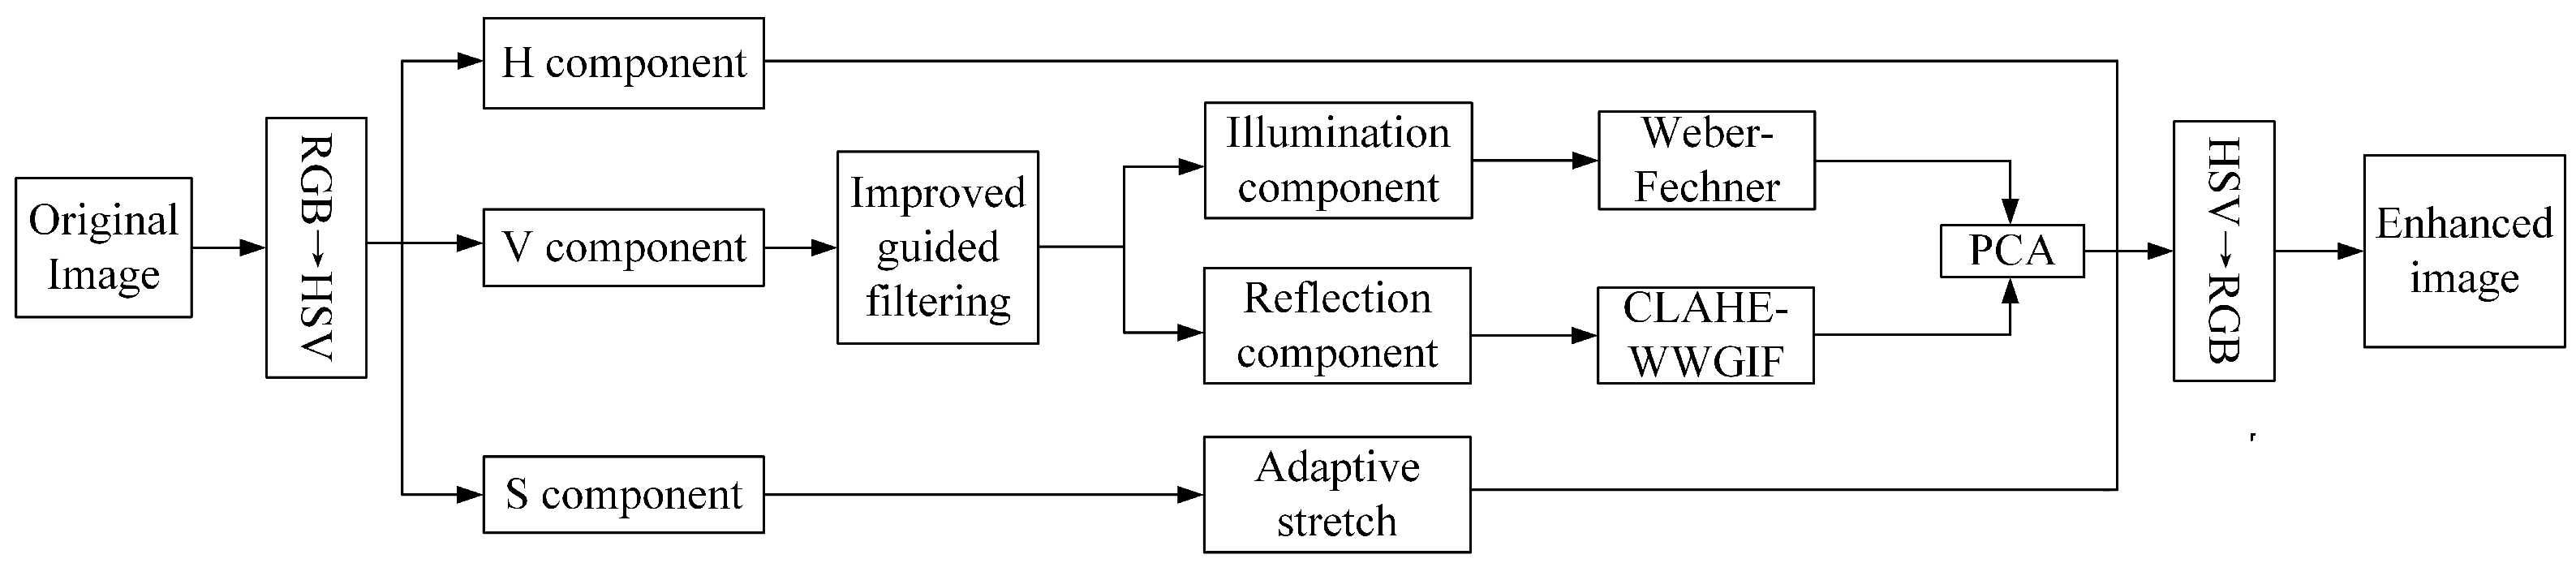
An improved guided filtering algorithm is proposed to replace the Gaussian filter in the Retinex algorithm to more accurately estimate the illumination component and reflection component from the brightness component.
(2)
Fusion of the contrast-limited adaptive histogram equalization algorithm and the improved guided filtering algorithm to process the reflection component to achieve brightness enhancement and denoising at the same time.
(3)
Propose an improved adaptive stretching method to process the saturation component to avoid color distortion.
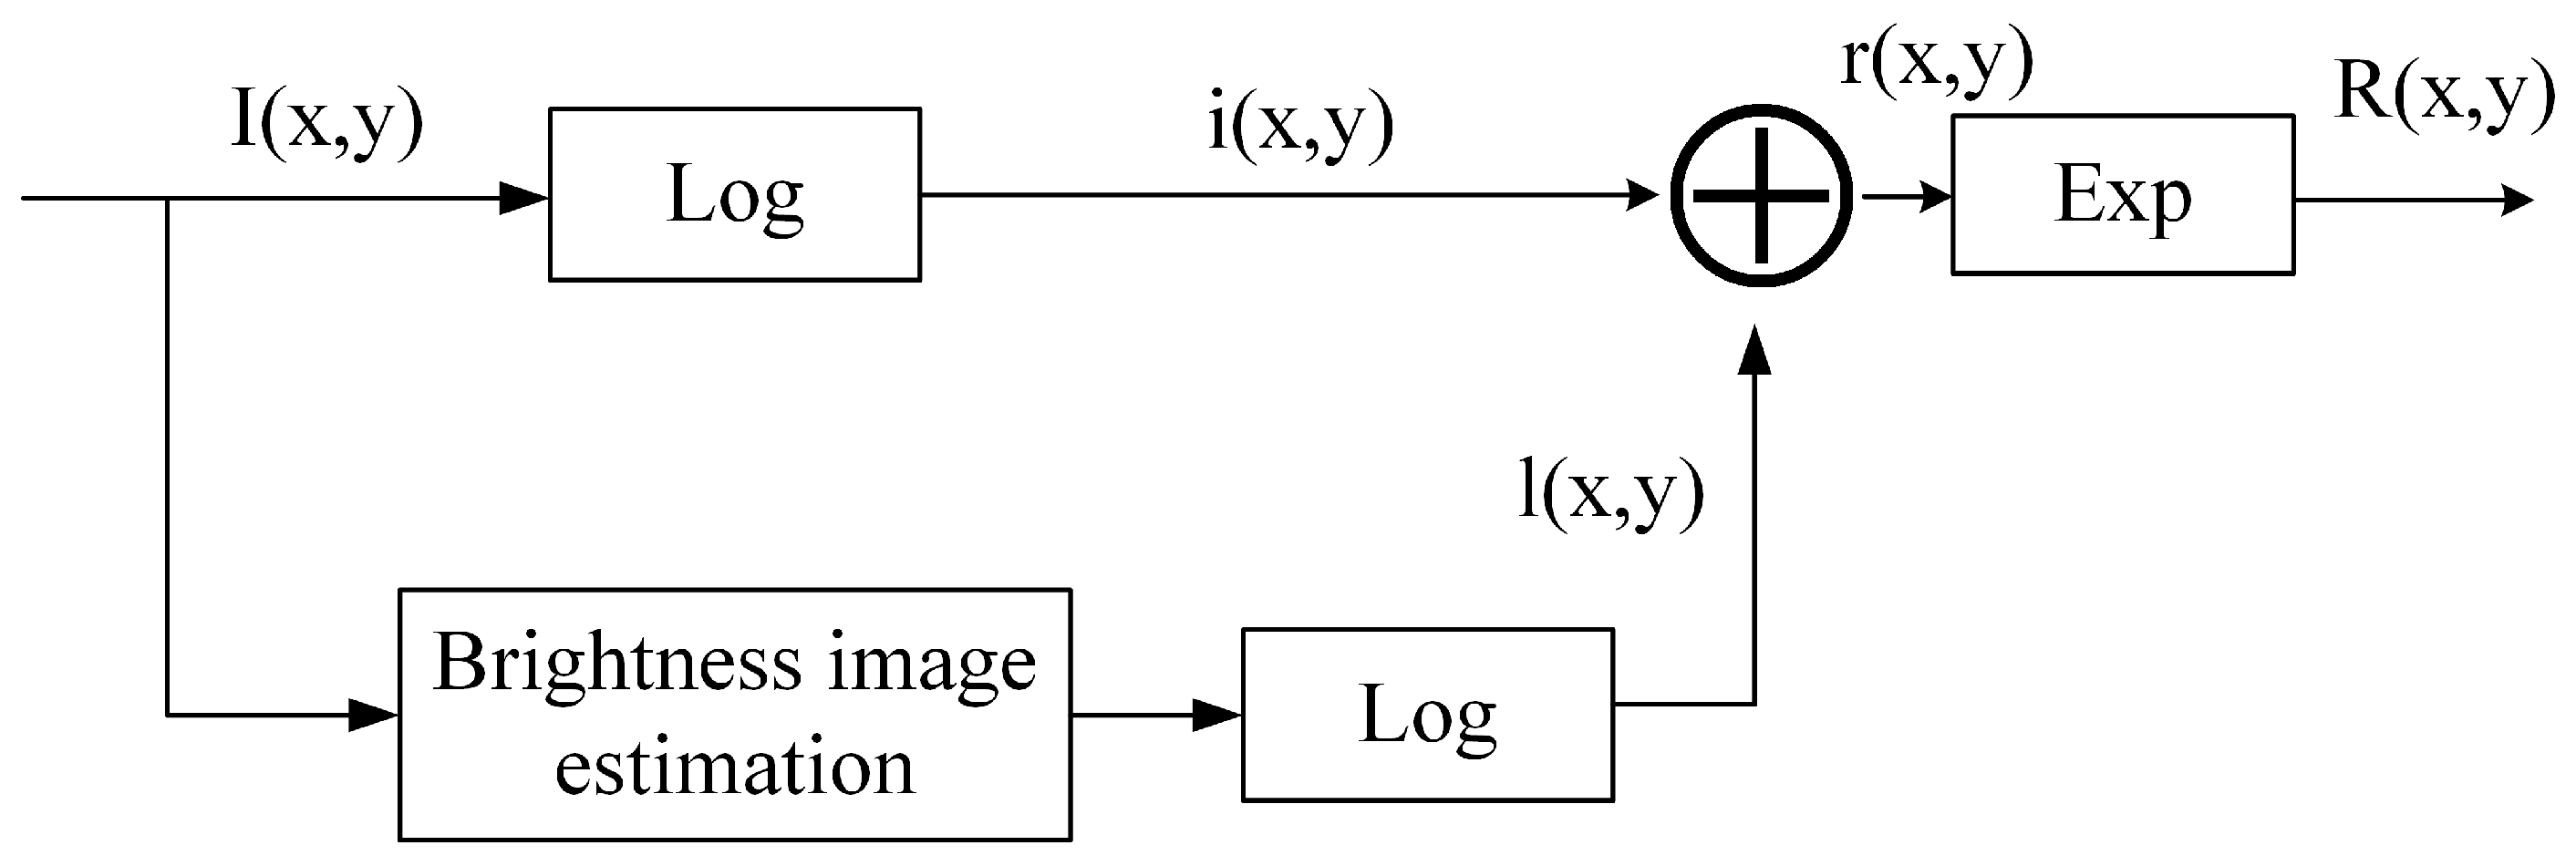
The rest of this article is organized as follows. Section 2 introduces the relevant theoretical knowledge of Retinex. Section 3 is the algorithm proposed in this article. Section 4 conducts experimental verification and comparative analysis. Section 5 summarizes this article.

2. Retinex Theory

Retinex is a model based on the vision perception and adjustment of the brightness of surrounding objects [11], and its basic principle is to divide the image I ( x , y ) into illumination component L ( x , y ) and reflection component R ( x , y ) [12]. ( x , y ) represents the spatial coordinates in the image, that is, the pixel position in the image. x usually represents the horizontal position, and y represents the vertical position. The illumination component encompasses the variations in brightness. Object features and color information are presented in the reflection component, and its principle model is presented in Figure 1.
Based on the principles of Retinex theory, the above process can be formulated as
I ( x , y ) = L ( x , y ) × R ( x , y ) .
Since the logarithmic form is closest to the process attributes of humans experiencing brightness, transferring it to the logarithmic domain yields
log ( I ( x , y ) ) = log ( L ( x , y ) × R ( x , y ) ) = log ( L ( x , y ) ) + log ( R ( x , y ) ) .
In the Retinex algorithm, the calculation of the illumination component is commonly achieved through the application of a Gaussian filter as the center-surround mechanism, which is estimated as
L ( x , y ) = I ( x , y ) G ( x , y ) ,
where G ( x , y ) represents the Gaussian filter and ∗ is the convolution symbol.
Based on Equation (2), Figure 2 depicts the diagram of the Retinex algorithm.

3. Proposed Method

This paper, firstly, in the HSV space, adopts the improved multi-scale guided filtering algorithm for the brightness component to extract the illumination component, which can accurately retain the edge details while avoiding halo artifacts. Secondly, the extracted illumination component adopts the Weber–Fechner algorithm to perform adaptive brightness correction, and the reflection component is processed using a fusion method of contrast limited adaptive histogram equalization and improved guided filter to prevent excessive enhancement and image distortion; then, the principal component analysis is performed to fuse the two components. Thirdly, to prevent the color distortion, an improved adaptive stretching method is used to balance the saturation component. Finally, the three components are fused and converted back to the RGB space. The framework is presented in Figure 3.

3.1. Improved Guided Filtering

Guided image filtering (GIF) was first introduced by Kaiming He et al. [13], and its process can be regarded as an ordinary linear translation transform filtering model. The satisfied linear relationship is
q i = a k I i + b k , i w k ,
where q i is the linear conversion of the guide image I i in the local window; the linear coefficients of the corresponding window are represented by a k and b k ; and w k is a local window with a radius, r, and a center pixel, k.
The linear coefficients are fitted using the least squares method [14], and the cost function is
E ( a k , b k ) = i w k ( a k I i + b k p i ) 2 + ε a k 2 ,
where ε refers to a fixed regularization term used to avoid the value a k from becoming overly large [15]. Weighted guided image filtering (WGIF) introduced an edge weighting factor Γ I ( k ) [16] based on GIF to adaptively adjust the regularization parameter. Γ I ( k ) is defined as follows:
Γ I ( k ) = 1 N i = 1 N σ I , 1 2 ( k ) + ψ σ I , 1 2 ( i ) + ψ ,
where N refers to the overall pixel count; σ I , 1 2 ( k ) is the variance of the guide image that denotes the varying scope of values in the input image of 3 × 3 window [17]; ψ is a very small constant, which in general takes the value of ( 0.001 × L ) 2 ; and L reflects the range of values presented in the input image.
Although WGIF reduces the halo blurring phenomenon at the boundary, its edge-aware factor is determined by assessing the variance within local windows at different areas. However, the areas with larger variance are not always edge areas and are insensitive to the weak edge areas in the image. Therefore, the gradient information is introduced into the new edge-aware weight; at the same time, it can enhance the capability to perceive subtle edges in the image, thus improving the robustness of the algorithm. The proposed new edge-aware weight is calculated by
Γ ^ I ( k ) = 1 N i = 1 N φ ( k ) + ψ φ ( i ) + ψ ,
where φ ( k ) is defined as σ I , 1 2 ( k ) σ I , r 2 ( k ) + G ( g ( k ) ) ; σ I , 1 2 ( k ) and σ I , r 2 ( k ) are the variances of the pixels in the 3 × 3 window and the ( 2 r + 1 ) × ( 2 r + 1 ) window, respectively; G is the Gaussian filter; g ( k ) refers to the gradient size of the pixel k, G ( k ) = k x 2 + k y 2 ; and k x and k y are the gradients along the x and y directions.
It can be determined from the linear model of Equation (4) that q i = a k I i . It is evident that the filtering effect of the image is influenced by a k . If the value of a k is 1, it implies that the image is situated in the edge region and is well preserved; if a k is 0, it implies that the image is situated in the flat region and the smoothing effect is better. WGIF lacks the edge constraints, and the edge cannot be preserved very well. On this basis, a new edge protection constraint γ ( k ) is proposed to preserve the edge while retaining the slight details in the comparatively smooth regions. The expression of γ ( k ) is
γ ( k ) = 1 1 + e g ( k ) ,
where g ( k ) is the gradient size of the pixel k. When it is located in the edge area, the magnitude of g ( k ) is larger and γ ( k ) is closer to 1; when it is located in the smooth area, the magnitude of g ( k ) is smaller and γ ( k ) is closer to 0. Therefore, the new cost function is changed to
E ( a k , b k ) = i w k [ ( a k I i + b k p i ) 2 + ε Γ ^ I ( k ) ( a k γ k ) 2 ] .
Thus, the best values for a k and b k are determined as
a k = 1 | w | i w k I k p k μ k p ¯ k + ε Γ ^ I ( k ) γ ( k ) σ k 2 + ε Γ ^ I ( k ) ,
b k = p ¯ k a k μ k ,
where μ k and p ¯ k are the mean values of the guide image and the input image in the window w k , respectively; σ k 2 is the variance of the guide image in the window w k ; and | w | is the amount of pixel k.
Putting the magnitude of a k and b k into Equation (4), the expression for the output image can be represented as
q ( i ) = a ¯ i I ( i ) + b ¯ i ,
where a ¯ i and b ¯ i are the average values of a k and b k within the window w k , respectively.
To prove that the improved guided filtering algorithm (WWGIF) has a more effective edge-preserving result, the filtering results are compared with the other three filtering algorithms GIF, WGIF, and gradient domain guided image filtering (GDGIF) [18], using the same regularization parameters and filtering radius, ε = 0 . 2 2 , r = 16 . The original image in Figure 4 is from a publicly available image on the Internet, from which we can see that the algorithm presented in this paper exhibits superior edge-preserving effects compared to GDGIF and effectively avoids the local halo blurring phenomenon of GIF, which can maintain the intricate edges of the image and retain the weak details of the relatively flat areas.
According to the data provided in Table 1, it is apparent that PSNR and SSIM indexes of the improved filtering algorithm are significantly improved compared to GIF, WGIF, and GDGIF. This means that WWGIF improves the quality of the image and shows better performance in these filters.

3.2. Extraction and Enhancement of Illumination Component

In this article, the improved guided filtering algorithm is combined with the Retinex algorithm, and at the same time, different scales are used to weigh it for the extraction of illumination components, which can not only effectively avoid the halo blur phenomenon, but also retain the edge features and particulars of the initial input image to a greater extent. The expression can be presented in the following form:
L I ( x , y ) = n = 1 N w n ( q n ( x , y ) I ( x , y ) ) ,
where q n ( x , y ) is the improved guided filtering for the nth scale ( n = 1 , 2 , N , N = 3 in this paper), and w n is its weight, for which the three weight values in this article are w 1 = w 2 = w 3 = 1 / 3 .
The Weber–Fechner Law is a psychophysical expression that illustrates the correlation between the sensory intensity of human perception and the sensory intensity of external environmental stimulation [19]. In terms of light intensity changes, it can be used to indicate the logarithmic linear relationship between the way the human eye perceives changes in light intensity L o u t and the initial light intensity L i n . After obtaining the estimated illumination component, to enhance the visual quality and perceptual impact, the illumination component is enhanced. Referring to the above principle, a brightness enhancement method is proposed, which can boost the overall quality of the unevenly illuminated image by adaptively adjusting the bright and dark regions and can maintain the details of the initial image [20]. The expression of its linear relationship is
L o u t = λ l g ( L i n ) + λ o ,
where λ and λ o are constants. In order to make the algorithm more applicable and to reduce the amount of computation, a new function is used to fit the curve of the function of Equation (14). The expression is as follows:
L o u t = L i n ( 255 + k ) ( max ( L i n , L in _ g ) + k ) ,
where L i n refers to the image for enhancement, L in _ g refers to the estimated reflection component, and k is the adaptive adjustment parameter.

3.3. Extraction and Enhancement of Illumination Component

CLAHE is based on histogram equalization [21], which introduces interpolation operations to obtain smoother images. The flow of the algorithm is shown in Figure 5. CLAHE preserves the details and restricts the contrast amplification in the locally smoothed areas [22], but it cannot completely suppress the noise. The WWGIF filtering algorithm can restore details and reduces the appearance of noise. Therefore, the CLAHE-WWGIF algorithm is proposed for the reflection component to further diminish the impact of noise while increasing the image contrast to maintain the details. The formula of CLAHE algorithm is
R ( x , y ) = C L A H E ( R ( x , y ) ) .
For the reason that most of the noise is presented in the reflection component, the noise still exists after CLAHE processing, so WWGIF is performed on the CLAHE-processed image to improve the contrast while suppressing the noise to improve the quality of the image [23]. The formula for denoising is
R ^ ( i ) = a ¯ i R ( i ) + b ¯ i ,
where R ^ ( i ) is the contrast-enhanced image after CLAHE processing.
In Figure 6, the initial image is a low-light image with Gaussian white noise in the LIME dataset, while b, c, and d are the images processed by CLAHE, WWGIF, and CLAHE-WWGIF, respectively. The contrast and brightness of the image after the CLAHE algorithm are obviously enhanced [24], but there is obvious noise in the background. When comparing with b and d, it is obvious that the image has been enhanced by CLAHE-WWGIF, the regional noise is obviously suppressed, and the image has been enhanced in terms of quality.

3.4. Enhancement of Saturation Component

In HSV space, the saturation component determines the overall color impression of the image. When enhancing low-light images, the enhancement of brightness will also cause the saturation to change accordingly. Processing only the brightness component will cause the image to be altered and appear desaturated, with color imbalance [25], causing the image to look overexposed and inconsistent with human visual effects. Therefore, an adaptive stretching method is put forward to alter the saturation component. The expression is as follows:
S o u t = S i n l o w v a l u e h i g h v a l u e l o w v a l u e ,
where S i n is the input saturation component; l o w v a l u e and h i g h v a l u e are minimum and maximum boundaries of the saturation component stretching, respectively, which are calculated based on the percentile of the saturation distribution. The percentile indicates the percentage of the values in the data that are less than or equal to the initial value and can be customized by selecting the saturation value of the percentile that you want to retain. As can be seen in Figure 7, after adaptive stretching, the saturation range is extended to a wider range, and then the stretched image has richer color variations and light and dark levels.

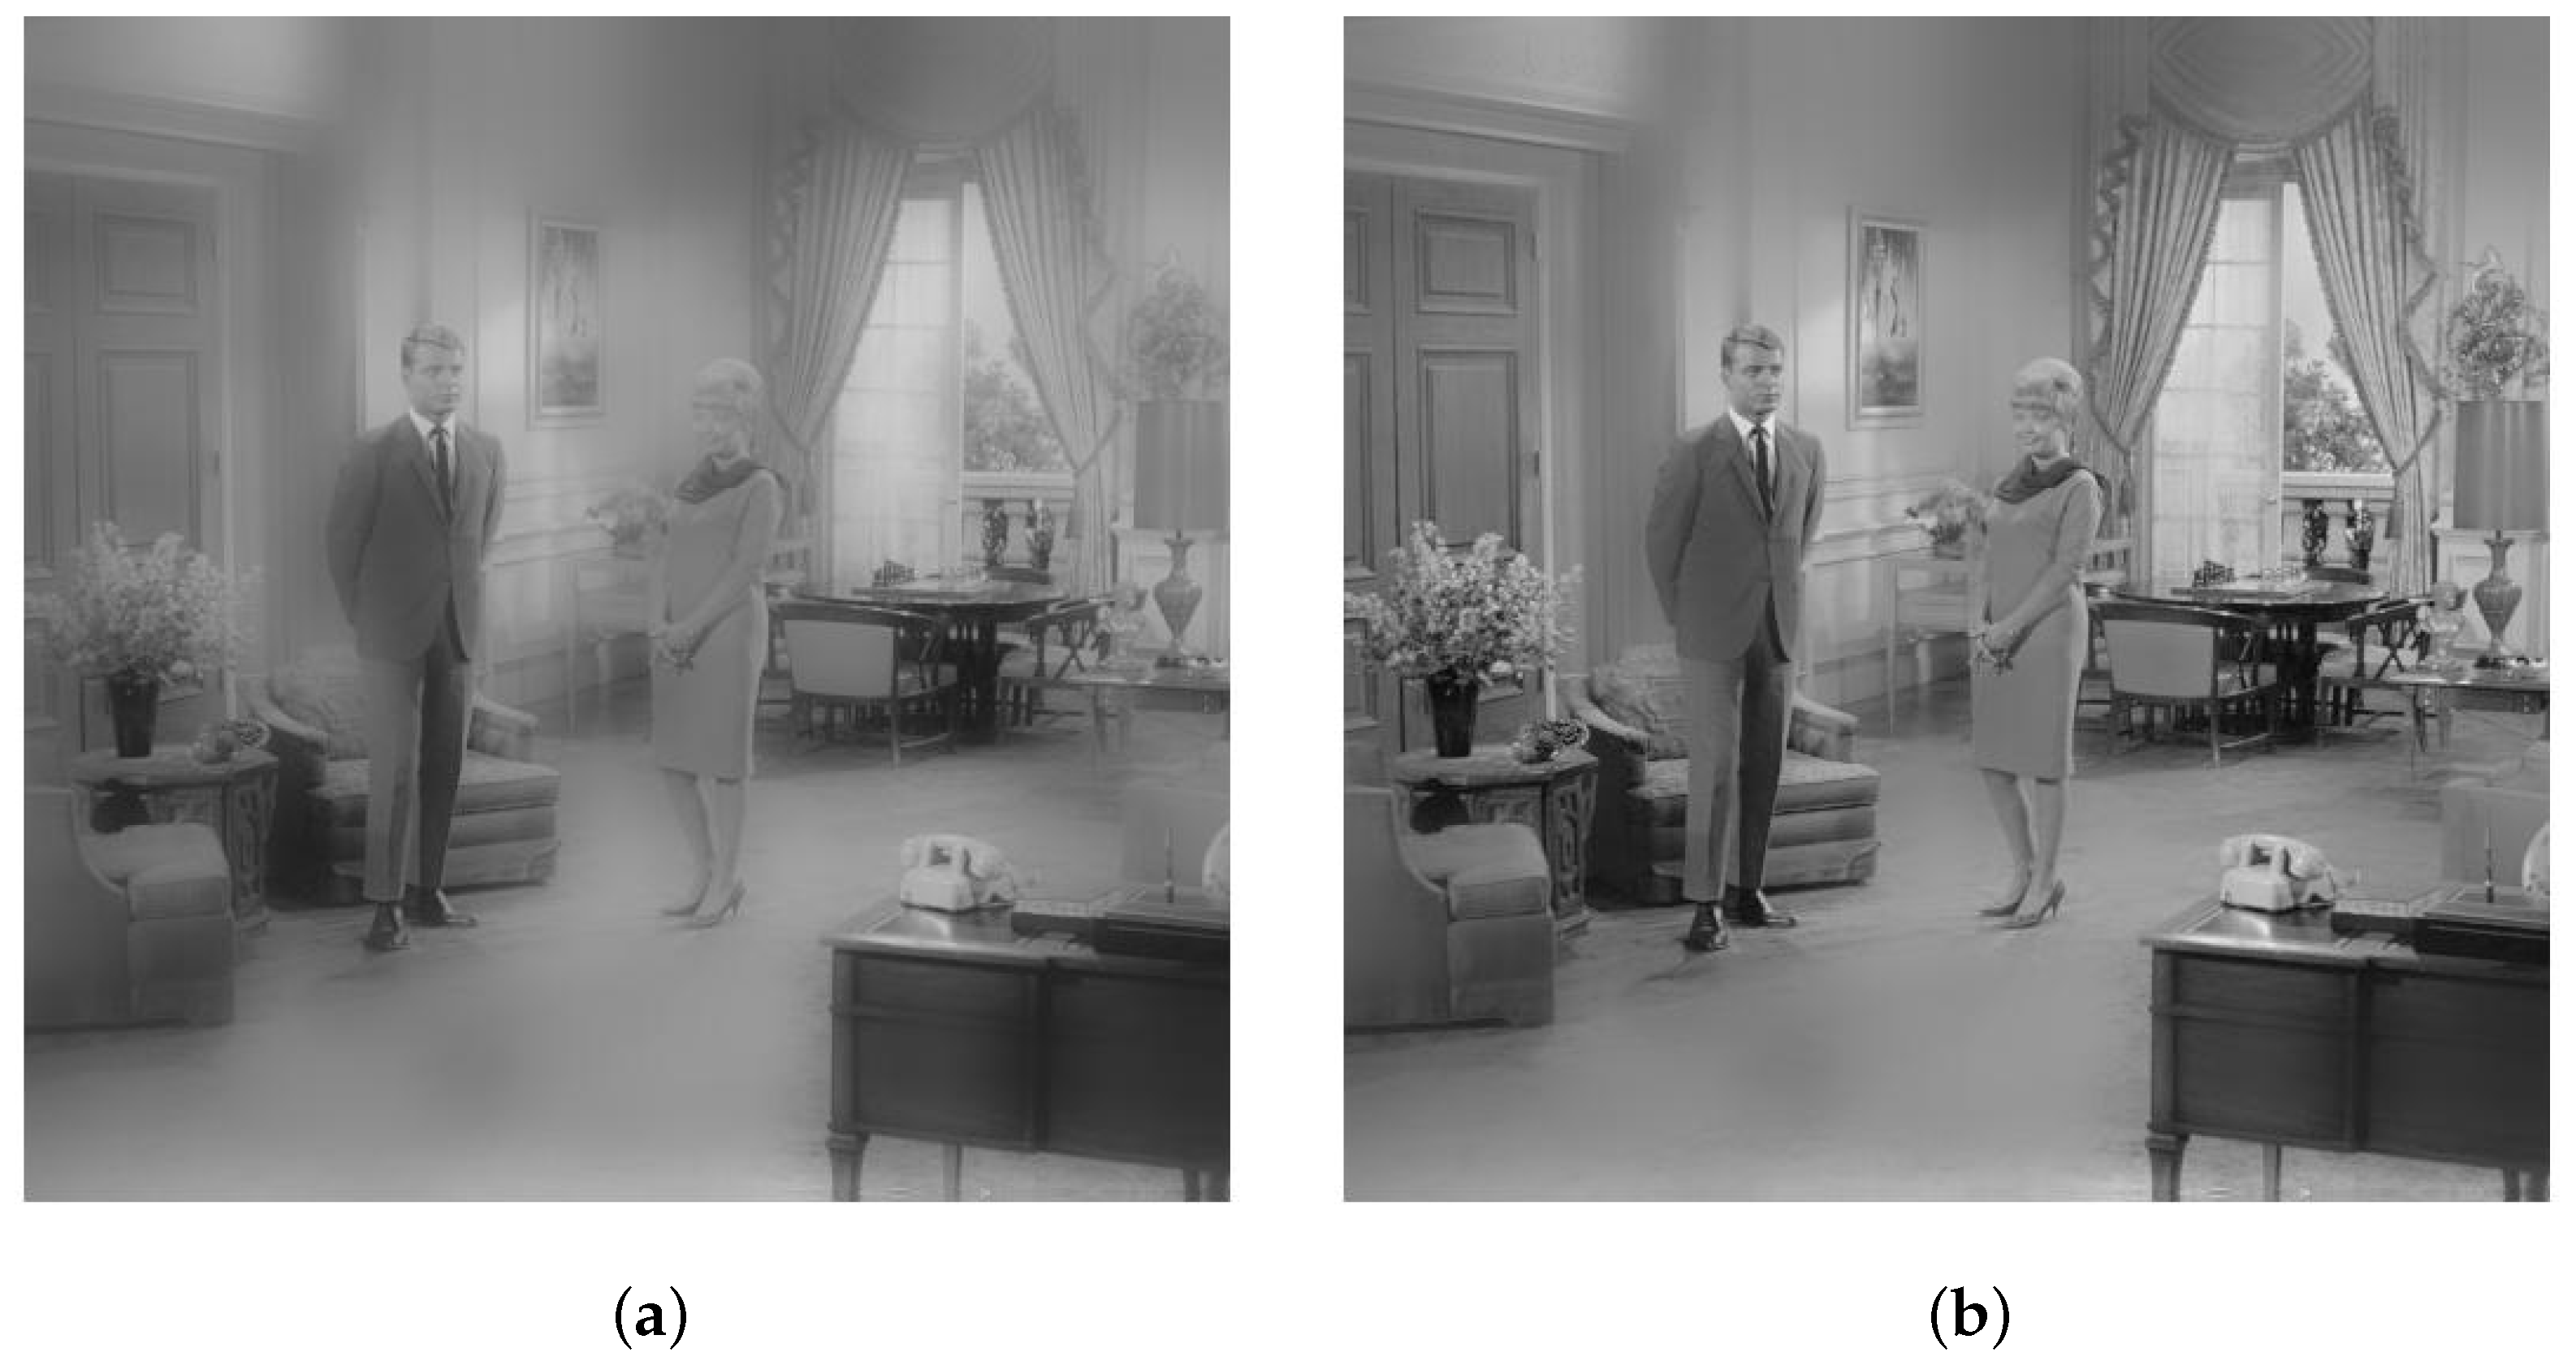
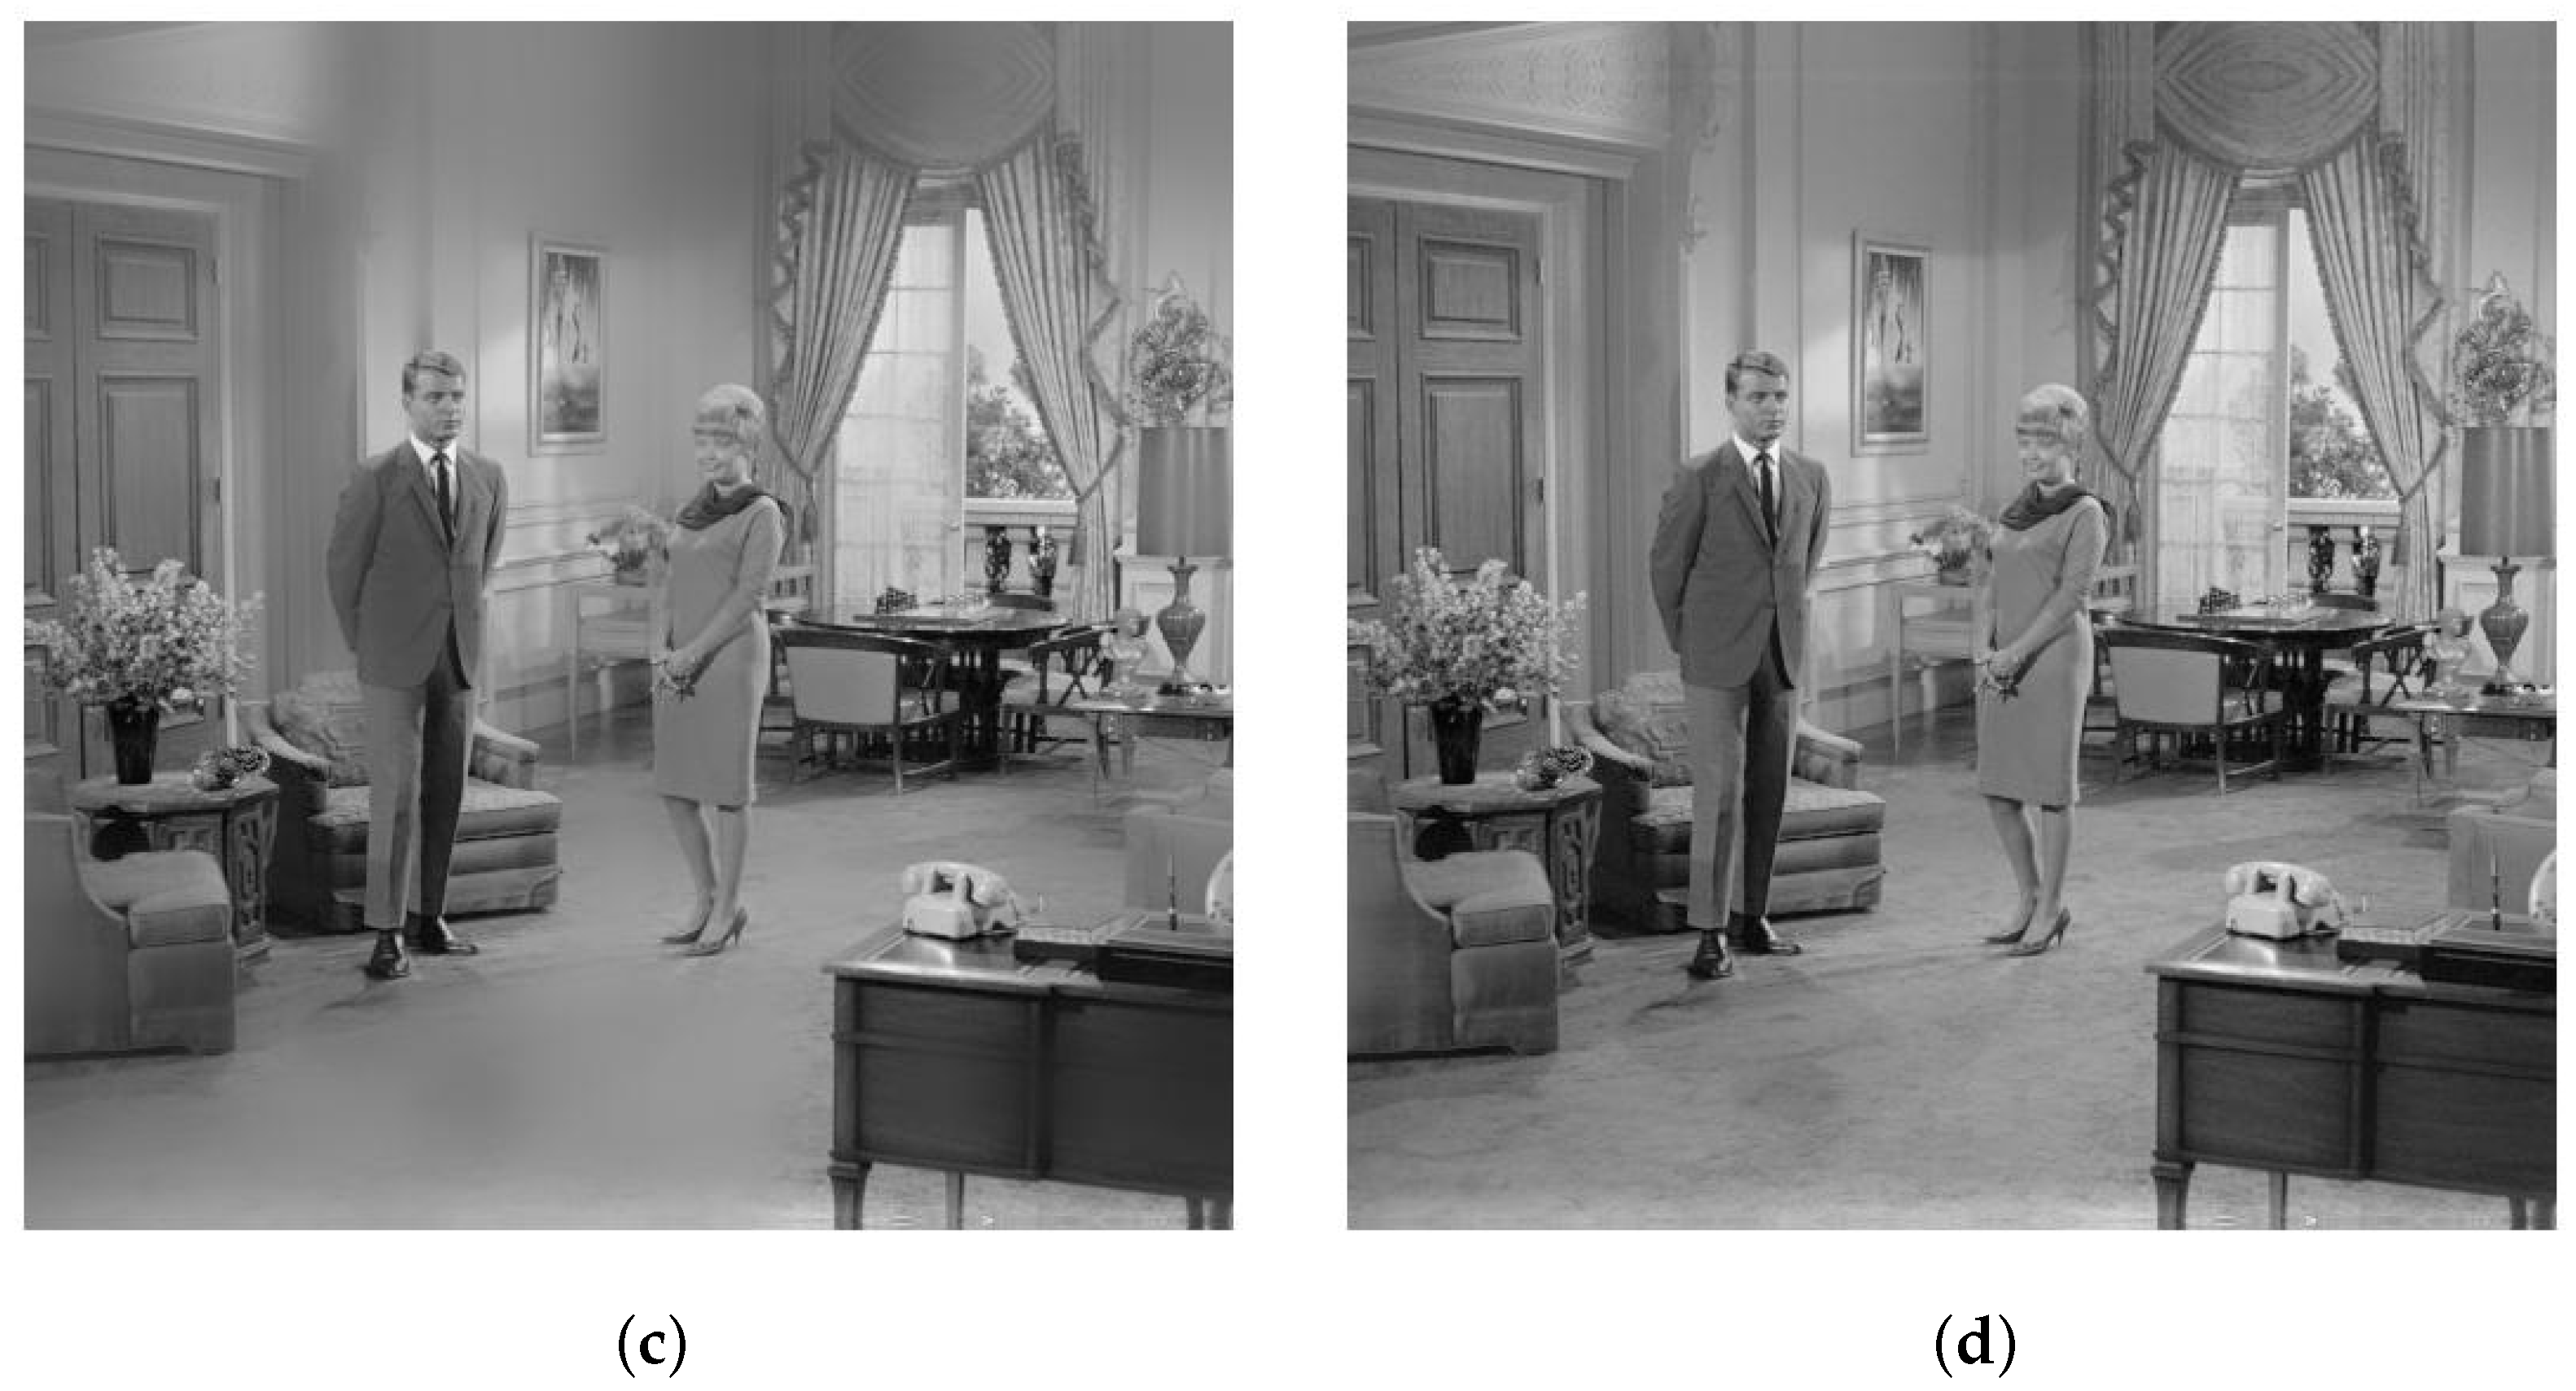
4. Experiment and Analysis

To assess the efficacy of the proposed method in this paper for low-light image enhancement in coal mines, MATLAB (Ver. 9.14) was used to conduct simulation experiments. Three low-light monitoring images of coal mines are selected and compared with SSR, MSR, and Ref. [6], whereby the first two are from publicly available images of underground coal mines on the Internet, and the latter is from an image taken from an actual underground coal mine surveillance video. The outcomes of the experiments are depicted in Figure 8, Figure 9 and Figure 10.
As can be seen from the above images, the original images are all images of coal mines in a low-light situation, and the images are darker overall, making it difficult to distinguish the details in them. The processing method using the SSR algorithm enhances the brightness of the images to some degree, but its brightness enhancement effect is limited, and the images still have distortion problems, resulting in a departure from the true color. On the other hand, for the processing method using the MSR algorithm, the brightness is greatly improved, and the details of the images are enriched. But the images are overall too bright, and halo artifacts are prone to appear in bright areas; moreover, the noise in the images are also amplified in the process, resulting in overall unclear and fuzzy images. The method used in Ref. [6] has richer details, but the color of the images shows some bias; the edges of the images are fuzzy, and the details are not clear. By contrast, the algorithm utilized in this study obviously improves the brightness of the images, reduces the halo blur phenomenon while improving the contrast, can better retain the edge details, and suppresses the influence of noise. Additionally, the color effect with our algorithm is more in line with human vision and can largely improve the quality of the coal mine images.
To objectively assess the level of image enhancement, the effect of enhancement is evaluated through six metrics such as mean, standard deviation (SD), information entropy (IE), and average gradient (AG). The metrics have the following specific definitions:
  • Mean
μ = 1 M N i = 1 M j = 1 N I ( i , j ) ,
where M N refers to the dimensions of the image. Mean is employed to assess the average pixel value, which indicates the mean brightness; as the value increases, the image quality improves.
2.
Standard deviation
S D = 1 M N i = 1 M j = 1 N ( I ( i , j ) μ ) 2 ,
where μ is the mean of the image. SD is employed to assess the spread of grayscale values among the image pixels, a larger value means a wider distribution of pixel values, that is, the greater the quality of the image.
3.
Information entropy
I E = i = 1 M p ( i ) lg p ( i ) I E = i = 1 M p ( i ) lg p ( i ) I E = i = 1 M p ( i ) lg p ( i ) ,
where p ( i ) denotes the probability of a pixel appearing within the image. IE is utilized to assess the quantity of information presented within the image; a higher entropy value equals a more uniform distribution of pixel values in the image, and the image has higher levels of texture and detail.
4.
Average gradient
A G = i = 1 M j = 1 N ( f x ) 2 + ( f y ) 2 2 M N ,
where f x and f y are the gradients of the image in both the horizontal and vertical directions. AG assesses the level of fluctuation in pixel values across the image, and a higher AG indicates the presence of more edges and details.
5.
Peak signal-to-noise ratio
P S N R = 10 log M N × 255 2 i = 1 N j = 1 N [ I ( x , y ) I ( x , y ) ] 2 ,
where I ( x , y ) and I ( x , y ) are the images before and after enhancement, respectively. PSNR is a metric employed to quantify the similarity between the original and reconstructed images. A larger PSNR value means less distortion and higher quality between the reconstructed image and the initial image.
6.
Structural similarity
S S I M ( x , y ) = ( 2 μ x μ y + c 1 ) ( 2 σ x y + c 2 ) ( μ x 2 + μ y 2 + c 1 ) ( σ x 2 + σ y 2 + c 2 ) ,
where μ x is the mean of x; σ x 2 is the variance of x; σ x y is the covariance of x and y; and c 1 and c 2 are two constants. SSIM is used to evaluate the structural similarity between the images, and a higher value of SSIM denotes that the two images are more structurally similar.
Table 2, Table 3 and Table 4 demonstrate the comparison of the algorithm presented in this paper with the SSR and MSR algorithms. The values of various metrics of the images are greatly improved compared to the algorithm in Ref. [6]. Furthermore, the metrics are also improved, which means that the method introduced in this paper demonstrates a substantial advancement in enhancing low-light images, which can obviously improve the brightness and effectively reduce the halo blurring phenomenon as well as retain the improved edge details, and to a certain extent, reduce the impact of noise.

5. Conclusions

To address the issues of halo blurring, poor edge preservation, and serious noise in the traditional coal mine image enhancement methods, a new image enhancement algorithm is proposed. Firstly, the initial image is transferred to the HSV space, where the improved multi-scale guided filtering and Retinex algorithm are fused to effectively extract the illumination component for the brightness component, avoiding halo artifacts while retaining the edge details. Secondly, the extracted illumination component uses the Weber–Fechner algorithm for adaptive brightness correction, and the reflection component uses a fusion method for contrast enhancement and denoising, which suppresses noise while avoiding excessive enhancement. Thirdly, the saturation component is enhanced with the improved adaptive stretching method, and the color component is adjusted to prevent color distortion. Lastly, the image is converted back to the RGB space. The algorithm in this study proves that it can enhance the brightness of low-light images in coal mines while reducing the appearance of noise and halo artifacts, and also preserve edge details. Through this comprehensive processing, the enhanced image is better in terms of visual aspects and detail retention, which can better meet the needs of mine monitoring videos.

Author Contributions

Conceptualization, F.T. and M.W.; methodology, M.W.; software, M.W.; validation, F.T., M.W. and X.L.; investigation, F.T.; resources, F.T.; data curation, M.W.; writing—original draft preparation, M.W.; writing—review and editing, F.T. and X.L.; supervision, F.T. All authors have read and agreed to the published version of the manuscript.

Funding

This research was funded by the Shaanxi Provincial Science and Technology Plan Project (2020GY-029).

Institutional Review Board Statement

Not applicable.

Informed Consent Statement

Not applicable.

Data Availability Statement

Data are contained within the article.

Conflicts of Interest

The authors declare no conflicts of interest.

References

  1. Wang, J.; Wang, H.; Sun, Y.; Yang, J. Improved Retinex-Theory-Based Low-Light Image Enhancement Algorithm. Appl. Sci. 2023, 13, 8148. [Google Scholar] [CrossRef]
  2. Huang, S.; Li, D.; Zhao, W.; Liu, Y. Haze Removal Algorithm for Optical Remote Sensing Image Based on Multi-Scale Model and Histogram Characteristic. IEEE Access 2019, 7, 104179–104196. [Google Scholar] [CrossRef]
  3. Guo, Y.; Ke, X.; Ma, J.; Zhang, J. A Pipeline Neural Network for Low-Light Image Enhancement. IEEE Access 2019, 7, 13737–13744. [Google Scholar] [CrossRef]
  4. Zhang, W.; Dong, L.; Pan, X.; Zhou, J.; Qin, L.; Xu, W. Single Image Defogging Based on Multi-Channel Convolution MSRCR. IEEE Access 2019, 7, 72492–72504. [Google Scholar] [CrossRef]
  5. Qu, J.; Li, Y.; Du, Q.; Xia, H. Hyperspectral and Panchromatic Image Fusion via Adaptive Tensor and Multi-Scale Retinex Algorithm. IEEE Access 2020, 8, 30522–30532. [Google Scholar] [CrossRef]
  6. Wang, W.; Chen, Z.; Yuan, X.; Wu, X. Adaptive image enhancement method for correcting low-illumination images. Inf. Sci. 2019, 496, 25–41. [Google Scholar] [CrossRef]
  7. Liu, S.; Long, W.; He, L.; Li, Y.; Ding, W. Retinex-Based Fast Algorithm for Low-Light Image Enhancement. Entropy 2021, 23, 746. [Google Scholar] [CrossRef]
  8. Wang, P.; Wang, Z.; Lv, D.; Zhang, C.; Wang, Y. Low illumination color image enhancement based on Gabor filtering and Retinex theory. Multimed. Tools Appl. 2021, 80, 17705–17719. [Google Scholar] [CrossRef]
  9. Lin, C.; Zhou, H.f.; Chen, W.J.A. Improved bilateral filtering for a Gaussian pyramid structure-based image enhancement algorithm. Algorithms 2019, 12, 258. [Google Scholar] [CrossRef]
  10. Shang, D.; Yang, Z.; Zhang, X.; Zheng, L.; Lv, Z. Research on low illumination coal gangue image enhancement based on improved Retinex algorithm. Int. J. Coal Prep. Util. 2023, 43, 999–1015. [Google Scholar] [CrossRef]
  11. Yang, L.; Mu, D.; Xu, Z.; Huang, K.; Zhang, C.; Gao, P.; Purves, R. Apple Surface Defect Detection Based on Gray Level Co-Occurrence Matrix and Retinex Image Enhancement. Appl. Sci. 2023, 13, 12481. [Google Scholar] [CrossRef]
  12. Xu, J.; Hou, Y.; Ren, D.; Liu, L.; Zhu, F.; Yu, M.; Wang, H.; Shao, L. STAR: A Structure and Texture Aware Retinex Model. IEEE Trans. Image Process. 2020, 29, 5022–5037. [Google Scholar] [CrossRef]
  13. He, K.; Sun, J.; Tang, X. Guided image filtering. IEEE Trans. Pattern Anal. Mach. Intell. 2013, 35, 1397–1409. [Google Scholar] [CrossRef] [PubMed]
  14. Li, M.; Liu, J.; Yang, W.; Sun, X.; Guo, Z.J.I.T.o.I.P. Structure-revealing low-light image enhancement via robust retinex model. IEEE Trans. Image Process. 2018, 27, 2828–2841. [Google Scholar] [CrossRef]
  15. Ochotorena, C.N.; Yamashita, Y. Anisotropic Guided Filtering. IEEE Trans. Image Process. 2019, 29, 1397–1412. [Google Scholar] [CrossRef] [PubMed]
  16. Li, Z.; Zheng, J.; Zhu, Z.; Yao, W.; Wu, S. Weighted Guided Image Filtering. IEEE Trans. Image Process. 2015, 24, 120–129. [Google Scholar] [CrossRef] [PubMed]
  17. Sun, Y.; Zhao, Z.; Jiang, D.; Tong, X.; Tao, B.; Jiang, G.; Kong, J.; Yun, J.; Liu, Y.; Liu, X.; et al. Low-Illumination Image Enhancement Algorithm Based on Improved Multi-Scale Retinex and ABC Algorithm Optimization. Front. Bioeng. Biotechnol. 2022, 10, 865820. [Google Scholar] [CrossRef] [PubMed]
  18. Kou, F.; Chen, W.; Wen, C.; Li, Z. Gradient Domain Guided Image Filtering. IEEE Trans. Image Process. 2015, 24, 4528–4539. [Google Scholar] [CrossRef] [PubMed]
  19. Maes, C.J.J.o.S.P. Statistical Mechanical Foundation of Weber–Fechner Laws. J. Stat. Phys. 2021, 182, 49. [Google Scholar] [CrossRef]
  20. Ji, X.; Guo, S.; Zhang, H.; Xu, W.J.A.S. Non-Uniform-Illumination Image Enhancement Algorithm Based on Retinex Theory. Appl. Sci. 2023, 13, 9535. [Google Scholar] [CrossRef]
  21. Pisano, E.D.; Zong, S.; Hemminger, B.M.; DeLuca, M.; Johnston, R.E.; Muller, K.; Braeuning, M.P.; Pizer, S.M. Contrast limited adaptive histogram equalization image processing to improve the detection of simulated spiculations in dense mammograms. J. Digit. Imaging 1998, 11, 193–200. [Google Scholar] [CrossRef] [PubMed]
  22. Yuan, Z.; Zeng, J.; Wei, Z.; Jin, L.; Zhao, S.; Liu, X.; Zhang, Y.; Zhou, G. CLAHE-Based Low-Light Image Enhancement for Robust Object Detection in Overhead Power Transmission System. IEEE Trans. Power Deliv. 2023, 38, 2240–2243. [Google Scholar] [CrossRef]
  23. Tang, H.; Zhu, H.; Tao, H.; Xie, C. An Improved Algorithm for Low-Light Image Enhancement Based on RetinexNet. Appl. Sci. 2022, 12, 7268. [Google Scholar] [CrossRef]
  24. Wang, T.S.; Kim, G.T.; Kim, M.; Jang, J. Contrast Enhancement-Based Preprocessing Process to Improve Deep Learning Object Task Performance and Results. Appl. Sci. 2023, 13, 10760. [Google Scholar] [CrossRef]
  25. Cheon, B.W.; Kim, N.H. Enhancement of Low-Light Images Using Illumination Estimate and Local Steering Kernel. Appl. Sci. 2023, 13, 11394. [Google Scholar] [CrossRef]
Figure 1. Retinex model.
Applsci 14 02213 g001
Figure 2. Retinex algorithm.
Applsci 14 02213 g002
Figure 3. The framework of this paper.
Applsci 14 02213 g003
Figure 4. Results of different filtering algorithms. (a) GIF algorithm; (b) WGIF algorithm; (c) GDGIF algorithm; (d) WWGIF algorithm.
Applsci 14 02213 g004aApplsci 14 02213 g004b
Figure 5. CLAHE algorithm.
Applsci 14 02213 g005
Figure 6. Results of different algorithms. (a) Original image; (b) CLAHE algorithm; (c) WWGIF algorithm; (d) CLAHE-WWGIF algorithm.
Applsci 14 02213 g006
Figure 7. Histogram of initial and stretched S components.
Applsci 14 02213 g007
Figure 8. Image 1, enhanced by different algorithms. (a) Original image; (b) SSR algorithm; (c) MSR algorithm; (d) Ref. [6] algorithm; (e) Our’s algorithm.
Applsci 14 02213 g008
Figure 9. Image 2, enhanced by different algorithms. (a) Original image; (b) SSR algorithm; (c) MSR algorithm; (d) Ref. [6] algorithm; (e) Our’s algorithm.
Applsci 14 02213 g009
Figure 10. Image 3, enhanced by different algorithms. (a) Original image; (b) SSR algorithm; (c) MSR algorithm; (d) Ref. [6] algorithm; (e) Our’s algorithm.
Applsci 14 02213 g010
Table 1. Performance comparison of different filtering algorithms.
GIFWGIFGDGIFWWGIF
PSNR23.090827.374429.247334.9946
SSIM0.95010.95290.98930.9973
Table 2. Evaluation results of different algorithms for Image 1.
Image 1MeanSDIEAGPSNRSSIM
Original39.185147.32196.54059.8552--
SSR54.788955.10607.258811.982310.27240.6128
MSR62.517658.34797.262915.162910.66290.6515
Ref. [6]67.368360.46387.283815.961812.19160.6587
Ours98.772273.17277.619519.673214.47680.7539
Table 3. Evaluation results of different algorithms for Image 2.
Image 2MeanSDIEAGPSNRSSIM
Original34.697135.07416.21126.4716--
SSR73.508836.05887.26589.621810.65600.6096
MSR86.588938.32817.285110.790811.48240.6263
Ref. [6]89.705640.14767.325311.721811.49850.6463
Ours110.577144.41887.419912.932113.01890.7835
Table 4. Evaluation results of different algorithms for Image 3.
Image 3MeanSDIEAGPSNRSSIM
Original76.896034.89107.20319.7077--
SSR98.911943.60487.284810.922612.09180.6156
MSR117.004944.20047.303511.572012.21620.6397
Ref. [6]124.976345.67197.314911.155714.81190.7322
Ours161.987846.85717.463912.348215.99800.7718
Disclaimer/Publisher’s Note: The statements, opinions and data contained in all publications are solely those of the individual author(s) and contributor(s) and not of MDPI and/or the editor(s). MDPI and/or the editor(s) disclaim responsibility for any injury to people or property resulting from any ideas, methods, instructions or products referred to in the content.

