Article

Blasting Vibration Control and Signal Analysis of Adjacent Existing Deterioration Tunnels

Beijing Key Laboratory of Urban Underground Space Engineering, School of Civil and Resource Engineering, University of Science and Technology Beijing, Beijing 100083, China
*
Author to whom correspondence should be addressed.
Appl. Sci. 2024, 14(5), 2212; https://doi.org/10.3390/app14052212
Submission received: 11 January 2024 / Revised: 5 March 2024 / Accepted: 5 March 2024 / Published: 6 March 2024

Abstract

:
Building a new tunnel adjacent to an existing tunnel has become a common means of transformation in engineering. Existing tunnels are prone to some deterioration, such as cavities and cracks under long-term traffic load. This kind of deterioration tunnel is prone to collapsing under the action of blasting. Therefore, the vibration caused by blasting should be strictly controlled. Based on the reconstruction project of the Bo Jiling Tunnel, this paper puts forward the method of mechanical cutting in a central position combined with an ordinary detonator to reduce blasting vibrations. ANSYS/LS-DYNA version 19.2, was used to simulate two conditions of full-section blasting and central mechanical cutting blasting. By comparing the stress and velocity of the existing tunnel, the damping effect of mechanical cutting blasting is analyzed. Via field experiments, the superiority of the mechanical cutting method in reducing blasting vibration is further discussed. At the same time, the relationship between the main vibration frequency and the peak velocity of the existing deterioration tunnel is obtained by wavelet packet analysis of the field experimental data. The frequency band energy distribution in each direction of vibration velocity is also obtained. The results show that the central mechanical cutting increases the blasting free surface, and the mechanical cutting method reduces the vibration velocity by 36.3%. The third frequency band (31.25~46.875 Hz) is the most concentrated, which is the dominant frequency band of the signal. The novelty of this paper is to propose mechanical cutting of the central hole instead of traditional blasting for existing deterioration tunnels. The feasibility of this method is verified by numerical simulation and field tests. The relationship between peak vibration velocity, band energy, and tunnel frequency is clarified, which can better control blasting vibration and ensure the safety of existing deterioration tunnels.

1. Introduction

With the continuous development of railway construction scale in our country, it is inevitable that new railway tunnels will come close to or cross existing lines. Existing tunnels with a long service life will have cracks and other deterioration phenomena appear under weathering and long-term train load. The stability of the deteriorated tunnel is reduced under the action of blasting load. Therefore, taking vibration reduction measures to reduce vibration at the source of the explosion is the key to ensuring the safety of existing deterioration tunnels.
At present, the vibration reduction methods used in engineering mainly include control of maximum charge, differential blasting, staggered peak vibration reduction, and so on. Certain effects of vibration reduction can be obtained after corresponding measures are taken for different site conditions. In the blasting construction of the tunnel, Zhu [1] and Xia [2] calculated the amount of explosive charge using the Sadovsky formula linear regression method and effectively controlled the blasting vibration velocity within the safe range; Jiang [3] and Li [4], respectively, used three-step blasting and double-step blasting to reduce the blasting vibration effect of urban underground tunnel construction. Li [5] and Tang [6] pointed out that the key to decreasing the vibration of differential blasting is the control of differential time. Yang [7] and Ma et al. [8] used ANSYS/LS-DYNA software, version 19.2, to simulate the reasonable micro-difference time between deep hole blasting and shallow hole blasting. It is proved that the precision delay between holes based on a digital electronic detonator is better than the simultaneous detonation of holes. Ren [9] found that the main vibration period of the digital electronic detonator can be staggered by half a cycle to reduce the blasting vibration. In addition to common vibration reduction measures, many scholars have also made innovations for specific projects. Wu et al. [10] proposed a four-part excavation method. Sun et al. [11] proposed setting vibration damping holes for vibration control. The double-layer hole layout suitable for the project is finally obtained. Yang [12] pointed out that, for shallow buried tunnels, the use of digital electronic detonators for delayed blasting is not as effective as the use of electronic detonators in deep buried tunnels. Therefore, this paper proposes a new blasting method: mechanical cutting combined with detonators.
With the development of science and technology, traditional Fourier transform cannot meet the requirements. Therefore, in the 1980s, wavelet transform was proposed by French scientists. Then, it gradually developed into a very important means in the field of signal processing. Ma et al. [13] used a wavelet packet to analyze the frequency and energy distribution of vibration signals under each cut mode. In order to reduce the noise of blasting vibration signals, Zhou [14] and Wang et al. [15] used wavelet packet analysis to further decompose the mode function of vibration signals into a series of wavelet packet coefficients of different scales. Wang et al. [16] used wavelet packet transform with multi-resolution characteristics to decompose blasting signals in multiple layers and obtained detailed information on energy distribution. Aiming at the shortcomings of the Fourier transform in the analysis of non-periodic and non-stationary signals, Chen et al. [17] proposed a calculation method for wavelet packet transform. This method accurately describes the frequency characteristics of blasting signals and effectively overcomes the disadvantages of the Fourier transform. Huang et al. [18] used wavelet packet transform to analyze the time–frequency characteristics of the measured vibration signal, and the energy distribution characteristics of the vibration signal frequency band were obtained. Wavelet packet analysis can show the frequency and energy distribution characteristics of blasting vibration signals in a more comprehensive and detailed way.
Previous studies focused on reducing blasting vibration mainly around blasting charge, electronic detonator time-sharing blasting, and bench blasting. In this paper, a new blasting method is proposed for the existing deterioration tunnel: mechanical cutting combined with ordinary detonator blasting instead of full-section detonator blasting. With the help of numerical simulation and field experiments, the blasting effect of the two blasting schemes was simulated and analyzed. The vibration reduction effect of the mechanical cutting method was judged by the velocity response of the existing tunnel. Wavelet packet is used to analyze the relationship between frequency, velocity, and energy distribution of vibration signals in deterioration tunnels. Determining the frequency interval of peak vibration velocity and peak energy is helpful in guiding the design of the blasting scheme to ensure the safety of the existing deterioration tunnel.

2. General Situation of Deterioration Tunnel

The Sanya to Ledong section of the Hainan West Ring Railway is about 103 km. Among them, the Bo Jiling Tunnel is located in Sanya City, with a total length of 385 m (mileage range DK346 + 890~DK347 + 275). It is a single-track tunnel with a maximum buried depth of 48 m, and the designed running speed is 160 km/h.
The interval between the new tunnel and the existing tunnel is 21.1~28.6 m. The relative position relationship between the new tunnel and the existing tunnel is shown in Figure 1, and the position relationship between the structures around the new Bo Jiling tunnel is shown in Table 1.
There are many structures around the new tunnel, and the existing tunnel is deteriorated, as shown in Figure 2. The surrounding rock of the tunnel belongs to the “V” level, and the rock mass is incomplete, so it is necessary to control the blasting vibration strictly. At present, the commonly used blasting vibration control methods in engineering are controlling the maximum and single-hole charge, electronic detonator differential blasting, sectional blasting, laying vibration reduction ditch, and so on. Cutting hole blasting is inevitable under the existing vibration control methods. The free surface is not sufficient for the cutting blasting, and the interlocking of rock is large. The vibration generated by the cutting hole blasting is the largest [19]. Aiming to reduce the disturbance of cutting hole blasting, mechanical cutting is proposed. Mechanical cutting creates an open space. Subsequently, the number of free surfaces of blasting increases. It is clearly pointed out in the literature [20] that the increase of free surface can effectively reduce the blasting vibration. At the same time, the minimum resistance line length of the hole becomes smaller. The interlocking of the rock becomes smaller. Mechanical cutting instead of cutting blasting will reduce disturbance to a great extent. Thus, the safety of the existing degraded tunnel is guaranteed. At the same time, it is safer and will not cause flying stones.

3. Numerical Simulation of Blasting Vibration Control

The significance of numerical simulation is to explore the difference of dynamic response to mechanical cutting and ordinary blasting. The vibration generated by the cutting hole is the largest. The blasting effect of peripheral holes has little effect on the existing tunnels, so the cutting holes and auxiliary holes are mainly simulated in this paper. The simulated total blasting charge is consistent with the actual scheme. The results of numerical simulation can not fully reflect the dynamic response of the actual tunnel. But the results can judge the vibration reduction effect of the mechanical cutting, so as to guide the amount of charge and the size of the hole in the field blasting experiment.

3.1. Model Overview

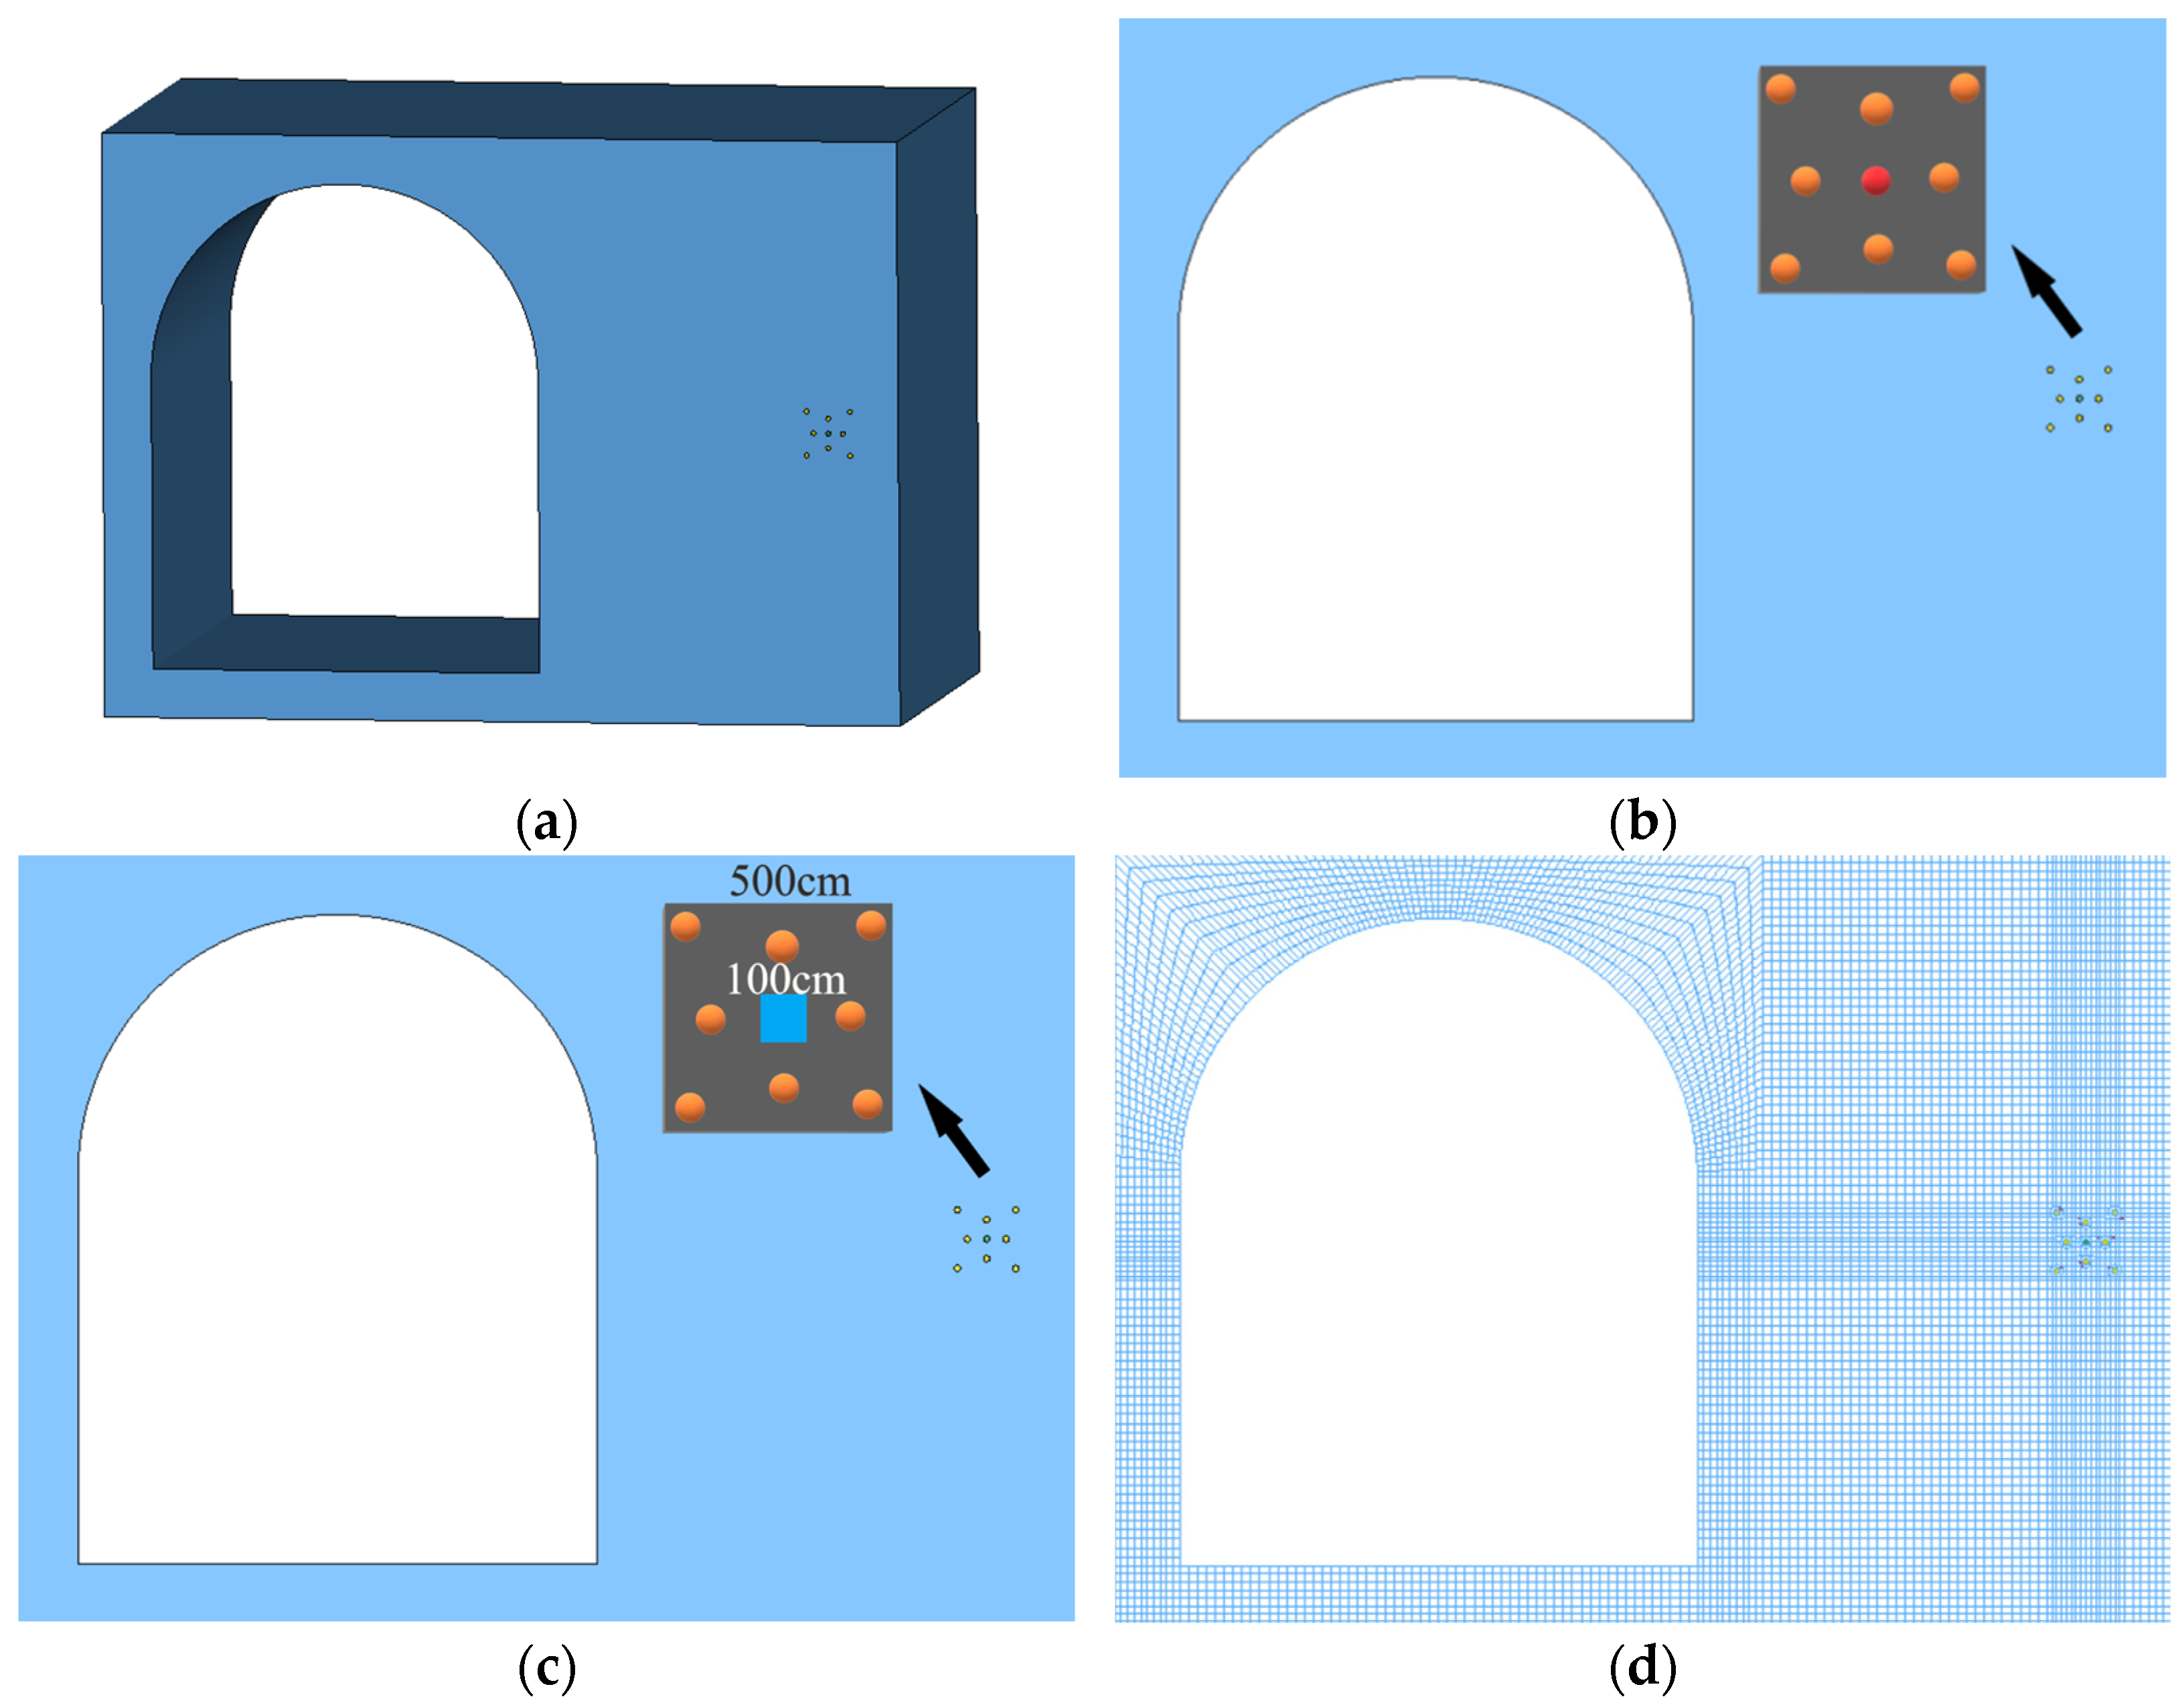
According to the actual engineering background, ANSYS/LS-DYNA was used to establish the geometric model, as shown in Figure 3a. The overall model size is 60 × 20 × 40 m, and the blasting hole is located in the center of the new tunnel. It is 15 m away from the surrounding rock on the right side of the existing tunnel. The three groups of blasting holes are arranged successively from inside to outside to simulate tunnel blasting holes. The schematic diagram of blasting holes is shown in Figure 3b. The mechanical cutting method means that the center blasting hole changed into air material, and the cutting diagram is shown in Figure 3c. The model unit adopts an 8-node SOLID164 solid unit as well as Lagrange grid division. The model grid is shown in Figure 3d. The model is divided into 411,272 elements. A total of 5 parts were created in this numerical simulation modeling process. Part 1 simulates the tunnel surrounding the rock. Part 2 simulates the fluid–structure coupling part. Part 3 simulates the explosive portion of the center blasting hole. Part 4 simulates the explosive portion of the auxiliary hole. Part 5 simulates the explosive portion of the peripheral hole.
The numerical simulation of the blasting process adjacent to the existing tunnel involves rock and explosives. An arbitrary Lagrange–Euler algorithm is selected in the simulation, that is, fluid–structure coupling algorithm. The explosive material is the No. 8 detonator, and the material keyword added when modifying the k file separately is *MAT_HIGH_EXPLOSIVE_BURN. The constitutive model of explosive adopts the JWL equation of state, and the relation is as follows:
p = A ( 1 ω R 1 V ) e R 1 V + B ( 1 ω R 2 V ) e R 2 V + ω E 0 V
P is the detonation pressure, Mpa; V is the volume; E0 is the internal energy of the initial volume; and A, B, R1, and R2 are material constant.
The keyword of the equation of state after the explosive explosion is *EOS_JWJ and the specific parameter settings are shown in Table 2.
The HJC constitutive model is a rate-dependent constitutive model proposed by Hulmqusit T.J. et al. to solve the problem of large deformation under high strain rates and high pressure loads. The model consists of a yield strength function, state equation, and damage evolution equation. At present, it is widely used in the dynamic impact failure process of rock materials [21]. The yield strength model is standardized by equivalent stress:
σ = [ A ( 1 D ) + B P × N ] ( 1 + C ln ε · )
σ = σ / f c ·
P = P / f c ·
ε · = ε · / ε 0 ·
σ is actual equivalent stress; f c · is quasi-static uniaxial compressive strength; P is standardized hydrostatic pressure; P is actual hydrostatic pressure; ε · is dimensionless strain rate; ε · is true strain rate; and ε 0 · is reference strain rate. D is the degree of damage (0 ≤ D ≤ 1.0). A, B, C, and N are the strength parameters of the material.
The H-J-C material model in ANSYS/LS-DYNA is selected for rock materials. The specific material properties are defined by the keyword *MAT_JOHNSON_HOLMQUIST_CONCRETE, and the specific parameters are shown in Table 3.
In Table 3, MID is the material ID; ρ0 is the density, g/cm3; G is the shear modulus; and A, B, N, C, and SFM are the strength parameters. Fc is the static yield strength. T is the tensile strength; EPS is the reference strain rate; EFM is the minimum fracture strain. Pc is the volume stress; UC is the volume strain; PL is the material limit volume stress; UL is the material limit volume strain; D1 and D2 are damage constants; and K1, K2, and K3 are pressure constants. Fs is the damage type.

3.2. Arrangement of Measuring Points

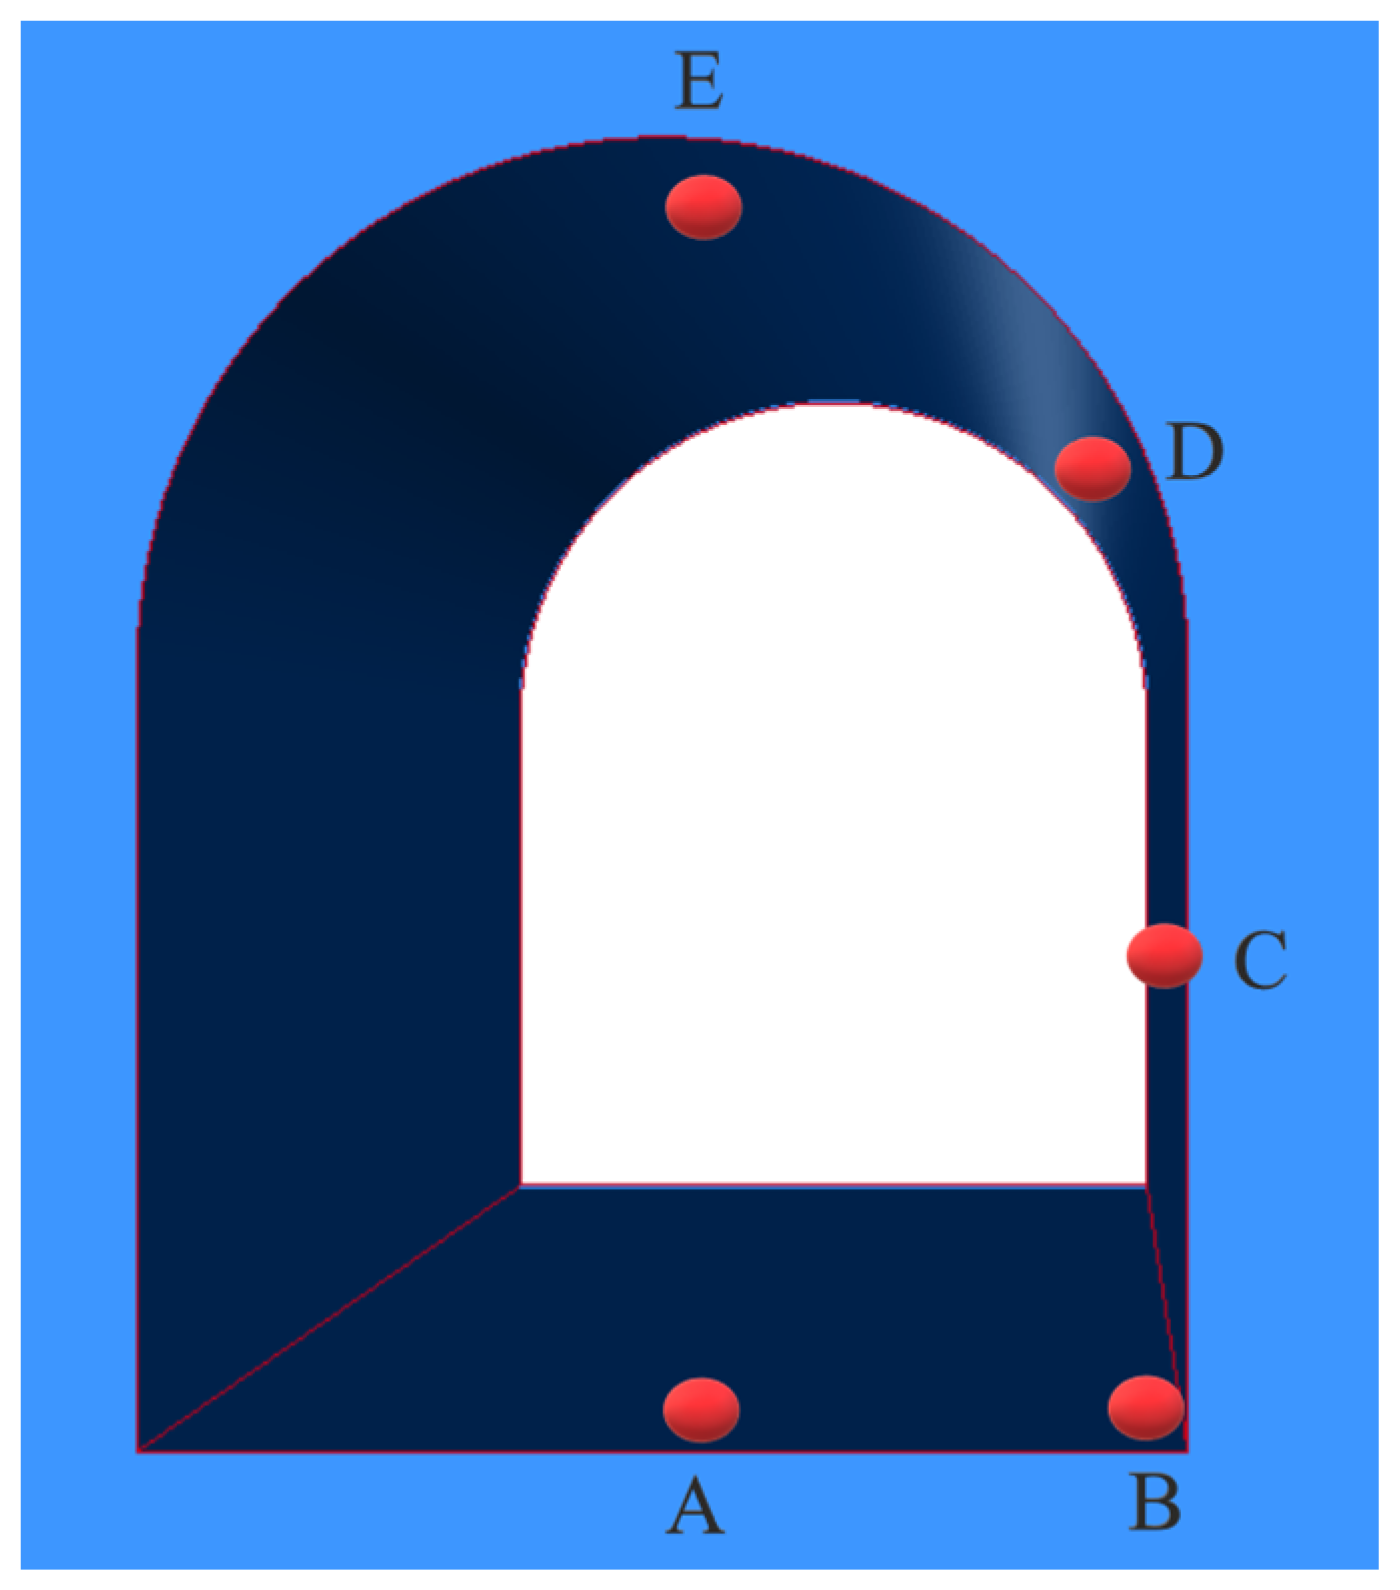
Measuring points are arranged in the surrounding rock on the right side of the existing tunnel, and the measurement points are shown in Figure 4. The dynamic response of the existing tunnel to the adjacent blasting load is reflected by the change of vibration velocity at five measuring points, and the effect of blasting vibration reduction is analyzed.

3.3. Comparison of Numerical Simulation Results

3.3.1. Stress Propagation Comparison

The stress propagation path around the blasting hole at the same time under the two schemes is shown in Figure 5 and Figure 6.
As can be seen from Figure 5, when the explosion occurs, the vibration propagates in the form of stress waves in the surrounding rock. The stress at the blasting hole increases rapidly, and the propagation form and vibration velocity are similar, all of which are centered on the blasting hole and radiate around. The strength decreases gradually, and a stress ring is formed around the hole. As can be seen from Figure 6, different from the concentric stress rings of ordinary detonator blasting, blasting simulation using mechanical cutting can obviously find that blasting stress waves propagate along the four directions of the cutting hole. The stress gradually forms a petal-like stress ring and then diffuses outward. The stress magnitude and diffusion range of the mechanical cutting method are smaller than that of full-section detonator blasting. This is due to the fact that the mechanical cutting creates multiple free surfaces for blasting, and the paths of stress diffusion are increased. The whole stress of the surrounding rock is also reduced.

3.3.2. Comparison of Vibration Velocity

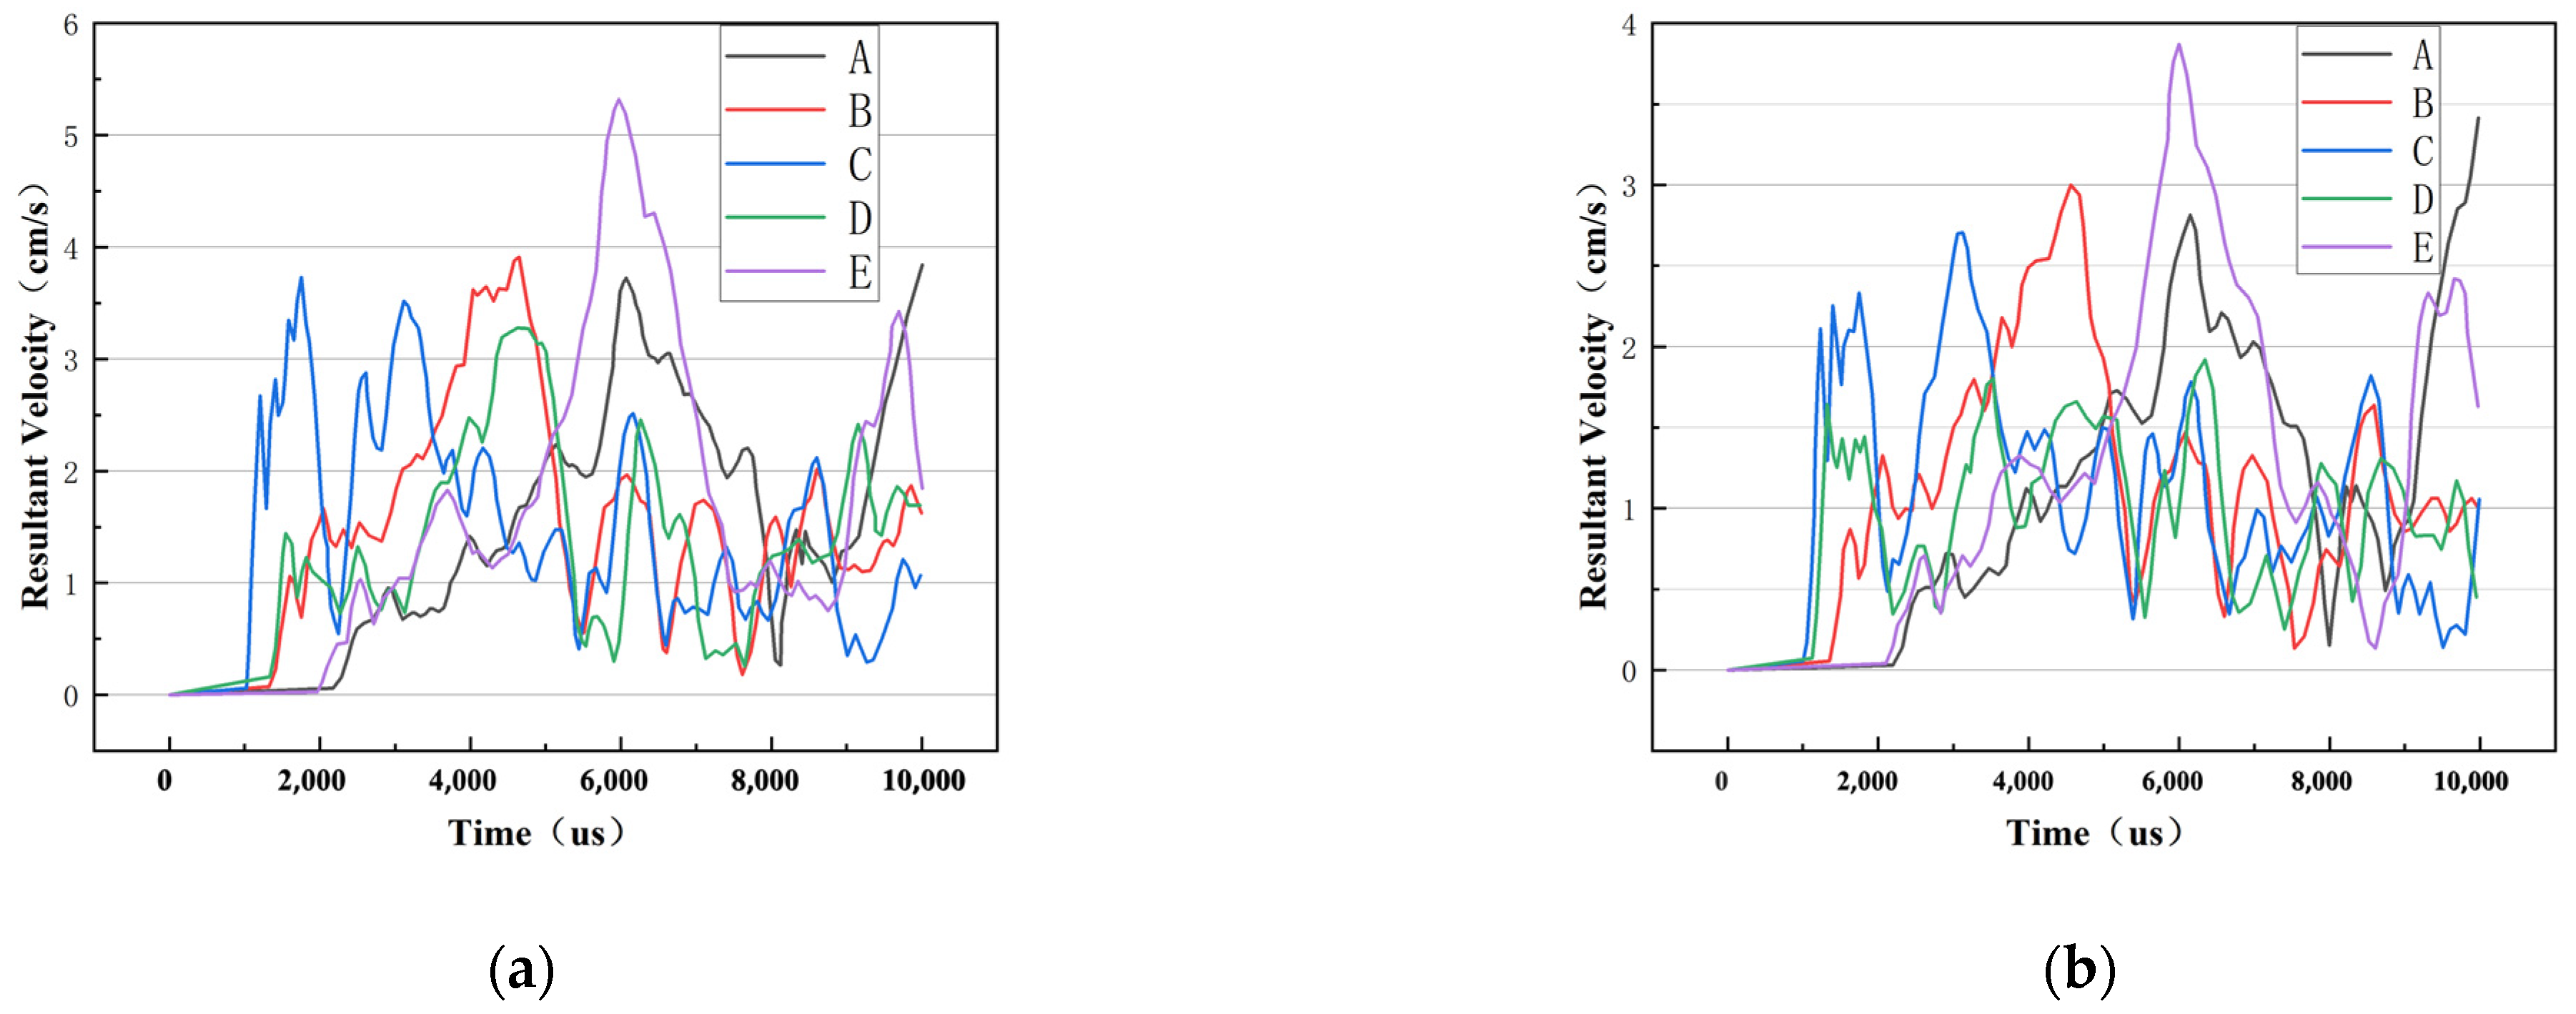
The vibration velocity of five measurement points at the arch bottom, arch foot, arch waist, spandrel, and arch top of the existing tunnel are shown in Figure 7.
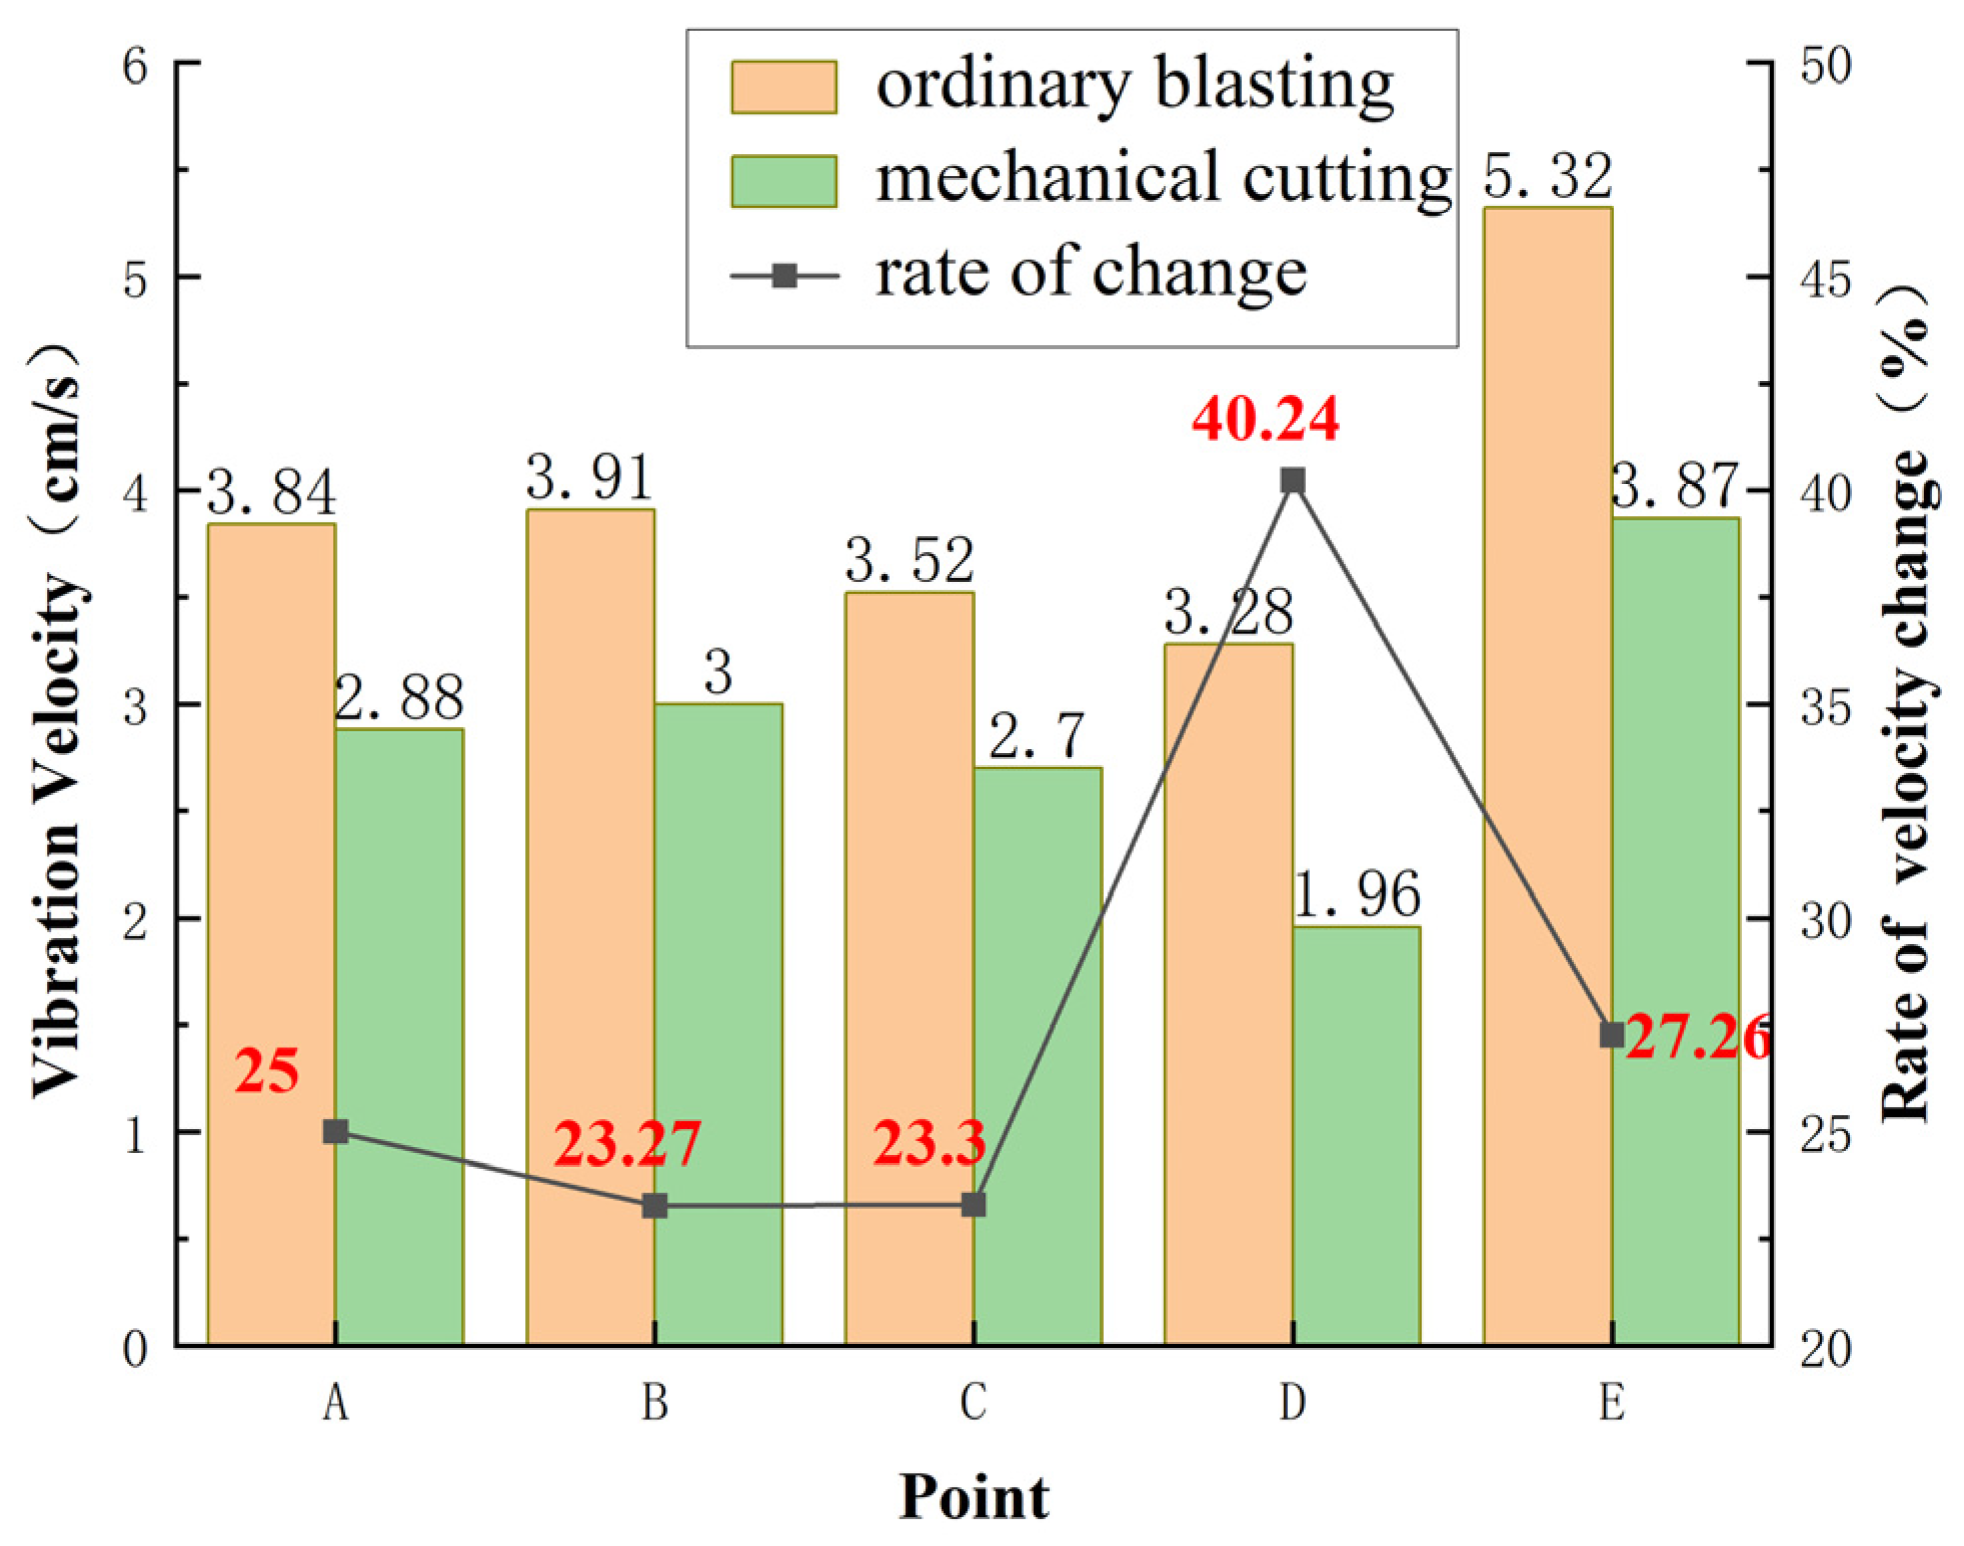
The peak vibration velocity of each measuring point of the existing deterioration tunnel and the rate of change is shown in Figure 8.
As can be seen from Figure 7 and Figure 8, compared with full-section ordinary detonator blasting. Mechanical cutting combined with the detonator blasting method can effectively reduce the vibration velocity of each measuring point in the existing tunnel. Under the two schemes, the position of the peak vibration velocity of the tunnel does not change, and both are in the vault. The change rate of peak vibration velocity clearly shows that the biggest change of vibration velocity is point D, that is, the spandrel position on the side of the explosion. Measuring point D is the closest to the source of the explosion, which more intuitively demonstrates the vibration reduction effect of mechanical cutting combined with an ordinary detonator.

4. Field Experiment of Blasting Vibration Control

4.1. Arrangement of Existing Tunnel Measuring Points

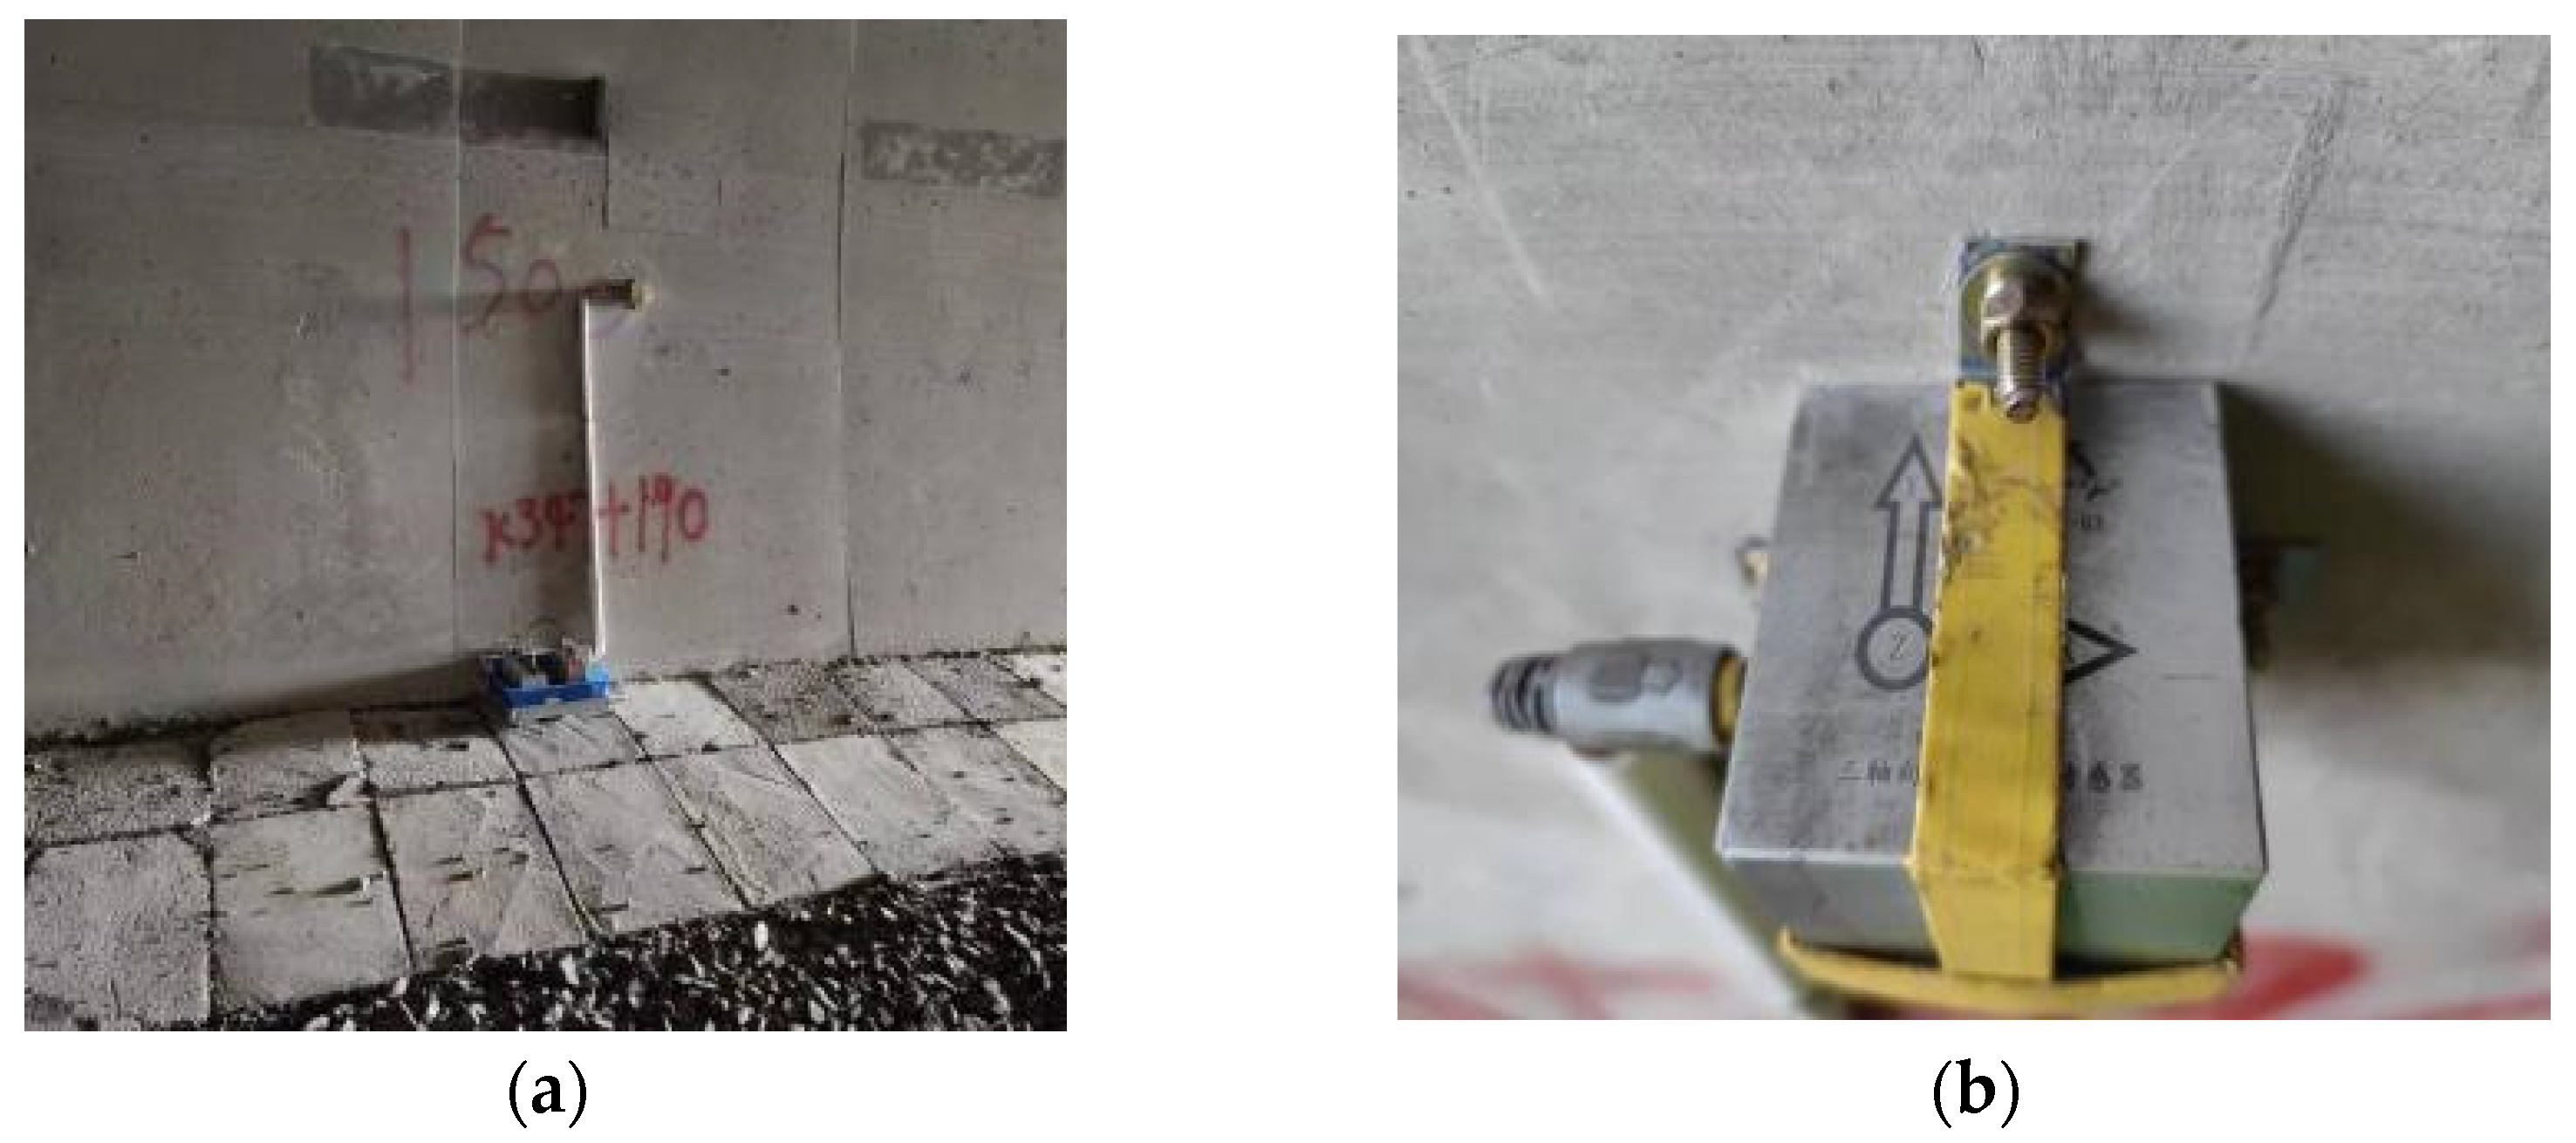
A total of four vibration monitors were set up in this experiment, each of which was placed at the right arch waist, as shown in Figure 9 and Figure 10. The measuring points were successively set at K347 + 190, K347 + 180, K347 + 170, and K347 + 160, and each scheme was tested three times.

4.2. Blasting Scheme

4.2.1. Normal Detonator Blasting

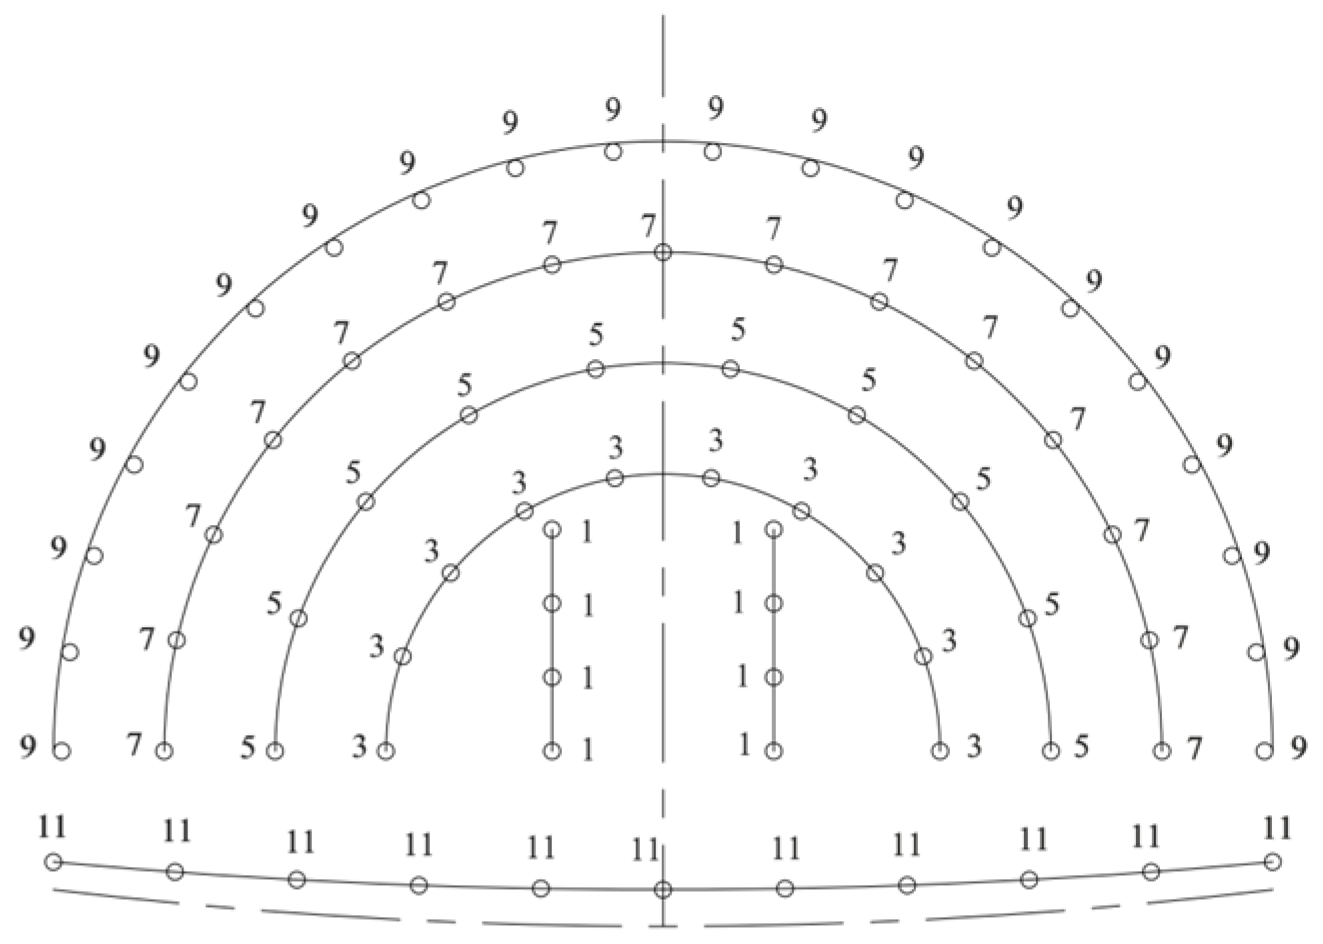
The blasting cycle footage of the ordinary detonator is 1.2 m. The length of the auxiliary hole and peripheral hole is 1.4 m, the cut hole is 1.6 m, and the hole distance is 40 cm. The layout and spacing of tunnel cutting holes, auxiliary holes, and peripheral holes are shown in Figure 11. The number of blasting holes, charge capacity, and maximum section charge of different categories are shown in Table 4.

4.2.2. Mechanical Cutting Blasting

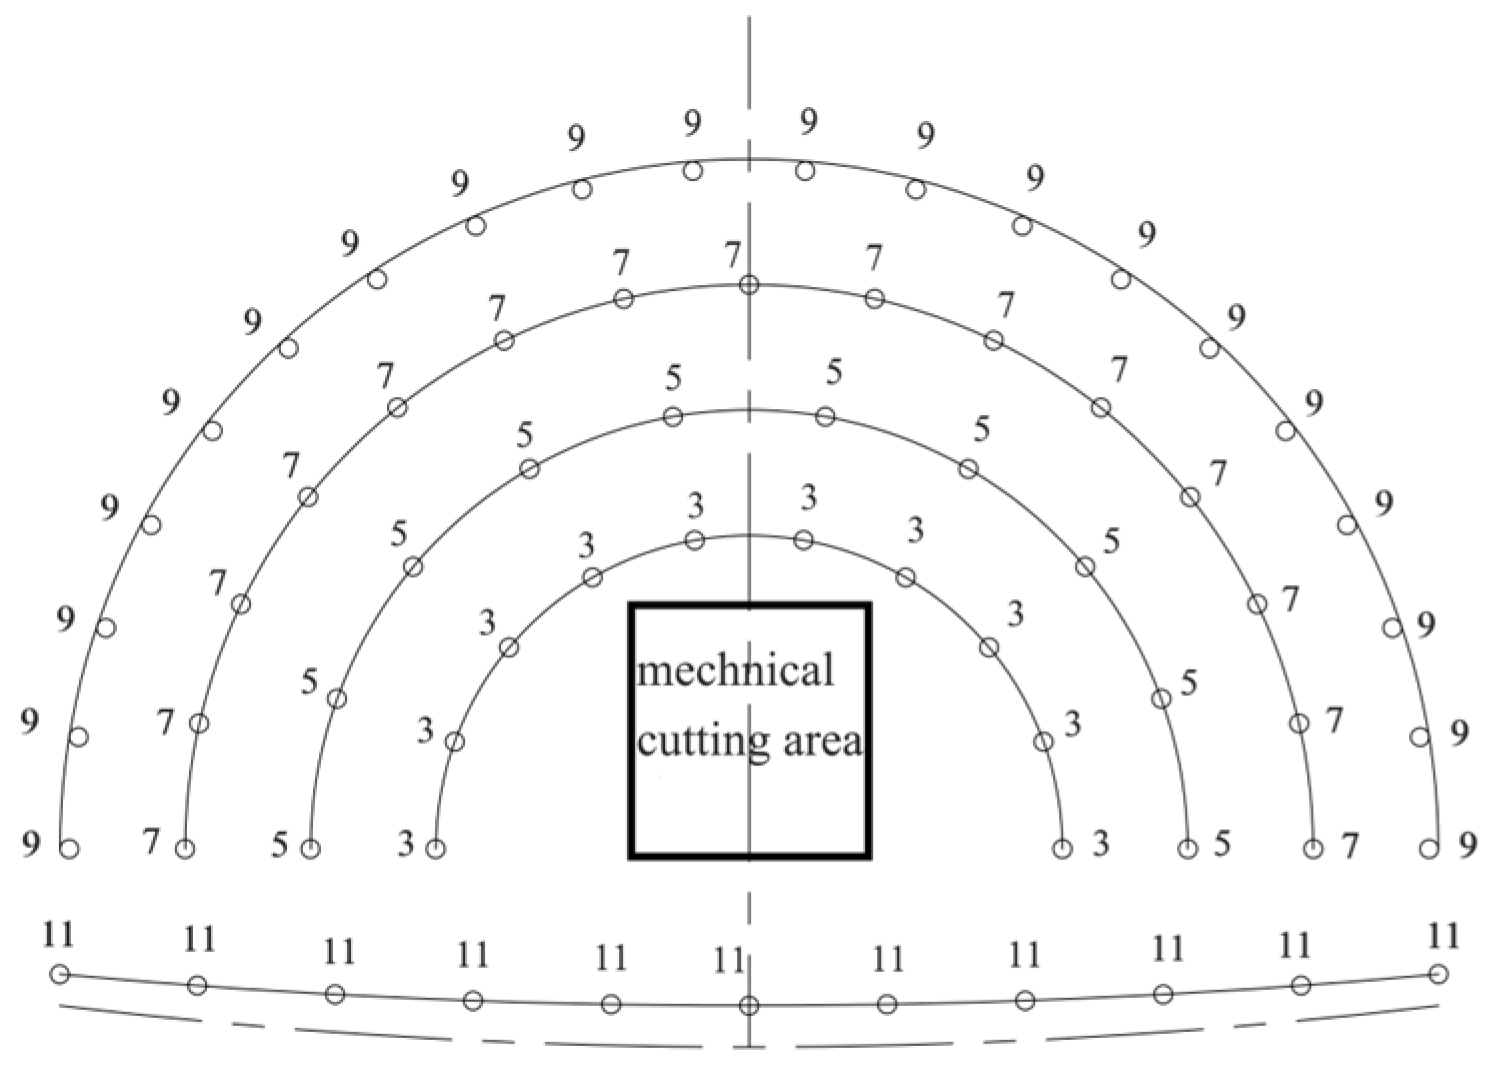
The mechanical cutting blasting method refers to using a hydraulic sandblaster to cut an area first (1.2 m × 1.2 m × 1.6 m). Normal detonators are then used for blasting. It is only necessary to lay the charge number of auxiliary holes and peripheral holes; the circulation footage is 1.2 m, the blasting hole length of auxiliary holes and peripheral holes is 1.4 m, and the hole distance is designed to be 40 cm. The layout and spacing of auxiliary holes and peripheral holes are shown in Figure 12, and the specific design parameters are shown in Table 5.

4.3. Comparison of Vibration Velocity

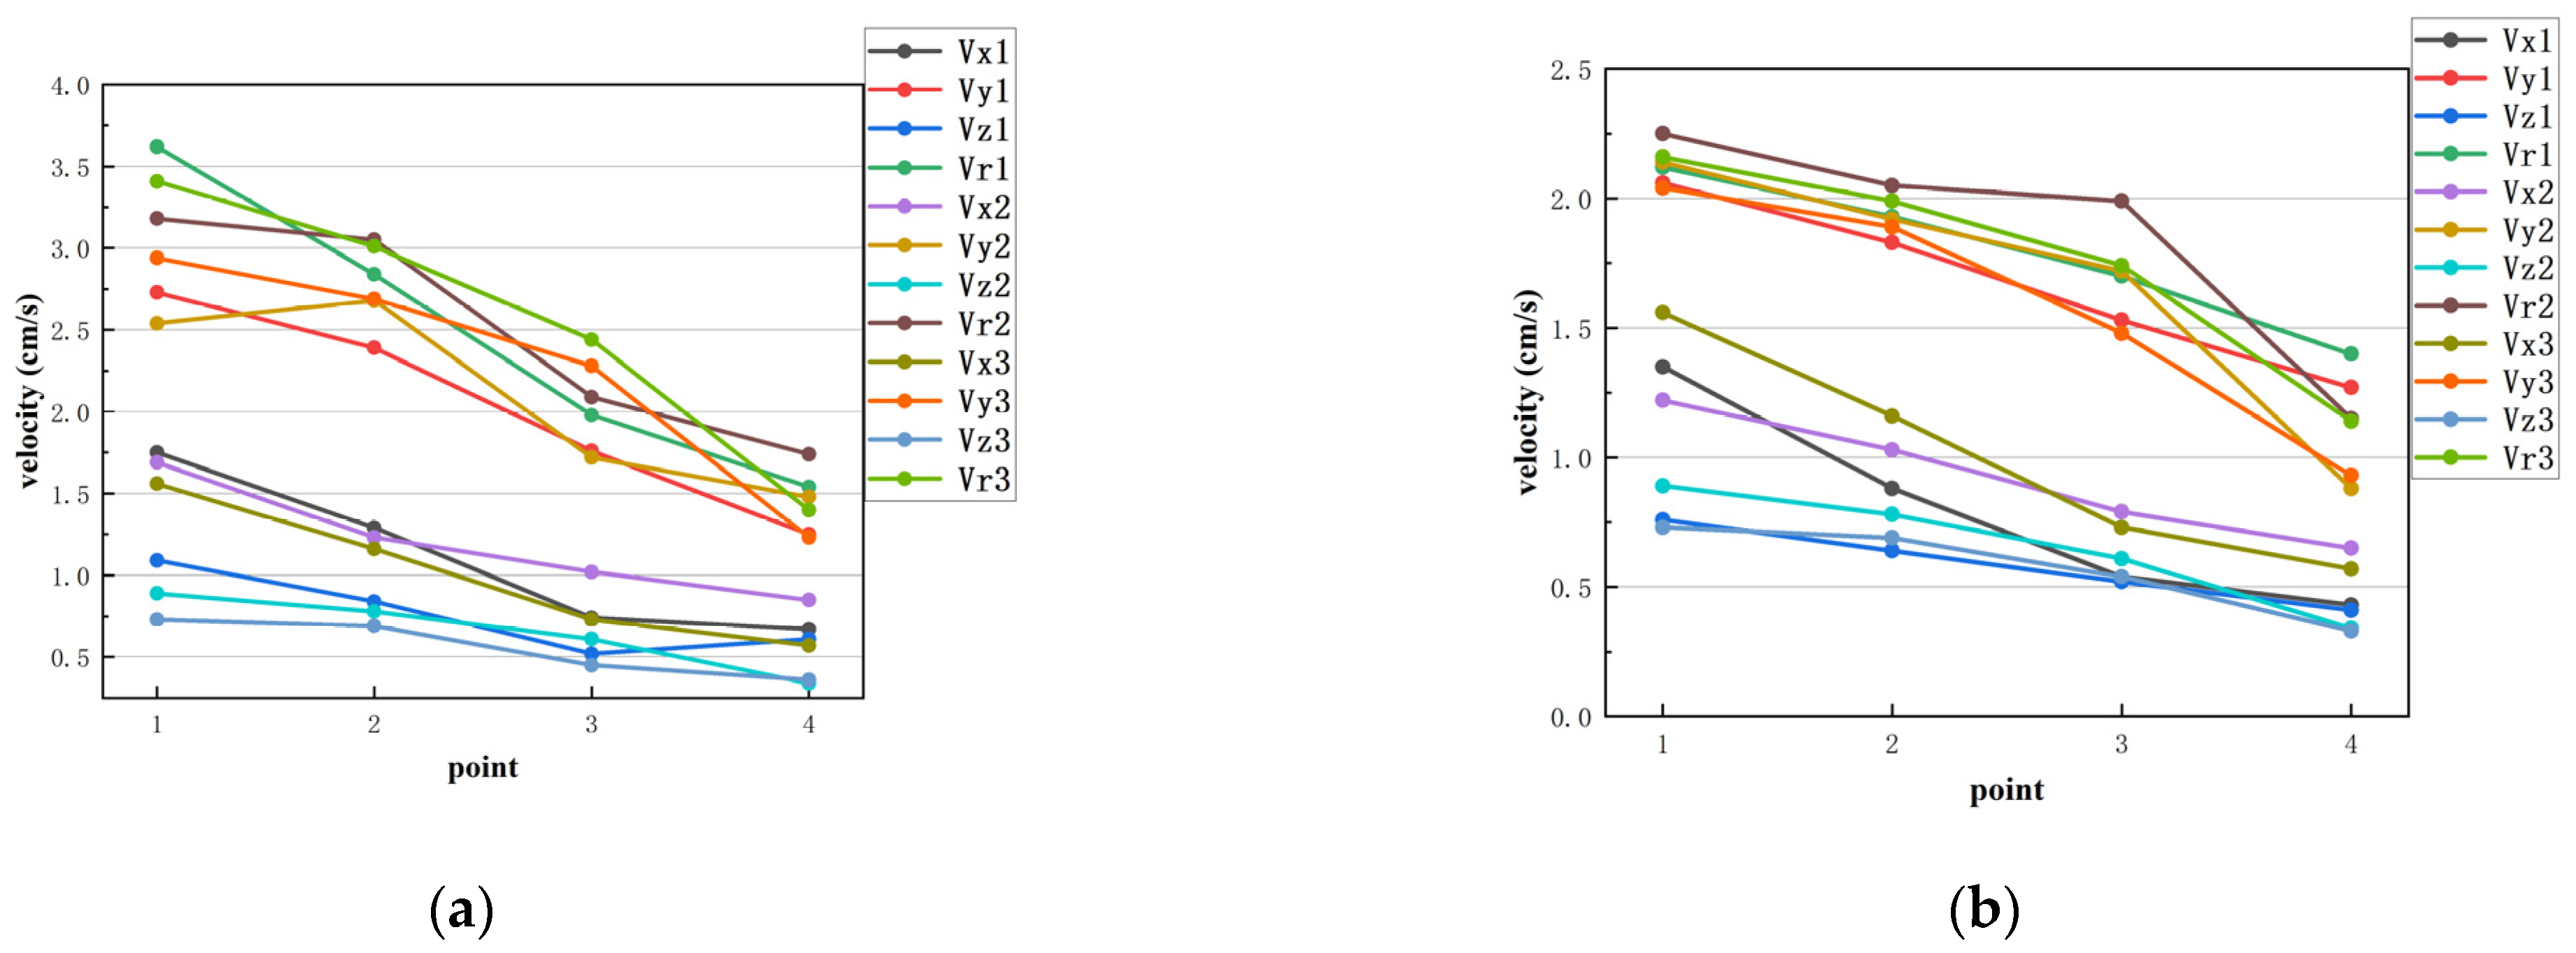
Three experimental schemes were carried out for full-section detonator blasting and mechanical cutting blasting. The values of fractional velocity and resultant velocity at the measuring points of each experiment were recorded. The vibration velocity is shown in Figure 13. In the figure, Vx1 represents the vibration velocity in the X direction in the first experimental scheme, and Vr represents the resultant velocity.
The peak vibration velocity of each measuring point and the reduction rate of vibration velocity of each measuring point under the two schemes are shown in Figure 14.
As can be seen from Figure 14, mechanical cutting combined with an ordinary detonator blasting scheme can significantly reduce blasting vibration velocity in field experiments. The vibration reduction rate of measuring point 1 is the largest, reaching 38.01%, followed by 26.23% at measuring point 2, 19.54% at measuring point 4, and 18.44% at measuring point 3. Therefore, mechanical cutting can be used in engineering and has a better vibration reduction effect, which ensures the safety of existing deterioration tunnels.

5. Wavelet Packet Analysis of Measured Data

The natural vibration frequency of the existing tunnel is generally low, and the main frequency of blasting vibration is also low. If the two frequencies are the same or similar, a resonance phenomenon will occur. The resonance phenomenon is unfavorable to the deterioration of the tunnel. We need to clarify the main frequency distribution of the measured data to avoid this phenomenon.
Blasting seismic waves are a kind of complex, non-stationary random signal with the characteristics of short time and sudden change. At present, time–frequency analysis methods have been widely used in the analysis of blasting vibration signals, mainly including fast Fourier transform, HHT analysis, and wavelet packet analysis methods. Among them, the fast Fourier transform has serious shortcomings in time–frequency analysis. The analysis accuracy of HHT analysis in the signal boundary region is poor, and the “flying wing” phenomenon often appears at the end [22]. Wavelet packet analysis has good adaptability and high resolution and has obvious advantages in the analysis of blasting vibration signals.
In the field blasting scheme, mechanical cutting combined with ordinary detonator blasting is used. The blasting vibration signal under this method is analyzed by wavelet packet, and the relationship between vibration velocity energy and frequency is deeply studied. Wavelet packet energy analysis can reflect the excitation effect of blasting vibration on building structure from intensity and frequency. The main excitation frequency interval of the dynamic response of the building structure is determined by signal decomposition and reconstruction. Thus, the stability of existing deterioration tunnels can be further guaranteed.
Fei [23] and Shan et al. [24] used wavelet packet energy spectrum analysis to analyze the distribution of blasting vibration signals in the frequency band. Tang [25] studied vibration caused by blasting seismic waves based on wavelet transform and wavelet analysis techniques. Han [26] used the wavelet packet analysis method to compare the vibration characteristics in the near and far regions of deep-hole step blasting and discussed the energy frequency band distribution law in the near and far region. Based on the wavelet packet energy analysis method, the distribution of blasting vibration signal energy in each frequency band is discussed, which provides a way to evaluate the safety of blasting vibration and reduce the damage of blasting vibration.
Daubechies wavelet basis function has good compact support, smoothness, continuity, and symmetry. It is widely used in the analysis and research of engineering signals [27]. In this paper, MATLAB is used to decompose and reconstruct the measured signals of the measuring points 1 and 2 with a 7-layer wavelet packet of db8 wavelet base [28], and the reconstructed nodes are analyzed in the spectrum and studied in energy distribution. The instrument sampling frequency is 4000 Hz, and the Nyquist frequency is 2000 Hz. There are total of 7 layers of vibration signal decomposition and 128 nodes, with each node corresponding to a sub-frequency. Therefore, the obtained bandwidth of each frequency band is 15.625 Hz, and the lowest frequency band is 0~15.625 Hz. After decomposition, the frequency band distribution range of each layer signal is shown in Table 6. In the table, Si,j represent the coefficients decomposed to the JTH wavelet packet in the ith layer; i = 1, 2, 3, …, n; j = 0, …, 2, i−1.
Wavelet packet analysis is used to reflect the excitation effect of blasting vibration on the deterioration tunnel from two aspects: intensity and frequency. The main excitation frequency interval of the dynamic response of the deterioration tunnel is determined by decomposition and reconstruction. In practical engineering, the blasting scheme can be adjusted to reduce the low-frequency vibration effect produced by blasting and the distribution of dispersed energy in the low-frequency band. Thus, the damage of blasting vibration to the deterioration tunnel can be reduced.
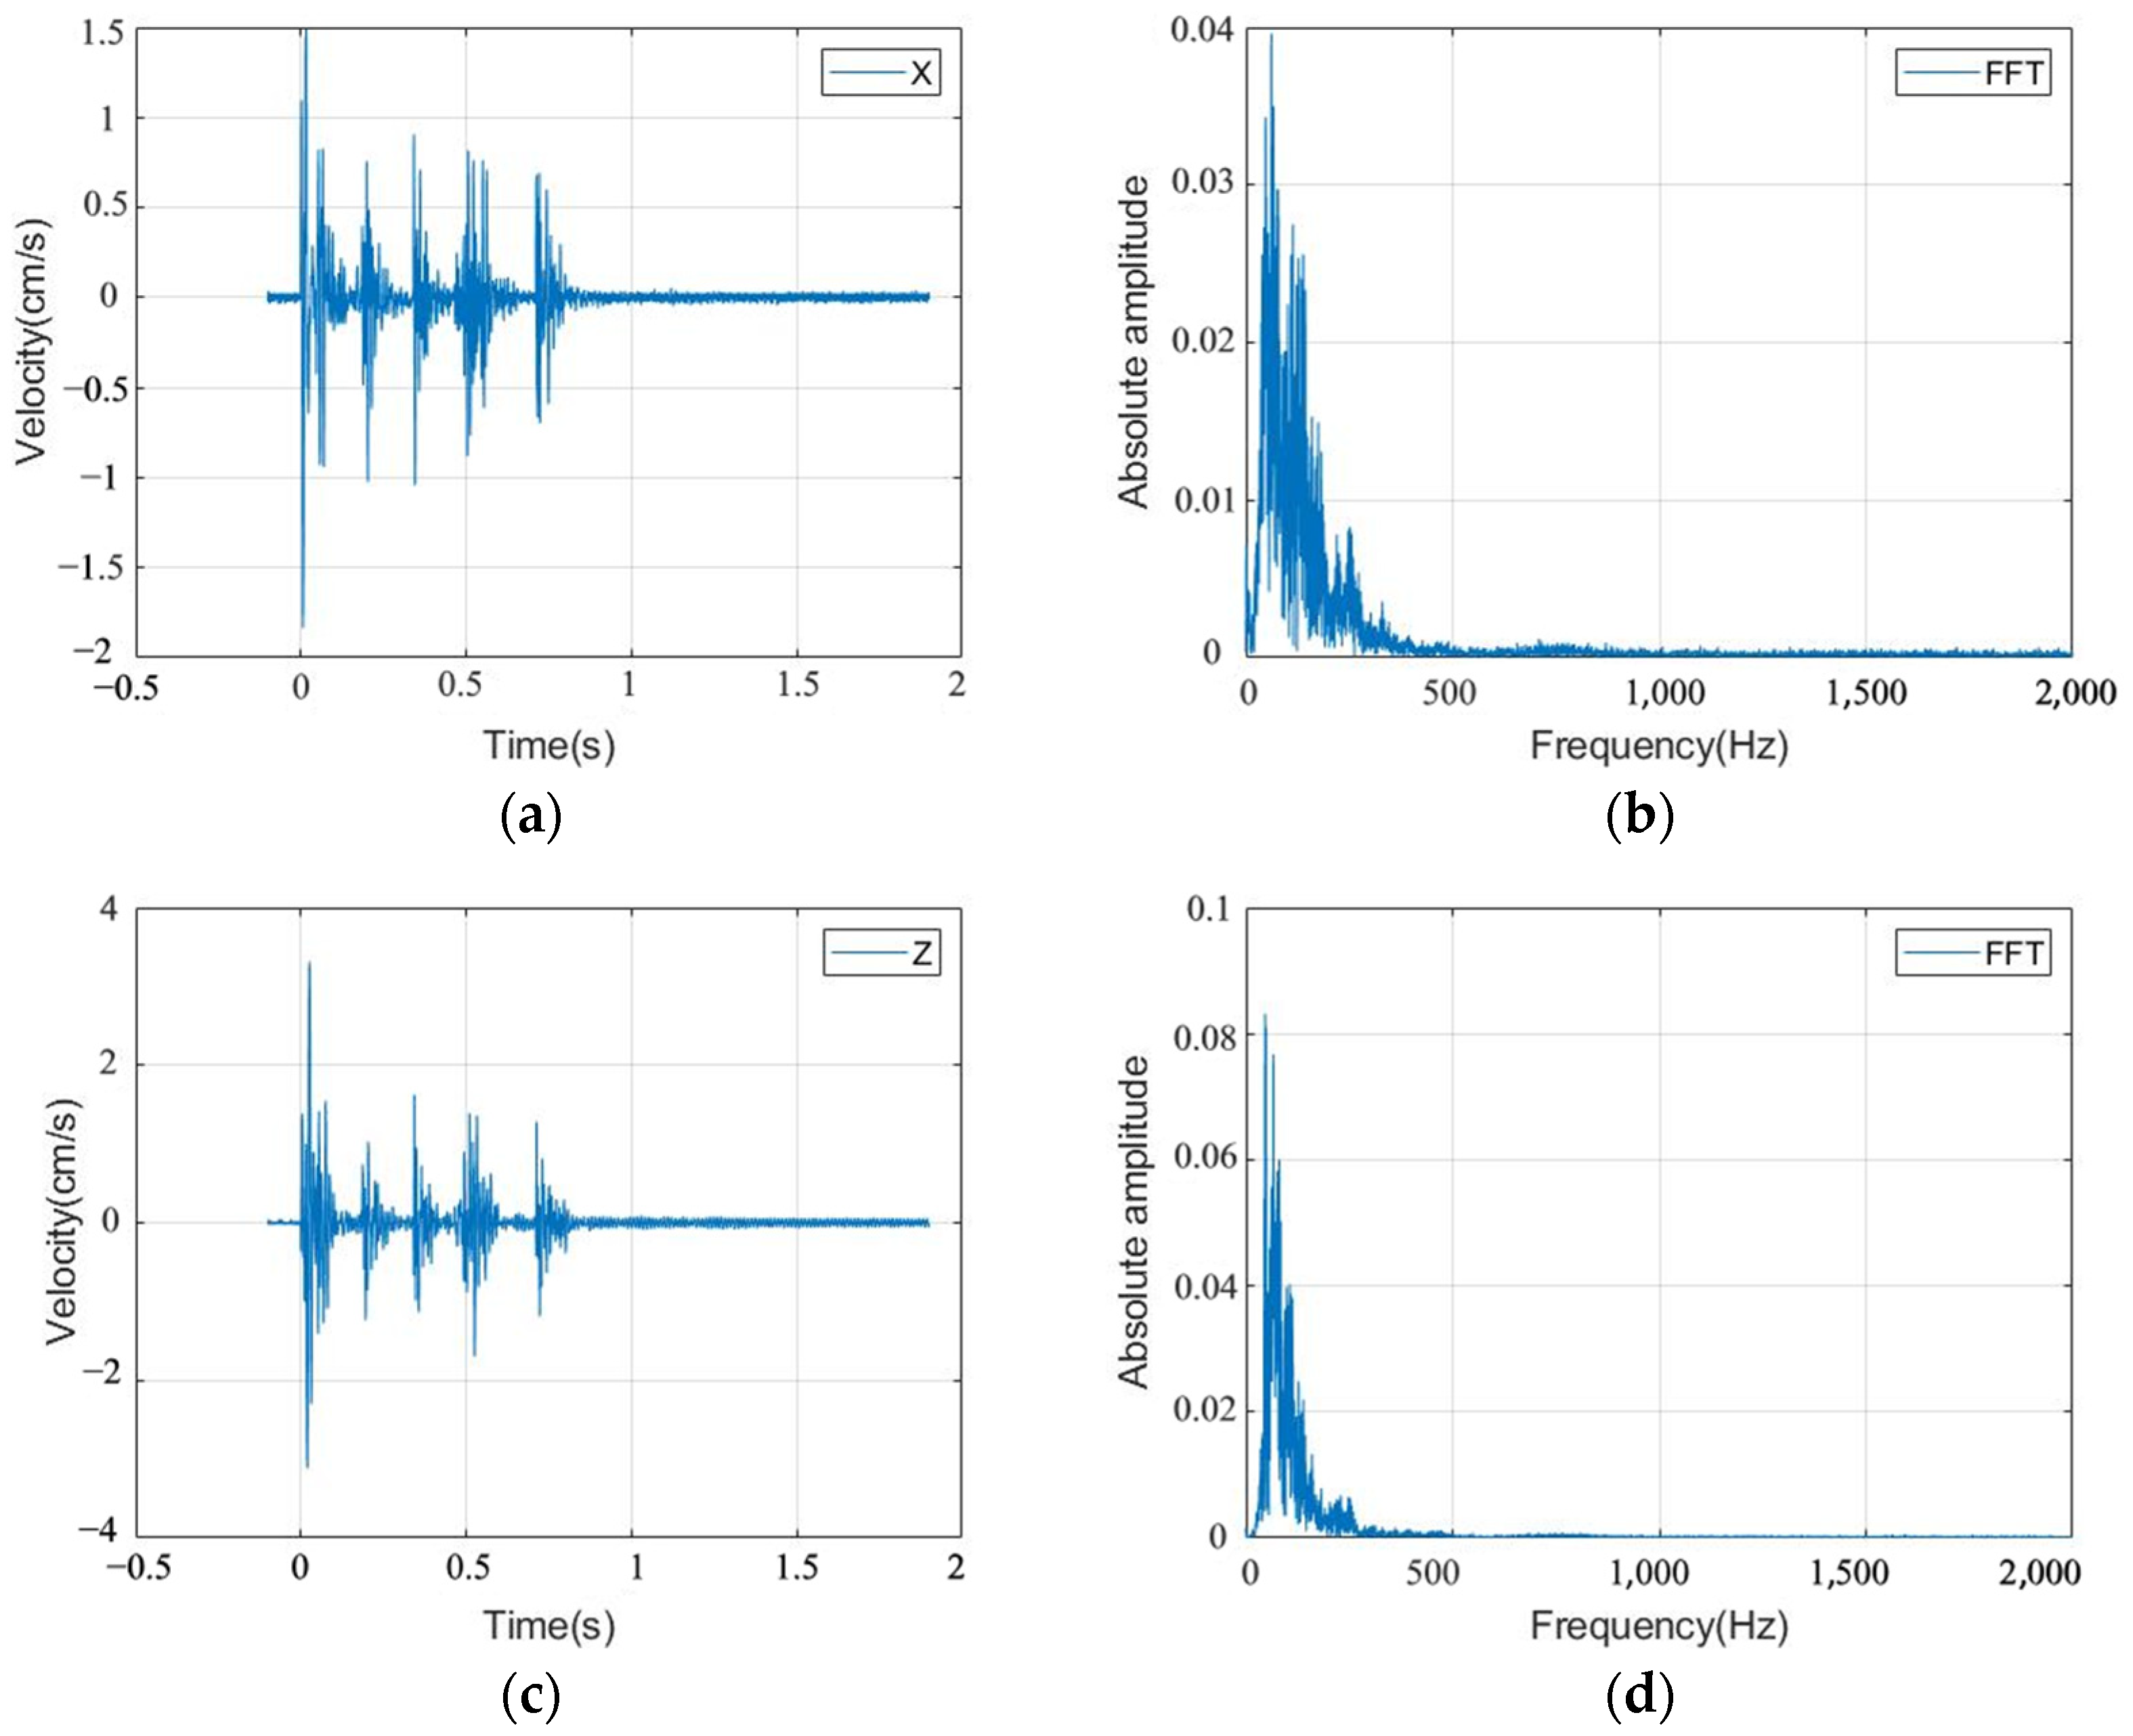
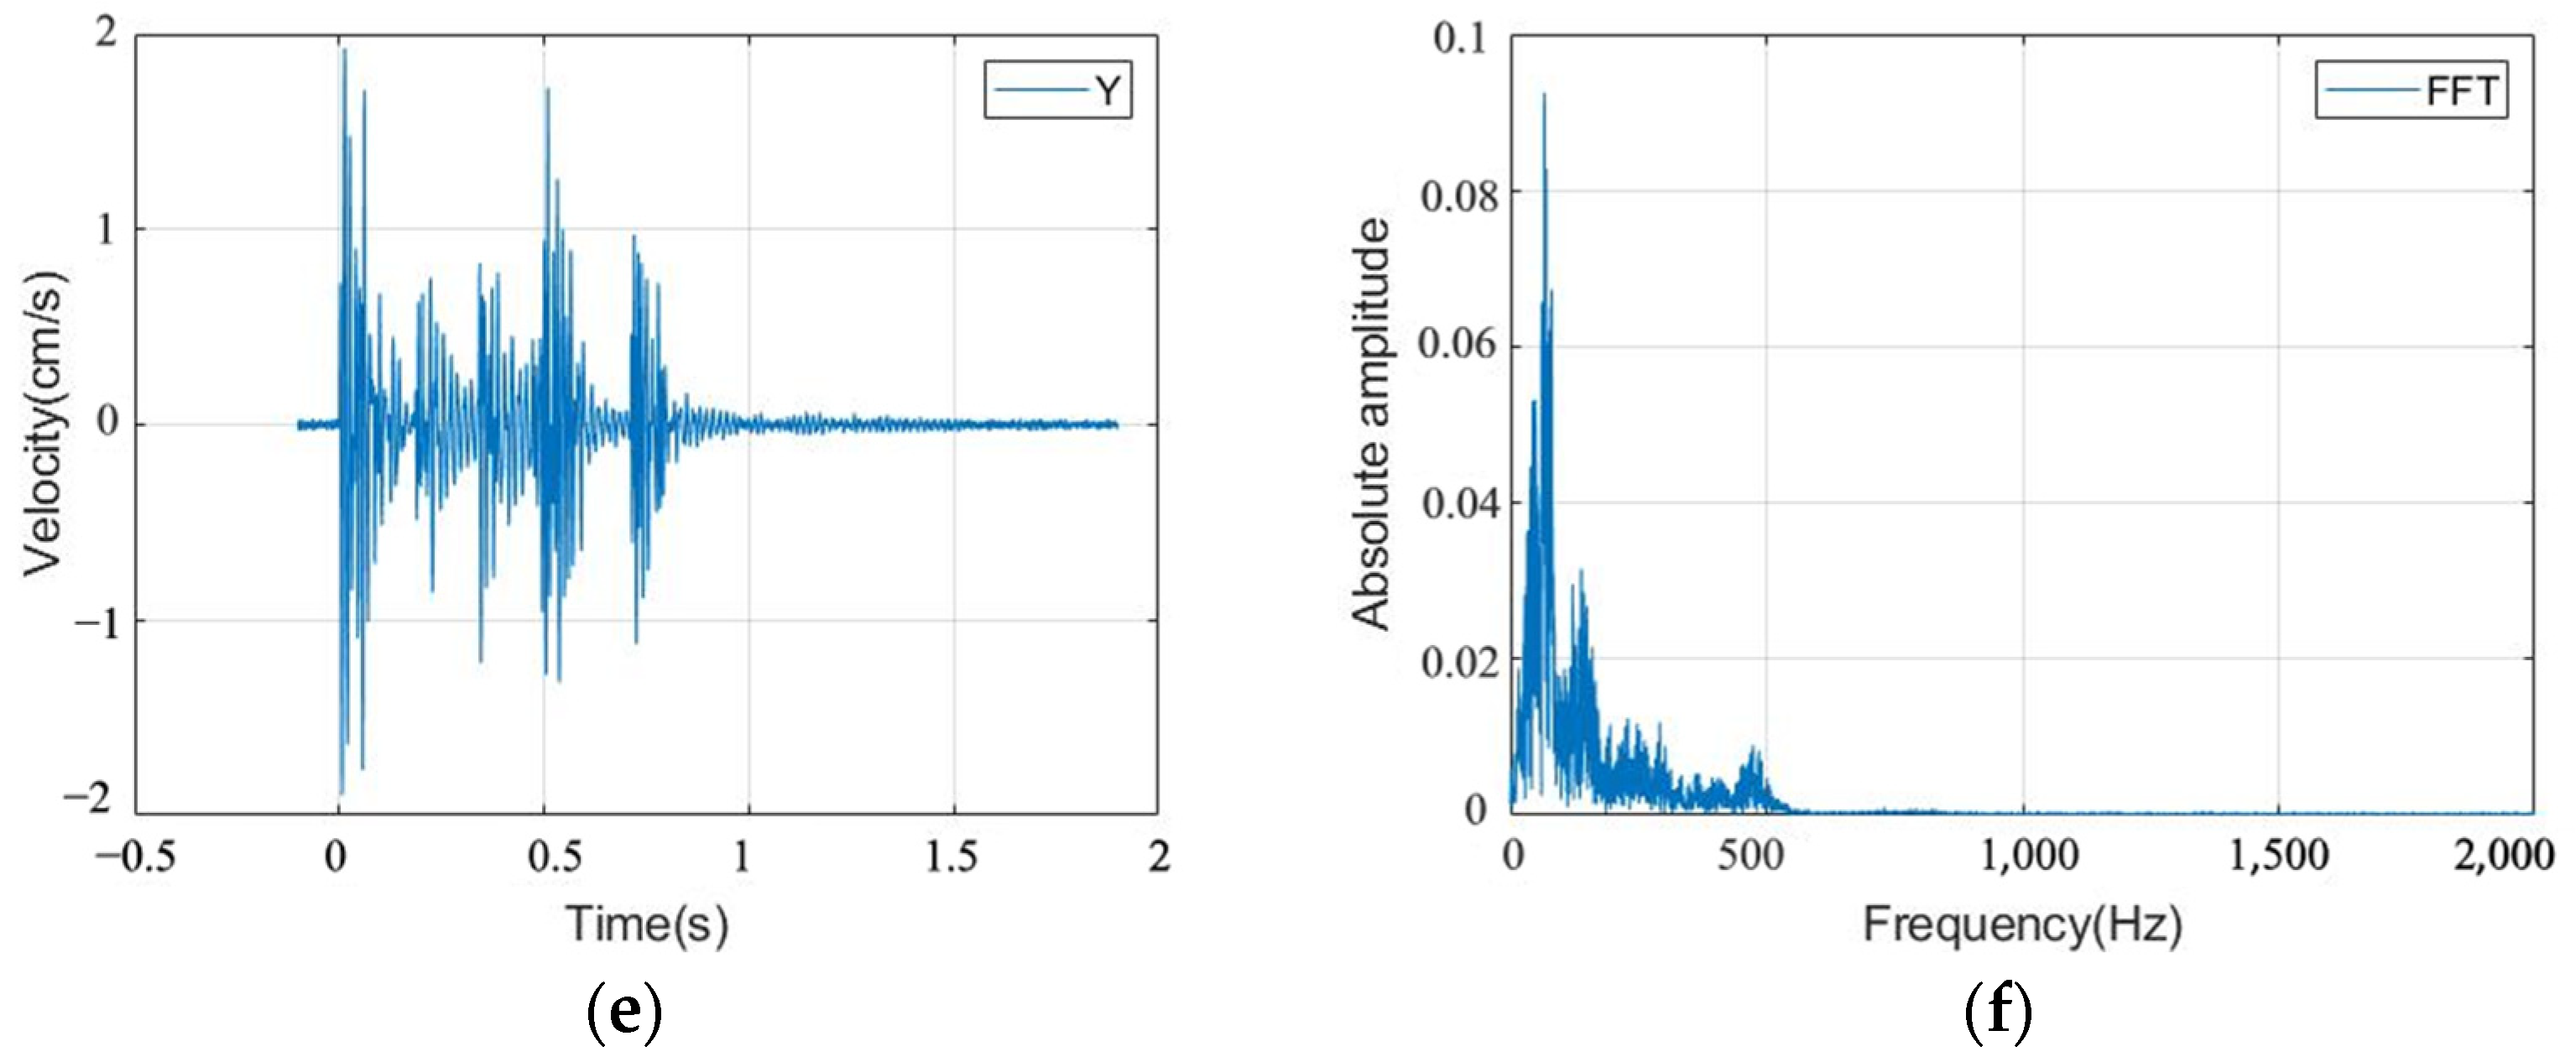
Take measuring point 1 as an example to show the decomposition and reconstruction process of MATLAB wavelet packet analysis. The original signal diagram and spectrum diagram of measuring point 1 are shown in Figure 15.
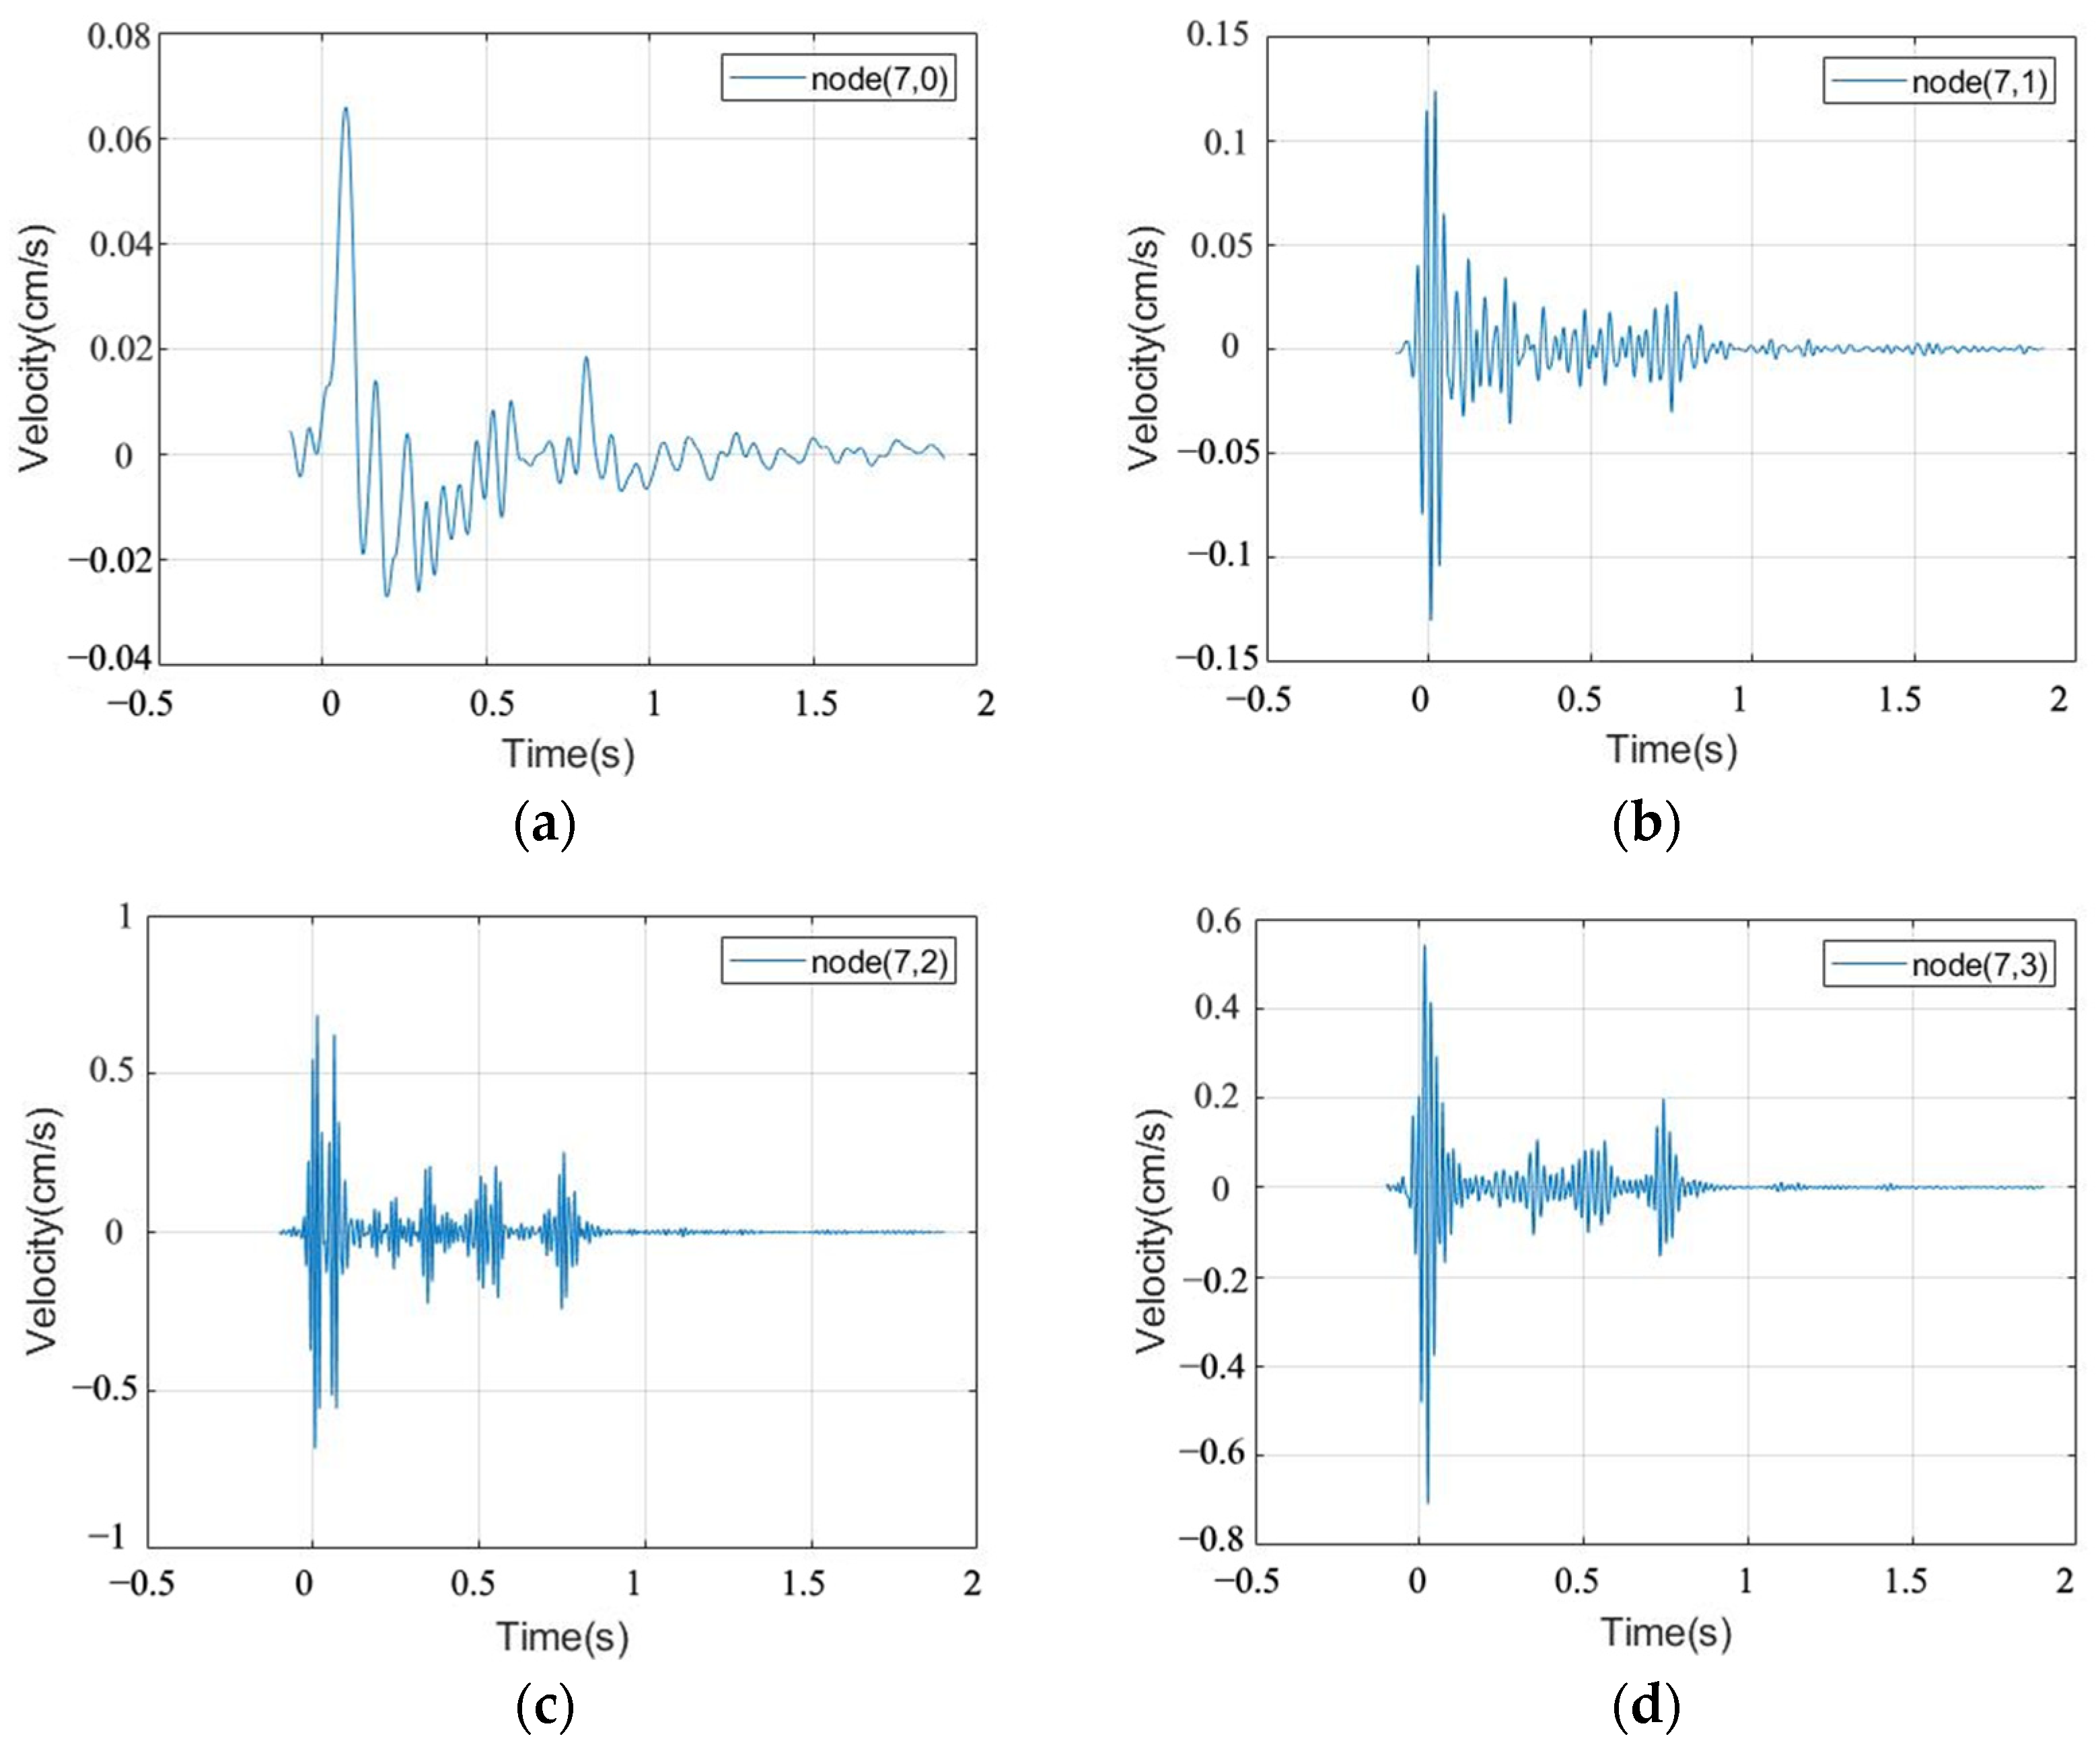
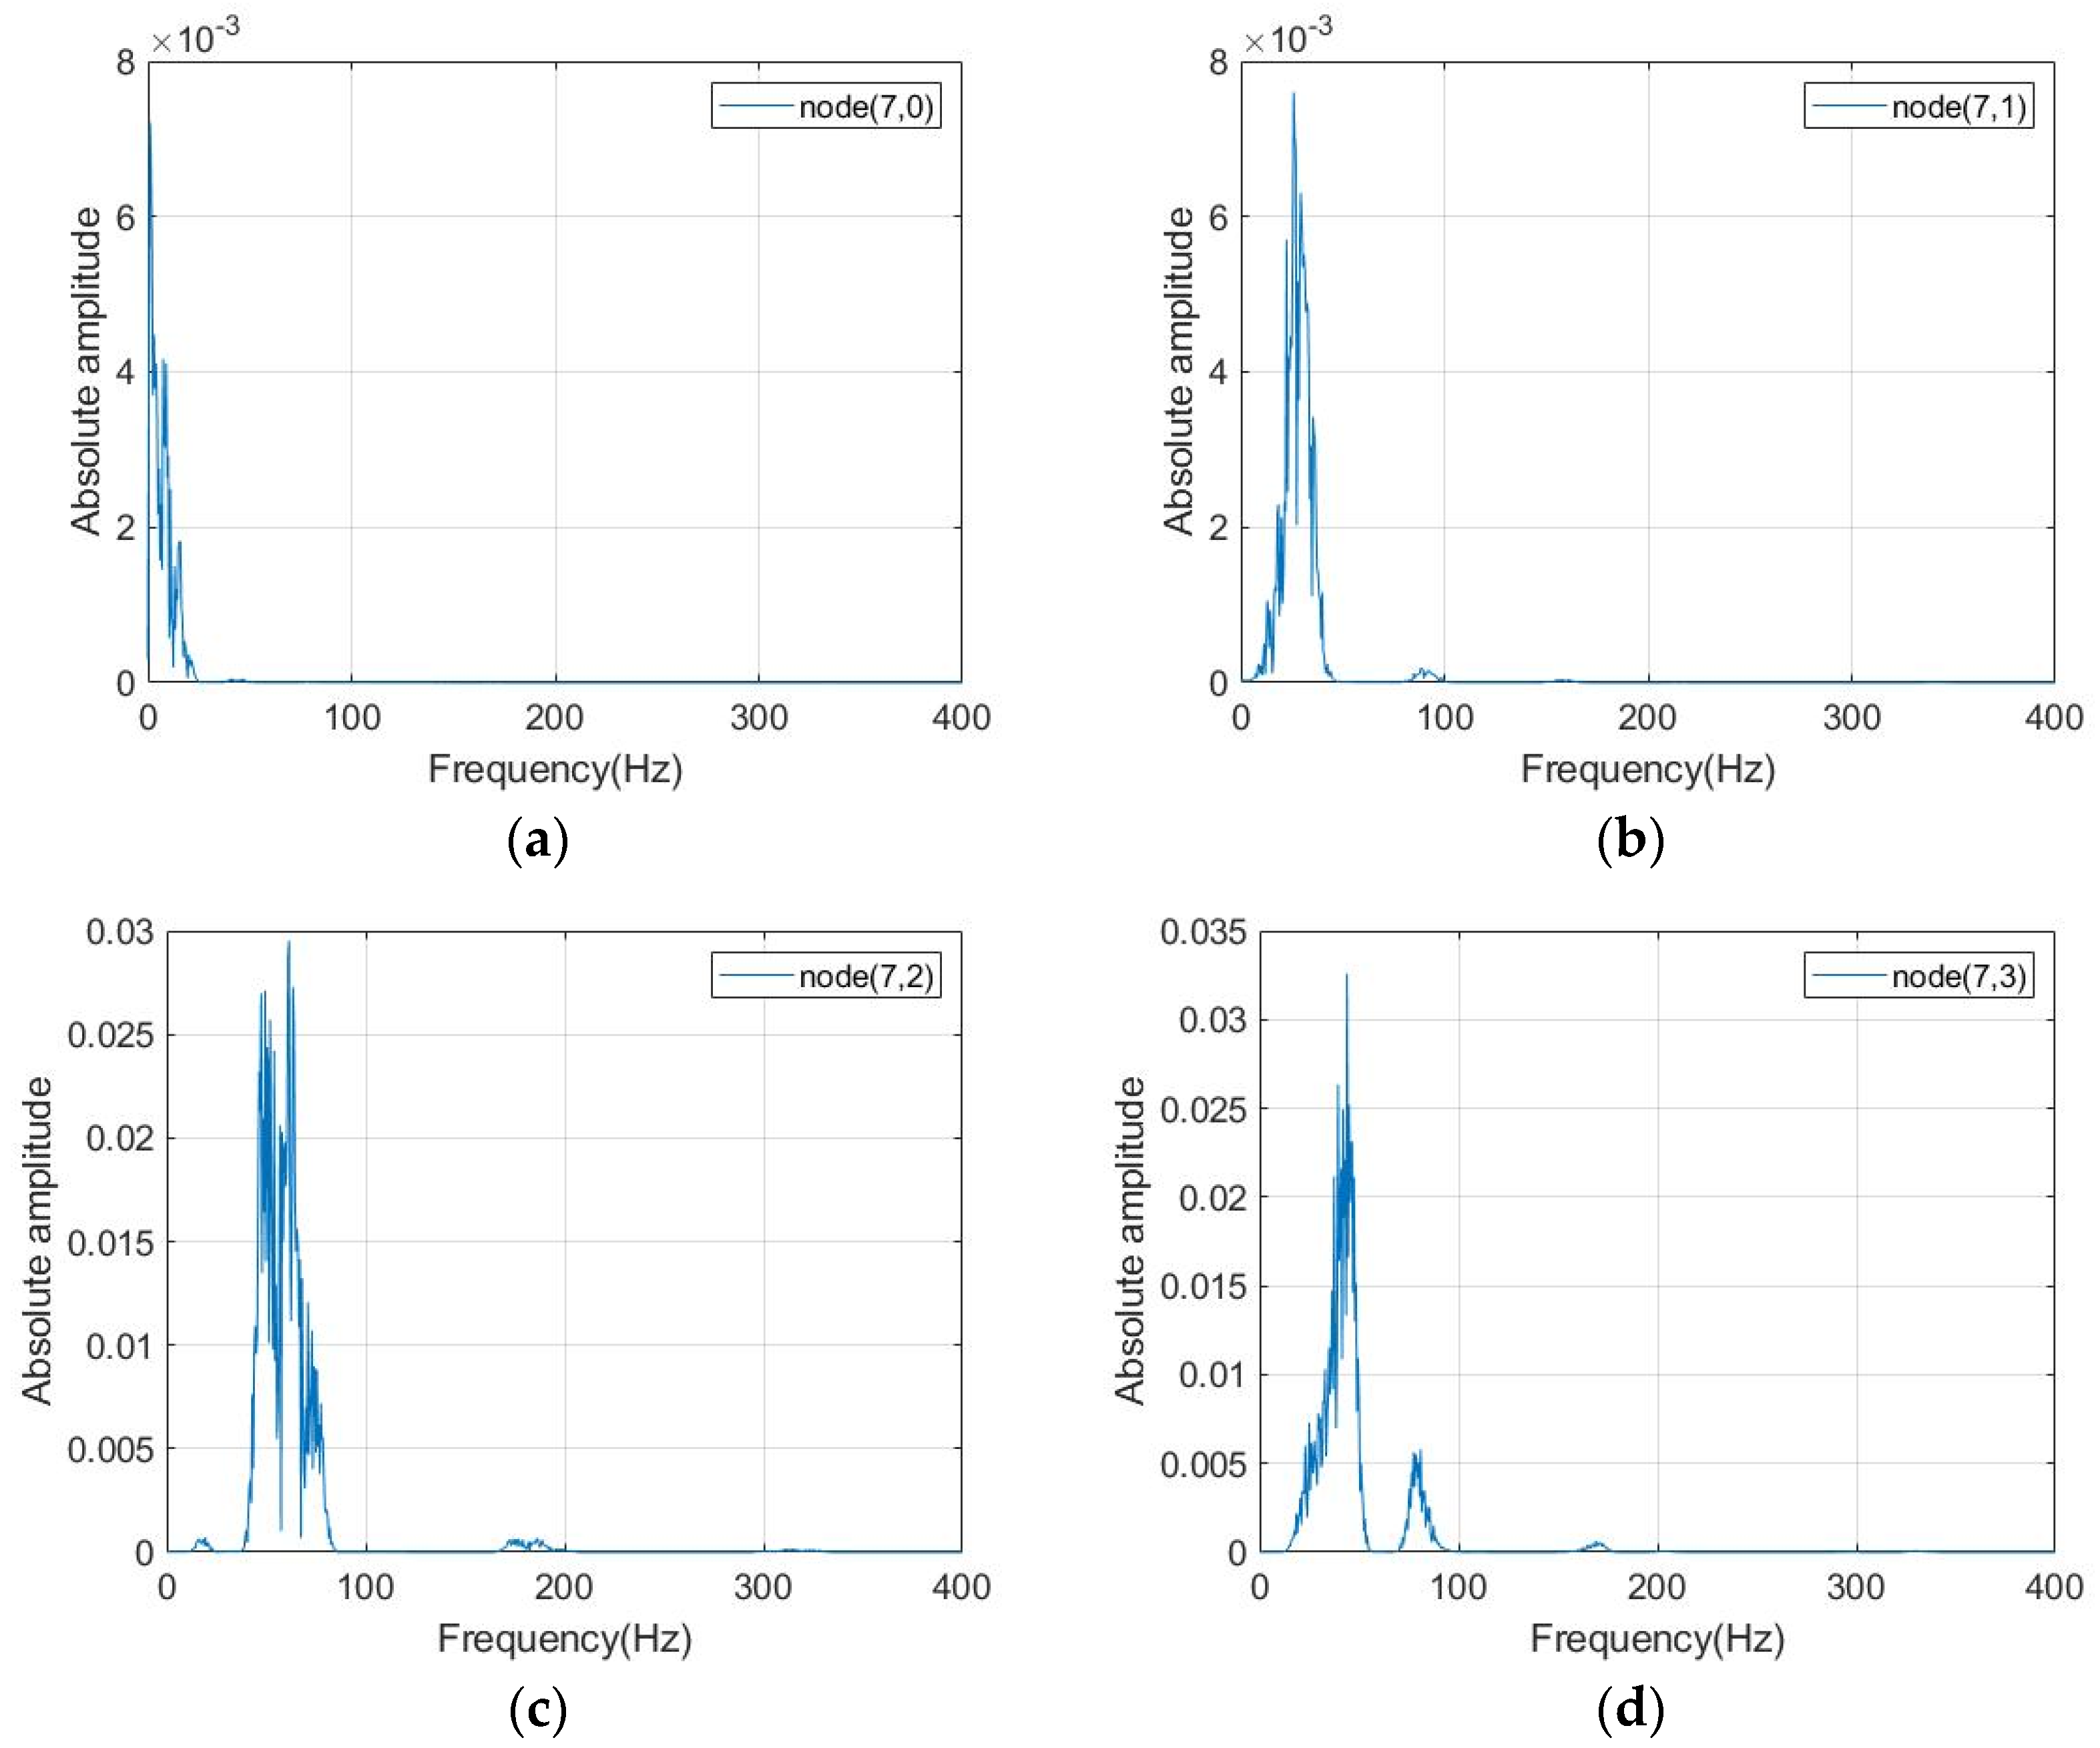
From the spectrum diagram, the blasting vibration frequency is mainly concentrated in the range of 0~250 Hz, and the first 16 frequency bands after wavelet packet decomposition are reconstructed. After the decomposition and reconstruction of vibration signals from nodes (7,0) to (7,3) in the x direction of measurement point 1, the vibration velocity and spectrum are shown in Figure 16 and Figure 17.
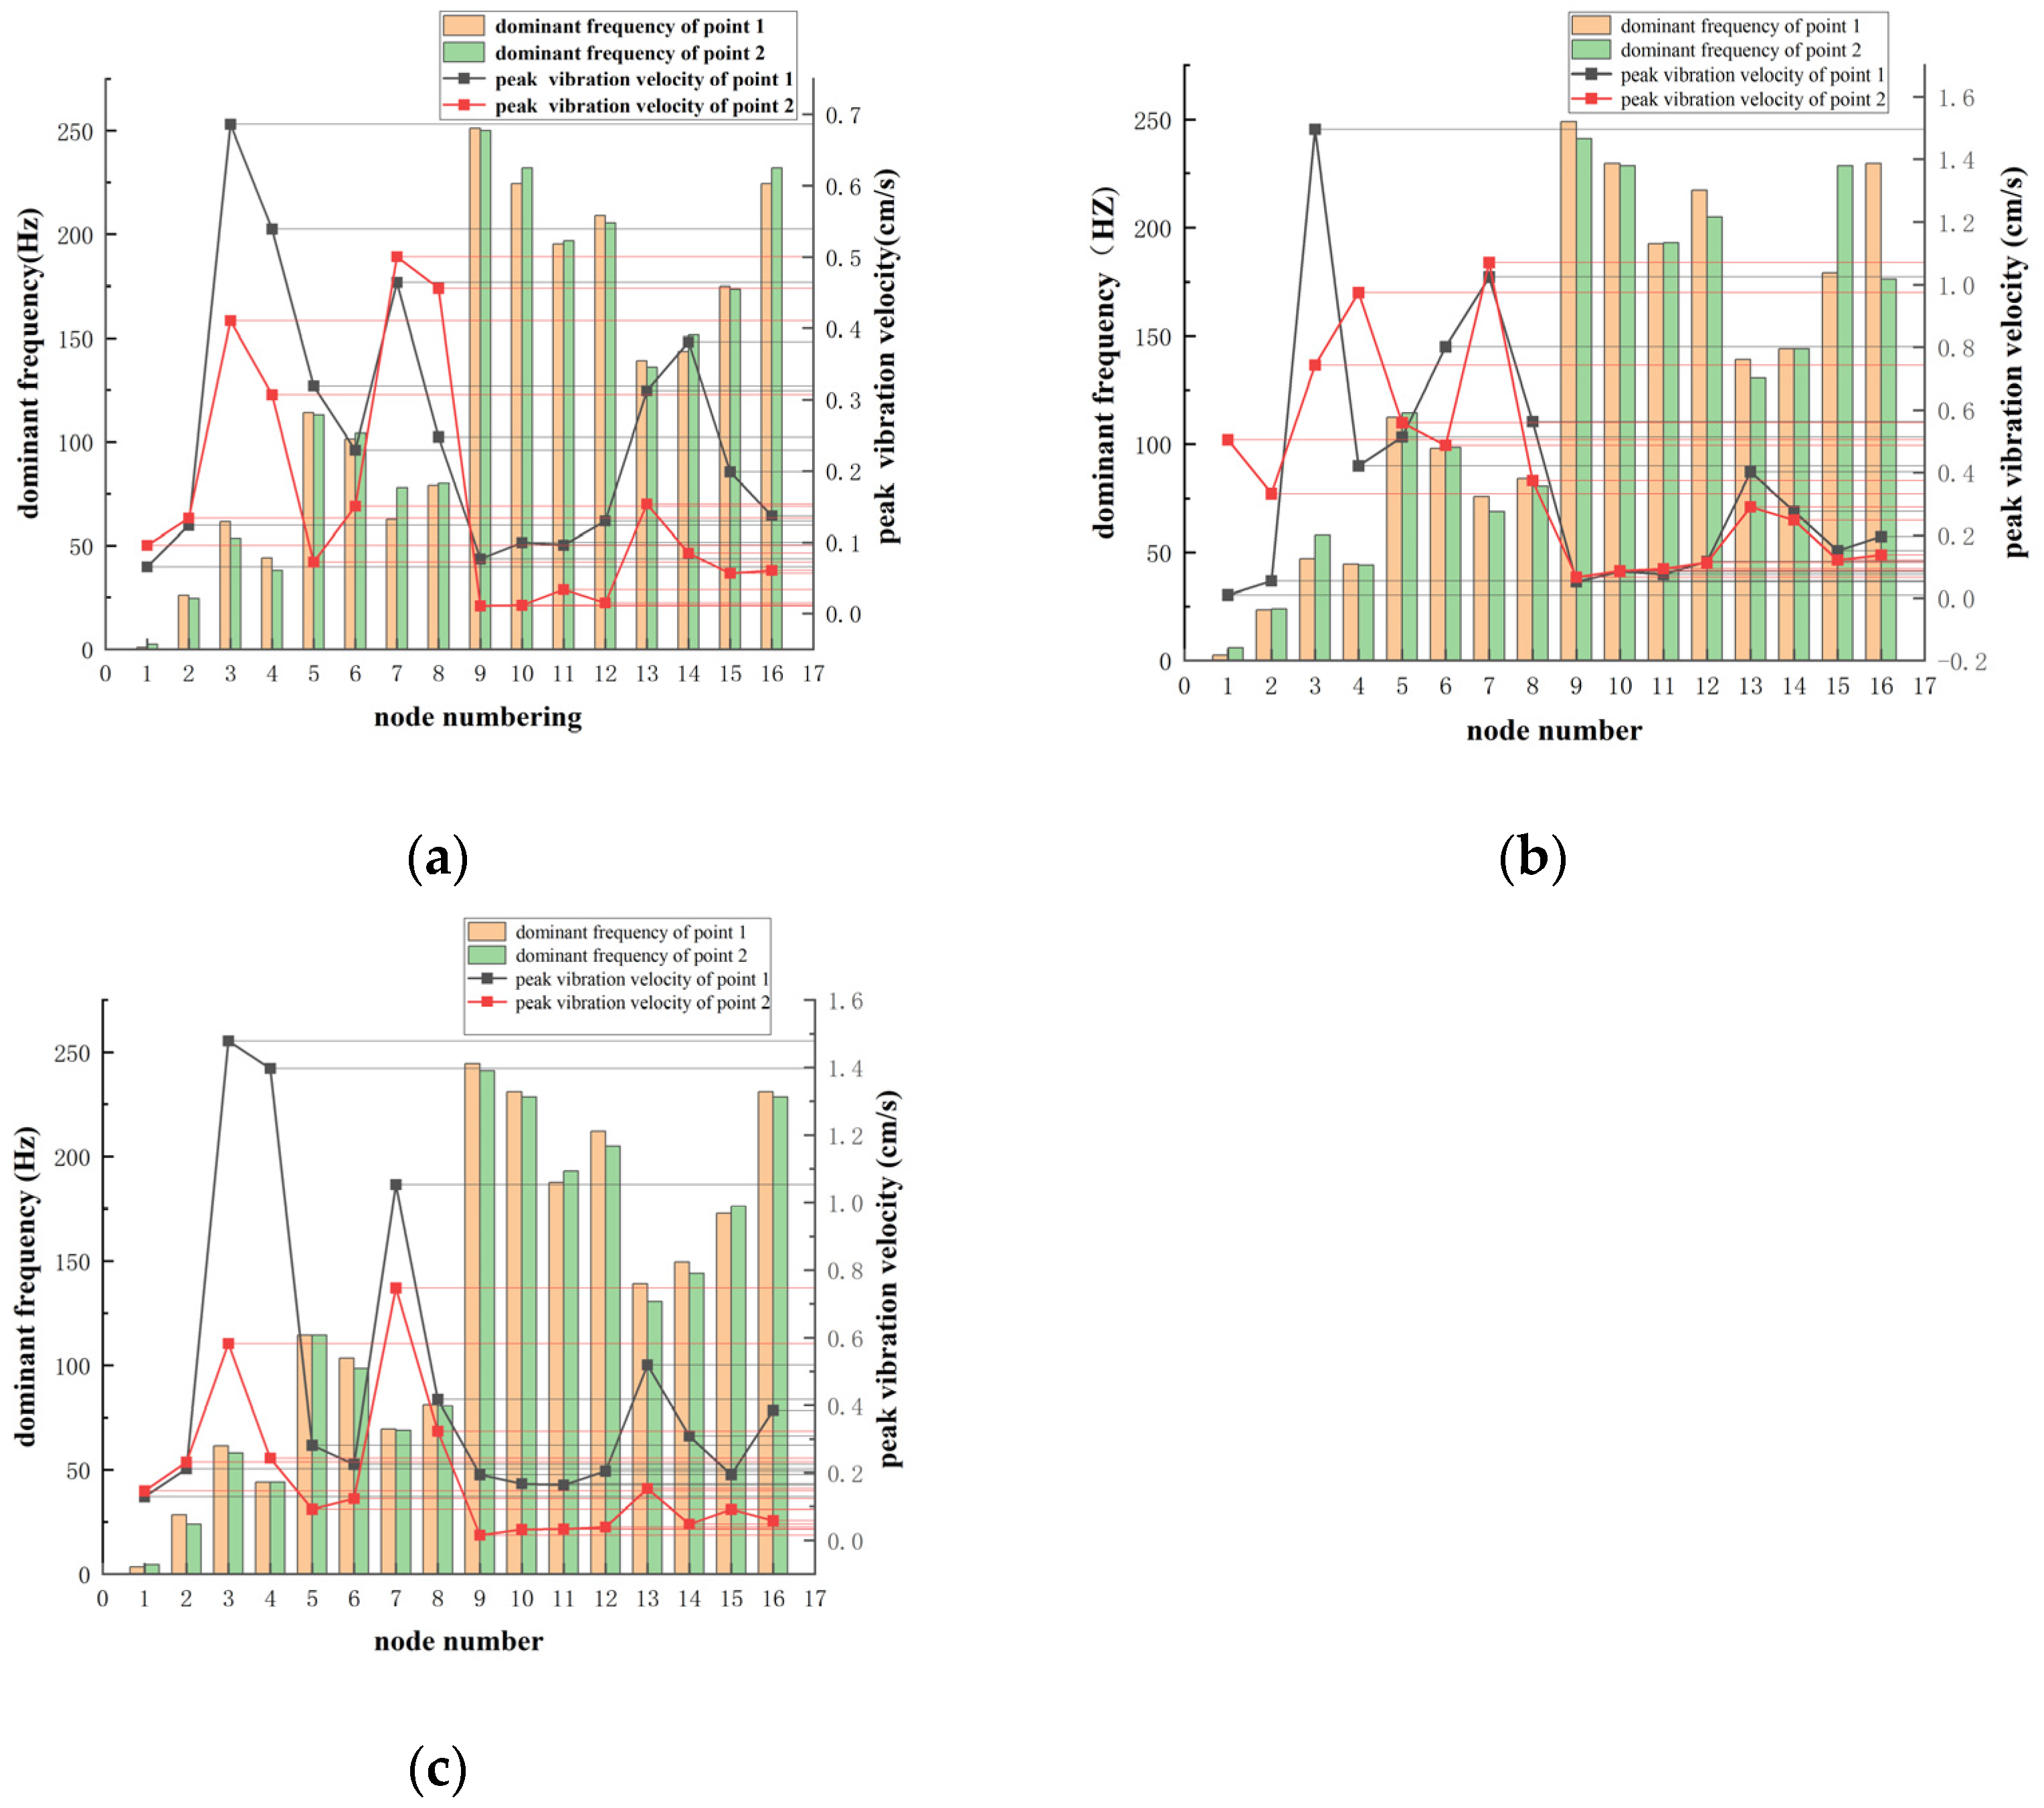
It can be seen from Figure 16 and Figure 17 that the vibration velocity and frequency distribution of each interval can be clearly seen after the decomposition and reconstruction of the wavelet packet. It can be seen from the vibration velocity and spectrum diagram of the first four nodes that the peak vibration velocity is at node (7,2), and the peak frequency is at node (7,3). The vibration velocity and spectrum in three directions of 16 nodes at measuring points 1 and 2 are shown in Figure 18.
As can be seen from Figure 18, the peak vibration velocity in three directions is distributed at Node 9 (125–140.625 Hz) and Node 10 (140.625–156.25 Hz). The peak frequency is distributed at Node 3 (31.25~46.875 Hz) and Node 7 (93.75~109.375 Hz).
The blasting vibration signal x(t) is decomposed by an i-layer wavelet packet; that is, the signal is decomposed into 2i components. The signal is projected onto the db8 wavelet base, and 2i wavelet packet coefficients are obtained. Then, each coefficient is reconstructed to reflect the different characteristics of the original signal. The expression for signal x(t) [29,30] is
x ( t ) = k = 0 j 1 x i , k = x i , 0 + x i , 1 + + x i , j 1
x i , k is the reconstructed signal decomposed to the node K of layer i, j = 2i, k = 0, 1, 2, …, j−1.
The time–frequency relation in the K frequency band after wavelet packet reconstruction is
W ( t , f k ) = | x i , k ( t ) | 2
f k is the center frequency of the reconstructed node (i, k),
According to Bashwa’s theorem and Equation (1), the energy in the k frequency band after the reconstruction of the wavelet packet is
E k = W ( t , f k ) d f = | x i , k ( t ) | 2 d t = l n | v k , m | 2
v k , m is the amplitude corresponding to the discrete point x i , k of the reconstructed signal, m = 1, 2, …, n; n indicates the number of sampling data points.
The total energy of the blasting vibration signal is E = k = 0 j 1 E i , k . The energy percentage in the k frequency band after wavelet packet reconstruction is
η = E k E × 100 %
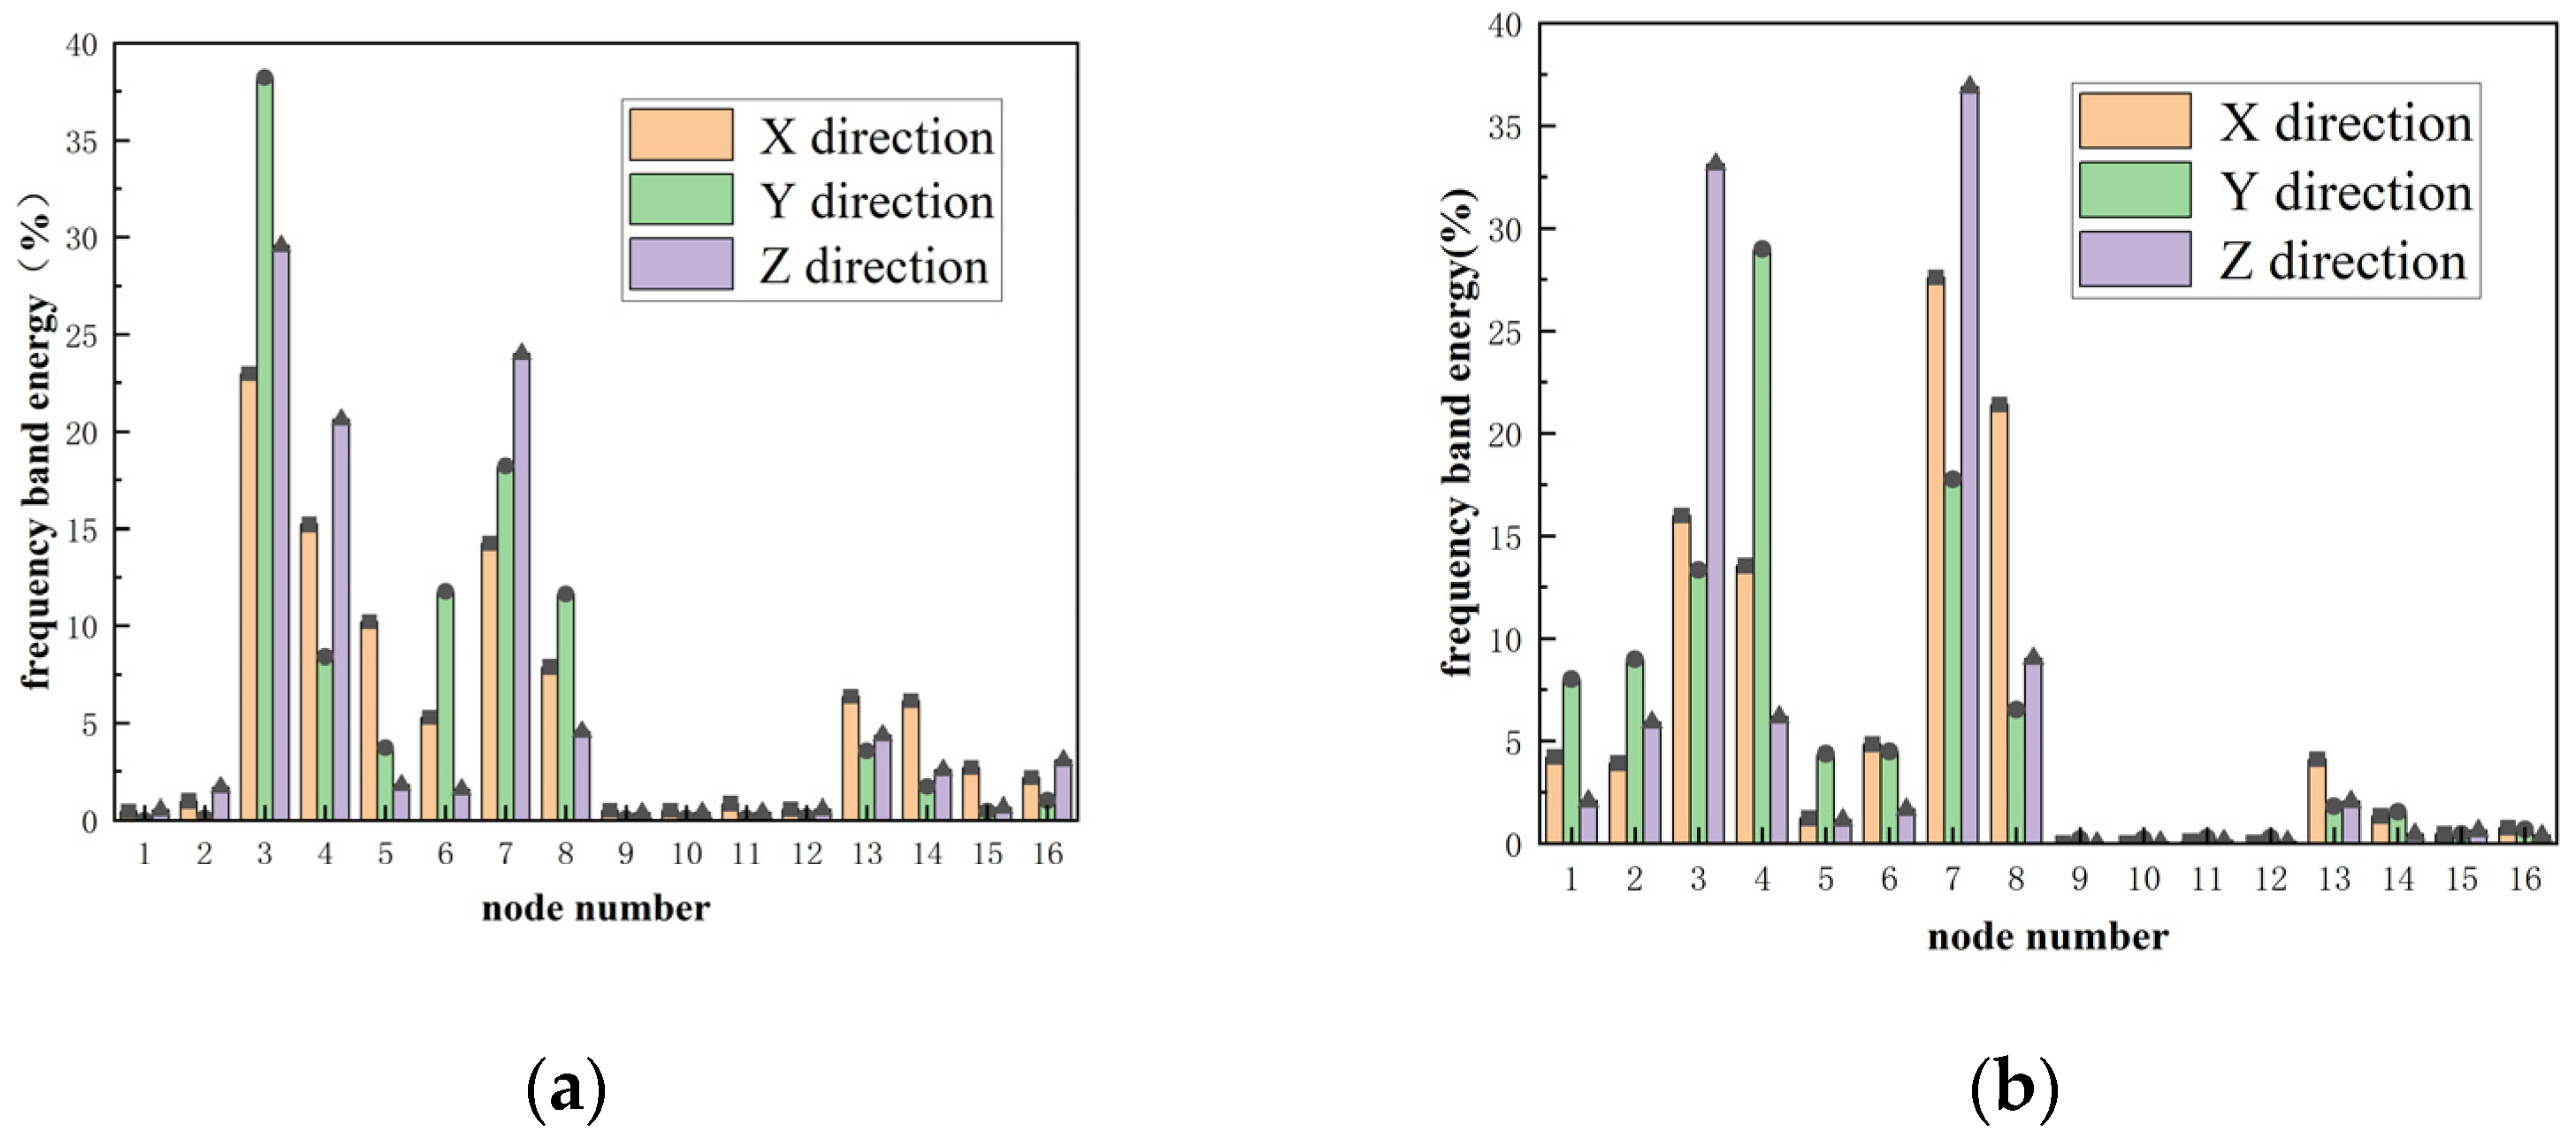
The energy distribution of each frequency band after wavelet packet reconstruction is shown in Figure 19.
As can be seen from Figure 19, the blasting vibration signal energy is widely distributed in each frequency band. It mainly concentrated in the range of frequency band 3 to band 8, in which the X-direction of test point 1 accounted for 75.6%, the X-direction of test point 2 accounted for 85.6%, and the other directions accounted for a higher proportion. It shows that the energy of the blasting vibration signal is mainly concentrated in the low frequency band. Among them, the third frequency band (31.25~46.875 Hz) is the most concentrated, which is the dominant frequency band of the signal.
By comparing Figure 18 and Figure 19, it can be seen that the vibration velocity of the third and seventh bands is larger, and the energy proportion distribution is similar. It shows that the energy of each frequency band corresponds to the vibration intensity of the blasting signal after the decomposition of the wavelet packet, which indicates that the energy analysis of the wavelet packet can reflect the excitation effect of blasting vibration on building structure from both intensity and frequency. In addition, the peak intensity of vibration velocity in the high frequency band may be greater than that in the low frequency band, but because of its fast attenuation speed and small energy, it can be ignored in the analysis.

6. Conclusions

Based on the background of the existing deterioration tunnel blasting project, this paper concludes the following via numerical simulation, field experiment, and data wavelet packet analysis:
(1)
When the full section detonator explodes, the stress wave spreads in an arc shape and has a large range. In the blasting of the mechanical cutting method, the second layer hole is connected with the mechanical cutting area, and the blasting stress wave propagates along the four directions of the cut hole to form a petal-shaped stress ring, and the diffusion range is obviously reduced.
(2)
The use of mechanical cutting instead of traditional cutting hole blasting can effectively reduce the blasting vibration. The vibration velocity of the existing deterioration tunnel is reduced by 38% maximum, and the vibration velocity of the other points is reduced by 20~30%. Mechanical cutting provides several free surfaces for the blasting of the surrounding holes of the tunnel, which can realize the vibration control of the blasting adjacent existing deterioration tunnel.
(3)
The energy of the blasting vibration signal is mainly concentrated near the frequency band where the main frequency of the original signal is located. The main excitation frequency range of the existing deterioration tunnel is 31.25~46.875 Hz, and the energy of the blasting vibration signal is not evenly distributed in the frequency band but is mainly concentrated in the low frequency band. The damage degree of surrounding rock decreases with the increase of distance. When the blasting seismic wave passes through the surrounding rock, the damping of the rock mass will filter out the vibration signal of higher frequency, which plays an effect similar to the low-pass filter.

Author Contributions

Data curation, W.X.; Formal analysis, H.Z.; Investigation, W.X.; Project administration, W.X.; Resources, J.S.; Supervision, J.S.; Writing—original draft, W.X.; Writing—review and editing, W.X. and H.Z.; Conceptualization, W.X. All authors have read and agreed to the published version of the manuscript.

Funding

National Natural Science Foundation of China (NSFC) 51208036.

Institutional Review Board Statement

Not applicable.

Informed Consent Statement

Not applicable.

Data Availability Statement

The data presented in this study are available on request from the corresponding author. The data are not publicly available due to privacy.

Conflicts of Interest

The authors declare no conflicts of interest.

References

  1. Zhu, X.G. Vibration safety impact assessment and technical measures for vibration reduction in blasting engineering. Water Resour. Plan. Des. 2015, 5, 95–97. [Google Scholar]
  2. Xia, C.C.; Liu, Z.F.; Shan, G.Y.; Shen, S.W. Explosive dosage calculation based on blasting vibration velocity and control value. Mod. Tunn. Technol. 2018, 4, 163–170. [Google Scholar]
  3. Jiang, H. Study on evaluation of shock-absorbing blasting scheme for urban underground tunnel driving. Bull. Sci. Technol. 2017, 33, 254–257. [Google Scholar]
  4. Li, G. Shock absorption control during underground excavation, drilling and explosion in subway engineering. Urban Roads Bridges Flood Control 2018, 5, 240–242. [Google Scholar]
  5. Li, Z.; He, C.; Wang, B.; Yang, S.Z.; Guo, X.X. Reasonable differential time interval of urban tunnel crossing composite strata. Pao Cha Yu Ch’ung Chi. Explos. Shock. Waves 2016, 1, 93–100. [Google Scholar]
  6. Tang, Y.; Cao, Y.; Luo, M.R.; Wu, Y.L. Application of high precision digital detonator in vibration reduction of blasting construction. Blasting 2011, 28, 107–109. [Google Scholar]
  7. Yang, Y. Interference vibration reduction technique of ultra-short delay step blasting between holes. Eng. Blasting 2019, 25, 53–59. [Google Scholar]
  8. Ma, J.; Li, X.L.; Wang, J.G.; Tao, Z.H.; Zuo, T.; Li, Q.; Zhang, X.H. Experimental Study on Vibration Reduction Technology of Hole-by-Hole Presplitting Blasting. Geofluids 2021, 2021, 5403969. [Google Scholar] [CrossRef]
  9. Ren, D.F.; Jian, Z.F.; Meng, X.D.; Zhang, X.M.; Zheng, W.C.; Meng, L.T. Application of digital detonator staggered shock absorption blasting technology in subway tunnel construction. Blasting 2020, 2, 53–59. [Google Scholar]
  10. Wu, X.D.; Gong, M.; Wu, H.J.; Hu, G.F.; Wang, S.J. Vibration reduction technology and the mechanisms of surrounding rock damage from blasting in neighborhood tunnels with small clearance. Int. J. Min. Sci. Technol. 2023, 33, 625–637. [Google Scholar] [CrossRef]
  11. Sun, Z.; Xie, S.Z.; Zhang, X.T.; Zhou, H.M.; Wang, H.L.; Wang, C. Vibration reduction effect of damping hole in blasting excavation of small distance tunnel. J. Shandong Univ. Sci. Technol. 2019, 1, 25–31. [Google Scholar]
  12. Yang, J.S. Study on staggered peak vibration reduction by triangular cut blasting in urban shallow buried tunnels. Eng. Blasting 2019, 20, 20–26. [Google Scholar]
  13. Ke, M.; Zhifei, S. Wavelet packet analysis on blasting vibration signal under different cutting method. J. Vibroeng. 2022, 24, 116–127. [Google Scholar]
  14. Zhou, Z.L.; Zhang, J.K.; Cheng, R.S.; Rui, Y.C.; Cai, X.; Chen, L. Improving purity of blasting vibration signals using advanced Empirical Mode Decomposition and Wavelet packet technique. Appl. Acoust. 2022, 201, 109097. [Google Scholar] [CrossRef]
  15. Wang, H.L.; Bai, H.B.; Zhao, Y.; Wang, B.; Wang, H.J. Denoising algorithm of blasting signal based on Fourier decomposition and wavelet packet analysis. Blasting 2021, 38, 37–44. [Google Scholar]
  16. Wang, W.; Li, X.H.; Chen, Z.B.; Fan, L.; Sun, F. Characteristic analysis of energy entropy of blasting vibration signal based on wavelet packet transformation. Explos. Mater. 2019, 6, 19–23. [Google Scholar]
  17. Chen, G.; Li, Q.Y.; Li, D.Q.; Wu, Z.-Y.; Liu, Y. Main frequency band of blast vibration signal based on wavelet packet transform. Appl. Math. Model. 2019, 74, 569–585. [Google Scholar] [CrossRef]
  18. Huang, D.; Cui, S.; Li, X. Wavelet packet analysis of blasting vibration signal of mountain tunnel. Soil. Dyn. Earthq. Eng. 2019, 117, 72–80. [Google Scholar] [CrossRef]
  19. Li, C.X.; Yang, R.S.; Wang, Y.B.; Kang, Y.Q.; Zhang, Y.T.; Xie, P. Theoretical and numerical simulation investigation of deep hole dispersed charge cut blasting. Int. J. Coal Sci. Technol. 2023, 10, 15. [Google Scholar] [CrossRef]
  20. Wu, H.J.; Gong, M.; Zhao, Q.; Wu, X.D.; Liu, X.Y. Vibration Energy Comparison Helps Identify Formation Time of New Free Surface in Urban Tunnel Blasting. Appl. Sci. 2022, 19, 10061. [Google Scholar] [CrossRef]
  21. Lou, Q.X.; Tao, T.J.; Tian, X.C.; Xie, C.J. Research on numerical simulation method of limestone impact failure based on HJC constitutive model. Blasting 2022, 39, 71–79. [Google Scholar]
  22. Li, F.; Wang, X.B. Wavelet packet analysis of controlled excavation blasting signals in a nclear power plant. Min. Eng. Res. 2016, 31, 1–5. [Google Scholar] [CrossRef]
  23. Fei, H.; Zeng, X.Y.; Yang, Z.G. Wavelet packet analysis of tunneling blasting vibration on earth surface. Explos. Shock Waves 2017, 37, 77–83. [Google Scholar]
  24. Shan, R.L.; Song, Y.W.; Bai, Y. Study on energy attenuation characteristics of blasting signals based on wavelet packet transform. J. Min. Sci. 2018, 3, 119–128. [Google Scholar] [CrossRef]
  25. Tang, F.Y.; Wang, J.Z.; Cui, Z.R. Application of energy criterion in blasting vibration safety. Blasting 2009, 4, 85–88. [Google Scholar]
  26. Han, L.; Xin, C.W.; Liang, S.F. Experimental study on vibration characteristics of deep-hole step blasting in near and far regions. J. Vib. Shock 2017, 36, 65–70. [Google Scholar] [CrossRef]
  27. Daubechies, I. Orthonormal bases of compactly supported wavelets. Commun. Pure Appl. Math. 1988, 41, 909–996. [Google Scholar] [CrossRef]
  28. Chen, J.H.; Qiu, W.G.; Zhao, X.W.; Wang, H.L. Vibration characteristics analysis of the metro tunnel subarea blasting based on wavelet packet technology. J. Vib. Shock 2022, 6, 222–228+255. [Google Scholar] [CrossRef]
  29. Zhu, Q.J.; Jiang, F.X.; Yu, Z.X. Study on energy distribution characteristics of blasting vibration and microseismic signal of rock failure. Chin. J. Rock Mech. Eng. 2012, 4, 723–730. [Google Scholar]
  30. Shan, R.L.; Bai, Y.; Song, Y.W. Wavelet packet analysis of blasting vibration signal of frozen vertical shaft model. J. China Coal Soc. 2016, 8, 1923–1932. [Google Scholar]
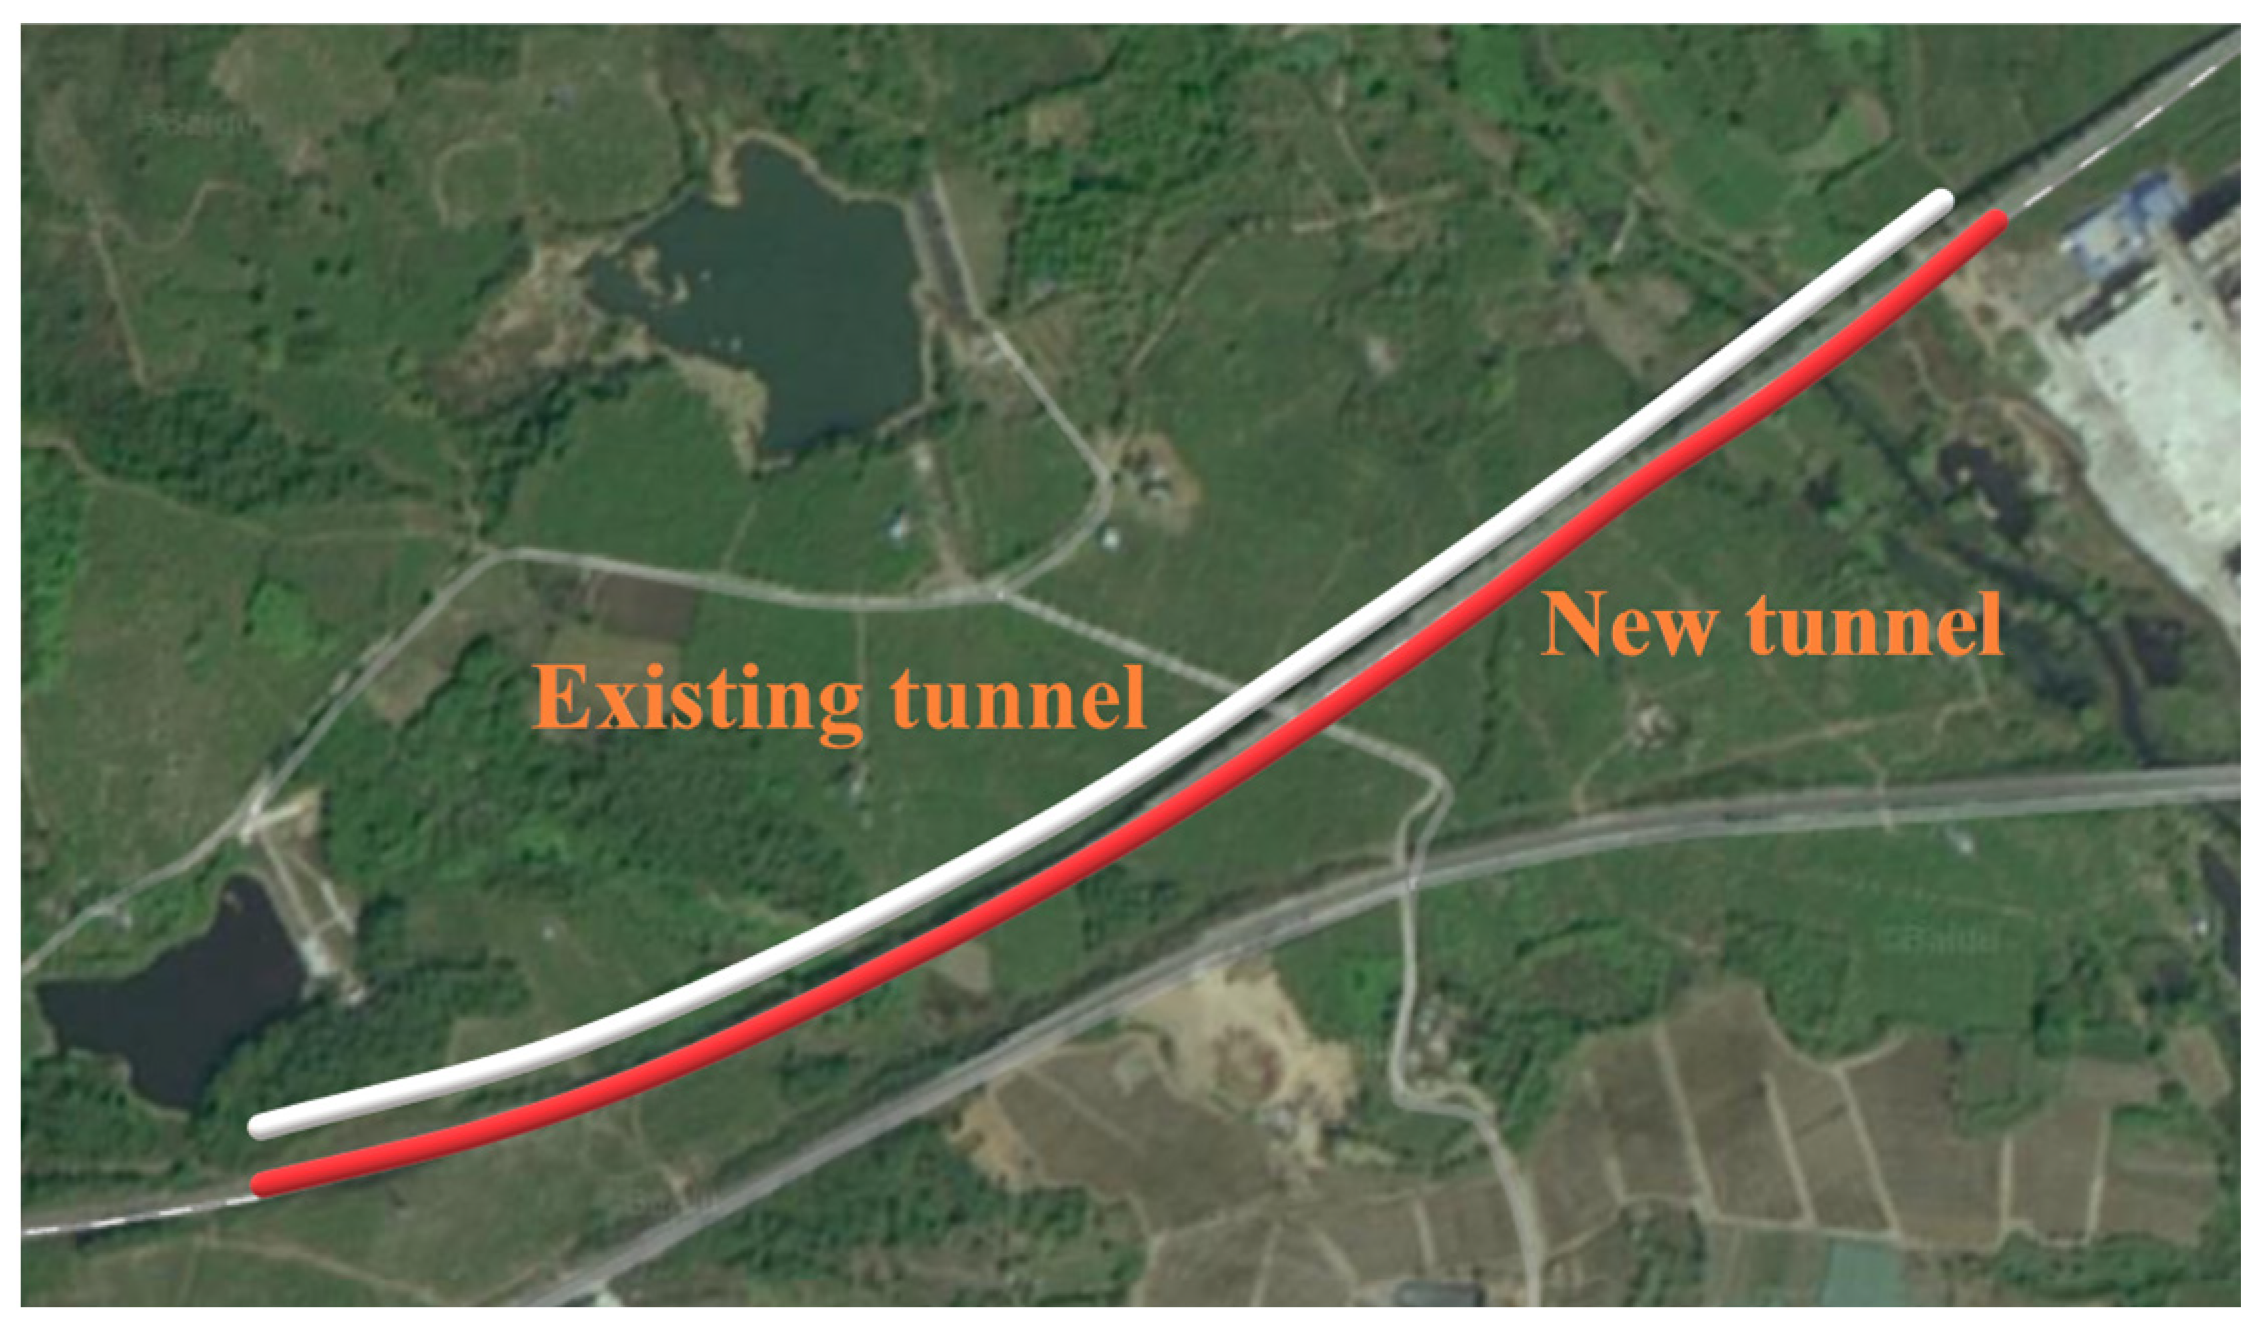
Figure 1. Relative positions of the old and new tunnels.
Applsci 14 02212 g001
Figure 2. Tunnel deterioration phenomenon.
Applsci 14 02212 g002
Figure 3. Model diagram. (a) Global model; (b) blasting hole; (c) mechanical cutting model; (d) the model grid.
Applsci 14 02212 g003
Figure 4. Existing tunnel measuring points. A, B, C, D, and E correspond to the positions of the tunnel bottom, arch foot, arch waist, spandrel, and vault, respectively.
Applsci 14 02212 g004
Figure 5. Normal detonator blasting. (a) t = 1 ms. (b) t = 1.5 ms. (c) t = 2 ms. (d) t = 2.5 ms.
Applsci 14 02212 g005aApplsci 14 02212 g005b
Figure 6. Mechanical cut blasting. (a) t = 1 ms. (b) t = 1.5 ms. (c) t = 2 ms. (d) t = 2.5 ms.
Applsci 14 02212 g006
Figure 7. Vibration velocity of the measuring point. (a) Normal detonator blasting; (b) mechanical cutting blasting. A, B, C, D, and E correspond to the positions of the tunnel bottom, arch foot, arch waist, spandrel, and vault, respectively.
Applsci 14 02212 g007
Figure 8. The magnitude of peak vibration velocity and the rate of vibration velocity change. (The red number represents the rate of velocity change).
Applsci 14 02212 g008
Figure 9. Layout of tunnel measuring points. (Measuring points 1, 2, 3 and 4 correspond to K347 + 190, K347 + 180, K347 + 170, and K347 + 160, respectively).
Applsci 14 02212 g009
Figure 10. Site arrangement of measuring points. (a) Location of blasting vibrometer in tunnel, (b) The setting mode of sensor.
Applsci 14 02212 g010
Figure 11. Normal detonator layout. (The numbers represent the segment).
Applsci 14 02212 g011
Figure 12. Mechanical cut hole layout. (The numbers represent the segment).
Applsci 14 02212 g012
Figure 13. Measuring point vibration velocity. (a) Normal detonator blasting; (b) mechanical cutting blasting.
Applsci 14 02212 g013
Figure 14. Change of peak vibration velocity. (The red numbers represent the rate of change).
Applsci 14 02212 g014
Figure 15. Three direction velocity waveform diagram and spectrum diagram. (a) Velocity waveform in the X direction; (b) velocity waveform plot in the Y direction; (c) velocity waveform plot in the Z direction; (d) spectrum diagram in the X direction; (e) spectrum diagram in the Y direction; (f) spectrum diagram in the Z direction.
Applsci 14 02212 g015aApplsci 14 02212 g015b
Figure 16. Reconstructed node vibration velocity diagram. (a) Node (7,0); (b) Node (7,1); (c) Node (7,2); (d) Node (7,3).
Applsci 14 02212 g016
Figure 17. Reconstructed node frequency spectrum diagram. (a) Node (7,0); (b) Node (7,1); (c) Node (7,2); (d) Node (7,3).
Applsci 14 02212 g017
Figure 18. The relationship between three-way main frequency and peak vibration velocity of each node after wavelet packet reconstruction. (a) X direction; (b) Y direction; (c) Z direction.
Applsci 14 02212 g018
Figure 19. Energy proportion diagram. (a) Measuring point 1. (b) Measuring point 2.
Applsci 14 02212 g019
Table 1. Structures around the tunnel.
MileageRelative Altitude (m)Relative RelationStructure
DK346 + 880~DK347 + 28532.987~36.430parallelexisting tunnel
DK346 + 880~DK347 + 28532.987~36.430parallelkerosene pipe
DK347 + 14035.197abovepower tower
Table 2. EOS_JWJ parameters.
EOSIDAB R 1 R 2 OMEG E 0 V 0
32.7620.08445.22.10.50.03871.0
Table 3. MAT_JOHNSON_HOLMQUIST_CONCRETE parameters.
M I D ρ 0 G A B C N F C T E P S E F M
2400130.275241.11.1244.50.00151.2 × 10−61 × 10−70.11
S F M P C U C P L U L D 1 D 2 K 1 K 2 K 3 F S
5.01.463.5 × 10−40.010.10.041.00.120.250.420
Table 4. Normal detonator blasting scheme.
Hole ClassNumberHole Diameter (mm)SegmentHole Depth
(m)
Charge in a Single Hole (kg)Cumulative Charge
(kg)
Cutting hole84211.60.97.2
Auxiliary hole104231.30.33.0
104251.30.33.0
Peripheral hole154271.30.34.5
204291.30.36.0
Bottom hole1142111.30.33.3
Total74 27.0
Table 5. Mechanical cut blasting scheme.
Hole ClassNumberHole Diameter (mm)SegmentHole Depth
(m)
Charge in a
Single Hole (kg)
Cumulative Charge
(kg)
Auxiliary hole104231.30.33.0
104251.30.33.0
Peripheral hole154271.30.34.5
204291.30.36.0
Bottom hole1142111.30.33.3
Total66 19.8
Table 6. Wavelength band distribution table after wavelet packet decomposition.
LayerSi,0Si,1Si,j−1Si,j
10~1000data 1000~2000
20~500500~10001000~15001500~2000
30~250250~5001500~17501750~2000
40~125125~2501750~18751875~2000
50~62.562.5~1251875~1937.51937.5~2000
60~31.2531.25~62.51937.5~1968.751968.75~2000
70~15.62515.625~31.251968.75~1984.3751984.375~2000
Disclaimer/Publisher’s Note: The statements, opinions and data contained in all publications are solely those of the individual author(s) and contributor(s) and not of MDPI and/or the editor(s). MDPI and/or the editor(s) disclaim responsibility for any injury to people or property resulting from any ideas, methods, instructions or products referred to in the content.