Abstract
The advancement of machine learning in healthcare offers significant potential for enhancing disease prediction and management. This study harnesses the PyCaret library—a Python-based machine learning toolkit—to construct and refine predictive models for diagnosing diabetes mellitus and forecasting hospital readmission rates. By analyzing a rich dataset featuring a variety of clinical and demographic variables, we endeavored to identify patients at heightened risk for diabetes complications leading to readmissions. Our methodology incorporates an evaluation of numerous machine learning algorithms, emphasizing their predictive accuracy and generalizability to improve patient care. We scrutinized the predictive strength of each model concerning crucial metrics like accuracy, precision, recall, and the area under the curve, underlining the imperative to eliminate false diagnostics in the field. Special attention is given to the use of the light gradient boosting machine classifier among other advanced modeling techniques, which emerge as particularly effective in terms of the Kappa statistic and Matthews correlation coefficient, suggesting robustness in prediction. The paper discusses the implications of diabetes management, underscoring interventions like lifestyle changes and pharmacological treatments to avert long-term complications. Through exploring the intersection of machine learning and health informatics, the study reveals pivotal insights into algorithmic predictions of diabetes readmission. It also emphasizes the necessity for further research and development to fully incorporate machine learning into modern diabetes care to prompt timely interventions and achieve better overall health outcomes. The outcome of this research is a testament to the transformative impact of automated machine learning in the realm of healthcare analytics.
1. Introduction
Diabetes mellitus is a condition in which the body’s metabolism of glucose is altered, resulting in elevated blood glucose levels, termed hyperglycemia [1]. The major types of diabetes mellitus are related to the body’s production of or response to the hormone insulin, which decreases blood glucose levels through different mechanisms. The vast majority of cases are either classified as diabetes mellitus type I, a condition with strong genetic components in which there is an absolute deficiency of insulin production, or diabetes mellitus type II, a condition with decreased sensitivity of insulin receptors to the hormone along with instances of decreased production [2]. The chronic hyperglycemia that results from diabetes leads to devastating long-term complications in patients such as the dysfunction and possible failure of organs such as the kidneys, eyes, heart, and blood vessels, amongst others. Additionally, diabetes mellitus is a cerebrovascular and cardiovascular risk factor that increases the predisposition of a person to suffer an ischemic attack [3,4,5]. Hence, people with diabetes, particularly type 2 diabetes, are at an increased risk of developing cardiovascular disease (CVD), such as heart attacks, strokes, and heart failure [6,7,8]. Diabetes can damage blood vessels and nerves that control the heart and blood vessels, leading to heart disease over time [9,10,11]. High blood glucose levels in diabetes can cause damage to blood vessels, which can result in serious heart complications [7,8]. It is important for individuals with diabetes to manage their condition effectively to reduce the risk of developing heart disease or stroke. Managing diabetes through proper glucose control, regular exercise, a healthy diet, and other lifestyle modifications can help lower the chances of developing CVD [7,8].
The management of diabetes mellitus involves a multidisciplinary approach in which both lifestyle and pharmacologic interventions play a role. The goals of management are to achieve normoglycemia and minimize cardiovascular and other long-term complications of the disease [12]. Studies following patients with intensive glycemic control found decreased incidences of major cardiovascular events in such patients [13]. In addition to pharmacologic management, patient education about the disease and long-term complications has been shown in studies to improve glycemic control in patients [14,15,16]. The role of behavioral modification on the effects of glycemic control has extensively been studied. Interventions such as fasting, low-calorie diets, exercise, and behavioral psychological therapy have all shown benefits in lowering blood glucose levels in studies assessing their effects in patients with diabetes [17,18,19,20,21].
One high-priority healthcare quality measure is hospital readmission rates. With many long-term complications, the burden of diabetes amongst hospitalized patients continues to grow. Studies have correlated higher rates of readmission for hospitalized patients with diabetes [22]. Adult patients with diabetes mellitus represent a sizable portion of 30-day unplanned hospital readmissions [23]. Methods that can be implemented to reduce readmission rates include post-discharge coordination of care and support for patients with diabetes, regular follow-ups with providers, specialty-specific care, and patient education. Assessing readmission rates for patients with diabetes could benefit from additional studies studying the effects of such interventions.
Machine learning has been explored as a tool to predict the incidence and risk factors of diabetes and other cardiovascular diseases [24]. Previous studies utilizing logistical regression and classification trees have predicted that fasting blood glucose, BMI, and age are the main predictors of developing diabetes and observed population health risk assessment for diabetes onset [25,26,27]. It has also been used to predict associated complications [28,29]. However, there remains a gap in the literature when it comes to analyzing outcomes and readmission with the use of machine and deep learning.
The present study conducted a comparative analysis of machine learning techniques to predict diabetes outcomes and readmission rates. The study used a dataset from the Kaggle repository [30]. The models were deployed in PyCaret 3.0.3 to predict diabetes and readmission rates. PyCaret has been previously utilized to predict the presence and severity of diabetes [31], but this approach can be applied to study associated outcomes. The study aimed to study machine learning methodologies while investigating their strengths and weaknesses pertaining to diabetes prediction and analysis of readmission rates. By leveraging large datasets and advanced algorithms, machine learning models can analyze complex patterns and risk factors to accurately diagnose diabetes. This can lead to more-timely interventions and improved patient outcomes. However, further research is needed to fully establish machine learning as a cornerstone of modern healthcare diagnostics for diabetes. Nevertheless, this study introduces an analytical framework that enhances the interpretability and clinical applicability of predictive modeling for diabetes and its readmission risk, using advanced machine learning techniques to not only analyze, but also translate the public Kaggle dataset’s insights into actionable healthcare strategies, a critical advancement beyond the mere performance evaluation of algorithms. The study uncovers several insights into algorithmic predictions of diabetes readmission by exploring the intersection of machine learning and health informatics. Ultimately, this study highlights the need for additional research and development to fully integrate machine learning into modern diabetes care, enabling timely interventions and improved overall health outcomes.
The structure of the paper is laid out as follows: Section 2, “Materials and Methods”, details the data acquisition process from the public Kaggle dataset and the methodologies we applied in developing our analytical framework. Section 3, “Results”, unpacks the performance metrics of our predictive models by delineating the rates of accurate classifications and misclassifications, as well as discussing the implications these have for clinical practice and patient outcomes. It also explores the model’s capacity for generalization and its robustness, ensuring a comprehensive understanding of its practical utility. In Section 4, “Discussion”, we contextualize our findings within the broader landscape of healthcare analytics and their implications for diabetes management.
2. Materials and Methods
This section describes the particular methods used for acquiring and preparing the data, along with a detailed explanation of the machine learning pipeline utilized in the research. Comparable methodologies may be found in other studies within this field [32,33,34].
2.1. Data Collection and Processing
In this study on diabetes and hospital readmission, we utilized a comprehensive open-source dataset that includes clinical and demographic information. This dataset was used to train and test machine learning models. The first dataset used in this study is called the Diabetes Surveillance Dataset (DSD). It is a cleaned and consolidated version of the 2015 Behavioral Risk Factor Surveillance System (BRFSS) dataset. The DSD was curated by Alex Teboul and can be found on Kaggle [30,35]. The diabetes surveillance dataset consisted of 21 features, which are listed in Table 1. The diabetes readmission dataset (DRD) is an edited version of the readmission dataset from the UC Irvine Machine learning repository, which includes ten years (1999–2008) of clinical care at 130 U.S. hospitals and integrated delivery networks [36,37]. The diabetes readmission dataset consists of 40 features (some were removed due to their complexity or missing values). Following the initial data preprocessing, the dataset was subjected to feature selection to identify the most-relevant predictors of diabetes and readmission risk. Statistical techniques, machine learning algorithms, and expert clinical input collaboratively informed this selection process. The resulting dataset provided a robust foundation for the development and validation of machine learning models aimed at projecting diabetes outcomes and readmission likelihood. These datasets were used due to their accessibility and extensive use in the scientific community, providing a beneficial starting point for analysis. All provided features were included in our analysis, under the assumption that they had been previously determined as relevant for studies of this nature. By doing so, we intended to present the full picture as showcased by the datasets and subsequently allow the predictive models to determine the relevance of each feature within the context of our study.
2.2. PyCaret Setup
During the setup of PyCaret in this study, we initialized the environment with a consistent random state to maintain reproducibility. We then proceeded with the data preparation, detailing the handling of missing values and the encoding of categorical variables, ensuring clarity on the strategies employed. Feature scaling methods were applied to normalize numerical features, essential for certain algorithms. Outliers were managed through PyCaret’s built-in capabilities or through additional steps, as necessary. In selecting and training the models from PyCaret’s extensive library, we clarified our criteria, including any baseline models used for comparison. For hyperparameter tuning, we specified the search algorithm utilized and the hyperparameters’ range. Model evaluation and validation were detailed by describing the use of performance metrics and validation techniques such as cross-validation. Finally, the criteria for the final model selection were carefully outlined, balancing performance metrics with considerations of complexity and interpretability, to ensure a comprehensive and transparent portrayal of our research methodology.

Table 1.
Features (21) included in diabetes surveillance dataset.
The PyCaret setup for both the DSD and DRD followed the same process and included similar transformation steps. To begin, both datasets were converted to comma-separated values (CSV) format, with each file containing a target variable. In the case of the DSD, the target variable represented the presence or absence of diabetes. For the DRD, the target variable had three options: no readmission, readmission within 30 days, and readmission after 30 days. Next, the datasets were split into training and testing categories. The DSD contained a total of 70,692 individual patient records. This dataset was divided into a training set consisting of 49,484 patient records and a testing set consisting of 21,208 patient records. Similarly, the DRD included a total of 101,766 patient records. This dataset was split into a testing set of 71,236 patient records and a training set of 30,530 patient records. For the preprocessing step applied to both the DSD and DRD, a simple imputer was used to handle missing values in the dataset. Beyond handling missing values with a simple imputer, we also employed scaling techniques to normalize the range of continuous input variables, which is crucial for models that are sensitive to the varying scales of features. Additionally, categorical variables were encoded into numerical values to ensure compatibility with our machine learning algorithms, as they require numeric input. Outliers were treated with careful consideration: depending on their nature and the potential impact on our model’s ability to learn from the data, certain outliers were either adjusted or removed to prevent them from skewing the results. Collectively, these preprocessing steps were applied to each feature to optimize the performance of our predictive models and ensure that any conclusions drawn from our analysis were based on data that were as accurate and representative as possible.
Additionally, in this predictive modeling, preprocessing steps with the specific requirements and assumptions of the algorithms used were aligned. Missing values were handled with imputation techniques since most algorithms necessitate complete datasets to avoid biases and errors during training. Categorical variables were encoded to numerical values to ensure compatibility across all models, with the encoding method chosen based on the algorithm’s needs; tree-based models may accommodate ordinal encoding, while others, like logistic regression, often require one-hot encoding. Feature scaling was applied to ensure that distance-based algorithms did not undervalue features with smaller numeric ranges. Outlier management was crucial for preventing models sensitive to extreme values, such as regression models, from being skewed by rare occurrences. We also employed feature selection where necessary to mitigate the risk of overfitting and improve model generalizability. These preprocessing measures were essential in enhancing the performance and reliability of these machine learning models, allowing us to extract the most value from our data and ensuring robust, generalizable results.
Hence, a combination of validation techniques to ensure the reliability and accuracy of our predictive models was employed. First, splitting the datasets into distinct training and testing sets, providing a clear separation for unbiased model evaluation, was performed. Furthermore, k-fold cross-validation, a method that partitions the training data into several subsets, training the model on all but one and validating on the remaining subset, iteratively cycling through each subset, was utilized. This method provides a measure of the model’s performance and its ability to generalize to unseen data. Additionally, the models’ performance using several metrics such as accuracy, precision, recall, F1-score, and the area under the receiver operating characteristic curve, was measured. Each of these metrics offers unique insights, together offering a comprehensive view of the model’s predictive power. This validation framework is designed to enhance the credibility of predictive models in this study and support their potential applicability in clinical settings.
3. Results
In this section, a comprehensive evaluation of machine learning models developed using the PyCaret library to predict diabetes and its subsequent readmissions is presented. Our analysis comprises two distinct subsections: the first focuses on the deployment and performance of various algorithms in accurately predicting the incidence of diabetes mellitus, while the second delves into the predictive modeling of diabetes readmission rates. Each subsection systematically illustrates the effectiveness of the employed models, discussing metrics such as the accuracy, precision, recall, and area under the receiver operating characteristic curve. By dissecting the models’ performances in these two pivotal areas of diabetes care, this section aims to shed light on the potential and limitations of automated machine learning in effectively supporting disease management and healthcare delivery.
Table 2 and Table 3 are structured comparisons that outline the performance of various machine learning classifiers on diabetes prediction and readmission prediction, respectively. Each classifier is evaluated according to several important metrics that gauge their performance as follows. Accuracy: This is the ratio of the number of correct predictions to the total number of input samples. It measures the overall correctness of the model. Higher accuracy means the model is more often correct across all predictions. Area under the curve (AUC): This metric is associated with the receiver operating characteristic curve and reflects a model’s ability to distinguish between the classes (positive as diabetic and negative as non-diabetic). A higher AUC value indicates better discrimination capabilities. Recall (or sensitivity): Recall indicates how many of the actual positive cases (actual diabetics) the model correctly identified. It is crucial for conditions where missing a positive case can have serious consequences. Precision: This measures the fraction of correct positive predictions out of all positive predictions made. In the context of diabetes, it reflects how many of the patients the model labeled as diabetic were actually diabetic. F1-score: The F1-score is the harmonic mean of the precision and recall, providing a balance between the two. It is especially useful when the distribution of classes is not even, which is often the case in medical diagnoses. Cohen’s Kappa: This measures the agreement of the predictive model with the actual data, correcting for chance agreement. It gives a more-robust idea of the model’s performance, especially with imbalanced datasets. Matthews correlation coefficient (MCC): This is a measure of the quality of binary classifications. It takes into account true positives, true negatives, false positives, and false negatives. The MCC is considered a balanced measure, which can be used even if the classes are of very different sizes. Cells highlighted in yellow within Table 2 and Table 3 emphasize standout performance metrics or notable findings in the machine learning model comparison. These highlights are used to draw the attention to results that significantly impact the study’s conclusions, such as the highest accuracy rates, the best precision values, or any unexpected patterns in the data that may require further investigation or discussion.
Table 2.
Diabetes prediction: comparison of accuracy, area under the curve (AUC), recall, precision, F1-score, Kappa, and Matthews correlation coefficient (MCC) for different machine learning classifier models. Cells highlighted in yellow emphasize standout performance metrics (i.e., maximum values).
Table 3.
Diabetes readmission prediction: comparison of accuracy, area under the curve (AUC), recall, precision, F1-score, Kappa, and Matthews correlation coefficient (MCC) for different machine learning classifier models. Cells highlighted in yellow emphasize standout performance metrics (i.e., maximum values).
In clinical decision-making, the significance of evaluation metrics such as accuracy, precision, recall, and AUC extends beyond their numerical definitions to their impact on patient care, resource allocation, and overall health outcomes. Accuracy is the proportion of true results, both true positives and true negatives, in the total population. It is a straightforward measure and gives an overview of the model’s effectiveness. However, in a clinical setting, high accuracy is not always indicative of practical utility, particularly in cases where disease prevalence is low. A model could inaccurately predict true disease cases, yet still have high accuracy due to a large number of true negatives—healthy patients correctly identified as not having the disease. Precision, which assesses the proportion of correctly predicted positive observations to the total predicted positives, is critically important when the consequences of false positives are significant. For instance, in cancer diagnostics, a false positive might lead to unnecessary stress, invasive testing, or treatment, which carries its own risks and costs. Recall, or sensitivity, measures the ability of a model to find all the relevant cases within a dataset. In medicine, high recall is crucial in conditions where failing to identify and treat a disease could lead to severe health consequences or even death. The cost of false negatives is often much higher than that of false positives; missing out on an early diagnosis of a disease such as sepsis or heart attack can be life-threatening. The AUC is an aggregate measure of performance across all possible classification thresholds. It reflects the model’s ability to discriminate between patients with and without the condition at various levels of specificity and sensitivity. The AUC is particularly useful in a clinical context because it is not affected by the prevalence of the positive class, hence providing a more-balanced evaluation of the model performance. In clinical practice, these metrics must be balanced and interpreted in light of the disease prevalence, the potential consequences of false positives and false negatives, and the specific clinical application. A model aimed at diagnosing a condition with serious consequences for missed cases might prioritize recall over precision, whereas one used to select candidates for an invasive procedure might prioritize precision to minimize unnecessary interventions.
3.1. Diabetes Prediction
In Table 2, LightGBM performs best on most metrics, but has a slightly lower AUC and precision compared to the Gradient Boosting Classifier and ADA/LR, respectively. The AUC measures the model’s ability to differentiate between classes (e.g., diabetic and non-diabetic patients). An AUC of 0.8302 for LightGBM and 0.8309 for the GBC suggests that both models have a strong ability to discriminate between positive and negative cases, with the GBC being marginally better. In practice, this difference might not be clinically significant, but it indicates that the GBC could potentially provide slightly more-accurate risk stratification. Precision assesses how many of the patients predicted to have the condition (positive cases) actually do. LightGBM’s precision score of 0.7320 compared to the ADA and LR’s precision score of 0.7392 suggests that, while both models are quite good at ensuring that positive predictions are likely true, the ADA and LR are slightly better. This means using the ADA or LR might result in fewer false positives—patients incorrectly identified as having the condition. While LightGBM’s lower scores in the AUC (0.8302) and precision (0.7320) compared to the GBC and ADA/LR, respectively, mean that there are some trade-offs to consider, it is critical to understand that machine learning predictions are not diagnostic tools themselves, but rather, risk stratification aids that would be used in conjunction with further diagnostic testing. Hence, LightGBM’s high performance across most metrics indicates that it is a robust model for predicting diabetes.
Clinically, the decision on which model to use could factor in the degree of variance in the metrics. If false positives are particularly undesirable (e.g., could lead to unnecessary anxiety, more-invasive tests, or treatments), a physician might lean towards the ADA and LR due to the higher precision. If the overall ability to distinguish between patients is paramount and the differences in the precision are acceptable, LightGBM could still be preferred given its general performance on most metrics. When these differences in scores are very narrow (as they appear to be between these models), it becomes important to consider other factors such as the models’ interpretability, operational costs, and how well they integrate into clinical workflows. Clinicians might also evaluate the models based on specific patient cohorts or different clinical settings, given that the performance could vary across different scenarios.
The confusion matrix for the Light Gradient Boosting Machine classifier in a diabetic prediction scenario is shown in Figure 1. The confusion matrix provides a snapshot of how well the Light Gradient Boosting Machine classifier is performing in accurately diagnosing diabetes as follows. The true positive rate (72%) reflects the model’s ability to identify most of the individuals with diabetes. The true negative rate (79%) shows that the model is also quite capable of recognizing individuals who do not have the condition. The false positive rate (21%) points to the rate at which the model incorrectly flags healthy individuals as diabetic, which could lead to unnecessary worry and medical procedures for these patients. The false negative rate (28%) is a critical metric in clinical settings, as it represents the missed cases of diabetes that were not diagnosed by the model.
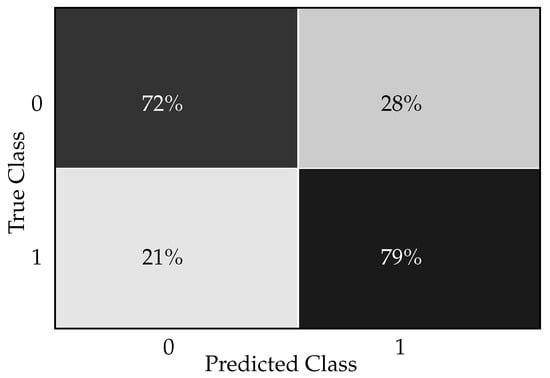
Figure 1.
Light Gradient Boosting Machine classifier confusion matrix for diabetes prediction.
In a clinical setting, interpreting this confusion matrix gives us insights into how well the Light Gradient Boosting Machine classifier performs in diagnosing/predicting diabetes. The model correctly predicted 72% of the diabetic patients. This implies that, out of all patients who were actually diabetic, the classifier could identify 72% of them. In a clinical setting, this is a favorable outcome since it indicates successful detection of the majority of individuals with diabetes. The model correctly predicted 79% of non-diabetic patients. This means 79% of the patients who did not have diabetes were correctly identified by the model. This is important for avoiding unnecessary treatments or further medical investigation for those who are healthy. The classifier incorrectly predicted 21% of the non-diabetic patients as diabetic. Clinically, this could lead to unnecessary stress for the patients, added healthcare costs, and potentially unnecessary treatment, which can have side effects. The classifier failed to identify 28% of the actual diabetic patients, indicating that these individuals were incorrectly classified as non-diabetic. This is particularly concerning in a clinical environment as it means that nearly a third of diabetic patients might not receive the necessary medical attention promptly. This could result in the progression of the disease and associated complications since early intervention and management of diabetes are crucial for optimal health outcomes.
In Figure 2, the ROC curves for a Light Gradient Boosting Machine classifier used for diabetes prediction are shown, i.e., curves for each class and additional curves for the macro-average and micro-average AUC. In the context of diabetes prediction, since there are only two classes (diabetic and non-diabetic), Classes 0 and 1 indicate ‘non-diabetic’ and ‘diabetic’ patients, respectively. In this case, since both Class 0 and Class 1 have AUCs of 0.83, the model is equally good at identifying diabetic, as well as non-diabetic patients. The macro-average and micro-average ROC values having AUCs of 0.83 suggest that, overall, the model has balanced performance across both classes without any bias towards one class due to imbalance in the dataset. In clinical settings, such a model indicates a reliable level of discrimination for diagnosing diabetes and could, thus, be used to support clinical decision-making.
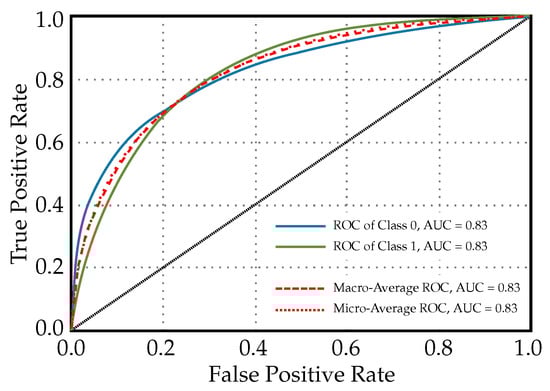
Figure 2.
ROC curves for a Light Gradient Boosting Machine classifier used for diabetes prediction (diagonal line in the graph indicates that lines above it are significant or noteworthy).
The feature importance plot, shown in Figure 3, visualizes the significance of different features used by the model to predict diabetes. A feature importance plot for diabetes prediction visually represents the relative significance of various predictors in a machine learning model’s decision-making process. In this plot, GenHlth holds the highest importance in the model, suggesting that overall self-reported health is the strongest predictor of diabetes among the features evaluated. Clinically, this could signify that how individuals perceive their health is a good indicator of underlying conditions that may include or lead to diabetes. However, general health as a feature is quite vague because it encapsulates various aspects of an individual’s overall well-being. This may include factors like diet quality, physical activity levels, mental health status, and the proper management of any existing chronic conditions. The vagueness arises from the complexity and breadth of what constitutes “general health.” Each component (diet, exercise, etc.) alone can have a multitude of dimensions and can be affected by subjective self-reporting and measurement inconsistencies. Because general health is a broad concept, when it is used as a significant feature in predictive modeling, it may provide a strong signal due to its comprehensive nature.
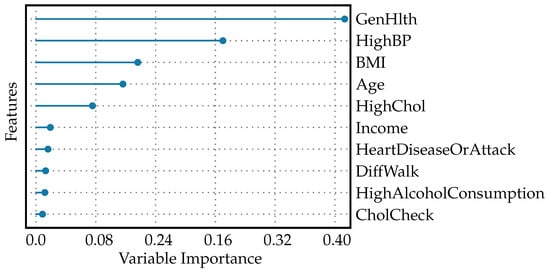
Figure 3.
Feature importance plot for diabetes prediction.
With about half the importance value of GenHlth, high blood pressure is also a significant predictor, but less so than general health status. This reflects the known association between hypertension and the risk of developing diabetes [38]. BMI, age, and HighChol: each of these features has an importance value around one quarter that of GenHlth, indicating moderate predictive power. These factors are well-established risk factors for diabetes: a higher BMI can indicate obesity [39]; age is a known risk factor as risk increases with age [40]; high cholesterol levels are associated with increased cardiovascular risks and can be indicative of metabolic issues related to diabetes [41]. Income, HeartDiseaseOrAttack, DiffWalk, HighAlcoholConsumption, CholCheck: These features have low, but non-zero importance values, which means the model found them to have some predictive value, but they contribute far less to the prediction than the top factors.
In clinical application, a plot like this helps practitioners and researchers concentrate their efforts on the most-telling risk factors when developing preventative measures and management strategies for diabetes. For example, interventions may focus on improving general health, since this is the most-influential feature; despite its vagueness, healthcare providers might emphasize comprehensive health improvement strategies that encompass diet, exercise, mental health, and chronic disease management. Managing high blood pressure: as the second-most-important factor, effective hypertension management could be a key focus for reducing diabetes risk. This could involve medication, dietary changes, and lifestyle modifications. Addressing obesity: given the BMI’s role as a moderate predictor, weight management programs could be an important component of diabetes prevention efforts. Monitoring and support for aging populations: as age is a predictor, targeted screening and intervention programs could be developed for older individuals. Controlling cholesterol levels: since high cholesterol is a moderate predictor, cholesterol management through diet, exercise, and possibly medication could also be a priority. While the features with lower importance values contribute less to the model, this does not mean they should be ignored in clinical practice. Income, for instance, can influence health outcomes through complex social determinants of health. Heart disease, physical difficulty in walking, alcohol consumption, and cholesterol checkups are all parts of a patient’s comprehensive health profile and, while less predictive in this model, still play roles in overall health and diabetes risk.
Figure 4 shows the learning curves for the Light Gradient Boosting Machine classifier used to predict the diabetes. It shows the testing score starting above the cross-validation score and, then, declining to approach the cross-validation score as the number of training instances increases. This pattern suggests that, as the model is exposed to more varied data during training, it begins to generalize better. The initial high testing score might be a result of the model being too tailored to a small dataset and not capturing the true underlying patterns. When both scores converge, this indicates that adding more data is helping the model to stabilize. The testing score decreases to meet the cross-validation score, and this convergence signifies that the model is now generalizing well and its performance on the unseen test data is becoming consistent with the validation data used during training. A model that generalizes well is crucial in clinical settings because it indicates that the model can perform reliably when diagnosing new patients not seen during the training phase. The learning curve can also suggest whether more data could help to improve the model or whether the model has plateaued and additional data might not increase performance. Since the curve have not plateaued in this case, this indicates that the model has not reached its peak performance and additional training with more data would help to improve it.
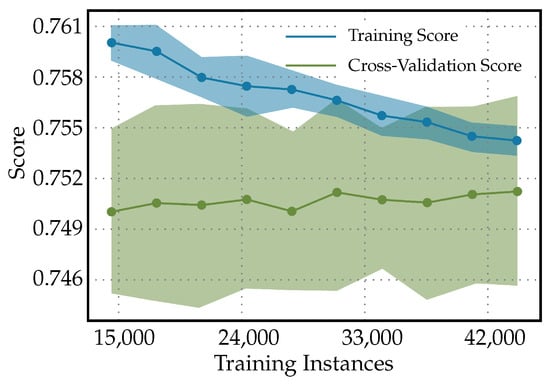
Figure 4.
Learning curves for Light Gradient Boosting Machine classifier to predict diabetes.
The validation curves in Figure 5 are a graphical representation showing the model performance (score) on both the training and validation datasets as a function of ‘max_depth’ for the Light Gradient Boosting Machine classifier. The following in the validation curves for max_depth in a Light Gradient Boosting Machine classifier used to predict diabetes can be observed. Initially, when the max_depth is at its lowest, both the training and cross-validation scores are similar and low. This indicates that the model is underfitting the data; it is not complex enough to capture the underlying relationships within the data. However, as the max_depth increases, the model is allowed to create more-complex decisions, and it starts to fit the training data better, resulting in an increased training score. However, the cross-validation score begins to decrease after a certain point, suggesting the model is starting to overfit the training data. This divergence is a classic sign of overfitting. The classifier, with increasing max_depth, is becoming more specialized in dealing with the intricacies of the training data, including noise, which does not generalize well to unseen data. In practice, for predicting diabetes, this pattern means that an ideal max_depth should balance the training and validation scores. It should be high enough to adequately learn from the data, but not so high as to overfit. Tuning would involve finding a max_depth where the validation score is maximized before it starts to decrease. The ideal max_depth would provide a model that is adequately complex to predict diabetes accurately, but not too complex that it does not generalize well to new patient data. A model that overfits may perform exceptionally on historical data, but fail in a real-world clinical setting. This could lead to incorrect predictions, which, in turn, could potentially cause harm if the predictions are used to guide treatment or diagnose patients. Hence, when using a Light Gradient Boosting Machine classifier for diabetes prediction, one must be careful not to choose a max_depth that is too high to avoid overfitting.
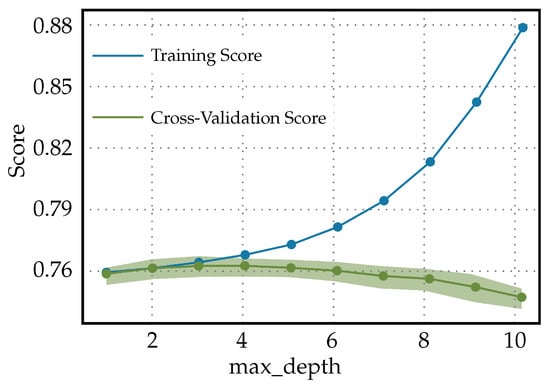
Figure 5.
Validation curves for Light Gradient Boosting Machine classifier used to predict diabetes.
3.2. Diabetes Readmission Prediction
In Table 3, the Light Gradient Boosting Machine classifier scores highest in all metrics except for F1 and Kappa, where the Extreme Gradient Boosting performs best. In the context of diagnosing diabetes, high accuracy indicates that LightGBM makes the most-correct predictions across all cases evaluated. This is generally desirable, but high accuracy alone can be misleading if the dataset is imbalanced (i.e., there are significantly more non-diabetic than diabetic patients). The high AUC value for LightGBM suggests it is good at distinguishing between diabetic and non-diabetic patients. The fact that XGBoost has the highest F1-score suggests that it has a better balance between precision and recall compared to LightGBM, which may be particularly relevant if one is more important than the other—for example, if it is crucial to minimize false negatives due to the severe consequences of undiagnosed diabetes. The higher Kappa for XGBoost indicates a stronger agreement between the predicted and actual values, considering the possibility of random chance leading to agreement. Hence, even though LightGBM shows the highest performance in most metrics, XGBoost stands out in terms of F1 -score and Kappa. These suggest that XGBoost, while potentially slightly less accurate overall, might offer a more-reliable balance of precision and recall, making fewer mistakes for both false positives and false negatives, which in medical applications can be just as important as overall accuracy.
In practice, the choice between the models may come down to the specific clinical requirements and the costs associated with different types of diagnostic errors. In the end, the choice between these models would likely involve a trade-off depending on whether sensitivity or precision is more valued for the particular application of diagnosing diabetes. For example, in a screening context where false negatives could be more harmful, a model with a higher recall might be more appropriate. It is also possible that different healthcare settings might deploy different models accordingly; for instance, one might use LightGBM in general screening due to its high accuracy, and another might use XGBoost in high-risk populations where the costs of false negatives are particularly high. However, the F1 and Kappa values for LightGBM are very close to those for XGBoost, which has the highest values in these metrics. This suggests that LightGBM provides a near-equivalent balance of precision and recall and almost as much reliability and agreement as XGBoost. With LightGBM scoring slightly lower on the F1-score and Kappa, but still in close range to XGBoost, we favor LightGBM because it outperforms XGBoost in other important metrics like accuracy and AUC.
Figure 6 presents a confusion matrix, i.e., a tabular representation illustrating the performance of the Light Gradient Boosting Machine classifier in predicting diabetes readmission. The three conditions represented are as follows. Condition 0: no readmission, Condition 1: readmission before 30 days, and condition 2: readmission more than 30 days after discharge. The confusion matrix elements, as denoted by x_ij, where i is the true class and j is the predicted class, quantify the percentage of predictions that fall into each category as follows. x11 = 3%: percentage of patients correctly predicted as ‘no readmission’ (true negatives for condition 0). x21 = 1%: percentage of patients incorrectly predicted as ‘no readmission’ when they were actually readmitted before 30 days. x31 = 0%: percentage of patients incorrectly predicted as ‘no readmission’ when they were actually readmitted after more than 30 days. x12 = 38%: Percentage of patients incorrectly predicted as ‘readmitted before 30 days’ when there was no readmission. x22 = 37%: percentage of patients correctly predicted as ‘readmitted before 30 days’ (true positives for condition 1). x32 = 15%: percentage of patients incorrectly predicted as ‘readmitted before 30 days’ when the readmission actually occurred after more than 30 days. x13 = 59%: percentage of patients incorrectly predicted as ‘readmission after more than 30 days’ with no actual readmission. x23 = 63%: percentage of patients incorrectly predicted as ‘readmission after more than 30 days’ when they were actually readmitted before 30 days. x33 = 84%: percentage of patients correctly predicted as ‘readmission after more than 30 days’ (true positives for condition 2).
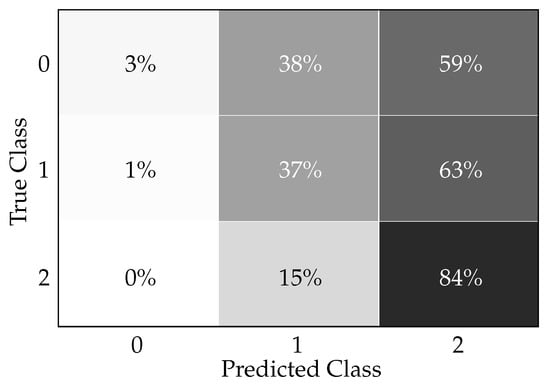
Figure 6.
Light Gradient Boosting Machine classifier confusion matrix for readmission prediction.
Clinically, in practice, this confusion matrix indicates how accurately the model can predict patient readmission, which is critical information for healthcare providers and institutions. The ability to predict readmissions can help in targeting interventions to reduce preventable readmissions and improve patient outcomes. The data can be interpreted clinically as follows. The high true positive rate for condition 2 (84%) suggests that the model is particularly effective at identifying patients at risk of readmission more than 30 days after discharge, which could be valuable for long-term patient care planning and intervention. The relatively low true positive rates for conditions 0 and 1 (3% and 37%, respectively) indicate that the model is less reliable at classifying patients who are not likely to be readmitted, as well as those who might be readmitted within 30 days. This might lead to some degree of unnecessary resource allocation for individuals less at risk while potentially under-serving those at higher risk of short-term readmission. The incorrect predictions, such as patients without readmission being classified as readmitted before 30 days (38%) or after more than 30 days (59%), could result in unnecessary follow-up, adding to patient anxiety and burdening the healthcare system. Conversely, the model’s incorrect predictions in missing true cases of readmission within 30 days (i.e., x21 and x23) represent a risk of not providing necessary care for those patients, which could lead to worse health outcomes. In practice, these results would necessitate a balance between managing the risks of unnecessary follow-ups (resulting from false positives) versus the risk of missing early interventions (due to false negatives). This balance is important for the quality of patient care, clinical workflow, resource allocation, and healthcare costs.
Figure 7 illustrates the ROC curves for a Light Gradient Boosting Machine classifier that is used for predicting diabetes readmission. Each ROC curve corresponds to one of the readmission categories, and the area under each curve provides a measure of how well the model distinguishes between classes. The ROC of class 0, AUC = 0.67: This is the ROC curve for patients with no readmission. An AUC of 0.67 suggests that the model has a moderate ability to distinguish between patients who will not be readmitted and those who will. ROC of class 1, AUC = 0.66: This curve pertains to patients readmitted before 30 days. The AUC value indicates that the classifier’s ability to differentiate between those readmitted within 30 days and all other outcomes is slightly less than moderate. ROC of class 2, AUC = 0.69: This relates to the patients readmitted more than 30 days after discharge. An AUC of 0.69 shows that the model is moderately good at differentiating between late readmissions and the other outcomes. Macro-average ROC, AUC = 0.78: The macro-average AUC is calculated by taking the average of the AUC values for each class. An AUC of 0.78 is relatively high, indicating good overall discriminatory ability across all classes without taking class imbalance into account. Micro-average ROC, AUC = 0.67: The micro-average AUC aggregates the contributions of all classes to compute the average AUC. A value of 0.67 suggests that the model has a moderate overall performance at distinguishing between classes when considering class imbalance.
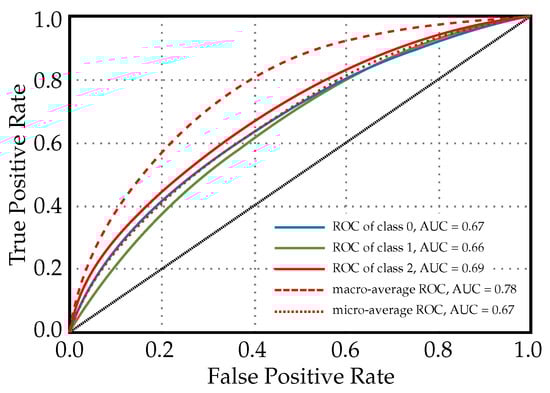
Figure 7.
ROC curves for a light gradient boosting machine classifier used for diabetes readmission prediction.
Clinically, the AUC values provide insight into the model’s predictive power. An AUC closer to 1 indicates excellent model performance, while an AUC closer to 0.5 suggests that the model is no better than random chance. In this case, the LightGBM classifier shows moderate predictive performance for individual classes, and the macro-average indicates a better overall performance. It is important for clinicians and healthcare administrators to consider these values when deciding how to incorporate the model into practice. When using this model, it may need to be combined with other clinical assessments and risk stratification tools to make more-informed decisions about patient care following discharge.
The feature importance plot for diabetes readmission prediction is shown in Figure 8. The plot shows that AvgGlucoseLevel holds the greatest importance. This implies that the average blood glucose level of a patient is the strongest predictor for whether a patient with diabetes might be readmitted to the hospital. It is clinically meaningful as glucose levels need to be managed effectively in diabetics to prevent complications. BMI has the second-highest importance value. This reflects that a patient’s body weight relative to his/her height is a significant factor in readmission risk, likely due to obesity being a risk factor for diabetes complications. Lower values are attributed to features like WorkType, EverMarried, Hypertension, SmokingStatus, HeartDisease, and ResidenceType. Although these have an association with the risk of readmission, their influence is stronger than factors like sex and age, but less than AvgGlucoseLevel and BMI. These could represent lifestyle and social determinants of health that impact patient outcomes to a lesser degree. Finally, sex and age are given zero values, suggesting that, in this particular model, they do not contribute to predicting readmission for patients with diabetes. This does not mean these factors are not important in other contexts, but in this specific model’s configuration, their impact is non-existent or negligible. This hierarchy in feature importance can help healthcare providers focus their interventions and follow-up strategies on what matters most for preventing readmissions in diabetic patients. They may focus more on controlling blood glucose levels and managing weight, while still being aware of other factors that could influence a patient’s risk of returning to the hospital.
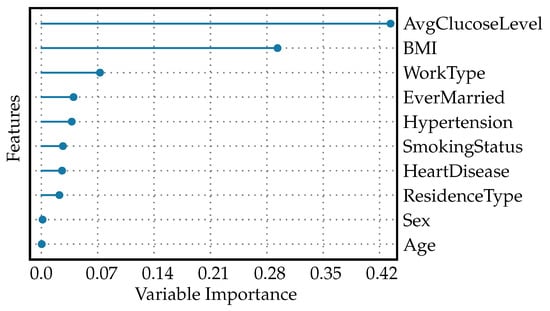
Figure 8.
Feature importance plot for diabetes readmission prediction.
In Figure 9, the following characteristics in the learning curves for a Light Gradient Boosting Machine classifier used for diabetes readmission prediction can be observed. Since the training curve is constant at 1, it suggests that the LightGBM model is perfectly fitting the training data throughout the training process, from the smallest to the largest number of training instances. A constant score of 1 indicates that the model has 100% accuracy on the training dataset, which often points to overfitting. The increasing of the cross-validation score curve signifies that, as more data are provided for training, the model’s performance on unseen data (the validation set) is improving. Initially, when the number of training instances is small, the model may not have learned the underlying patterns adequately, which is reflected in a lower cross-validation score. As training progresses and the model is trained on more data, it begins to generalize better, capturing the essential patterns to make more-accurate predictions on unseen data. The cross-validation score approaching 1 towards the end of the training process means that the model’s predictive performance on unseen data is nearly perfect. This can be an indicator that the model has learned the underlying trends in the data quite well and is able to generalize this learning to new data effectively.

Figure 9.
Learning curves for light gradient boosting machine classifier used for diabetes readmission prediction.
In the clinical context, learning curves with such characteristics have both positive and negative implications. A perfect training score is often a red flag for overfitting. In a clinical setting, an overfitted model may perform exceptionally well on historical data, but fail to predict accurately on future patients or those from different demographic groups. Therefore, the clinical reliability of such a model might be questionable. However, the increasing cross-validation score is a good sign that the model is improving its ability to generalize as it sees more data. Clinically, this can translate to more-reliable predictions for patient readmissions as the model is exposed to and learns from a broader variety of patient cases. Therefore, before the model is used in practice, it would be necessary to validate its performance on an independent test set that the model has never seen before. If the model performs equally well on the independent test set, this would provide more confidence that it will perform well in a real-world clinical environment. Additionally, if the cross-validation score continues to improve and reaches nearly 1, it could suggest that the model training has reached a plateau; additional training instances might not lead to any significant improvements. Clinically, if the validation and independent testing confirm these results, this model could be considered reliable for predicting diabetes readmission.
The validation curves for the Light Gradient Boosting Machine classifier used to predict diabetes readmission are shown in Figure 10. When both the training score and the cross-validation score of the Light Gradient Boosting Machine Classifier used for predicting diabetes readmission increase together as the ‘max_depth’ hyperparameter increases and neither reaches a plateau, this can be indicative of a few things as follows. Underfitting at lower ‘max_depth’: Initially, both scores starting at the same lower value typically means that, at low complexity (shallower trees), the model may not be capturing enough of the data’s complexity to make accurate predictions. Increasing complexity improves performance: As ‘max_depth’ increases, allowing the model to represent more-complex functions, both the training and validation scores improve. This behavior indicates that more-complex models are doing a better job of capturing the trends in the data without fitting to noise and, hence, are generalizing well. No evidence of overfitting with increased ‘max_depth’: The fact that the validation score continues to increase suggests that the model has not yet begun to overfit to the training data. Overfitting is typically marked by a decrease in the validation score as the complexity of the model increases beyond a certain point. No plateau has been reached: Neither the training score nor the validation score leveling off suggests that the model might benefit from further increases in complexity, and there might still be room to improve the model’s performance with increasing ‘max_depth’ up to a certain point that has not been reached within the range of the ‘max_depth’ values considered.
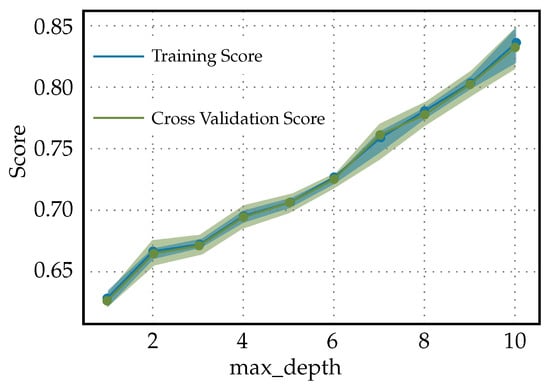
Figure 10.
Validation curves for Light Gradient Boosting Machine classifier used to predict diabetes readmission.
4. Discussion
Diabetes is a multifaceted disease, influenced by genetics, lifestyles, and socioeconomic factors, thus demanding personalized treatment approaches. Machine learning models stand at the forefront of enabling such individualized care by leveraging vast amounts of health data to uncover complex, nonlinear relationships that may go undetected by traditional methods [42,43]. The importance of these models lies in their ability to digest diverse datasets, including genetic profiles, dietary habits, exercise routines, and even environmental and social influences, to predict diabetes-related outcomes with precision. By accommodating the unique aspects of each patient’s condition, machine learning facilitates a more-nuanced understanding of the disease, paving the way for tailored treatment plans. Such customization is increasingly necessary to manage diabetes effectively, given its dynamic nature and varying impact across populations, reinforcing the essential role that machine learning plays in advancing diabetes care. In this study, we employed the PyCaret machine learning library to predict diabetes outcomes and readmission rates, a task of high clinical relevance given the burden of diabetes on patients and healthcare systems. Our comparative assessment of advanced algorithms underscores the intricate balance between sensitivity and specificity in medical diagnostics.
The results presented confirmed the capacity of the PyCaret library to facilitate the development of robust predictive models. The Extra Trees classifier, among others, emerged as a prominent algorithm owing to its exceptional performance metrics such as the Kappa statistic and Matthews correlation coefficient. These metrics highlight the classifier’s proficiency in identifying true positive and negative cases, a characteristic that is essential in clinical decision-making to minimize the risk of overlooking diabetes diagnoses or inappropriately predicting readmissions. The application of transfer learning and the utilization of pretrained models present a promising approach when working with limited datasets. These methods leverage the knowledge gained from large, previously trained models, adapting it to smaller, domain-specific datasets with potentially fewer instances. By fine-tuning the last layers of a pretrained network, one can enhance performance on a new task without the need for the extensive data that are often required to train deep learning models from scratch. This technique can capitalize on the generalizability of features learned from the larger dataset, allowing for the efficient utilization of the available data and potentially yielding improved performance on tasks with limited samples. It opens the door for incremental learning, where the model can be continuously updated as new data become available, making it highly suitable for dynamic fields such as healthcare, where obtaining large, annotated datasets can be challenging.
Machine learning models that have proven effective in our study are likely to have far-reaching implications. For healthcare professionals, the application of these models could translate to a transformative approach in the prognosis of diabetes and its complications, with the potential to significantly reduce readmission rates through precise and timely diagnosis. This could lead to more-individualized patient care, optimizing the use of healthcare resources and potentially improving the quality of life for individuals with diabetes. Furthermore, our analysis shed light on the risk factors predictive of diabetes and its associated readmissions. Such insights are pivotal as they can inform targeted interventions for high-risk populations. However, it is paramount to note that, while the models exhibit substantial predictive power, model refinement and validation in diverse clinical settings are imperative to bolster their applicability. Surprisingly, the study revealed disparities in the predictive models’ ability to detect early versus late readmission. This highlights an opportunity for further investigation into model tuning to enhance early readmission predictions, which are crucial for immediate post-discharge care and planning.
This study utilizes open-source datasets, specifically the DSD and the DRD from the UC Irvine Machine Learning Repository, due to their wide use and accessibility within the research community. It is important to note, however, that the reliance on these datasets introduces certain limitations regarding the quality and the representativeness of the data. Such datasets may not capture the full spectrum of the diabetic population, potentially impacting the generalizability of our model’s findings. The representativeness of the patient data from these datasets, as compared to the broader diabetes population, should be critically considered when interpreting the results of this study. Further research using a diverse range of datasets, including those that more accurately reflect the current demographic makeup of the diabetic community, would be beneficial for confirming the validity and improving the applicability of our predictive modeling approach. This is a recognized challenge within the field and one that is important for the advancement of machine learning tools aimed at diagnosing and managing diseases like diabetes. Additionally, the discussion of overfitting reflects a recurrent challenge in machine learning. Our learning and validation curves indicated the necessity for optimal complexity in our models. The drive to improve sensitivity must be carefully weighed against the risk of generating models too finely tuned to training data that they fail to generalize to new patients. Therefore, continuous refinement of the balance between model complexity and generalizability is essential. Hence, while the application of the PyCaret library in predicting diabetes and readmission has shown promise, further exploration and validation are required. The inescapable trade-offs between different performance metrics point to the necessity for an interdisciplinary approach that combines machine learning expertise with clinical knowledge. The efficacious application of a Light Gradient Boosting Machine classifier for diabetes prediction and diabetes readmission prediction in our analysis underscores this synergy. These models have exhibited a balance between capturing complex patterns in the data and avoiding the pitfall of overfitting.
Our findings suggest that the Light Gradient Boosting Machine classifier, with its capability to handle various types of features and data distributions, stands out for its diagnostic accuracy for diabetes. This has broad implications for the early identification of diabetic patients, which is crucial for the timely initiation of the treatment and prevention of acute complications. The model’s performance was particularly strong in distinguishing between diabetic and non-diabetic cases, a result that may be attributed to its iterative approach, which focuses on correcting the misclassified observations in successive training rounds. However, machine learning models with a 20–30% false positive rates indicate that the models misclassified about one-quarter of the negative cases as positive, such as predicting that patients will be readmitted when they will not be. This could be due to a variety of factors, including imbalanced datasets, where one class predominates, leading to bias; inadequate or noisy features that fail to capture the essence of the predictive patterns; improperly calibrated decision thresholds that tip the balance towards positive predictions; overfitting, where the model fits the training data including their noise too closely and fails to generalize; or underfitting, where the model is too simplistic to capture the underlying structure of the data. It might also be attributed to data quality issues, such as inaccuracies in the data that the model was trained on. To reduce false positives in the future, efforts should focus on ensuring high-quality data and possibly reevaluating the features used for prediction. Consideration might also be given to employing class balance techniques, adjusting the decision-making threshold, and applying regularization techniques to improve the model’s generalizability. These steps are crucial for making the model more reliable and, thus, more useful in clinical applications where accurate predictions can significantly impact patient outcomes.
The models discussed in the study can uncover the influence of feature interrelations that might not be evident when considering individual feature’s impacts in isolation. Machine learning techniques, especially those encompassing complex models like ensemble methods or deep learning, are capable of capturing nonlinear interactions and dependencies between features. For instance, a single variable might have minimal predictive power on its own, but when combined with others, it can contribute significantly to the model’s accuracy. By examining feature importance plots and analyzing the model’s decision-making process, insights into complex interactions can be deduced. Understanding these interrelations is critical because it can lead to more-accurate predictions and can inform clinicians about synergistic or antagonistic effects between variables. This might lead to the discovery of previously unknown patterns in the data, influencing decisions regarding treatment plans or follow-up strategies. It highlights the need for careful consideration of the model’s interpretability and the use of appropriate tools to shed light on how different features influence model predictions.
It is essential to focus on the potential impact of these models on patient outcomes and the healthcare system in general. These models must deliver actionable insights that improve the accuracy and timeliness of diagnoses, guiding interventions that mitigate the risk of complications and readmissions. Clinicians rely on the outputs of these models to make decisions, so the models must be trustworthy and their predictions should align with real-world clinical scenarios. The effectiveness of a predictive model is not solely determined by its statistical accuracy; it also depends on its ability to support healthcare providers in making decisions that lead to better care and resource utilization. A model that accurately identifies patients at high risk for diabetes complications or readmission can help in allocating medical resources more effectively and possibly preventing worse health outcomes. Conversely, a model must also avoid overburdening the healthcare system with false alerts that could lead to unnecessary tests or treatments. Ultimately, incorporating predictive models into clinical practice involves a careful consideration of these trade-offs to ensure that the models serve their intended purpose—to support clinicians in delivering optimal care to diabetic patients and efficiently manage hospital resources.
For predicting diabetes readmission, the metrics achieved by the Light Gradient Boosting Machine classifier indicate its utility in prognostic settings. The ability to accurately predict readmissions can profoundly affect patient management, potentially preventing the adverse outcomes associated with early rehospitalization. This outcome is particularly vital as it enables healthcare providers to identify individuals most at risk and deploy interventions preemptively, thus enhancing patient care and optimizing resource utilization. The dynamic nature of diabetes progression and readmission rates demands that predictive models are not only accurate, but also adaptable. Our learning curves for the Light Gradient Boosting Machine classifier point towards a model that benefits from more data. Similarly, the validation curves suggest that models need to be finely tuned to generalize well to unseen patient data undefined. This need for adaptability raises the question of how the models would perform when subjected to data from varied demographics or different healthcare settings.
The clinical implications of our study are far-reaching. From guiding policy on diabetes management programs to influencing the allocation of resources for patient education and follow-up care, the potential applications of our research are myriad. One of the most-critical considerations moving forward would be the ethical implementation of these predictive models, ensuring that they serve to augment, rather than replace, the clinical judgment of healthcare professionals. In light of the promising performance exhibited by the predictive capabilities of the Light Gradient Boosting Machine classifier, it remains essential to examine the broader implications of integrating these models into clinical workflows. The Light Gradient Boosting Machine classifier, with its high-performance metrics, offers a compelling solution for diabetes prediction. This model, which excels in various performance metrics, can augment the clinician’s ability to diagnose diabetes more effectively, potentially facilitating better patient outcomes through earlier intervention and targeted treatment plans.
The impactful performance of the Light Gradient Boosting Machine classifier in predicting diabetes readmission emphasizes its potential role in post-discharge care. Accurate predictions of readmission can enable healthcare professionals to identify at-risk individuals and tailor follow-up care accordingly. This could have substantial benefits in terms of reducing hospitalization costs, enhancing patient satisfaction, and, most importantly, improving the health status of patients with diabetes. The presented learning curves indicated that the models’ performance could be further enhanced by increasing the volume and diversity of the training data. This points towards a growing need for extensive datasets that reflect the multifaceted nature of diabetes across different populations and healthcare settings. The validation curves, on the other hand, suggest that the selected hyperparameters offer a satisfactory balance between learning the training data’s underlying trends and maintaining generalization over the validation data.
It is also worth considering the practical applicability of our findings in the healthcare industry. For example, the deployment of these models on electronic health records could streamline the identification of patients requiring closer management, thereby personalizing healthcare delivery. Nonetheless, we must also be mindful of the risks associated with over-reliance on algorithmic decisions. It is imperative to integrate these models within a decision support framework that respects the nuances of individual patient cases and leverages the indispensable expertise of healthcare providers. The uncertainties of predictive models, particularly in the context of diagnosing diabetes and predicting hospital readmissions, stem from various sources and can significantly impact their clinical utility. Firstly, there is the inherent variability in patient populations. The datasets used to train these models may not capture the full spectrum of diabetes presentations, leading to uncertainties when the models are applied to diverse real-world populations. Changes in population demographics, disease prevalence, and practice patterns can all influence model performance. Secondly, data quality and completeness can introduce uncertainty. Models are developed based on available data, which might have missing values, measurement errors, or lack critical predictors not captured in the dataset. This limitation can impact the precision of the predictions, leading to a higher number of false negatives or positives. Thirdly, the choice of modeling approach and complexity of the model can lead to different levels of uncertainty. Complex models might perform excellently on training data, but may not generalize well to new data (overfitting), while simpler models may not capture all the nuances of the disease (underfitting). Another source of uncertainty is the evolution of medical knowledge and practices. As new clinical guidelines and treatments emerge, the relevance and effectiveness of existing models may diminish if they are not updated accordingly. Furthermore, the interpretability of the models also introduces uncertainties in clinical practice. If the decision-making process of the model is not transparent, clinicians might be uncertain about the reliability of the predictions, which could hinder their adoption. Lastly, patient behavior and adherence to treatment can introduce unpredictability that is difficult for models to account for. Factors such as lifestyle changes, medication adherence, and access to healthcare services can significantly sway the outcomes that models attempt to predict. All these aspects contribute to the overall uncertainty associated with predictive models and need to be considered when integrating them into clinical workflows, communicating risks to patients, and making informed decisions based on their outputs.
Hence, the study affirms the value of PyCaret-based machine learning models in addressing complex clinical questions, such as diabetes prediction and readmission rates. While the results are promising, continuous collaboration between data scientists and healthcare professionals is essential in refining these models. Future research should focus on external validation, exploring the utility of these models across various patient demographics and healthcare infrastructures, ensuring their reliability and helping to bridge the gap between machine learning and patient care. The pursuit of such interdisciplinary collaborations holds the key to unlocking the full potential of machine learning in enhancing healthcare outcomes for patients with diabetes.
In looking to the future of diabetes prediction models, the emphasis must be placed on enhancing clinical applicability, accommodating the intricacies of personalized healthcare and ensuring adaptability across varying demographics and healthcare infrastructures. Clinically applicable models need to be user-friendly and easily integrated into healthcare providers’ existing routines, enabling prompt and informed decisions. Furthermore, ensuring that these predictive tools are relevant and effective for diverse populations and can operate within different healthcare setups, from urban hospitals to resource-limited rural clinics, is crucial for their global utility. Investing in these areas will help to refine diabetes management and contribute to overall improvements in healthcare outcomes. The pursuit of AI transparency is a key trajectory for future developments, and it holds particular significance in the healthcare sector, where the decision-making process must be clear and justifiable. The opacity of complex models, often referred to as ‘black-box’ systems due to their obscure internal workings, can hinder their credibility and uptake by medical professionals who require a thorough understanding of how predictions are arrived at to inform patient care. Regulatory entities are increasingly emphasizing the need for transparency in AI tools destined for clinical applications. As certainty and acceptance grow with more-intelligible models, the articulation of AI decision processes is expected to become a standard requisite. This will not only assist healthcare professionals, but will also ensure that such systems adhere to ethical standards and regulations.
5. Conclusions
Provided below is a concise summary of the study’s principal findings and viewpoints, structured as bullet points. These encapsulate the study’s contributions to the use of machine learning in healthcare, highlighting the capability to improve diabetes management and identifying paths for subsequent research:
- Diabetes mellitus is a metabolic condition that leads to high blood glucose levels, increasing the risk of cardiovascular disease and requiring a multidisciplinary management approach.
- The study explores the use of machine learning, specifically the PyCaret library, in predicting and managing diseases, with a focus on diabetes mellitus and hospital readmission rates.
- Machine learning has been used to predict the incidence and risk factors of diabetes and other cardiovascular diseases, using a dataset from the Kaggle repository.
- The Light Gradient Boosting Machine classifier was identified as a prominent algorithm due to its high performance metrics, particularly in predicting late readmissions.
- However, the model was less reliable in classifying patients who are not likely to be readmitted or those who might be readmitted within 30 days.
- There is a need for further research and validation across diverse clinical settings to fully incorporate machine learning into modern diabetes care.
- The study highlights the importance of balancing different performance metrics and considering the specific clinical requirements and costs associated with different types of diagnostic errors.
- The study affirms the value of machine learning models in addressing complex clinical questions and improving the accuracy and timeliness of diagnoses.
- The findings ought to be contextualized within the broader landscape of healthcare analytics and their implications for diabetes management.
- Future research should focus on external validation and explore the utility of these models across various patient demographics and healthcare infrastructures.
Author Contributions
Conceptualization, R.J., F.S., A.T. and M.T.; methodology, R.J., F.S., A.T. and M.T.; software, R.J., F.S., A.T. and M.T.; validation, R.J., F.S., A.T. and M.T.; formal analysis, R.J., F.S., A.T. and M.T.; investigation, R.J., F.S., A.T. and M.T.; resources, R.J., F.S., A.T. and M.T.; data curation, R.J., F.S., A.T. and M.T.; writing—original draft preparation, R.J., F.S., A.T. and M.T.; writing—review and editing, R.J., F.S., A.T. and M.T.; visualization, R.J., F.S., A.T. and M.T.; supervision, M.T.; project administration, M.T. All authors have read and agreed to the published version of the manuscript.
Funding
This research received no external funding.
Institutional Review Board Statement
Not applicable.
Informed Consent Statement
Not applicable.
Data Availability Statement
The datasets analyzed in this study, as well as the software used for their analysis, are available online. The corresponding references to these datasets and software are included in the article. Any additional information or data not provided in the article can be obtained upon reasonable request.
Conflicts of Interest
The authors declare no conflicts of interest.
Abbreviations
The following abbreviations are used in this manuscript:
| CVD | cardiovascular disease |
| BMI | body mass index |
| CAD | coronary artery disease |
| DSD | Diabetes Surveillance Dataset |
| BRFSS | Behavioral Risk Factor Surveillance System |
| DRD | diabetes readmission dataset |
| AUC | area under the curve |
| MCC | Matthews correlation coefficient |
| TT | training time |
| ROC | receiver operating characteristic |
References
- Cloete, L. Diabetes mellitus: An overview of the types, symptoms, complications and management. Nurs. Stand. 2021, 37, 61–66. [Google Scholar] [CrossRef]
- American Diabetes Association. Diagnosis and Classification of Diabetes Mellitus. Diabetes Care 2009, 32, S62–S67. [Google Scholar] [CrossRef] [PubMed]
- Negroiu, C.E.; Tudorascu, I.; Moise, C.G.; Vinturis, E.; Bezna, C.M.; Danoiu, R.; Gaman, M.E.; Danoiu, S. Obesity and Myocardial Infarction-The Place of Obesity Among Cardiovascular Risk Factors-Retrospective Study. Curr. Health Sci. J. 2023, 3, 388–396. [Google Scholar] [CrossRef]
- Desai, R.; Katukuri, N.; Goguri, S.R.; Kothawala, A.; Alle, N.R.; Bellamkonda, M.K.; Dey, D.; Ganesan, S.; Biswas, M.; Sarkar, K.; et al. Prediabetes: An overlooked risk factor for major adverse cardiac and cerebrovascular events in atrial fibrillation patients. World J. Diabetes 2024, 15, 24–33. [Google Scholar] [CrossRef]
- Lotfy, M.; Adeghate, J.; Kalasz, H.; Singh, J.; Adeghate, E. Chronic Complications of Diabetes Mellitus: A Mini Review. Curr. Diabetes Rev. 2016, 13, 3–10. [Google Scholar] [CrossRef] [PubMed]
- Kim, M.J.; Cho, Y.K.; Jung, C.H.; Lee, W.J. Association between cardiovascular disease risk and incident type 2 diabetes mellitus in individuals with prediabetes: A retrospective cohort study. Diabetes Res. Clin. Pract. 2024, 208, 111125. [Google Scholar] [CrossRef] [PubMed]
- Barrett-Connor, E.; Wingard, D.; Wong, N.; Goldberg, R. Heart Disease and Diabetes. In Diabetes in America, 3rd ed.; Cowie, C., Casagrande, S., Menke, A., Cissell, M., Eberhardt, M., Meigs, J., Gregg, E., Knowler, W., Barrett-Connor, E., Becker, D., et al., Eds.; National Institute of Diabetes and Digestive and Kidney Diseases (US): Bethesda, MD, USA, 2018; Chapter 18. [Google Scholar]
- Pikula, A.; Howard, B.; Seshadri, S. Stroke and Diabetes. In Diabetes in America, 3rd ed.; Cowie, C., Casagrande, S., Menke, A., Cissell, M., Eberhardt, M., Meigs, J., Gregg, E., Knowler, W., Barrett-Connor, E., Becker, D., et al., Eds.; National Institute of Diabetes and Digestive and Kidney Diseases (US): Bethesda, MD, USA, 2018; Chapter 19. [Google Scholar]
- Nanayakkara, N.; Curtis, A.J.; Heritier, S.; Gadowski, A.M.; Pavkov, M.E.; Kenealy, T.; Owens, D.R.; Thomas, R.L.; Song, S.; Wong, J.; et al. Impact of age at type 2 diabetes mellitus diagnosis on mortality and vascular complications: Systematic review and meta-analyses. Diabetologia 2020, 64, 275–287. [Google Scholar] [CrossRef] [PubMed]
- Moonesinghe, R.; Yang, Q.; Zhang, Z.; Khoury, M.J. Prevalence and Cardiovascular Health Impact of Family History of Premature Heart Disease in the United States: Analysis of the National Health and Nutrition Examination Survey, 2007–2014. J. Am. Heart Assoc. 2019, 8, e012364. [Google Scholar] [CrossRef] [PubMed]
- Wong, N.D.; Zhao, Y.; Patel, R.; Patao, C.; Malik, S.; Bertoni, A.G.; Correa, A.; Folsom, A.R.; Kachroo, S.; Mukherjee, J.; et al. Cardiovascular Risk Factor Targets and Cardiovascular Disease Event Risk in Diabetes: A Pooling Project of the Atherosclerosis Risk in Communities Study, Multi-Ethnic Study of Atherosclerosis, and Jackson Heart Study. Diabetes Care 2016, 39, 668–676. [Google Scholar] [CrossRef]
- Holman, R.R.; Paul, S.K.; Bethel, M.A.; Matthews, D.R.; Neil, H.A.W. 10-Year Follow-up of Intensive Glucose Control in Type 2 Diabetes. N. Engl. J. Med. 2008, 359, 1577–1589. [Google Scholar] [CrossRef]
- Hayward, R.A.; Reaven, P.D.; Wiitala, W.L.; Bahn, G.D.; Reda, D.J.; Ge, L.; McCarren, M.; Duckworth, W.C.; Emanuele, N.V. Follow-up of Glycemic Control and Cardiovascular Outcomes in Type 2 Diabetes. N. Engl. J. Med. 2015, 372, 2197–2206. [Google Scholar] [CrossRef]
- Pal, K.; Eastwood, S.V.; Michie, S.; Farmer, A.J.; Barnard, M.L.; Peacock, R.; Wood, B.; Inniss, J.D.; Murray, E. Computer-based diabetes self-management interventions for adults with type 2 diabetes mellitus. Cochrane Database Syst. Rev. 2013, 2013, CD008776. [Google Scholar] [CrossRef]
- Saffari, M.; Ghanizadeh, G.; Koenig, H.G. Health education via mobile text messaging for glycemic control in adults with type 2 diabetes: A systematic review and meta-analysis. Prim. Care Diabetes 2014, 8, 275–285. [Google Scholar] [CrossRef] [PubMed]
- Liang, X.; Wang, Q.; Yang, X.; Cao, J.; Chen, J.; Mo, X.; Huang, J.; Wang, L.; Gu, D. Effect of mobile phone intervention for diabetes on glycaemic control: A meta-analysis: Mobile phone intervention and glycaemic control. Diabet. Med. 2011, 28, 455–463. [Google Scholar] [CrossRef] [PubMed]
- Li, C.; Sadraie, B.; Steckhan, N.; Kessler, C.; Stange, R.; Jeitler, M.; Michalsen, A. Effects of A One-week Fasting Therapy in Patients with Type-2 Diabetes Mellitus and Metabolic Syndrome—A Randomized Controlled Explorative Study. Exp. Clin. Endocrinol. Diabetes 2017, 125, 618–624. [Google Scholar] [CrossRef]
- American Diabetes Association. Reduction in Weight and Cardiovascular Disease Risk Factors in Individuals With Type 2 Diabetes. Diabetes Care 2007, 30, 1374–1383. [Google Scholar] [CrossRef]
- Ismail, K.; Winkley, K.; Rabe-Hesketh, S. Systematic review and meta-analysis of randomised controlled trials of psychological interventions to improve glycaemic control in patients with type 2 diabetes. Lancet 2004, 363, 1589–1597. [Google Scholar] [CrossRef]
- Umpierre, D. Physical Activity Advice Only or Structured Exercise Training and Association With HbA1cLevels in Type 2 Diabetes: A Systematic Review and Meta-analysis. JAMA 2011, 305, 1790. [Google Scholar] [CrossRef] [PubMed]
- Jeon, C.Y.; Lokken, R.P.; Hu, F.B.; van Dam, R.M. Physical Activity of Moderate Intensity and Risk of Type 2 Diabetes. Diabetes Care 2007, 30, 744–752. [Google Scholar] [CrossRef]
- Rubin, D.J. Hospital Readmission of Patients with Diabetes. Curr. Diabetes Rep. 2015, 15, 17. [Google Scholar] [CrossRef]
- Soh, J.G.S.; Wong, W.P.; Mukhopadhyay, A.; Quek, S.C.; Tai, B.C. Predictors of 30-day unplanned hospital readmission among adult patients with diabetes mellitus: A systematic review with meta-analysis. BMJ Open Diabetes Res. Care 2020, 8, e001227. [Google Scholar] [CrossRef]
- Ogunpola, A.; Saeed, F.; Basurra, S.; Albarrak, A.M.; Qasem, S.N. Machine Learning-Based Predictive Models for Detection of Cardiovascular Diseases. Diagnostics 2024, 14, 144. [Google Scholar] [CrossRef]
- Joshi, R.D.; Dhakal, C.K. Predicting Type 2 Diabetes Using Logistic Regression and Machine Learning Approaches. Int. J. Environ. Res. Public Health 2021, 18, 7346. [Google Scholar] [CrossRef] [PubMed]
- Razavian, N.; Blecker, S.; Schmidt, A.M.; Smith-McLallen, A.; Nigam, S.; Sontag, D. Population-Level Prediction of Type 2 Diabetes From Claims Data and Analysis of Risk Factors. Big Data 2015, 3, 277–287. [Google Scholar] [CrossRef]
- Maniruzzaman, M.; Rahman, M.J.; Ahammed, B.; Abedin, M.M. Classification and prediction of diabetes disease using machine learning paradigm. Health Inf. Sci. Syst. 2020, 8, 1–14. [Google Scholar] [CrossRef] [PubMed]
- Oikonomou, E.K.; Khera, R. Machine learning in precision diabetes care and cardiovascular risk prediction. Cardiovasc. Diabetol. 2023, 22, 259. [Google Scholar] [CrossRef]
- Dagliati, A.; Marini, S.; Sacchi, L.; Cogni, G.; Teliti, M.; Tibollo, V.; De Cata, P.; Chiovato, L.; Bellazzi, R. Machine Learning Methods to Predict Diabetes Complications. J. Diabetes Sci. Technol. 2017, 12, 295–302. [Google Scholar] [CrossRef] [PubMed]
- Teboul, A. Diabetes Health Indicators Dataset. Kaggle, 2021. Available online: https://www.kaggle.com/datasets/julnazz/diabetes-health-indicators-dataset (accessed on 27 January 2024).
- Whig, P.; Gupta, K.; Jiwani, N.; Jupalle, H.; Kouser, S.; Alam, N. A novel method for diabetes classification and prediction with PyCaret. Microsyst. Technol. 2023, 29, 1479–1487. [Google Scholar] [CrossRef]
- Kha, Q.H.; Le, V.H.; Hung, T.N.K.; Nguyen, N.T.K.; Le, N.Q.K. Development and Validation of an Explainable Machine Learning-Based Prediction Model for Drug–Food Interactions from Chemical Structures. Sensors 2023, 23, 3962. [Google Scholar] [CrossRef]
- Yuan, Q.; Chen, K.; Yu, Y.; Le, N.Q.K.; Chua, M.C.H. Prediction of anticancer peptides based on an ensemble model of deep learning and machine learning using ordinal positional encoding. Briefings Bioinform. 2023, 24, bbac630. [Google Scholar] [CrossRef]
- Abraham, A.; Jose, R.; Ahmad, J.; Joshi, J.; Jacob, T.; Khalid, A.U.R.; Ali, H.; Patel, P.; Singh, J.; Toma, M. Comparative Analysis of Machine Learning Models for Image Detection of Colonic Polyps vs. Resected Polyps. J. Imaging 2023, 9, 215. [Google Scholar] [CrossRef] [PubMed]
- Dane, S. Behavioral Risk Factor Surveillance System from Centers for Disease Control and Prevention. Kaggle, 2017. Available online: https://www.kaggle.com/datasets/cdc/behavioral-risk-factor-surveillance-system (accessed on 27 January 2024).
- John Clore, K.C. Diabetes 130-US Hospitals for Years 1999–2008. 2014. Available online: https://archive.ics.uci.edu/dataset/296/diabetes+130-us+hospitals+for+years+1999-2008 (accessed on 4 February 2024).
- Strack, B.; DeShazo, J.P.; Gennings, C.; Olmo, J.L.; Ventura, S.; Cios, K.J.; Clore, J.N. Impact of HbA1c Measurement on Hospital Readmission Rates: Analysis of 70,000 Clinical Database Patient Records. BioMed Res. Int. 2014, 2014, 781670. [Google Scholar] [CrossRef] [PubMed]
- Shariq, O.A.; McKenzie, T.J. Obesity-related hypertension: A review of pathophysiology, management, and the role of metabolic surgery. Gland Surg. 2020, 9, 80–93. [Google Scholar] [CrossRef] [PubMed]
- Pakhare, M.; Anjankar, A. Critical Correlation Between Obesity and Cardiovascular Diseases and Recent Advancements in Obesity. Cureus 2024, 16, e51681. [Google Scholar] [CrossRef] [PubMed]
- Yan, Z.; Cai, M.; Han, X.; Chen, Q.; Lu, H. The Interaction Between Age and Risk Factors for Diabetes and Prediabetes: A Community-Based Cross-Sectional Study. Diabetes Metab. Syndr. Obes. 2023, 16, 85–93. [Google Scholar] [CrossRef]
- Besseling, J.; Kastelein, J.J.P.; Defesche, J.C.; Hutten, B.A.; Hovingh, G.K. Association Between Familial Hypercholesterolemia and Prevalence of Type 2 Diabetes Mellitus. JAMA 2015, 313, 1029. [Google Scholar] [CrossRef]
- Toma, M.; Wei, O.C. Predictive Modeling in Medicine. Encyclopedia 2023, 3, 590–601. [Google Scholar] [CrossRef]
- Bekbolatova, M.; Mayer, J.; Ong, C.W.; Toma, M. Transformative Potential of AI in Healthcare: Definitions, Applications, and Navigating the Ethical Landscape and Public Perspectives. Healthcare 2024, 12, 125. [Google Scholar] [CrossRef]

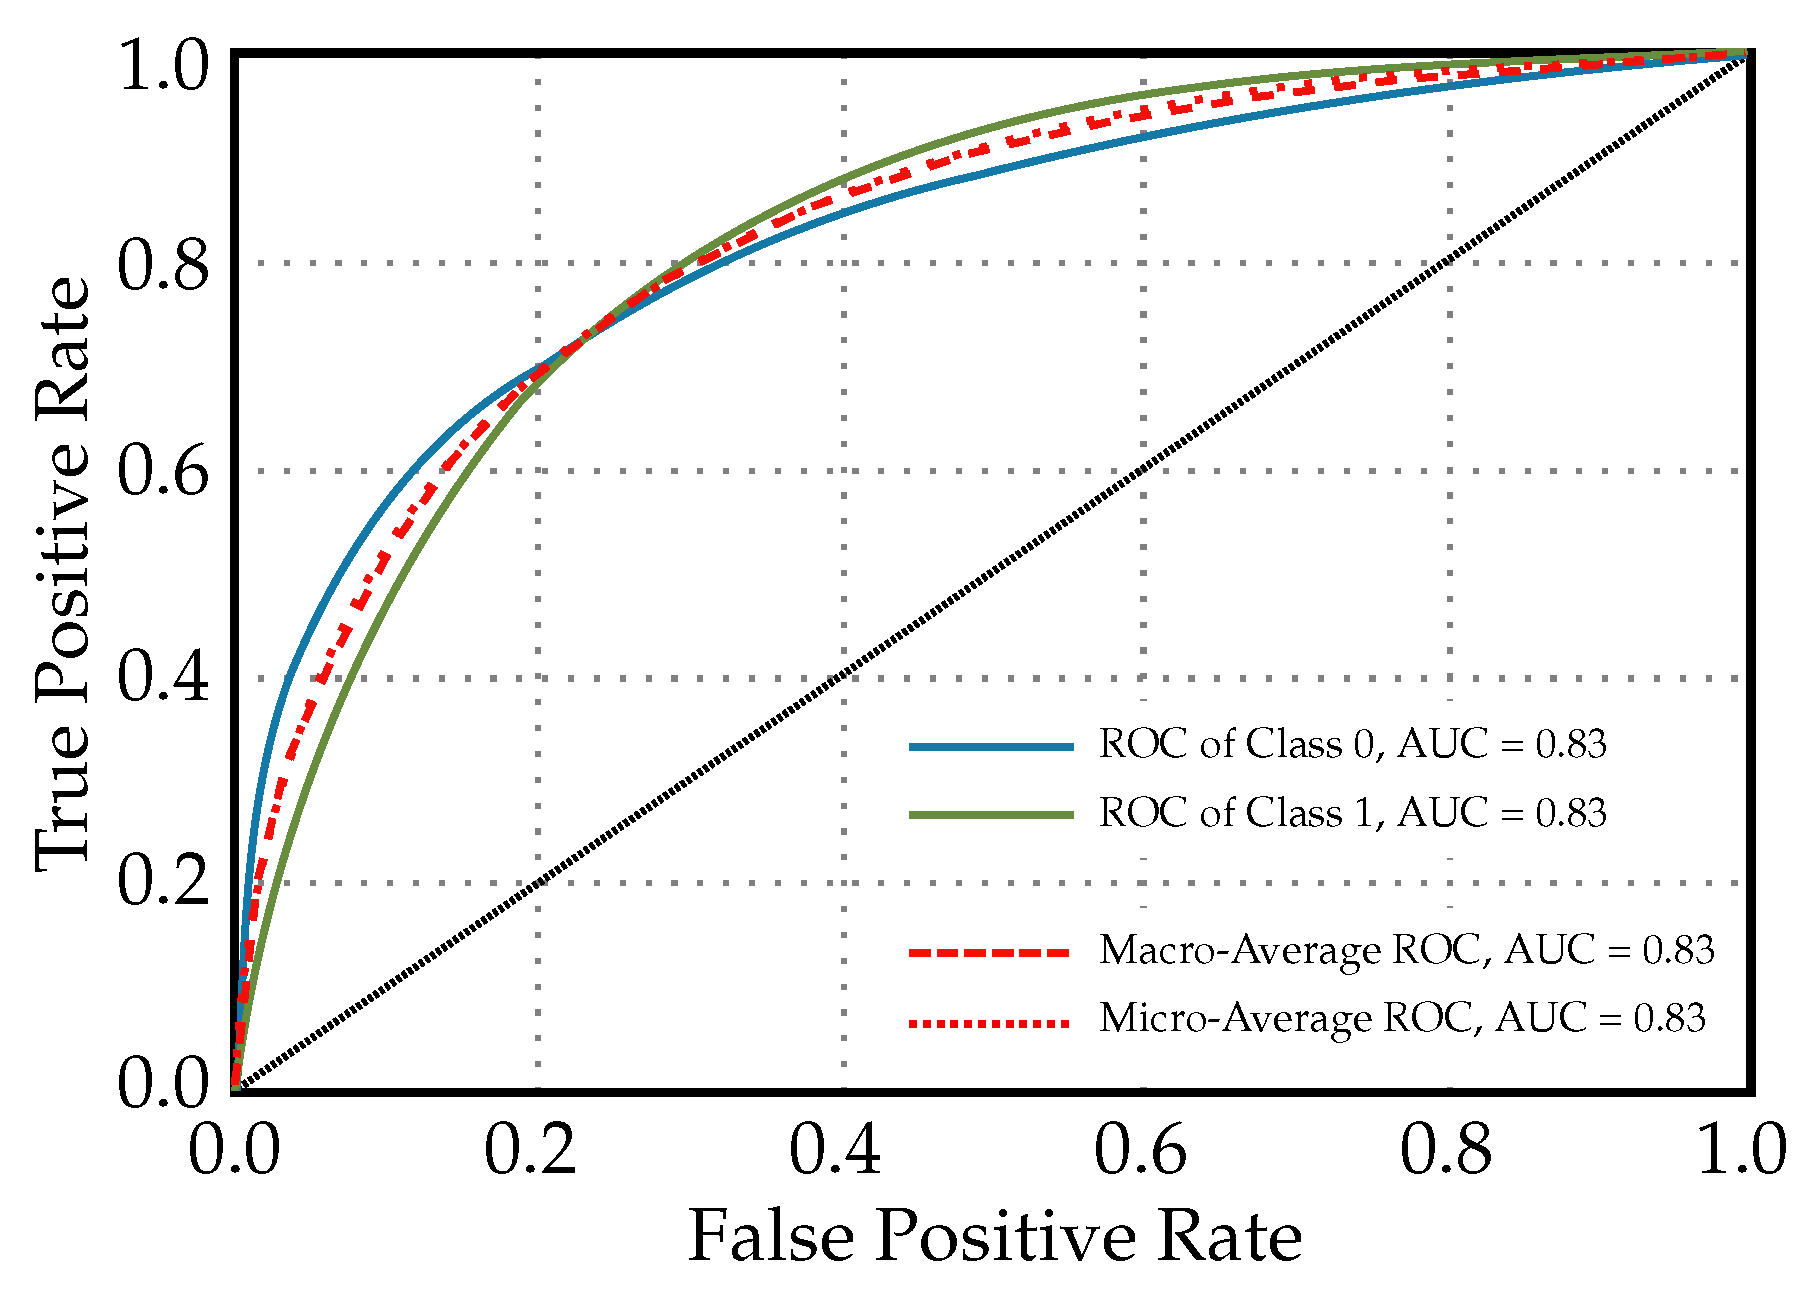
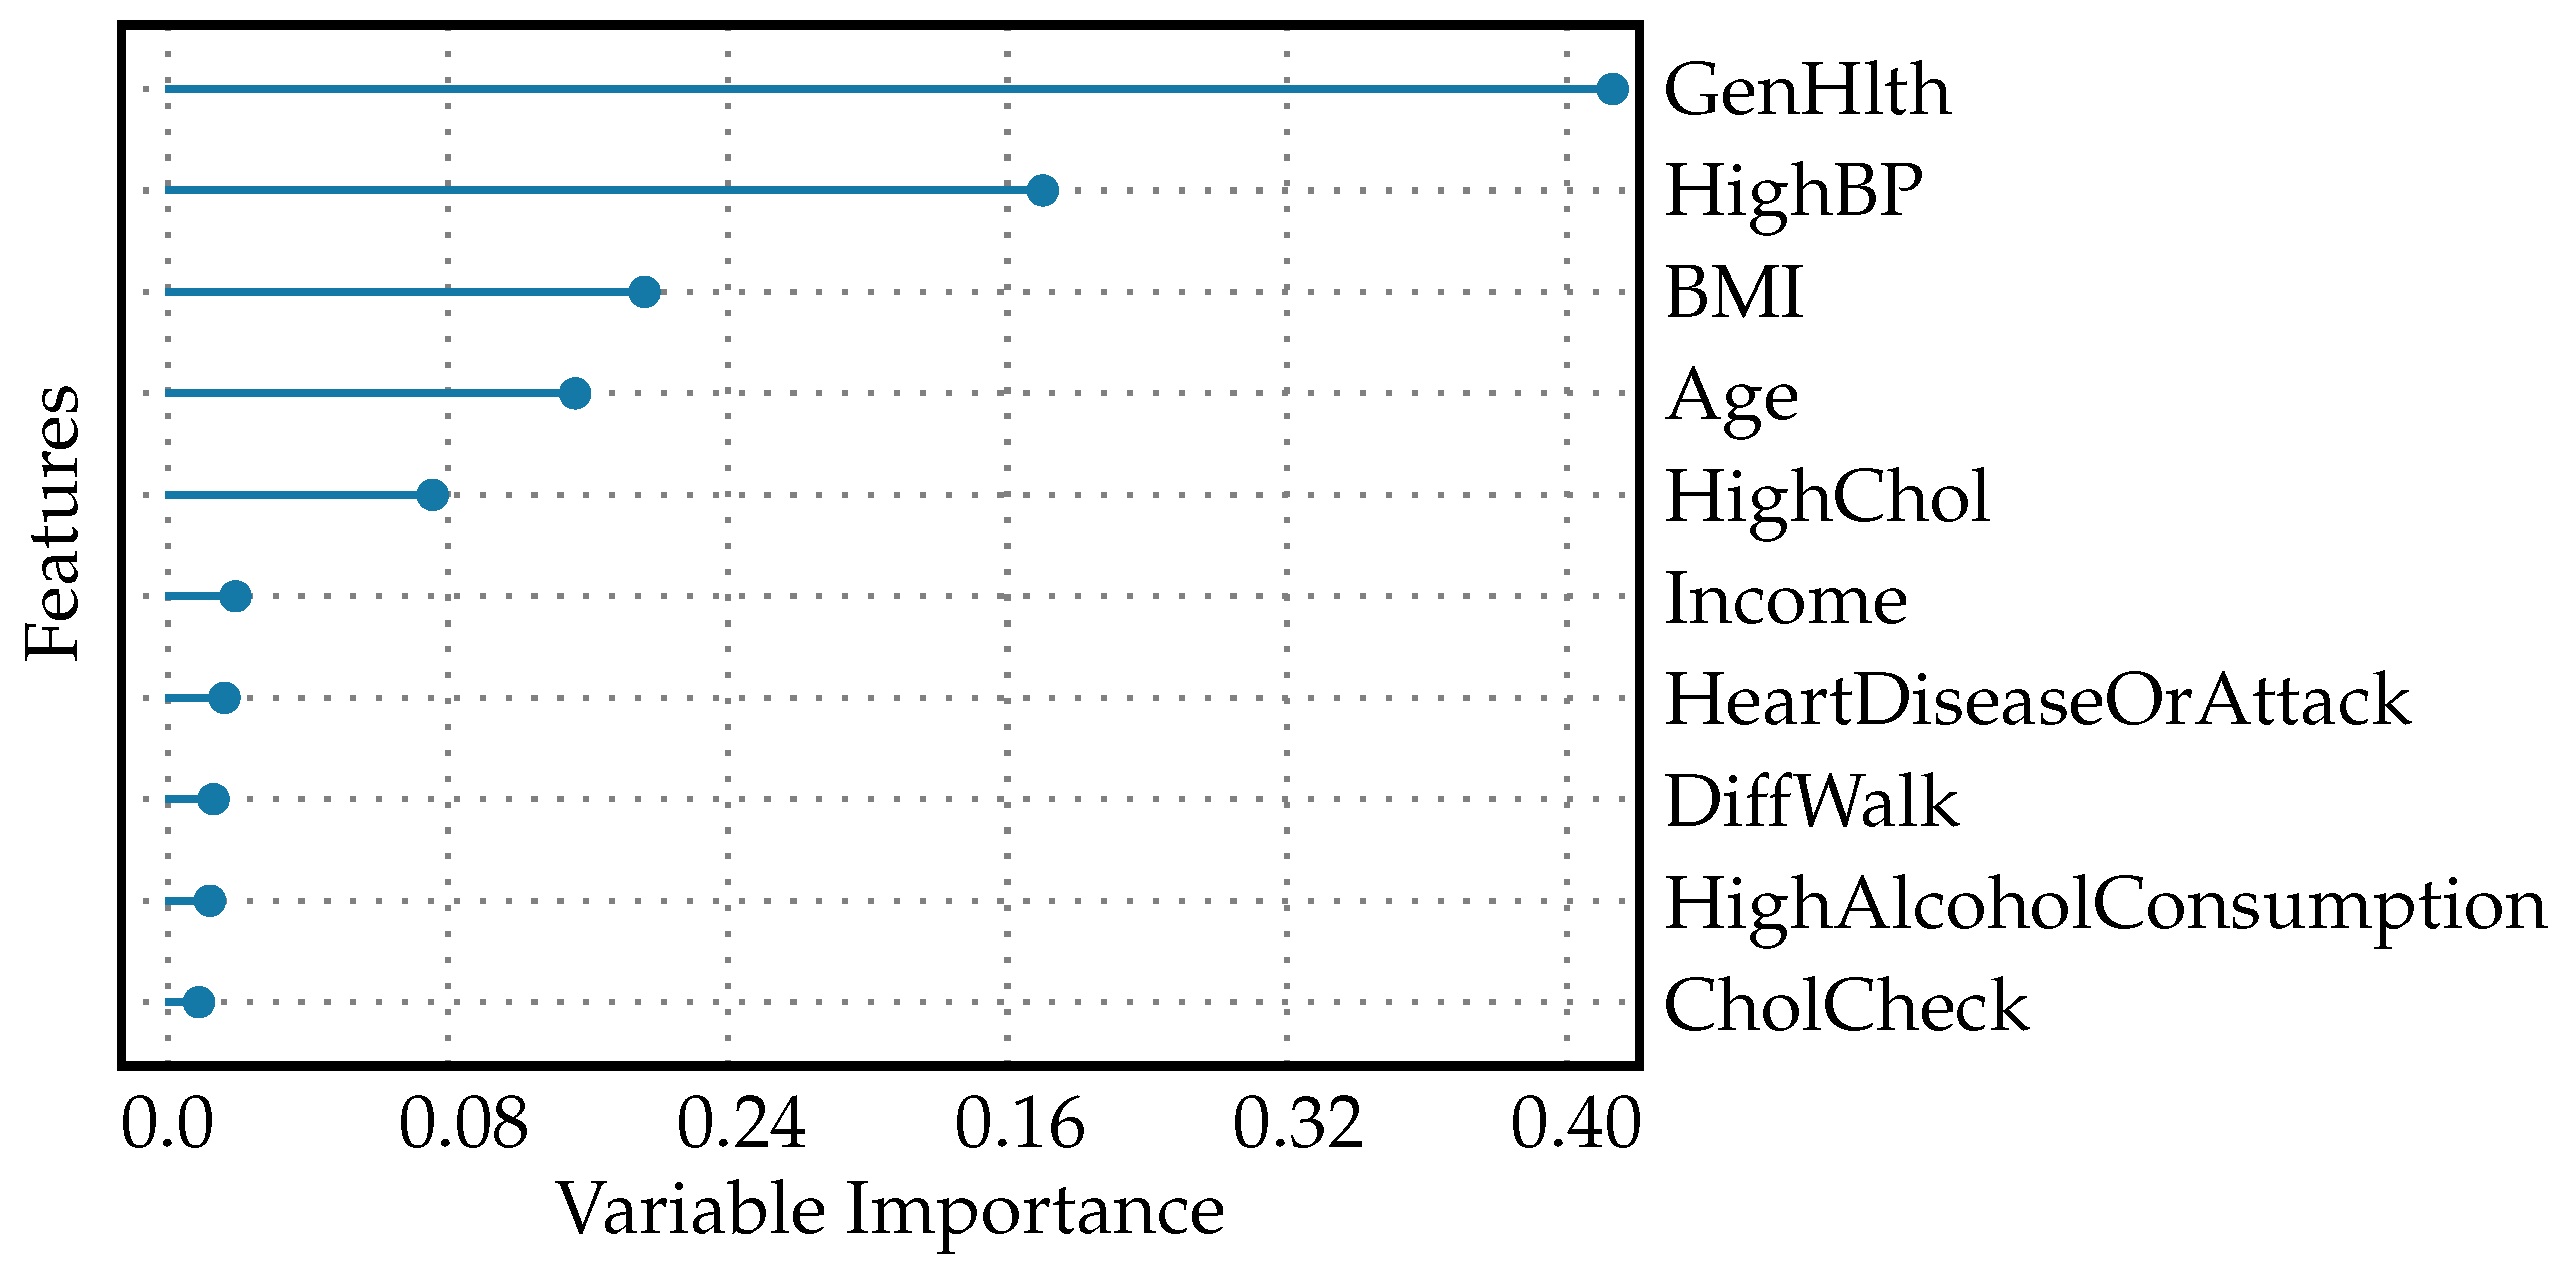
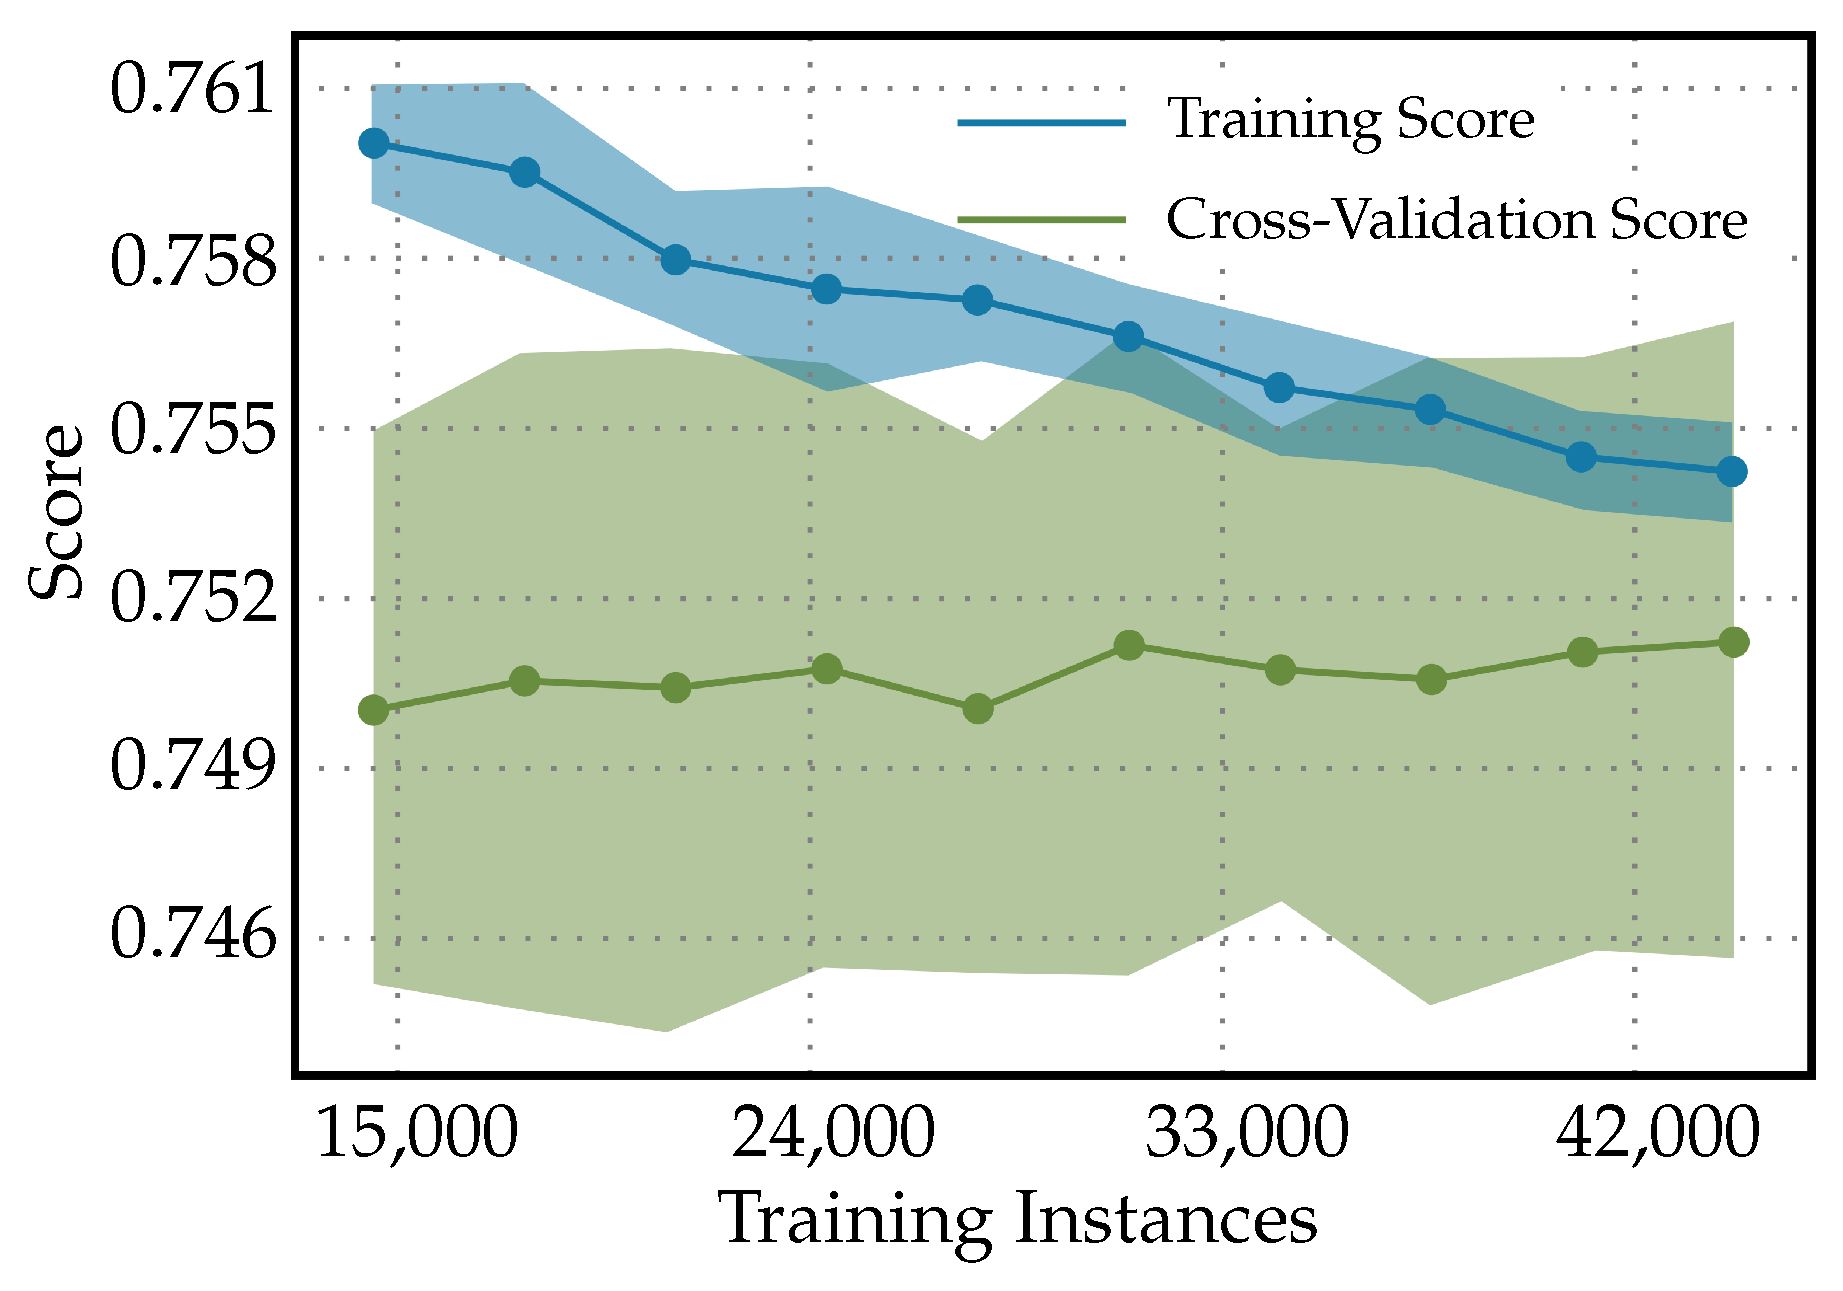
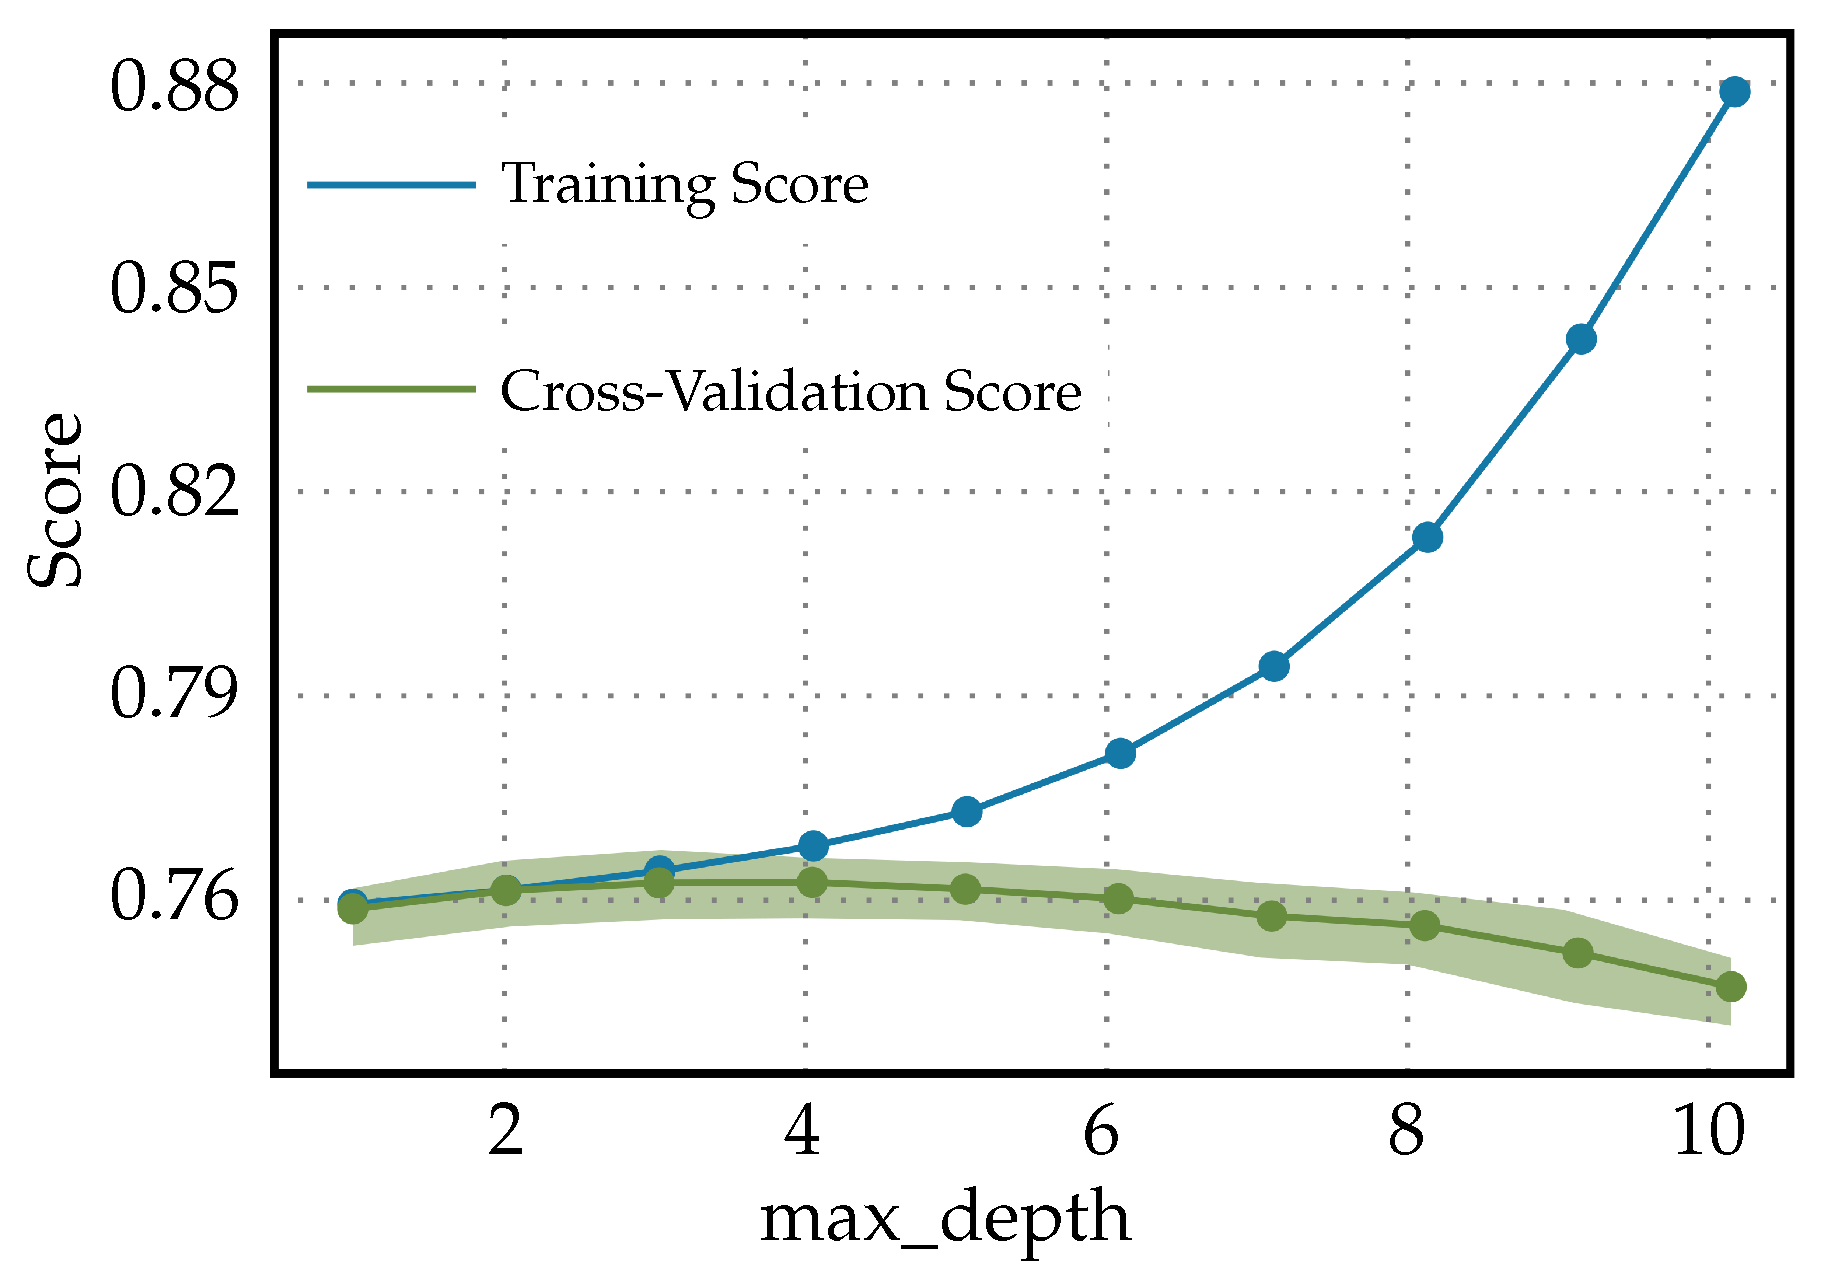
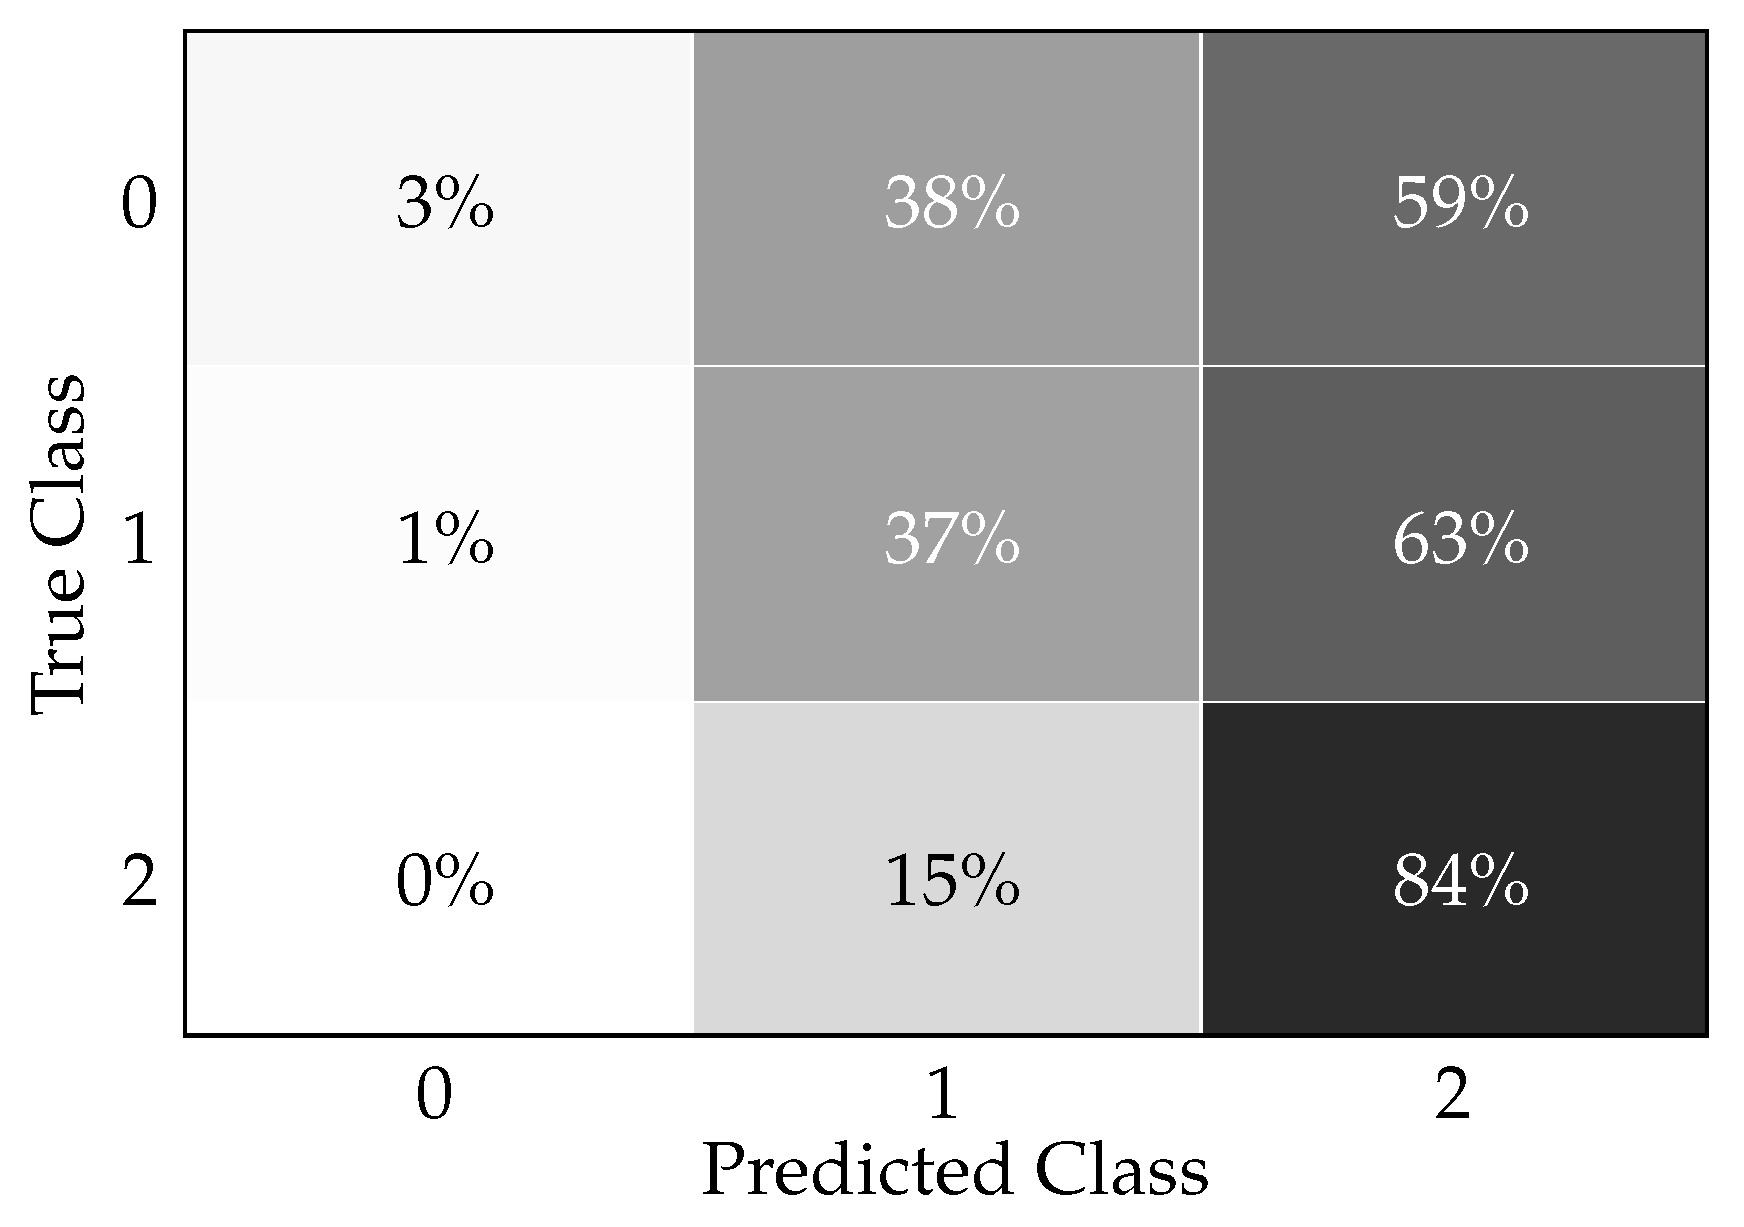


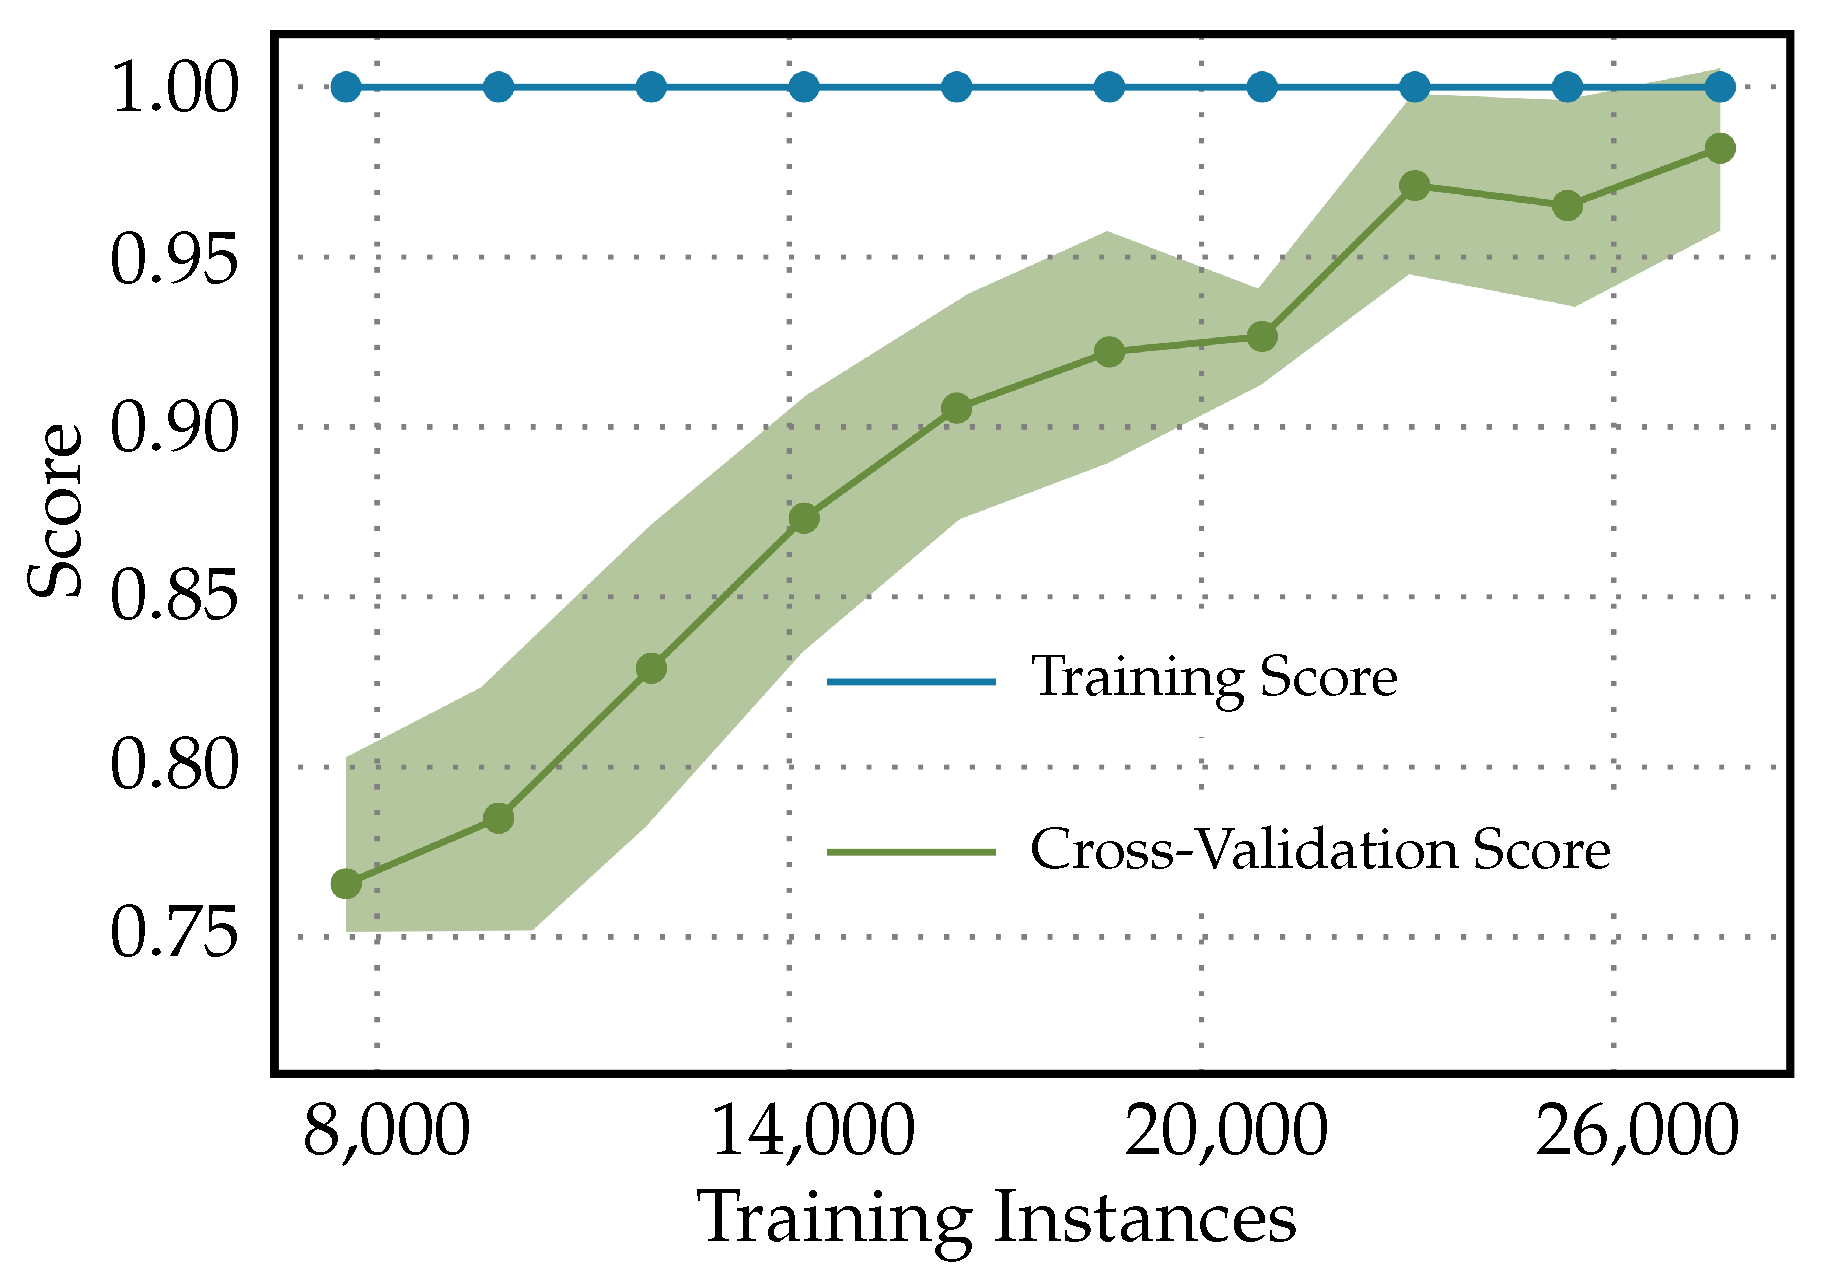
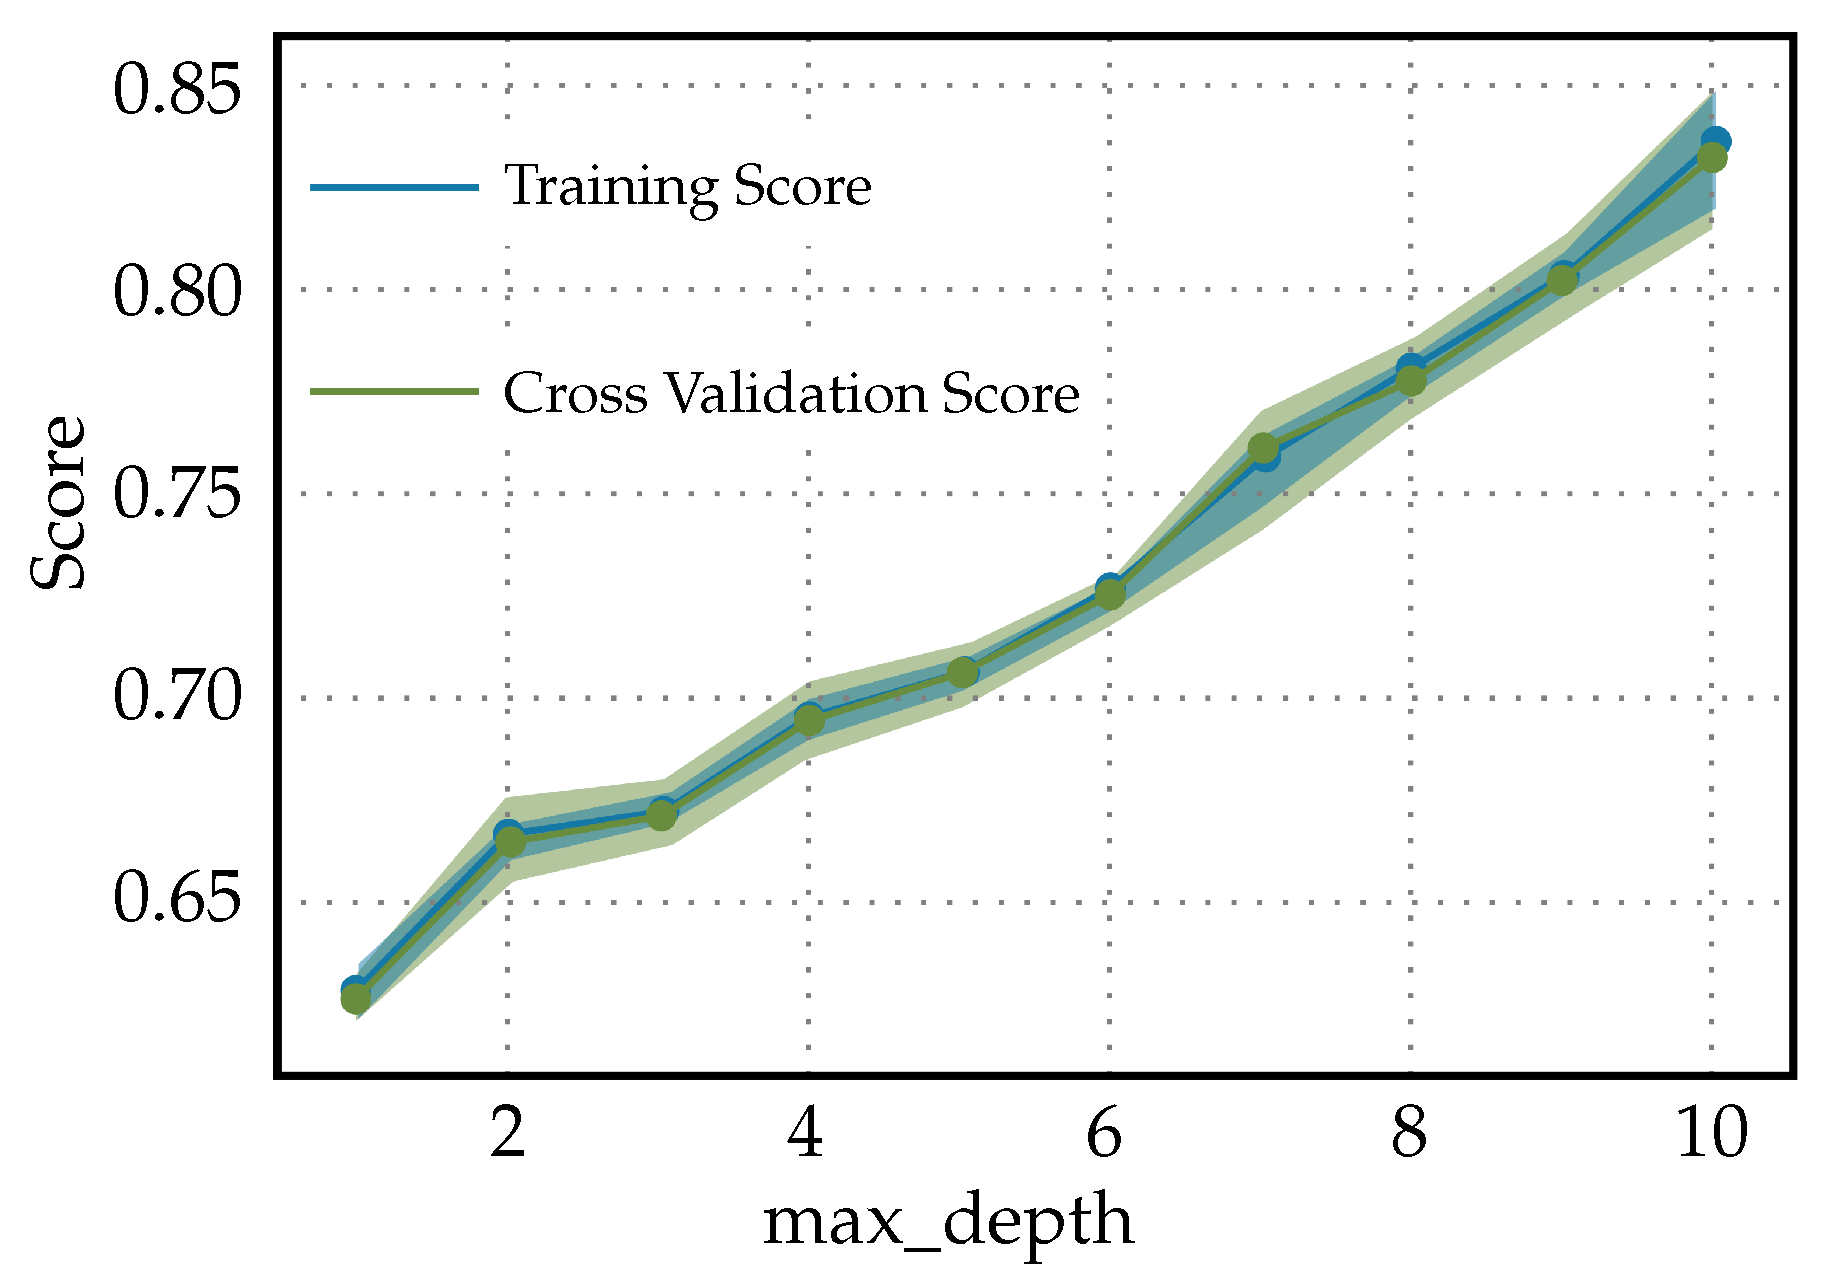
Disclaimer/Publisher’s Note: The statements, opinions and data contained in all publications are solely those of the individual author(s) and contributor(s) and not of MDPI and/or the editor(s). MDPI and/or the editor(s) disclaim responsibility for any injury to people or property resulting from any ideas, methods, instructions or products referred to in the content. |
© 2024 by the authors. Licensee MDPI, Basel, Switzerland. This article is an open access article distributed under the terms and conditions of the Creative Commons Attribution (CC BY) license (https://creativecommons.org/licenses/by/4.0/).