Abstract
Diamond-like carbon (DLC) has attracted much attention due to its unique properties such as high chemical inertness, optical transparency, and high biocompatibility. In this study, the total gas flow rate was kept constant, while the ratio of reactive gases was varied to deposit nitrogen-doped diamond-like carbon thin films on glass substrates using radiofrequency plasma-enhanced chemical vapor deposition. The effects of the gas flow ratio on the composition, microstructure, surface morphology, and optical properties of the thin films were investigated through extended deposition times. It was found that with an increase in the nitrogen-to-methane gas flow ratio, the film surface became smoother and more compact. The maximum transmittance in the visible range reached 90%, and the highest and lowest transmittance in the same ultraviolet wavelength region differed by up to 25.62% among several sample groups. The optical bandgap decreased from 3.58 eV to 3.46 eV, contrary to the trend of the sp2 fraction variation. Compared with other studies, this study considered the preparation of nitrogen-doped diamondoids using a chemical vapor deposition method with a lesser total gas flow rate passed into it, which provides practical data reference value for the preparation of N-DLC.
1. Introduction
Diamond-like carbon (DLC) is a general term for amorphous carbon consisting of sp2 and sp3 carbon–carbon hybrid bonds [1]. According to whether hydrogen-containing diamond-like carbon films are present, they can be divided into two categories: hydrogen-containing diamond-like carbon films (a-C: H) and hydrogen-free diamond-like carbon films (a-C). In addition to carbon atoms with sp3 and sp2 bonds, hydrogen-containing diamond-like films also contain a certain number of hydrogen elements. Hydrogen-free diamond-like carbon films mainly contain carbon atoms with sp3 and sp2 bonds and do not contain hydrogen elements. The unique microstructure of DLC endows it with excellent optical, tribological, mechanical, and biocompatibility properties [2,3,4]. These characteristics provide DLC with broad prospects for applications in fields such as biomedicine, optics, and tribology. Importantly, DLC distinguishes itself from other carbonaceous materials, such as carbon nanotubes and graphene, by obviating the necessity for intricate surface treatments or reliance on metal catalysts during thin film deposition, thereby rendering the process eminently practicable at ambient room temperature.
The methods for preparing diamond-like carbon films can be divided into two categories: physical vapor deposition (PVD) and chemical vapor deposition (CVD). PVD methods mainly include DC magnetron sputtering deposition [5], high-power pulse magnetron sputtering [6], vacuum evaporation method [7], etc. These methods mainly evaporate or sputter carbon source materials into carbon atoms or ions through physical means and then deposit them on a substrate to form diamond-like carbon films. For example, the vacuum evaporation method heats the carbon source material to an evaporative state, and carbon atoms are deposited on the substrate to form a thin film during the evaporation process. The sputtering rule involves using high-energy ions to bombard carbon source materials, causing them to eject carbon atoms or ions, and then deposit them on the substrate. CVD is currently the most commonly used method for preparing diamond-like carbon films. This method mainly decomposes carbon source gases (such as methane, acetylene, etc.) into carbon atoms through chemical reactions and deposits them on a substrate to form a thin film. According to different reaction conditions, CVD methods can be divided into various types, such as hot-filament chemical vapor deposition (HFCVD) [8], plasma-enhanced chemical vapor deposition (PECVD) [9], and so on. The advantages of chemical vapor deposition methods in preparing DLC thin films can be summarized as follows: the active particles in the plasma (such as ions, electrons, and free radicals) can significantly increase the reaction rate, thereby accelerating the deposition rate of the thin film; DLC thin films prepared by RF-PECVD have advantages such as a smooth surface, high hardness, and structure similar to that of diamonds. At the same time, it has a high sp3 bond content, which helps to improve the mechanical properties and stability of the films; by adjusting process parameters such as RF power, gas flow rate, and reaction chamber pressure, the thickness, structure, and performance of the thin films can be easily controlled to meet different application requirements.
Various metal elements were doped with DLC films in the reported literature to adjust the structure and properties of DLC films. Mohammadinia E. et al. prepared Ni DLC and controlled the Ni content and nanoparticle size by adjusting the power. They analyzed the effect of elemental Ni on the structure and optical properties of diamond-like carbon films and found that the optical bandgap (Eg) decreased from 4.58 eV to 3.66 eV with increasing applied power [10]. Zhou B. et al. controlled Cu content and nanoparticle size by changing the DC current range and analyzed the effects of Cu content changes on the structure, hardness, and optical properties of a film. They found that when the Cu content exceeded 12.6 wt%, the transmittance of the film in the visible near-infrared region was less than 40%. As the Cu content increased, the Eg decreased from 3.54 eV to 0.25 eV [11]. Aslan N. et al. prepared DLC–Ge composite materials to improve the electrical and optoelectronic properties of materials. Through experiments, it was demonstrated that their developed nanocomposite film was responsive to light, and its photosensitivity and photoreactivity increased with an increase in light intensity [12].
In addition to metal doping, non-metals such as Si [13,14,15], F [16], and N [17] are also used to prepare different types of DLC films, which typically exhibit excellent mechanical [18], tribological [19], and chemical properties [1]. Hydrogenated DLC has poor thermal stability and optical properties due to the presence of CH bonds. These properties of N-DLC can be controlled based on the content of nitrogen [20], C sp2, and C sp3. Osanai H. et al. used methane gas as a carbon source, doped nitrogen, and prepared N-DLC thin films using the PECVD method. They studied the effect of annealing temperature after vacuum deposition on the properties of diamond-like carbon films. They found that the optical bandgap increased after annealing at 235 °C and decreased significantly after annealing at 420 °C [21]. Safari R. et al. prepared N-DLC thin films using a mixture of n-hexane and nitrogen gas and atmospheric-pressure DBD plasma deposition technology and studied the effect of deposition time on the films’ structure and optoelectronic properties [22]. The abovementioned publications utilizing chemical vapor deposition methods using gas as a carbon source did not discuss the effect of gas flow rate changes on the optical properties of N-DLC. Discussion on the impact of gas flow rate changes has, so far, focused on the adhesion [23] and tribological properties of diamond-like coatings [24]. To our knowledge, there are currently no reports on the effects of gas flow rate changes under low-flow conditions on the structure and optical properties of diamond-like carbon films using chemical vapor deposition methods.
This article uses a mixed gas of nitrogen and methane as the gas source to prepare N-DLC thin films through RF-PECVD. The effect of the change in the ratio of nitrogen to methane and gas flow rate on optical properties such as film structure, surface morphology, optical band gap, refractive index, etc., under a constant total gas flow rate is studied.
2. Experimental Details
The substrate used in this study was transparent glass, and the reaction gases consisted of high-purity methane (99.99%) and nitrogen (99.99%). Prior to deposition, the substrate was subjected to 10 min of ultrasonic cleaning in distilled water, followed by 15 min of cleaning in ethanol to remove surface impurities. Subsequently, the cleaned substrate was dried in ambient air and then placed into the vacuum chamber.
The fabrication of N-DLC thin films was executed utilizing the RF-PECVD technique. Figure 1 illustrates the experimental setup, whereby a stringent vacuuming process was initiated to reduce the chamber’s pressure to below 9.9 × 10⁻⁴ Pa before introducing the reaction gases. This procedure ensures the purity of the reaction gases. Methane (CH4) and nitrogen (N2) gases were separately introduced into the vacuum chamber, and the set temperature and radiofrequency (RF) power were adjusted accordingly. The vacuum chamber contains two parallel electrode plates with a fixed spacing. The RF power source is connected to the upper electrode plate, while the substrate is placed at the center of the lower electrode plate. When the RF power is applied, an electric field is generated between the two plates, leading to the dissociation of the introduced gases into a plasma state. High-energy electrons in the plasma collide with the gas particles, activating some of them into reactive species. These reactive species are then adsorbed onto the substrate surface, undergoing a series of complex chemical reactions to ultimately form the thin film. For ease of discussion, the different sample groups are assigned designated numerical codes, and the specific parameter settings are detailed in Table 1.
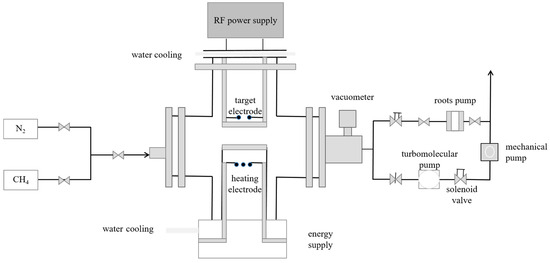
Figure 1.
Schematic diagram of RF-PECVD.

Table 1.
Deposition parameters of DLC films for each sample.
The structural characteristics and chemical bonds of the thin films were investigated using a Raman spectrometer (Lab RAM HR Evo, HORIBA FRANCE SAS, Longjumeau, France) with an excitation wavelength of 633 nm and X-ray photoelectron spectroscopy (XPS, AXIS Supra, AHIMADZU, Kyoto, Japan). The surface and cross-sectional morphology of the N-DLC thin films were observed using a double-beam electron microscope, and the surface morphology and roughness of the samples were analyzed using an atomic force microscope (AFM, *SPM-9700, AHIMADZU, Kyoto, Japan) in dynamic mode. The transmittance and absorbance of the thin films were measured using a UV–Vis–NIR spectrophotometer (AHIMADZU, Kyoto, Japan).
3. Results and Discussion
3.1. Surface Morphology Analysis
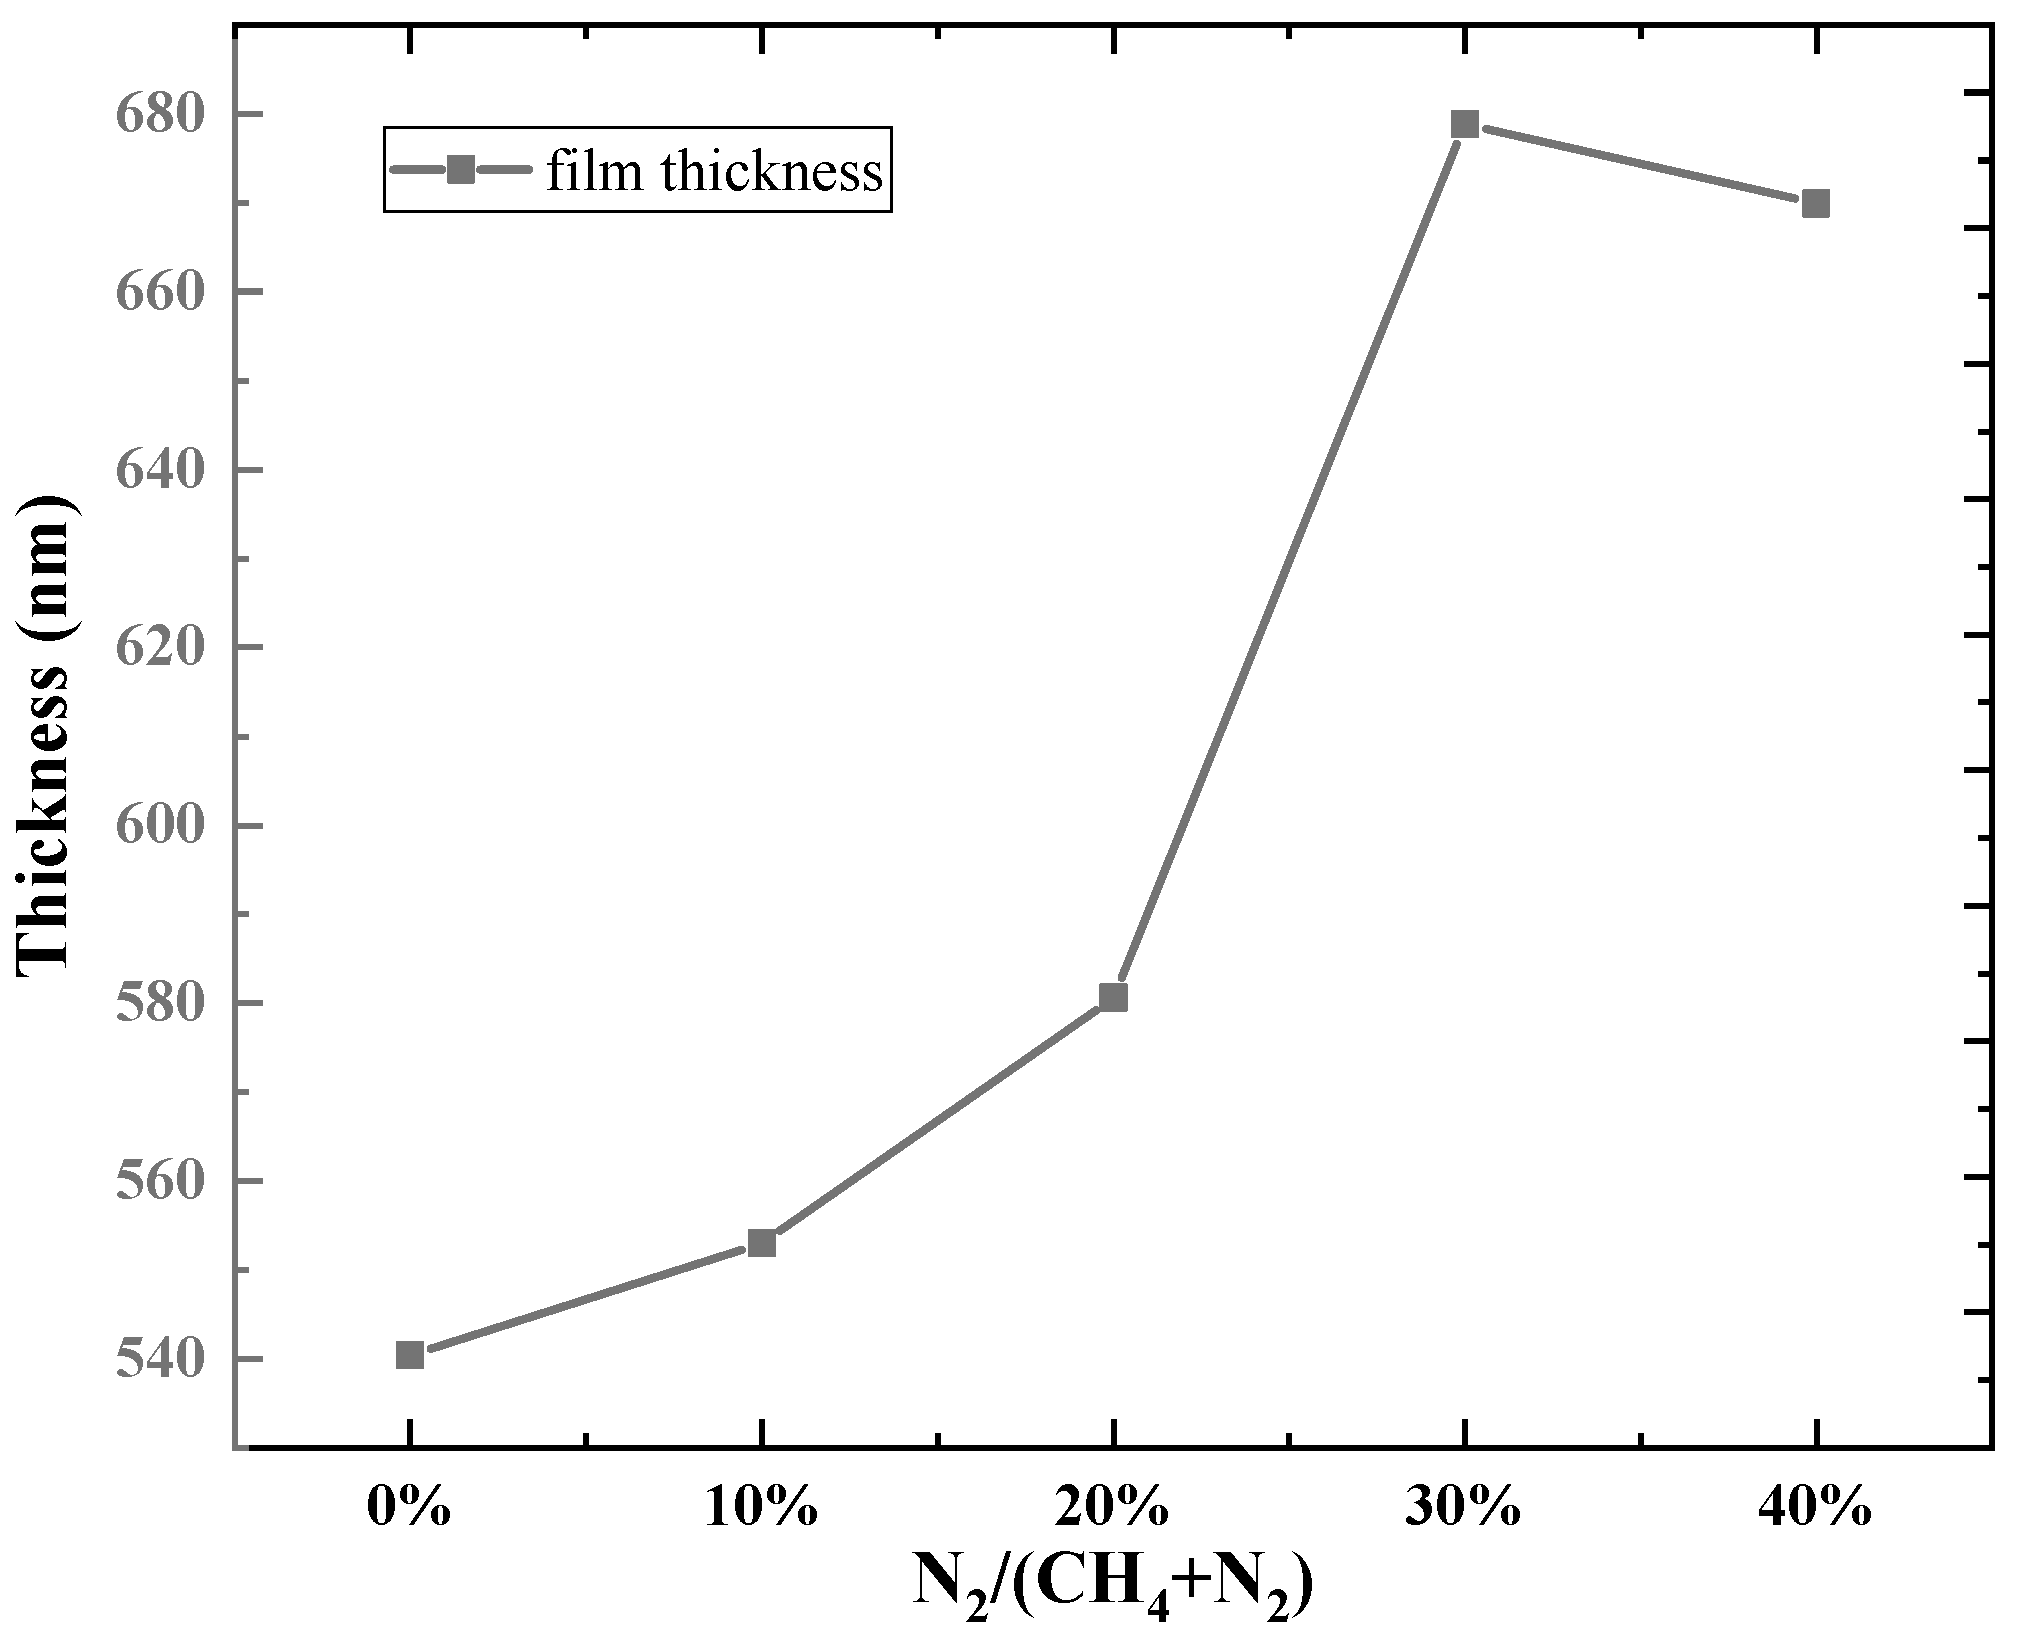
Figure 2 presents the surface morphologies of DLC coatings prepared under varied gas flow ratios. All samples exhibit similar surface morphologies with some cracks. Figure 2a shows the SEM image at a nitrogen flow rate of 0 (sample C2N0), Figure 2b shows the surface morphology at a nitrogen flow rate of 4 sccm (sample C1N4), and Figure 2c shows the surface morphology at a nitrogen flow rate of 6 sccm (sample C1N6). It can be observed that after introducing nitrogen, the number of cracks on the surface of the film decreases. Overall, the addition of nitrogen effectively enhances the compactness of the DLC films. Figure 3 shows the variation in diamond-like carbon films under different nitrogen flow rates. This phenomenon is attributed to a greater incorporation of nitrogen into the amorphous carbon network, which reduces the internal stress at the interface and, thus, promotes film growth [25]. However, as the methane flow rate decreases and relatively excessive nitrogen flow prevails, the film growth rate diminishes.
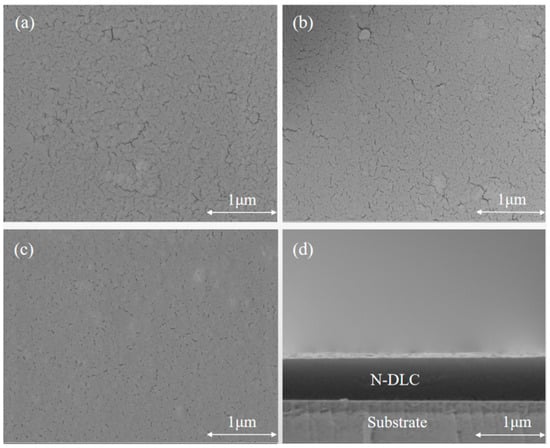
Figure 2.
Surface and cross-sectional morphology of films at different gas flow ratios. (a) simple C2N0; (b) simple C1N4; (c) simple C1N6; (d) cross-sectional of sample C1N6.

Figure 3.
Variation in film thickness with gas flow ratio.
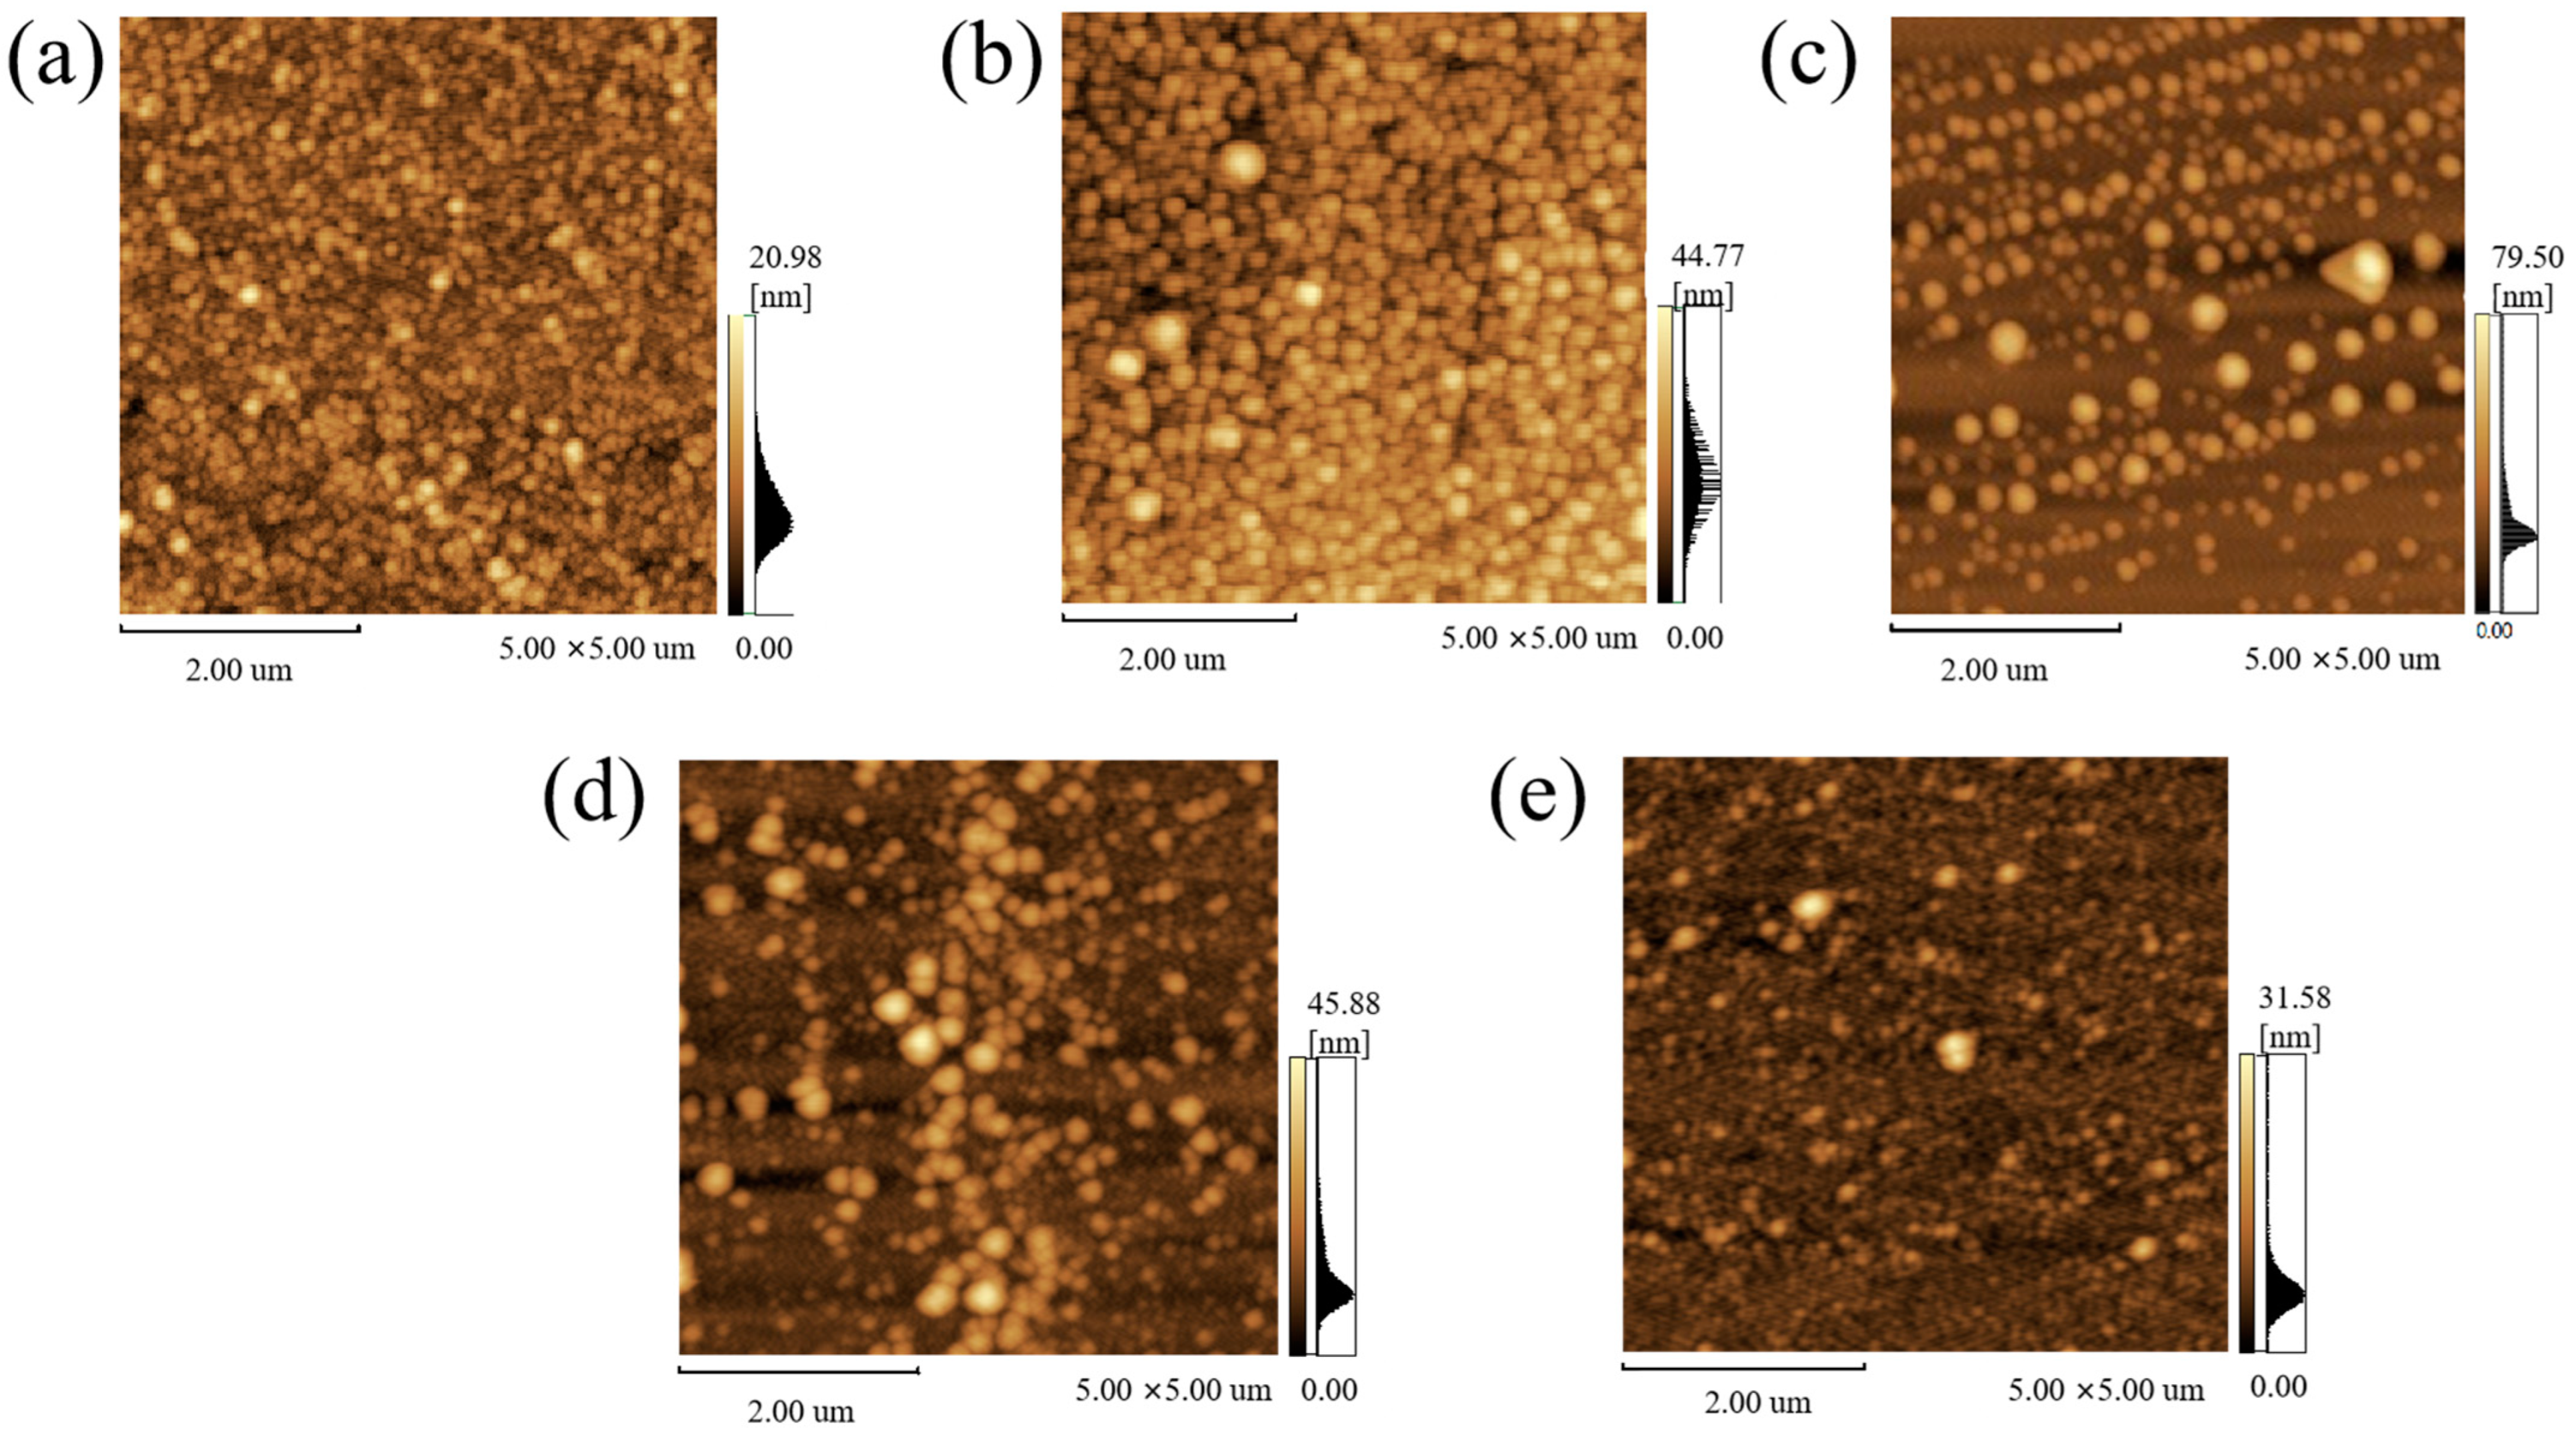
Figure 4 displays AFM images of N-DLC thin films, denoted as (a–e) corresponding to compositions C1N8, C1N6, C1N4, C1N2, and C2N0, respectively. Examination of the images reveals the presence of fine nanoscale particles dispersed across the surfaces of all film samples. Notably, at lower nitrogen flow rates, these nanoparticles tend to agglomerate, resulting in a non-uniform distribution on the film surface. In contrast, as the nitrogen flow rate increases, the nanoparticles disperse more homogeneously and gradually diminish in size, ultimately leading to a uniform surface morphology. Consequently, the N-DLC thin films exhibit smoother and more compact surfaces.
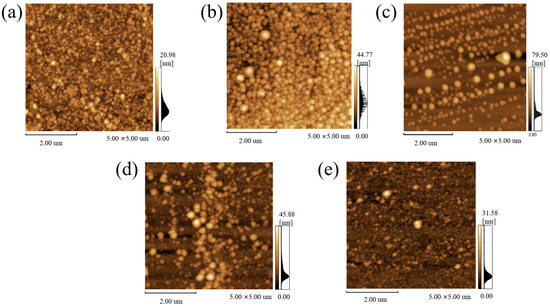
Figure 4.
AFM images of DLC films: (a) C1N8, N2 flow ratio 40%; (b) C1N6, N2 flow ratio 30%; (c) C1N4, N2 flow ratio 20%; (d) C1N2, N2 flow ratio 10%; (e) C2N0, N2 flow ratio 0%.
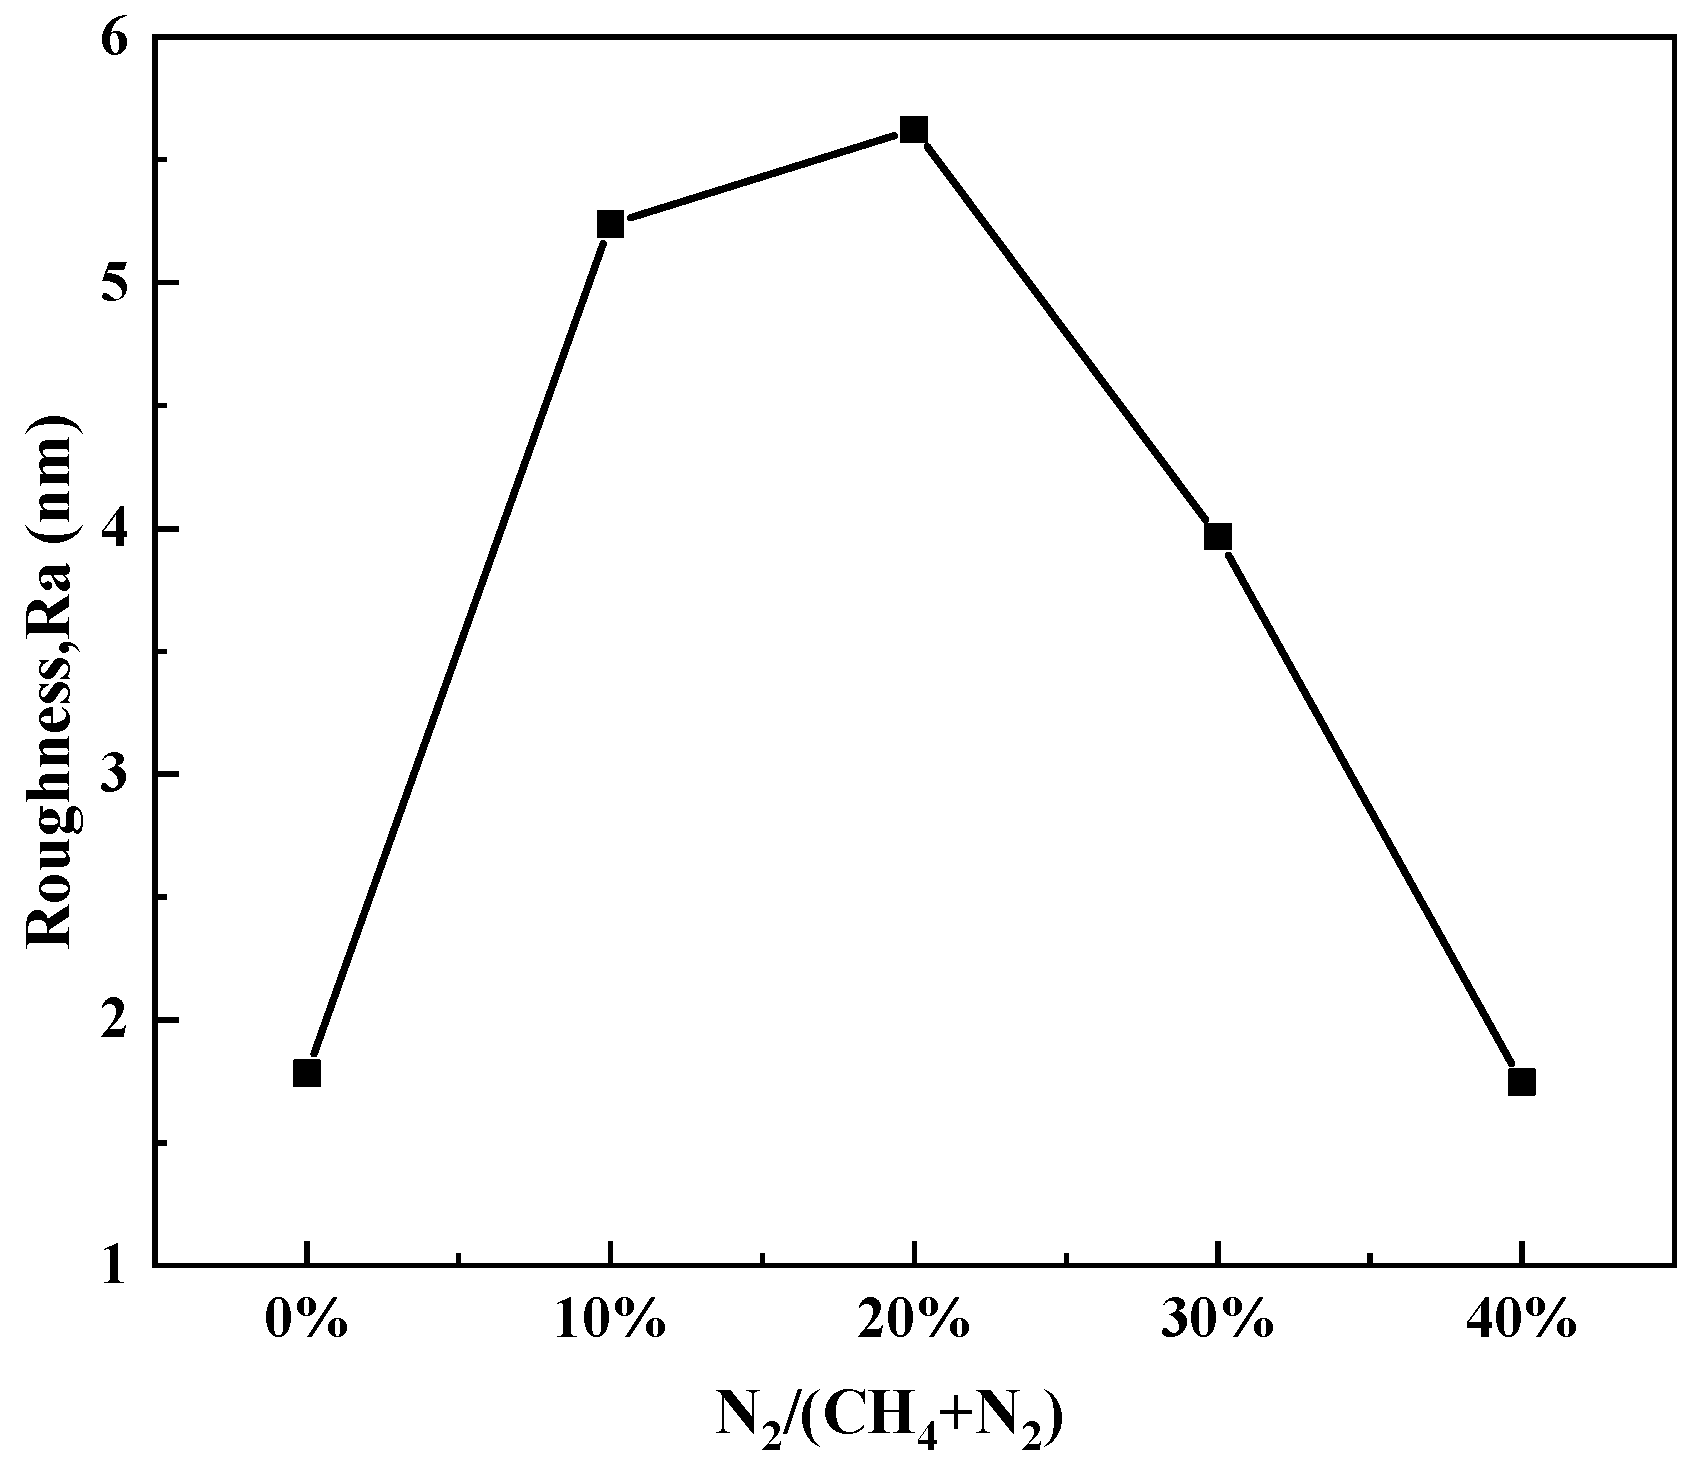
Figure 5 presents the surface roughness variations in the N-DLC thin films. It is evident that Ra initially increases and then decreases with an increasing nitrogen flow rate in the introduced gas. The fluctuations in roughness can be elucidated through the underlying principles governing the thin film deposition process [26]. Upon arrival at the substrate surface, gas-phase atoms experience reflection due to their higher energy levels, while another fraction is adsorbed onto the substrate surface. Adsorbed gas-phase atoms undergo diffusion and migration across the surface, resulting in collisions and coalescence to form small atomic clusters that subsequently condense into clusters on the substrate, leading to increased surface roughness. We can see that when the nitrogen flow rate accounts for 20% of the total gas flow rate, the surface roughness of the sample is the highest. Further increasing the nitrogen flow rate reduces the roughness of the sample, and the addition of more nitrogen elements makes the film smoother.
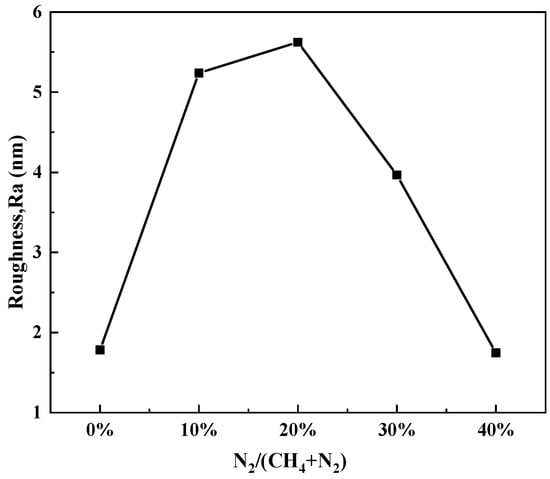
Figure 5.
Variation in N-DLC film surface roughness with gas flow ratio.
3.2. Microstructure Analysis
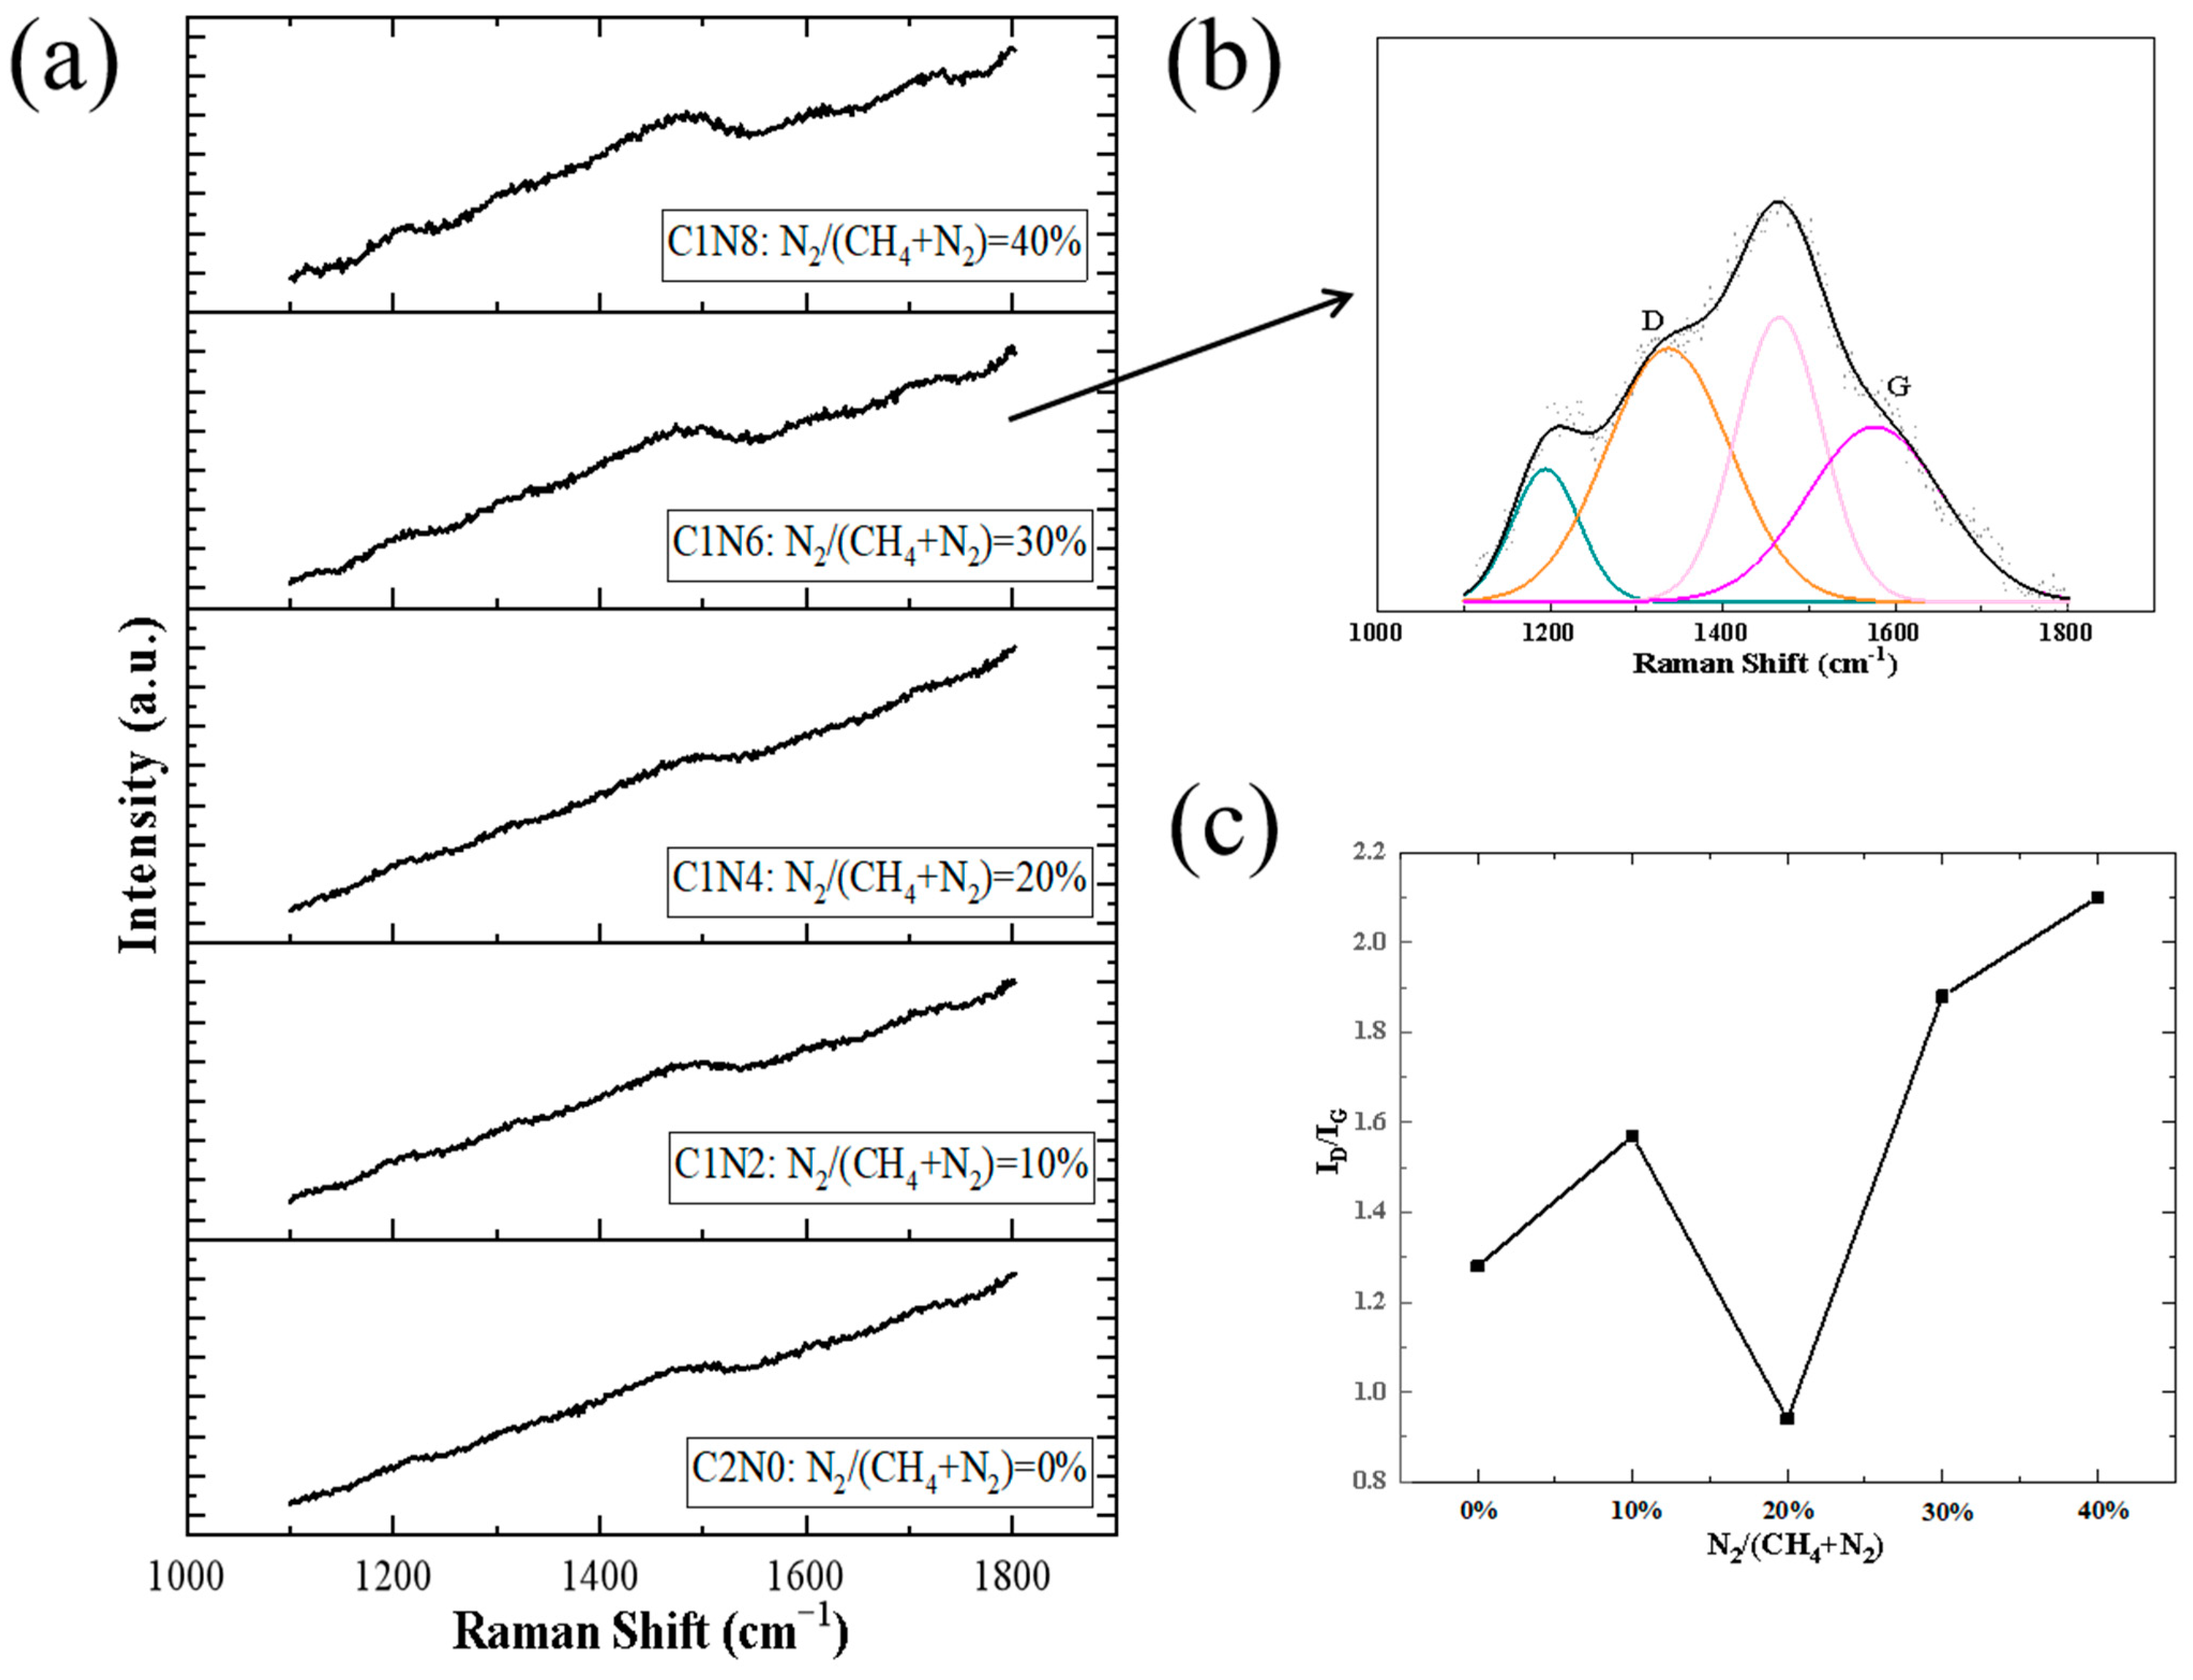
Raman spectroscopy serves as a non-destructive and effective method for obtaining structural information and detecting defects in N-DLC thin films. As described in Andrea C. Ferrari’s article, through Raman spectroscopy, we can obtain a lot of information such as D and G peaks as well as the ratio of sp2 to sp3 [27]. Figure 6a displays the Raman spectra of N-DLC thin films grown under different gas flow ratios. The characteristic peaks of DLC films are observed around 1500 cm−1. In typical Raman spectroscopy studies, two prominent peaks, denoted as the D peak at approximately 1350 cm−1 and the G peak at around 1580 cm−1 [28], are observed. We performed Gaussian–Lorentzian function deconvolution on the Raman curves [29], as depicted in Figure 6b. In this study, in order to make the fitting results more accurate, we chose four specific bands to obtain more accurate fitting results, but the discussion of N-DLC films mainly focuses on the D and G peaks.
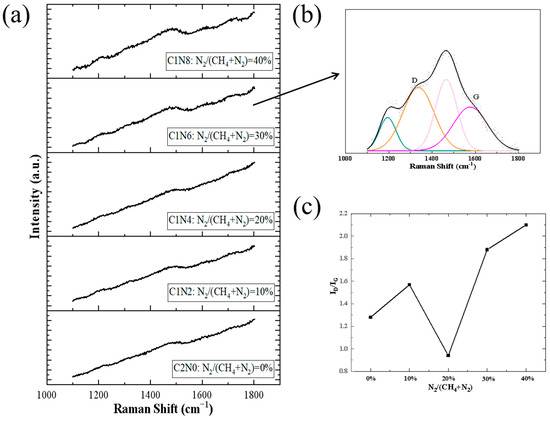
Figure 6.
Raman diagrams of the prepared samples. (a) Raman raw sample image; (b) Raman peak fitting diagram; (c) ID/IG and G-FWHM diagrams.
Regarding the Raman spectra of N-DLC films, the D peak is associated with the breathing mode of sp2 sites, while the G peak is linked to the stretching mode of sp2 sites. From the fitting results in Figure 6c, it can be observed that the width of the G peak initially decreases slightly with increasing nitrogen flow ratio. When the nitrogen flow reaches 20%, the G peak width reaches its maximum and subsequently decreases with further nitrogen flow incrementation. The broadening of the G peak is attributed to the increase in sp3 content within the films [30]. The trend in G peak width variations indicates that the introduction of a certain amount of nitrogen during DLC fabrication can enhance the sp3 content in the films. Previous studies have established an inverse correlation between the C sp3 fraction in the films and the ID/IG ratio [17], where ID/IG represents the intensity ratio of the D peak to that of the G peak. In this study, the ratio of the fitted peak heights was utilized to reflect the peak intensity. Moreover, research by Yang has demonstrated that in N-DLC films, the sp3 phase not only originates from C sp3 but also, within the low nitrogen doping range, the addition of nitrogen atoms leads to an increase in the N sp3 fraction [28]. The nitrogen plasma’s influence prompts N atoms to replace H in C–H bonds, consequently forming C–N bonds [31]. As the methane flow decreases in the introduced gas and the nitrogen flow increases, the rise in ID/IG values signifies a lower sp3 content in the layers [32].
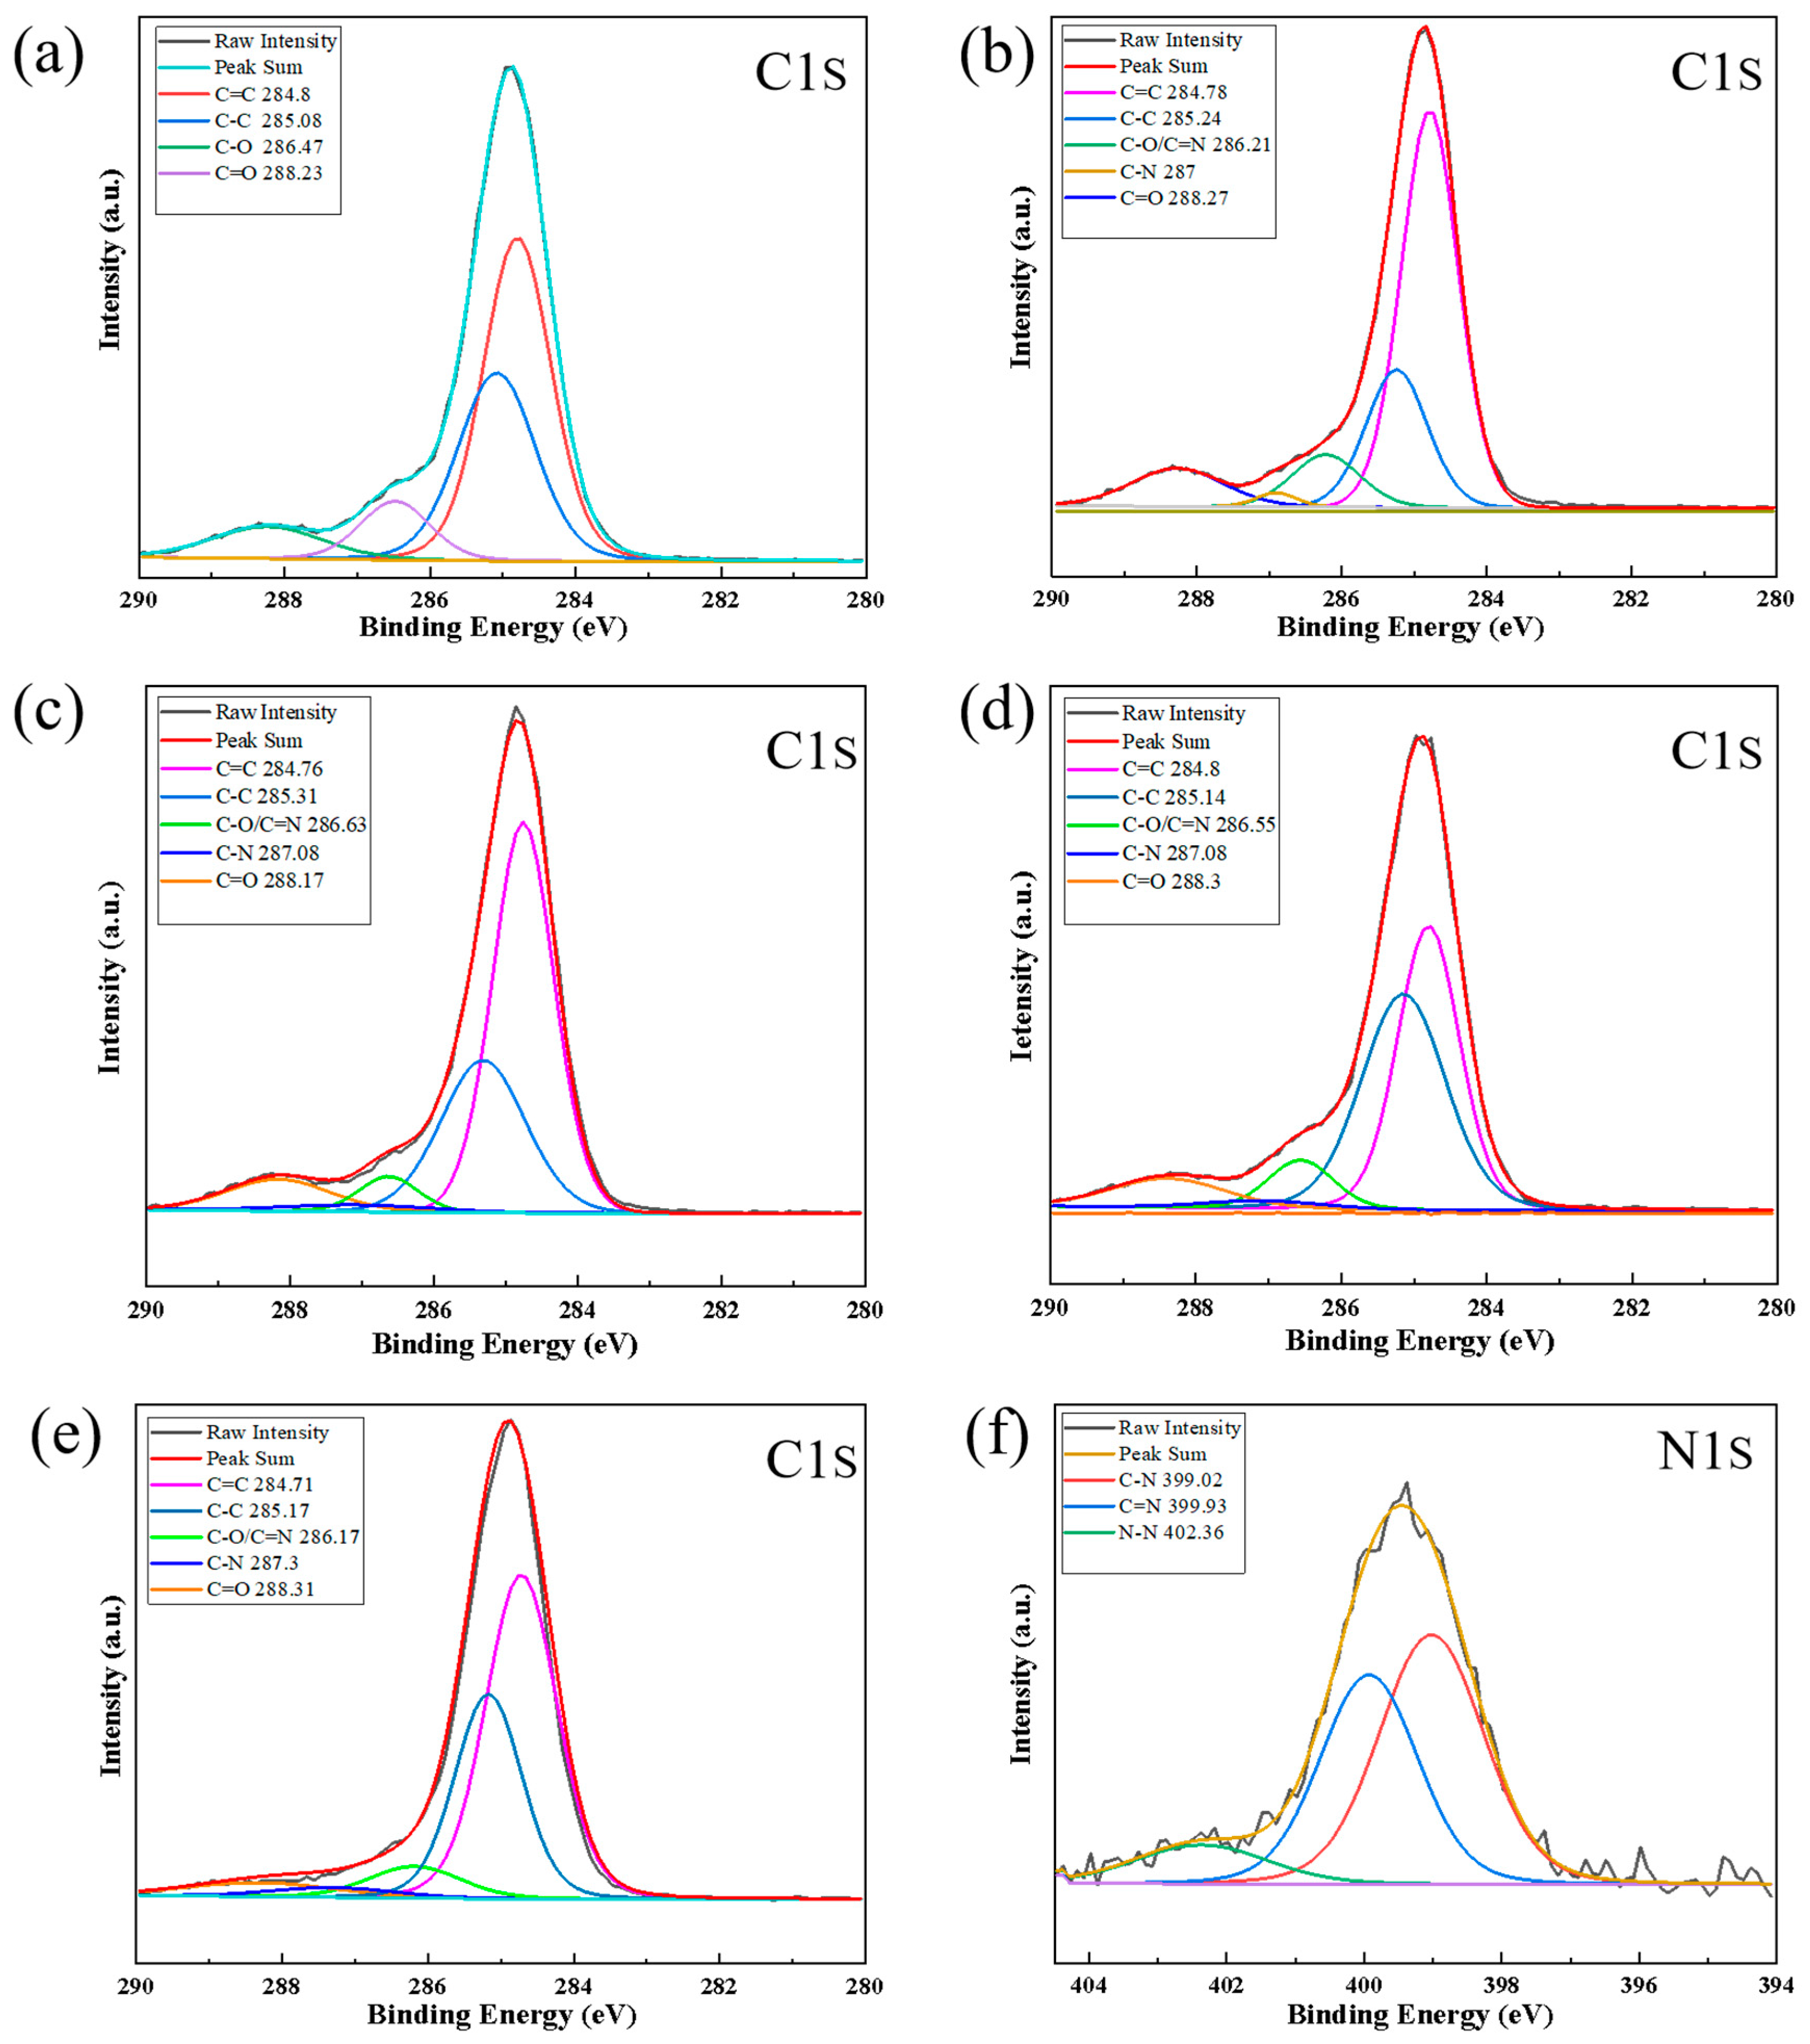
In order to comprehensively investigate the microstructural characteristics of the films, XPS measurements were employed in this study. As shown in Table 2, with an increase in the nitrogen-to-methane gas flow ratio, the relative content of nitrogen measured by XPS also increases, indicating that nitrogen does indeed participate in the carbon network and reacts with it. Lorentzian–Gaussian fitting was performed on the C1s spectra of non-nitrogen-doped DLC films to obtain four different peaks. As depicted in Figure 7a, the peaks at 284.8 eV and 285.08 eV are attributed to the C=C (sp2-C) and C–C (sp3-C) bonds, respectively, while the peaks at 286.47 eV and 288.23 eV correspond to C–O and C=O bonds [28], respectively. For the N-DLC films, Figure 7b–e displays the deconvoluted spectra. The peak at 287.08 eV corresponds to the C–N bond position [33], while the peak at 286.4 eV corresponds to the C–O/C=N position [34]. To gain further insights into the carbon and nitrogen bonding structure, peak fitting was carried out on the N1s spectrum of the C1N4 sample as a representative, as illustrated in Figure 7f. According to Table 2 and Figure 7f, nitrogen and carbon can form C–N and C=N bonds. The sp3 phase is most abundant in the film with an elemental nitrogen content of 2.04%. XPS results show that we successfully doped nitrogen in the DLC film. From Table 3 and Table 4, it can be seen that as the nitrogen flow rate increases, the nitrogen content in the DLC film also increases. sp3 increases first and then decreases with the addition of nitrogen. A slight increase in nitrogen content will promote the formation of sp3 bonds. This is consistent with the Raman analysis.
Table 2.
Some data from XPS N1s spectra of the films.
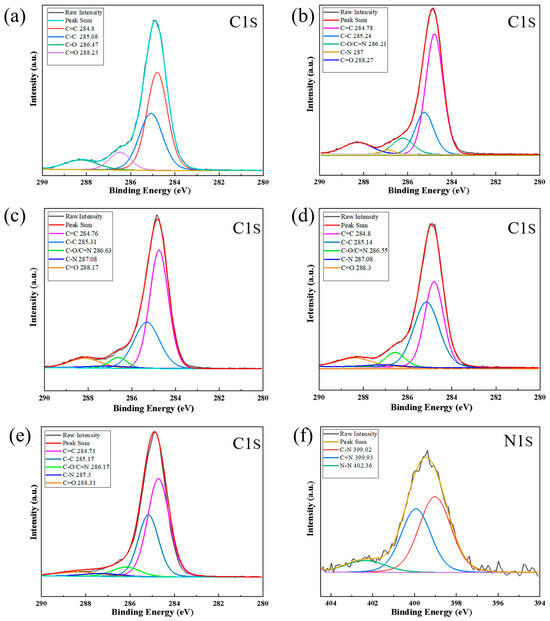
Figure 7.
High-resolution XPS spectra of C1s peaks of the samples: (a) C2N0, N2/(CH4 + N2) = 0; (b) C1N8, N2/(CH4 + N2) = 40%; (c) C1N6, N2/(CH4 + N2) = 30%; (d) C1N4, N2/(CH4 + N2) = 20%; (e) C1N2, N2/(CH4 + N2) = 10%; and high-resolution region spectra of N1s peak of (f) C1N4, N2/(CH4 + N2) = 20%.
Table 3.
Relative content of each element in the sample (at.%).
Table 4.
Some data from XPS C1s spectra of the films.
3.3. Optical Properties
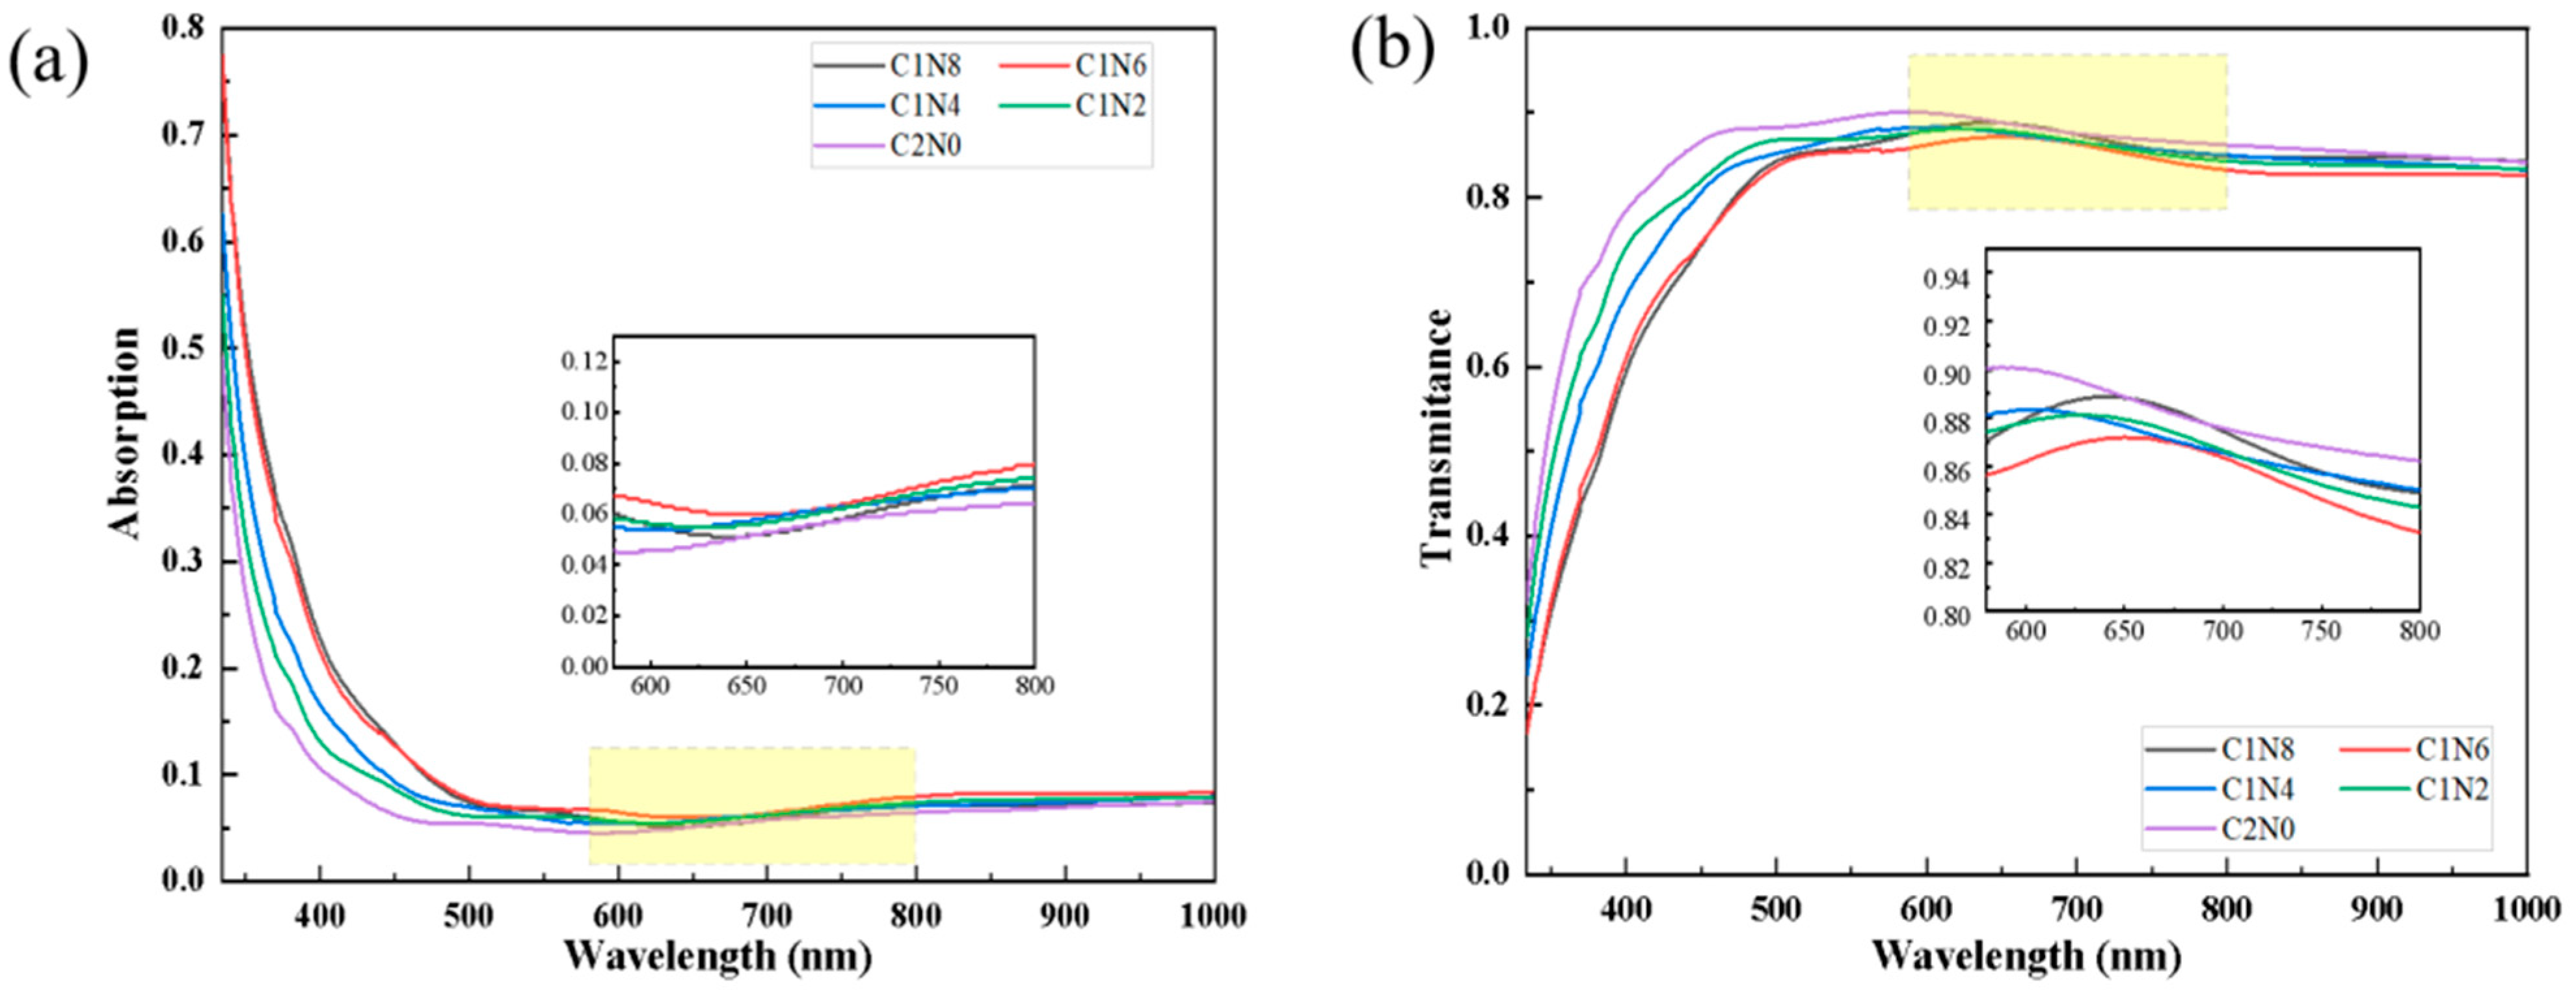
To analyze the optical characteristics, the absorbance and transmittance spectra of the samples were measured using a UV–Vis spectrophotometer. The relationship between transmittance (T), reflectance (R), and absorbance (A) for different nitrogen flow ratios can be expressed as A + R + T = 1, where A represents light absorption, and R and T are the reflectance and transmittance, respectively. Figure 8 presents the spectra of the various sample groups under distinct nitrogen flow ratios. The sample exhibits high transparency in the infrared range. In the ultraviolet and visible-light ranges, as the nitrogen flow rate increases, the light absorption rate also increases. This is likely because the increase in nitrogen flow rate increases the sp2 phase, enhancing the light absorption rate. Moreover, notable variations in transmittance are evident among different sample groups within the same wavelength range. At a wavelength of 368 nm, the difference in ultraviolet transmittance can even reach 25.62%. The optical properties of the N-DLC coatings are influenced by the nitrogen doping and the resulting microstructural changes, contributing to the varied levels of light absorption and transmittance observed in the different sample groups.
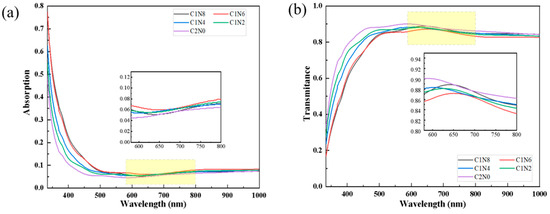
Figure 8.
Absorption and transmittance spectra. (a) The absorption rate of the sample; (b) The transmittance of the sample.
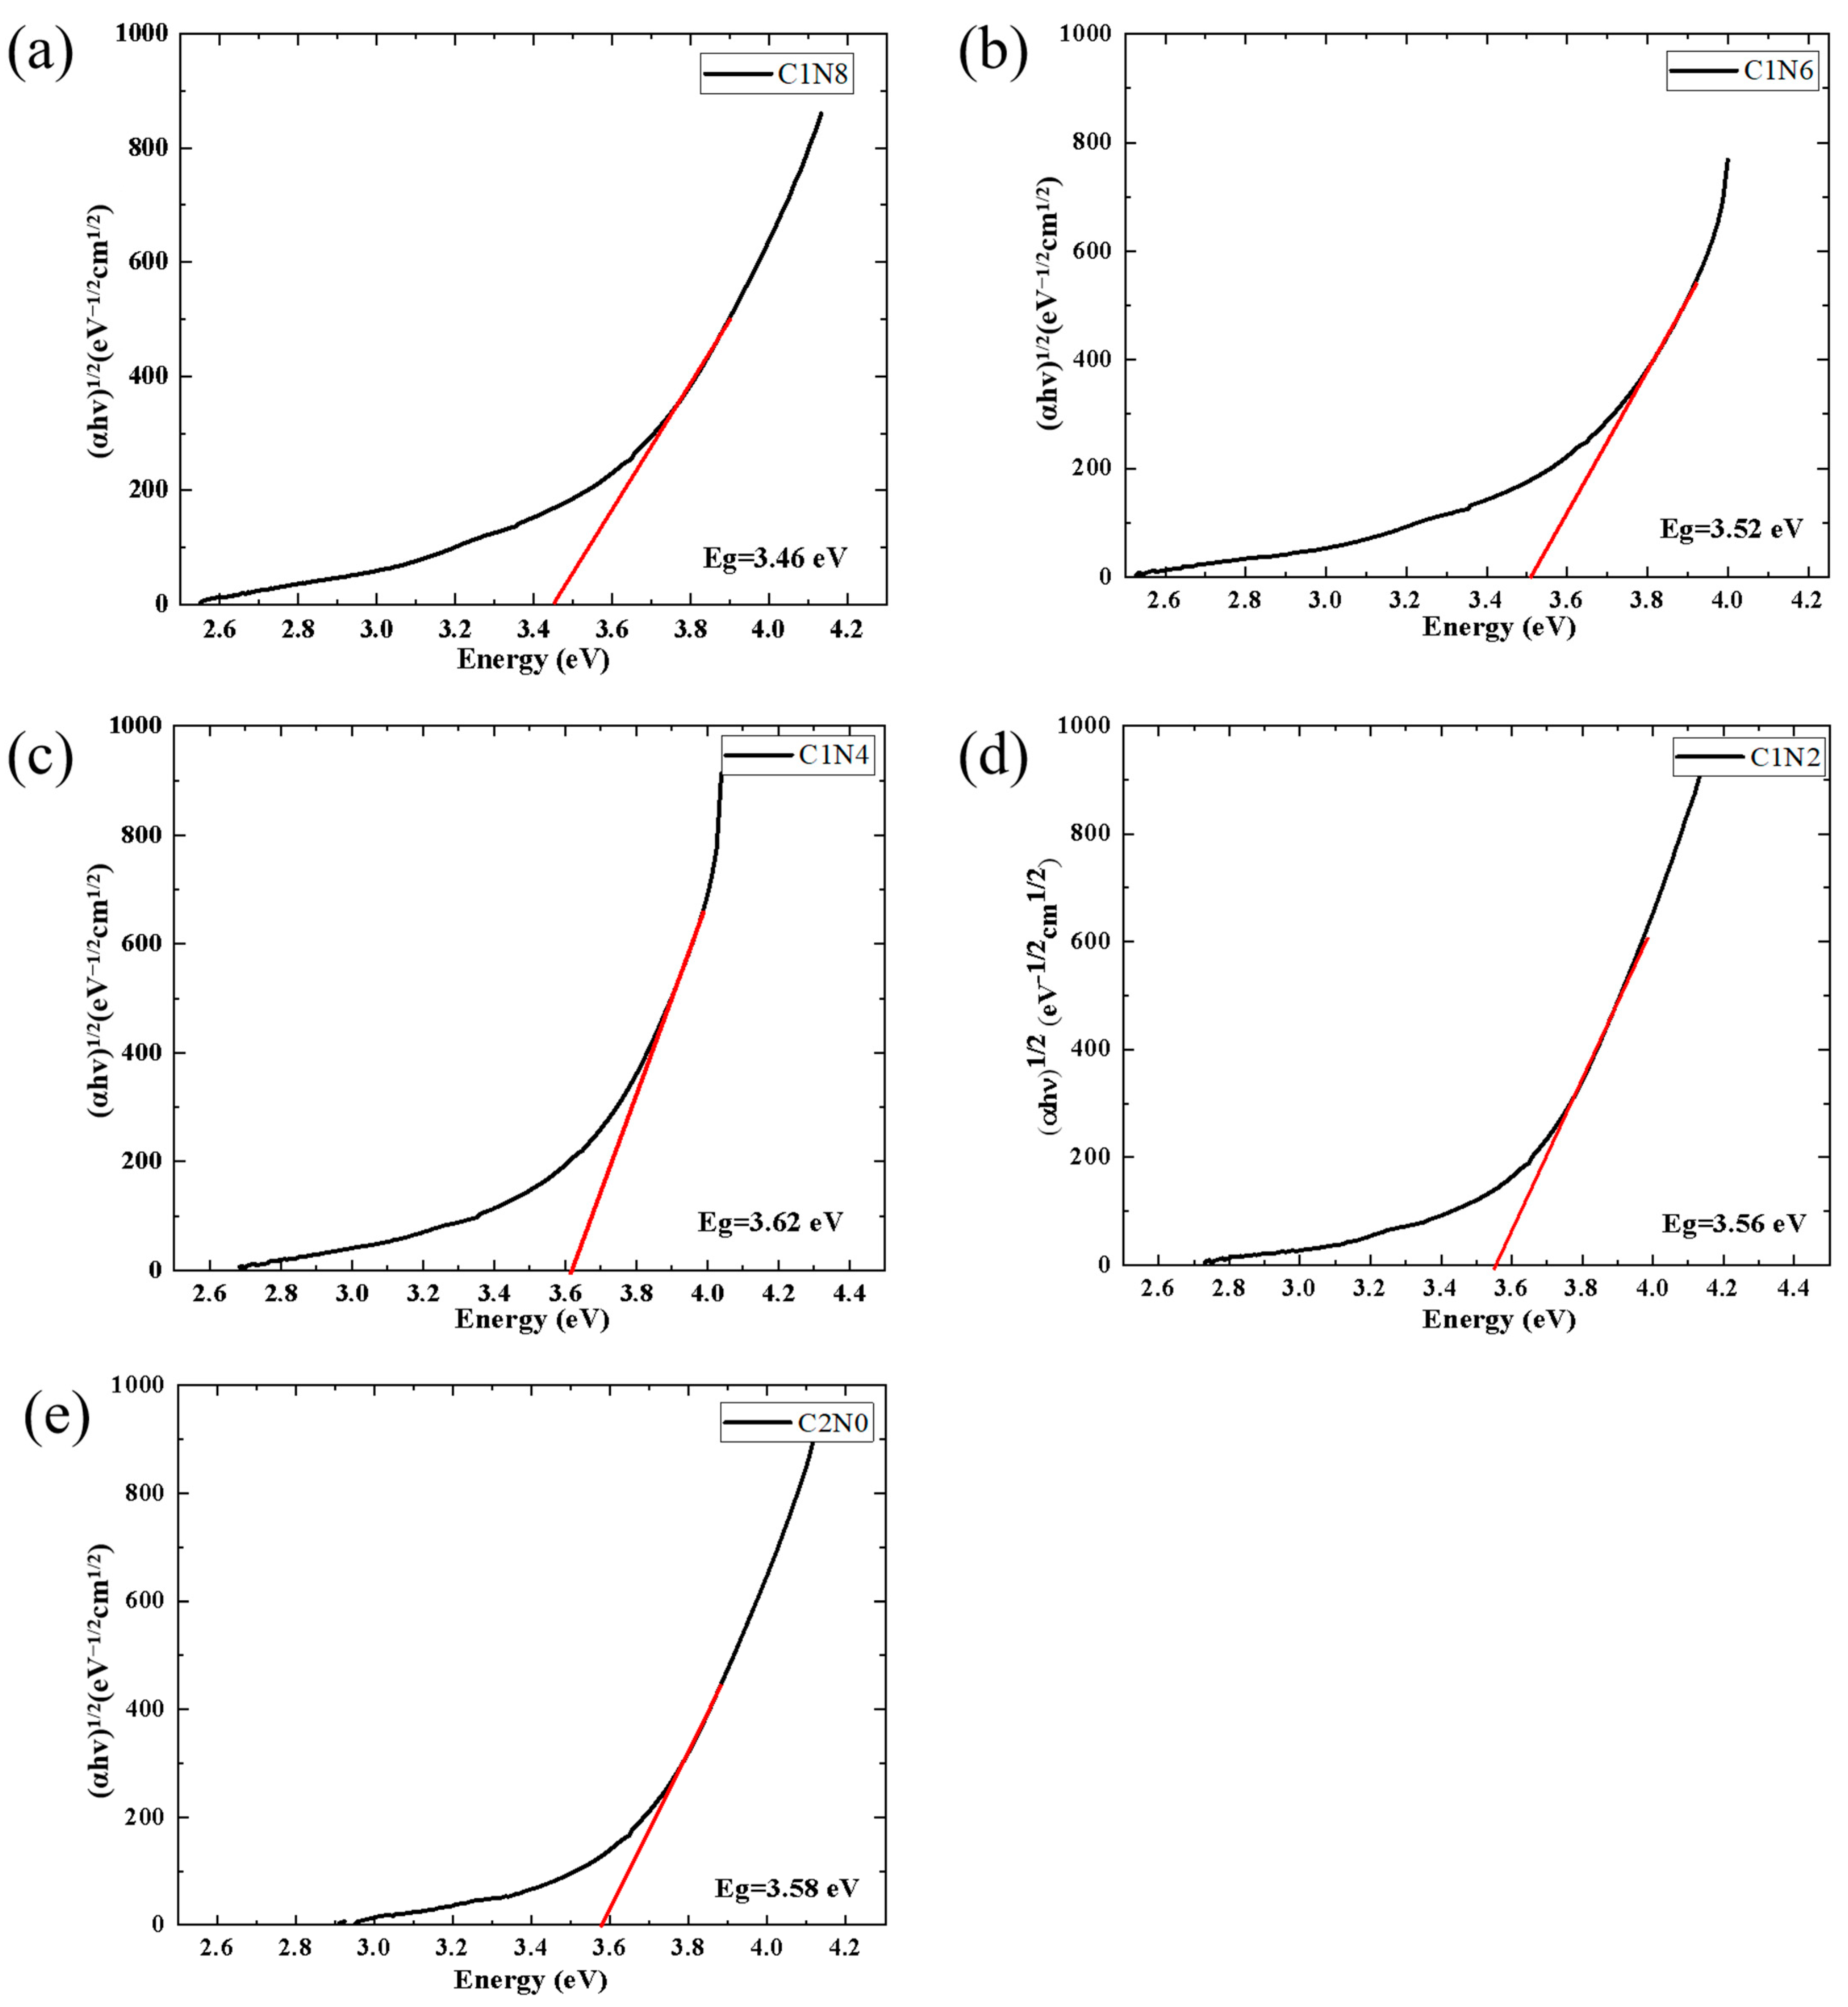
The determination of the optical bandgap in DLC films is facilitated through absorption spectroscopy. The Tauc equation provides a means to calculate the optical bandgap (Eg) for doped DLC films. In Equation (1), α denotes the absorption coefficient, h represents the Planck constant, corresponds to the frequency of incident photons, and A is a constant of proportionality [35]. The value of N is characteristic of the material type, and for DLC films, N = 2 [36]. The absorption coefficient α can be estimated utilizing Equation (2), where t denotes the thickness of the sample, R signifies the reflectance, and T represents the transmittance [35]. By plotting as the vertical axis and as the horizontal axis, the optical bandgap (Eg) can be derived.
Figure 9a–e exhibits the Tauc plots for the five sample groups. As shown in the figure, the intersection point between the red line and the x-axis is the value of Eg. Notably, the optical bandgap demonstrates an inverse relationship with the sp2 content in the samples. With varied nitrogen flow ratios, an increase in sp2 content results in a reduction in the coatings’ bandgap from its maximal value of 3.62 eV to 3.46 eV. This trend in optical bandgap variation concurs with the previously observed changes in the fractions of sp2 and sp3, and it aligns with the findings of a study conducted by Zhu [37], which reported an increase in the photon bandgap of amorphous carbon films with an increasing sp3 fraction. These results underscore the significance of nitrogen doping in regulating the optical properties and microstructural characteristics of N-DLC films, offering valuable insights for potential optical applications in the field of diamond-like carbon thin films.
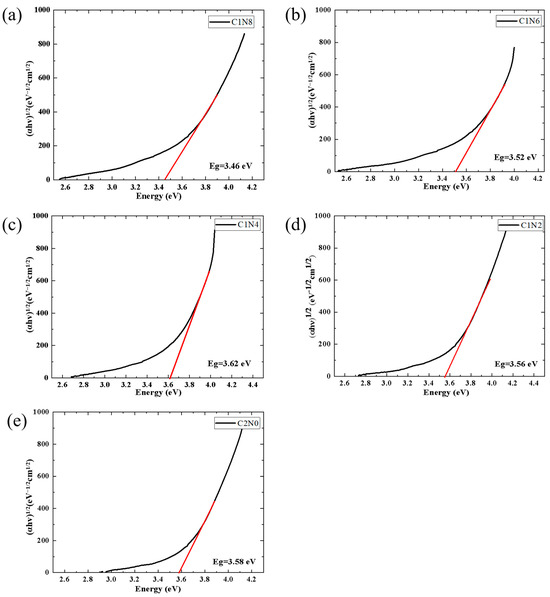
Figure 9.
Tauc plots for N-DLC and DLC. (a) C1N8, N2/(CH4 + N2) = 40%; (b) C1N6, N2/(CH4 + N2) = 30%; (c) C1N4, N2/(CH4 + N2) = 20%; (d) C1N2, N2/(CH4 + N2) = 10%; (e) C2N0, N2/(CH4 + N2) = 0.
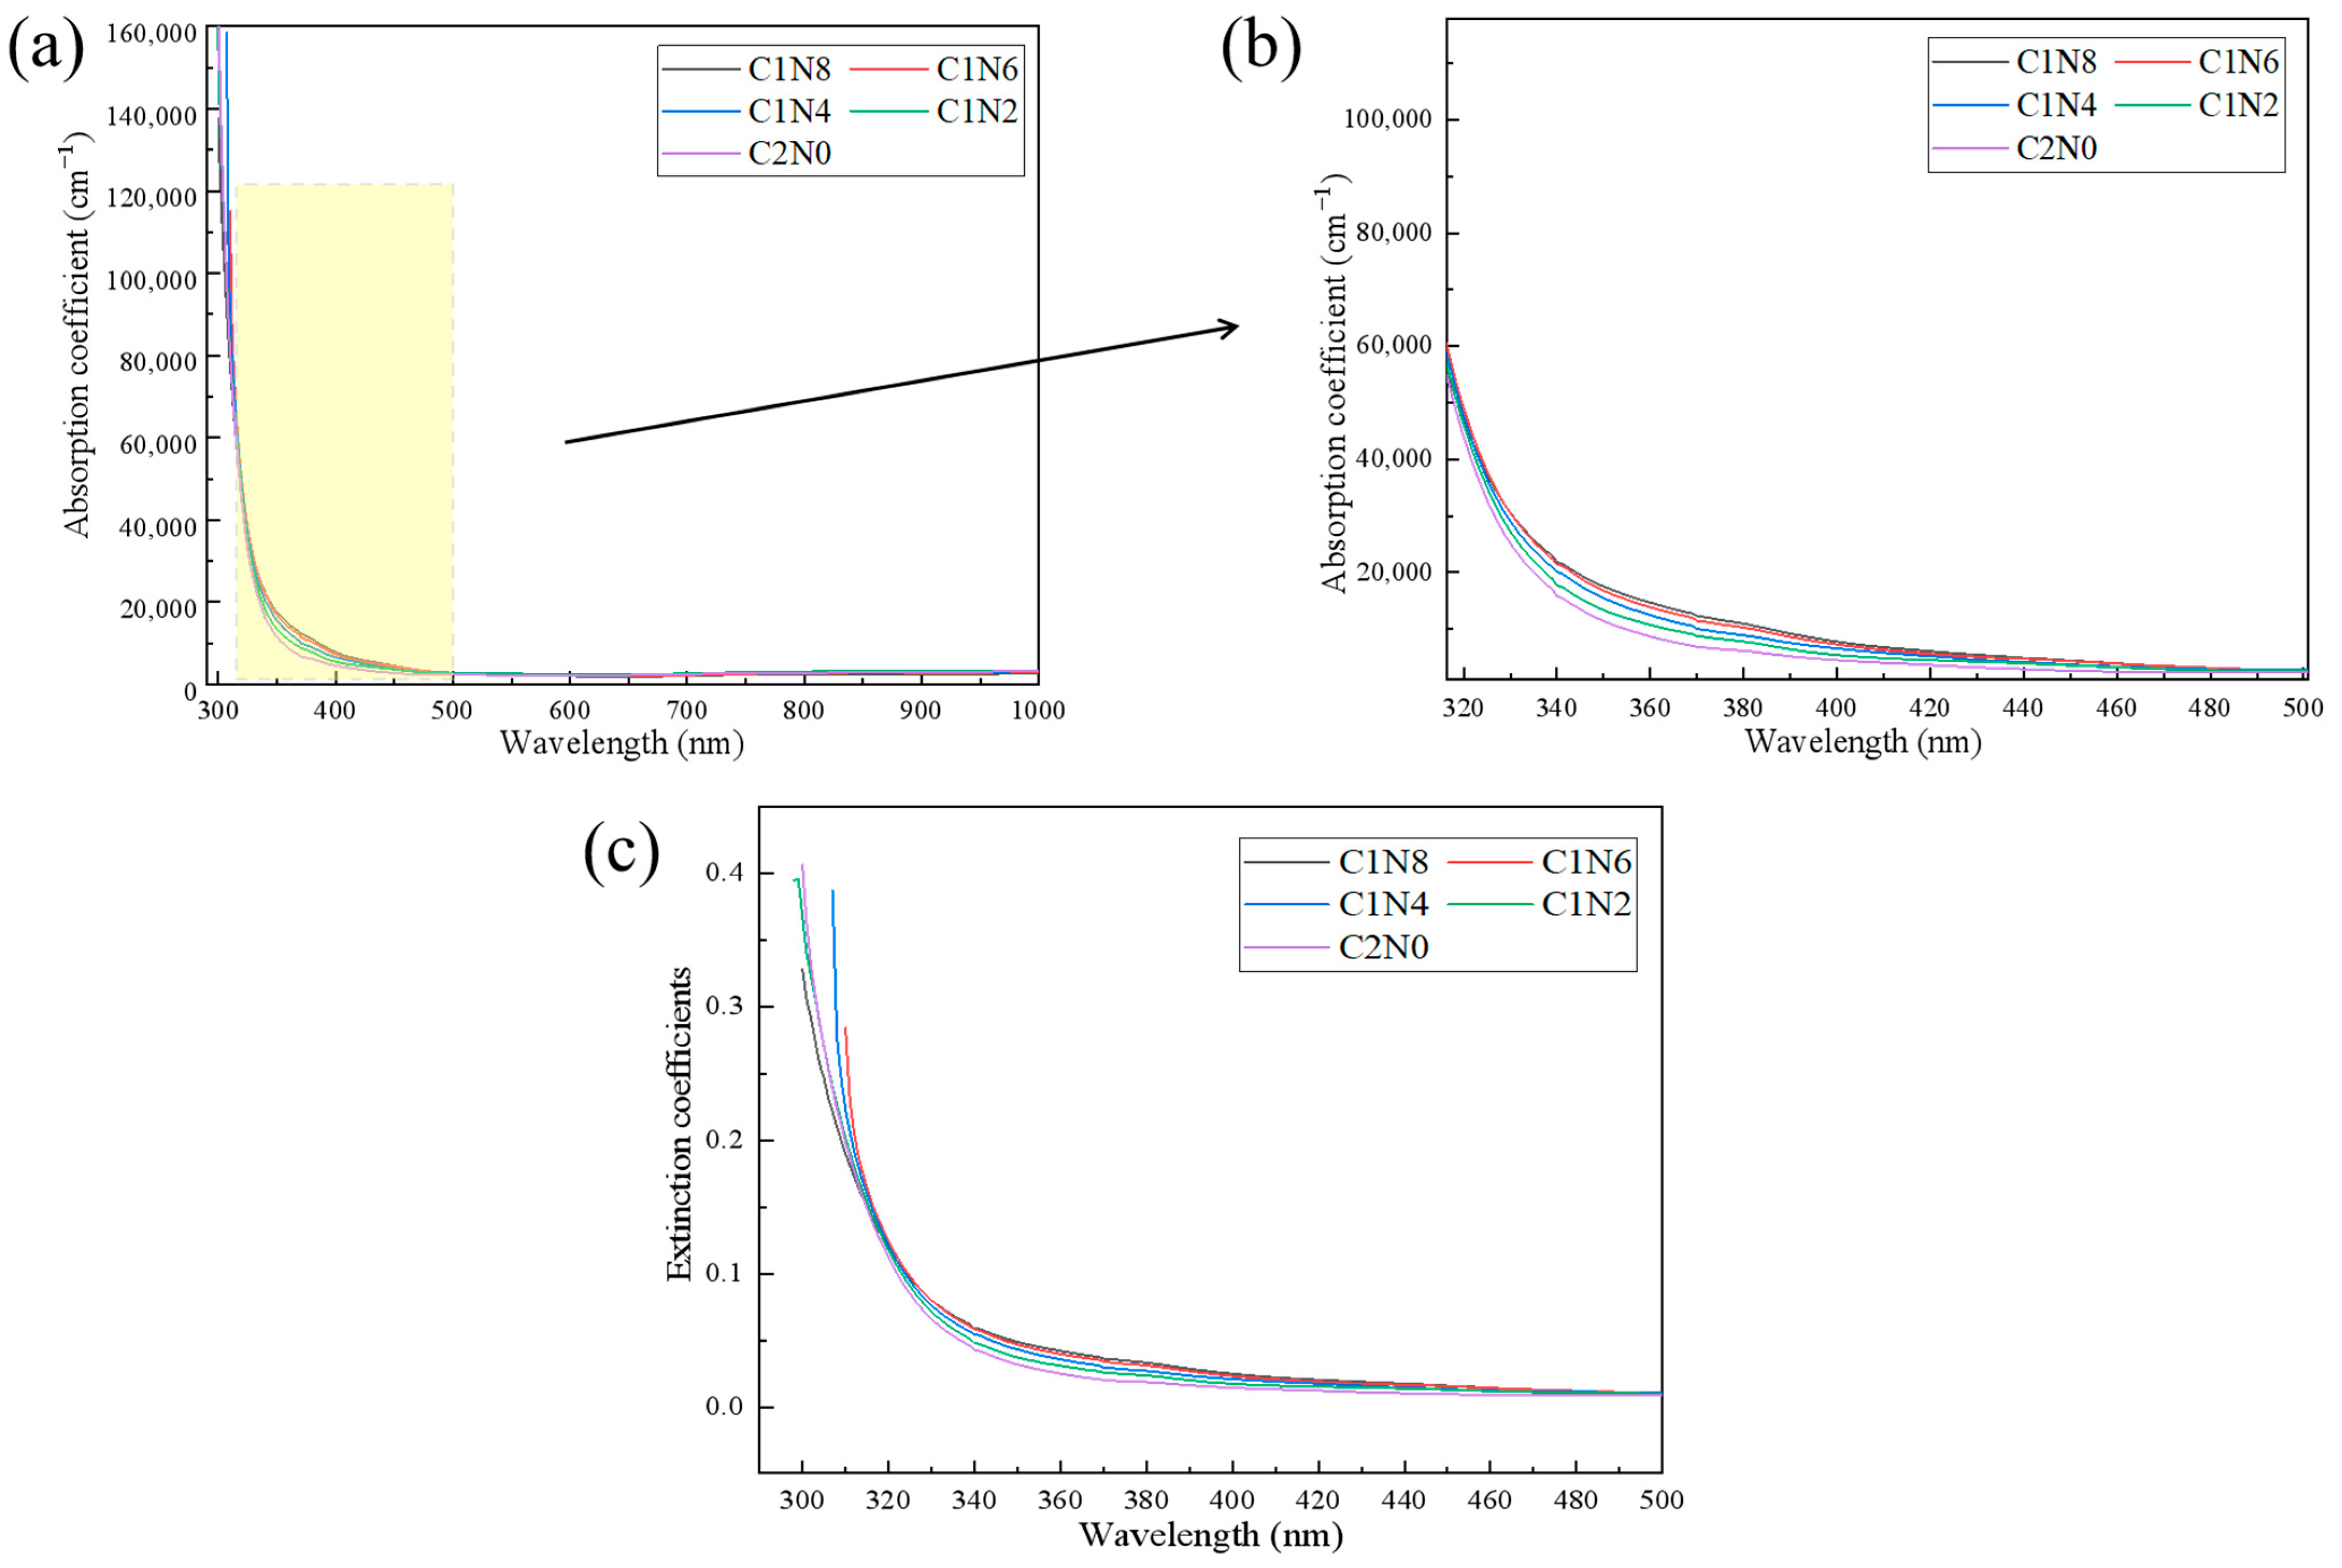
The absorption coefficient and extinction coefficient images of the thin films under different gas flow rates were plotted, as shown in Figure 10. The extinction coefficient (K) is determined by , where α is the extinction coefficient and λ is the wavelength of light. The absorption coefficient decreases as the wavelength value increases. Compared with DLC without nitrogen doping, DLC has a larger range of numerical changes. The variation trends of the extinction coefficient and absorption coefficient are similar.
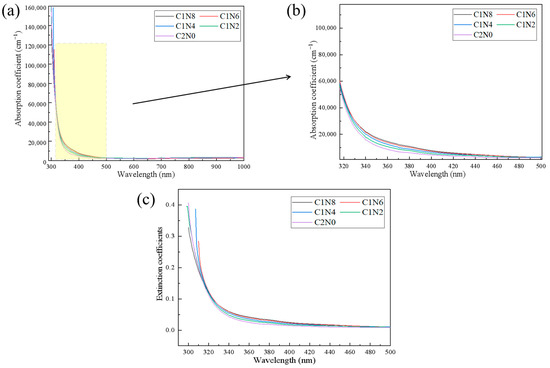
Figure 10.
The absorption coefficient and extinction coefficient of the sample. (a) Absorption coefficient plot of the sample; (b) Partial enlarged image of the Absorption coefficient of the sample; (c) Extraction coefficients diagram of the sample.
We can also calculate the refractive index of N-DLC thin films using Equation (3), where R is the optical reflectance, and K represents the extinction coefficient [22]. The variations in the refractive index with wavelength for different samples are depicted in Figure 11. We can see that in the UV range, the values of the maximum refractive index do not differ much, only the corresponding wavelengths are shifted. In the visible range of 600–700 nm, several refractive index curves have more intersections and the refractive index of the film changes significantly as the gas flow rate is changed. These variations are attributed to changes in the polarization of light induced by alterations in the content and clusters of sp2 within the films.
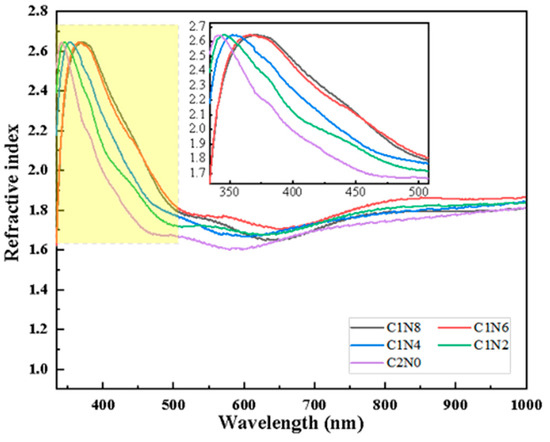
Figure 11.
Variation in refractive index of samples with different flow ratios.
4. Conclusions
In this paper, DLC and nitrogen-doped N-DLC films were prepared by the RF-PECVD method. Based on different deposition conditions with nitrogen flow ratios of 0%, 10%, 20%, 30%, and 40%, the changes in the structure, morphology, and optical properties of the films with different gas flow ratios were investigated. The introduction of nitrogen can effectively increase the deposition rate of the films, and the maximum thickness of the films can reach 696 nm in the same amount of time. According to the AFM and SEM results, the morphology of the films becomes smoother and denser with an increase in nitrogen flow rate, and the surface cracks are reduced. According to Raman spectroscopy and XPS results, carbon and nitrogen form C–N and C=N bonds. With an increase in the nitrogen flow rate ratio, the content of nitrogen in the film gradually increased, and sp3 first increased and then decreased, which indicated that a small amount of nitrogen could promote the generation of sp3 phase, and further increases in nitrogen flow rate increased the content of sp2 phase. These changed the optical properties of the samples. According to Figure 8, in the UV–visible range, the transmittance of several groups of samples decreased as the absorption intensity of the samples increased. In the IR range, these samples are highly transparent. The photonic band gap of the samples was minimized at a methane-to-nitrogen flux ratio of 12:8 and reached 3.46 eV. The extinction coefficients and absorption coefficients of the samples in the UV–visible range exhibited similar trends. By adjusting the gas flow passed into the sample during preparation, the relative percent contents of C and N in the films were regulated, causing changes in the structural and optical properties, and this paper provides a real and reliable data reference for related studies.
Author Contributions
Conceptualization, H.M. and L.W.; methodology, H.M.; software, L.W.; validation, H.M., L.W. and L.Z.; formal analysis, N.L. and J.L.; investigation, L.Z.; resources, L.Z.; data curation, N.L. and J.L.; writing—original draft preparation, H.M. and L.W.; writing—review and editing, L.Z.; visualization, H.M.; supervision, L.Z.; project administration, L.Z.; funding acquisition, L.Z. All authors have read and agreed to the published version of the manuscript.
Funding
This research was funded by [Zhongyuan Academician Fund] grant number [ZYQR2019120188].
Institutional Review Board Statement
Not applicable.
Informed Consent Statement
Not applicable.
Data Availability Statement
The original contributions presented in the study are included in the article, further inquiries can be directed to the corresponding author.
Conflicts of Interest
The authors declare no conflict of interest.
References
- Zeng, A.; Neto, V.F.; Gracio, J.J.; Fan, Q.H. Diamond-like carbon (DLC) films as electrochemical electrodes. Diam. Relat. Mater. 2014, 43, 12–22. [Google Scholar] [CrossRef]
- Kuznetsova, T.; Lapitskaya, V.; Khabarava, A.; Trukhan, R.; Chizhik, S.; Torskaya, E.; Fyodorov, S.; Aizikovich, S.; Sadyrin, E.; Warcholinski, B. Features of wear of DLC-Si coating under microcontact conditions during the formation of secondary structures. Compos. Struct. 2023, 316, 117039. [Google Scholar] [CrossRef]
- Farfan-Cabrera, L.I.; Cao-Romero-Gallegos, J.A.; Lee, S.; Komurlu, M.U.; Erdemir, A. Tribological behavior of H-DLC and H-free DLC coatings on bearing materials under the influence of DC electric current discharges. Wear 2023, 522, 204709. [Google Scholar] [CrossRef]
- Rodríguez-Rojas, F.; Kovylina, M.; Pinilla-Cienfuegos, E.; Borrero-López, Ó.; Bendavid, A.; Martin, P.J.; Hoffman, M. Effect of a DLC film on the sliding-wear behaviour of Ti6Al4V: Implications for dental implants. Surf. Coat. Technol. 2023, 460, 129409. [Google Scholar] [CrossRef]
- Coşkun, Ö.D.; Zerrin, T. Optical, structural and bonding properties of diamond-like amorphous carbon films deposited by DC magnetron sputtering. Diam. Relat. Mater. 2015, 56, 29–35. [Google Scholar] [CrossRef]
- Nakao, S.; Kimura, T.; Suyama, T.; Azuma, K. Conductive diamond-like carbon films prepared by high power pulsed magnetron sputtering with bipolar type plasma based ion implantation system. Diam. Relat. Mater. 2017, 77, 122–130. [Google Scholar] [CrossRef]
- Scheffel, B.; Zywitzki, O.; Kopte, T. Diamond-like films of tetrahedral amorphous carbon deposited by anodic arc evaporation of graphite. Surf. Coat. Technol. 2024, 477, 130305. [Google Scholar] [CrossRef]
- Agah, K.M.; Ghoranneviss, M.; Salem, M.K.; Barzegaran, S.; Elahi, A.S.; Mohammadi, S.; Arvin, R. Coating stainless steel with diamond-like carbon using the hot filament chemical vapor deposition system, and its effects on fusion devices. Radiat. Eff. Defects Solids 2013, 168, 717–723. [Google Scholar] [CrossRef]
- Huang, B.; Liu, L.-T.; Han, S.; Du, H.-M.; Zhou, Q.; Zhang, E.-G. Effect of deposition temperature on the microstructure and tribological properties of Si-DLC coatings prepared by PECVD. Diam. Relat. Mater. 2022, 129, 109345. [Google Scholar] [CrossRef]
- Mohammadinia, E.; Elahi, S.M.; Shahidi, S. Structural and optical properties of Ni-embedded hydrogenated diamond-like carbon (Ni-DLC) prepared by co-deposition of RF-Sputtering and RF-PECVD method. Mater. Sci. Semicond. Process. 2018, 74, 7–12. [Google Scholar] [CrossRef]
- Zhou, B.; Liu, Z.; Piliptsou, D.G.; Yu, S.; Wang, Z.; Rogachev, A.V.; Rudenkov, A.S.; Balmakou, A. Structure and optical properties of Cu-DLC composite films deposited by cathode arc with double-excitation source. Diam. Relat. Mater. 2016, 69, 191–197. [Google Scholar] [CrossRef]
- Aslan, N.; Kurt, M.Ş.; Koç, M.M. Morpho-structural and optoelectronic properties of diamond like carbon–germanium (DLC-Ge) composite thin films produced by magnetron sputtering. Opt. Mater. 2022, 126, 112229. [Google Scholar] [CrossRef]
- Li, H.; Sun, P.; Qi, A.; Zhang, S.; Zhang, F. Modulation of structure and corrosion behavior of Si-DLC coatings on AZ31 by applying a self-source bias. Ceram. Int. 2023, 49, 32193–32204. [Google Scholar] [CrossRef]
- Gao, M.; Kim, S.-B.; Li, Y.; Ramaswamy, S.H.; Choi, J. Triboelectric nanogenerator with enhanced output and durability based on Si-DLC films. Nano Energy 2023, 105, 107997. [Google Scholar] [CrossRef]
- Li, X.; Luo, Y.; Li, J.; Cao, X.; Wang, L.; Zhang, G.; Luo, Z. Predominant role of fatigue crack evolution and tribo-chemistry on tribological behavior of Si-DLC film under different relative humidity. Tribol. Int. 2023, 181, 108326. [Google Scholar] [CrossRef]
- Liu, L.; Tang, W.; Ruan, Q.; Wu, Z.; Yang, C.; Cui, S.; Ma, Z.; Fu, R.K.Y.; Tian, X.; Wang, R.; et al. Robust and durable surperhydrophobic F-DLC coating for anti-icing in aircrafts engineering. Surf. Coat. Technol. 2020, 404, 126468. [Google Scholar] [CrossRef]
- Zhao, Q.; Kang, S.; Zou, F.; Huo, Z. Structure and properties of Si and N co-doping on DLC film corrosion resistance. Ceram. Int. 2023, 49, 2121–2129. [Google Scholar] [CrossRef]
- Ghadai, R.K.; Das, S.; Kalita, K.; Shivakoti, I.; Mondal, S.C.; Swain, B.P. Effect of nitrogen (N2) flow rate over the tribological, structural and mechanical properties diamond-like carbon (DLC) thin film. Mater. Chem. Phys. 2021, 260, 124082. [Google Scholar] [CrossRef]
- Sharifahmadian, O.; Mahboubi, F. RSM study on the influence of nitrogen flow rate and deposition temperature on the tribological properties of nitrogen doped diamond-like carbon coating. Surf. Interfaces 2020, 19, 100470. [Google Scholar] [CrossRef]
- Kim, J.-I.; Lee, W.-Y.; Tanaka, K.; Tokoroyama, T.; Murashima, M.; Umehara, N. Nitrogen-containing diamond-like carbon deposited on glass substrate via filtered cathodic vacuum arc with high-frequency pulsed DC substrate bias. Surf. Interfaces 2024, 44, 103695. [Google Scholar] [CrossRef]
- Osanai, H.; Nakamura, K.; Sasaki, Y.; Koriyama, H.; Kobayashi, Y.; Enta, Y.; Suzuki, Y.; Suemitsu, M.; Nakazawa, H. Effects of annealing temperature on the mechanical, optical, and electrical properties of hydrogenated, nitrogen-doped diamond-like carbon films. Thin Solid Films 2022, 745, 139100. [Google Scholar] [CrossRef]
- Safari, R.; Sohbatzadeh, F.; Mohsenpour, T. Optical and electrical properties of N-DLC films deposited by atmospheric pressure DBD plasma: Effect of deposition time. Surf. Interfaces 2020, 21, 100795. [Google Scholar] [CrossRef]
- Feng, L.; Hu, J.; Yan, S.; He, Z.; Shi, J.; Li, J. Effect of high-speed steel surface nitriding treatment on adhesion and wear resistance properties of nitrogen-doped diamond-like carbon coatings. Diam. Relat. Mater. 2023, 136, 110006. [Google Scholar] [CrossRef]
- Wang, X.; Zhang, X.; Wang, C.; Lu, Y.; Hao, J. High temperature tribology behavior of silicon and nitrogen doped hydrogenated diamond-like carbon (DLC) coatings. Tribol. Int. 2022, 175, 107845. [Google Scholar] [CrossRef]
- Sharifahmadian, O.; Mahboubi, F.; Oskouie, A. Structural evolution and tribological behavior of nitrogen-doped DLC coatings deposited by pulsed DC PACVD method. Diam. Relat. Mater. 2019, 91, 74–83. [Google Scholar] [CrossRef]
- Peng, X.L.; Barber, Z.H.; Clyne, T.W. Surface roughness of diamond-like carbon films prepared using various techniques. Surf. Coat. Technol. 2001, 138, 23–32. [Google Scholar] [CrossRef]
- Ferrari, A.C. Raman spectroscopy of graphene and graphite: Disorder, electron–phonon coupling, doping and nonadiabatic effects. Solid State Commun. 2007, 143, 47–57. [Google Scholar] [CrossRef]
- Peng, J.; Yang, M.; Zeng, J.; Su, D.; Liao, J.; Yick, M.-L. Influence of nitrogen doping on the thermal stability of hydrogenated amorphous diamond coating. Thin Solid Films 2020, 709, 138188. [Google Scholar] [CrossRef]
- Nilkar, M.; Ghodsi, F.E. Effects of annealing atmospheres (Ar, N2 and air) on structural, morphological, and surface corrosion properties of a-C:H thin films. Diam. Relat. Mater. 2019, 98, 107482. [Google Scholar] [CrossRef]
- Tan, X.; Li, J.; Meng, K.; Zhai, H. Microstructures and visible-infrared optical properties of diamond-like carbon films deposited by magnetron sputtering. Diam. Relat. Mater. 2023, 133, 109724. [Google Scholar] [CrossRef]
- Nakamura, K.; Ohashi, H.; Enta, Y.; Kobayashi, Y.; Suzuki, Y.; Suemitsu, M.; Nakazawa, H. Effects of silicon doping on the chemical bonding states and properties of nitrogen-doped diamond-like carbon films by plasma-enhanced chemical vapor deposition. Thin Solid Films 2021, 736, 138923. [Google Scholar] [CrossRef]
- Vaghri, E.; Khalaj, Z.; Ghoranneviss, M.; Borghei, M. Characterization of diamond: Like carbon films synthesized by DC-plasma enhanced chemical vapor deposition. J. Fusion Energy 2011, 30, 447–452. [Google Scholar] [CrossRef]
- Corona-Gomez, J.; Shiri, S.; Mohammadtaheri, M.; Yang, Q. Adhesion enhancement of DLC on CoCrMo alloy by diamond and nitrogen incorporation for wear resistant applications. Surf. Coat. Technol. 2017, 332, 120–127. [Google Scholar] [CrossRef]
- Ray, S.C.; Pong, W.F.; Papakonstantinou, P. Iron, nitrogen and silicon doped diamond like carbon (DLC) thin films: A comparative study. Thin Solid Films 2016, 610, 42–47. [Google Scholar] [CrossRef]
- Marcinauskas, L.; Dovydaitis, V.; Iljinas, A.; Andrulevičius, M. Structural and optical properties of doped amorphous carbon films deposited by magnetron sputtering. Thin Solid Films 2019, 681, 15–22. [Google Scholar] [CrossRef]
- Rubio-Roy, M.; Pascual, E.; Polo, M.C.; Andújar, J.L.; Bertran, E. Structural and optical properties of diamond like thin films deposited by asymmetric bipolar pulsed-DC reactive magnetron sputtering. Surf. Coat. Technol. 2008, 202, 2354–2357. [Google Scholar] [CrossRef]
- Zhu, J.; Han, J.; Han, X.; Meng, S.; Liu, A.; He, X. Optical properties of amorphous diamond films evaluated by non-destructive spectroscopic ellipsometry. Opt. Mater. 2006, 28, 473–479. [Google Scholar] [CrossRef]


Disclaimer/Publisher’s Note: The statements, opinions and data contained in all publications are solely those of the individual author(s) and contributor(s) and not of MDPI and/or the editor(s). MDPI and/or the editor(s) disclaim responsibility for any injury to people or property resulting from any ideas, methods, instructions or products referred to in the content. |
© 2024 by the authors. Licensee MDPI, Basel, Switzerland. This article is an open access article distributed under the terms and conditions of the Creative Commons Attribution (CC BY) license (https://creativecommons.org/licenses/by/4.0/).