Article

The Characteristics of the Deformation of a Feeding Roller with Double V-Wings Honeycomb under Driven Modes with Different Rotation Rates and Axial Compressions

School of Technology, Beijing Forestry University, Beijing 100083, China
*
Author to whom correspondence should be addressed.
Appl. Sci. 2024, 14(5), 2082; https://doi.org/10.3390/app14052082
Submission received: 29 November 2023 / Revised: 26 February 2024 / Accepted: 29 February 2024 / Published: 1 March 2024
(This article belongs to the Section Mechanical Engineering)

Abstract

:
In this work, the roller-shaped double V-wing honeycomb (DVWH) structure was used as the object, which was designed for forest harvesting machines. The deformation characteristics of its rotation under a specific compression were studied during the feeding process for the steel feeding roller used in the traditional combined harvesting machine for trees, which is prone to damaging the wood. The compression rate (10%–15%) and rotational speed (100 mm/s–320 mm/s) were used to analyze the relationship between compression rate, rotational speed, and deformation characteristics. The deformation characteristics, characterized by equivalent stress, radial displacement sensitivity, and energy absorption efficiency, were analyzed. The results show that the deformation characteristics of the roller-shaped DVWH structure under driven mode were more sensitive to compression rate and less sensitive to changes in rotational speed. There was a positive correlation between the equivalent stress of the node and the compression rate. The peak equivalent stress of the outermost node at 10% and 15% compression rates were 111.9 MPa and 230.9 MPa. There was a negative correlation between radial displacement–compression sensitivity and compression rate, and a decrease in radial displacement–compression sensitivity from 10% to 15% compression rate at different nodes ranges from 5% to 22%. The feed performance efficiency (EF) grew from 8.3% to 12.7% for a 1% increase in compression rate.

1. Introduction

The primary solution to the growing demand for timber resources is establishing artificial forest timber production reserves and importing from other countries. During the growth process of artificial forests, large-scale logging and artificial tending can be achieved, ensuring the sustainable development of forestry resources and meeting the demand for wood [1]. The forest harvester is currently the most comprehensive piece of forest logging equipment and it is widely used worldwide. Compared with traditional logging methods, it has the advantages of high logging efficiency, low labor intensity, a low accident rate, and high ecological benefits [2]. The feed roller is an essential part of the logging machine, made of steel with high rigidity and low elastic deformation. The steel teeth are evenly distributed on the outer surface. During operation, the steel teeth mesh with the fallen wood, and the roller rotates to provide feed force. However, the impact and dynamic compression generated by the steel feeding roller during the clamping, flipping, and conveying processes can easily damage the wood, as shown in Figure 1. The bark is promising, and many different products can be obtained from its unique chemical composition to produce various materials [3]. Surface damage to harvested logs will significantly reduce their utilization value and economic benefits. Nuutinen et al. [4] evaluated the relationship between different types of feed rollers, their operational efficiency, and the damage caused to logged wood. Strandgard et al. [5] studied the issue of reduced eucalyptus bark yield caused by log damage during mechanized logging. The results indicated that in order to reduce wood damage, it is necessary to reduce the hydraulic cylinder pressure of the feed roller action, which would lead to a decrease in the operational efficiency of the forest combine harvester. One of the current research directions is to improve the flexibility of the feed roller’s material and structure to reduce the damage caused to fallen wood. Lu et al. [6] designed an improved feed roller based on PRO/ENGINEERING Wildfire 5.0, which used a mechanical damping structure to reduce wood damage. However, there is little research on improving the structure of the feed roller itself.
Due to their unique deformation characteristics, excellent impact resistance, and energy absorption characteristics, negative Poisson’s ratio honeycomb structures are widely used in engineering fields such as vehicles, aerospace, and ships [8,9]. Applying honeycomb structures to the feed rollers of forest harvesting machines may be a good direction. Domestic and foreign scholars have researched the mechanical properties of honeycomb structures with a negative Poisson’s ratio. Álvarez Elipe et al. [10] compared and analyzed the mechanical properties of several negative Poisson’s ratio honeycomb structures. The results showed that compared with other honeycomb structures, the double-arrow honeycomb and concave honeycomb junctions had more prominent volume and area reduction rates, a higher Poisson’s ratio, and an equivalent Young’s modulus. A double V-shaped expansion honeycomb is more suitable for preventing large deformation and crushing than a concave hexagonal honeycomb. The vertical section of the concave hexagonal structure is more prone to bending, increasing the overall structure’s instability under axial compression [11]. Yang et al. [12] found that the inner core of the double arrow can greatly reduce stress from the load end, making it an excellent structure that can be used in protective devices. Wang et al. [13] studied hexagonal honeycomb structures’ deformation mode and dynamic response under different inclined load angles and impact velocities. In this study, external conditions were regarded as important influencing factors, rather than focusing on the geometric structural parameters of the structure itself. Shen et al. [14] designed honeycomb structures with negative Poisson’s ratio (NPR) curved concave edges. The Poisson’s ratio and energy absorption capacity were studied with different arc angles at different compression speeds using finite element methods. Studying gradient structures can provide important references for the editable performance of composite structures. The study and comparison of the compression performance of positive gradient auxetic honeycomb (PGAH) and negative gradient auxetic honeycomb (NGAH) indicate that NGAH is an ideal energy-absorbing structure [15]. Significant progress has also been made in researching some unique gradient structures, such as parallel [16] and chiral [17,18] gradient structures.
The feeding roller mainly bears cyclic loads during the feeding stage. In this regard, scholars have studied honeycomb structures’ mechanical properties and energy evolution under multiple loads. An experiment of graded cyclic loading and unloading shows that the honeycomb’s initial peak strength and platform stress are related to the level of release of the elastic properties of the honeycomb during the unloading process [19]. In addition, the honeycomb has greater platform stress and platform stress efficiency under cyclic loading [20]. Wu et al. [21] analyzed the fatigue failure modes and damage mechanisms of paper honeycomb sandwich structures, proposed a method for predicting the fatigue life of honeycomb sandwich structures, and verified its feasibility. Chen et al. [22] designed a reusable gradient negative stiffness (GNS) honeycomb structure and verified the repeatability of the honeycomb using numerical simulation and cyclic compression experiments. Combined with the results of impact experiments, it was concluded that the new GNS honeycomb has better buffering performance than the NNS honeycomb. For the crushing behavior of honeycomb structures, Zhao et al. [23] studied the initial yield behavior of bent hexagonal honeycomb under shear compression composite loads and the relationship between geometrical parameters and initial peak stress.
Another issue with applying honeycomb structures to feed rollers is studying the mechanical properties of cylindrical honeycomb structures. Florence et al. [24] studied the effects of transverse shear and orthogonal anisotropy on the modal density of circular honeycomb and derived mathematical expressions. Ling et al. [25] analyzed the deformation characteristics and Poisson’s ratio relationship between cylindrical and planar metastructures. They found that when the number of circumferential unit cells exceeds a specific value, the Poisson’s ratio of cylindrical metastructures is close to that of planar metamaterials. Wang et al. [26] studied the cylindrical shell formed by the curling of honeycomb bread, and analyzed the crushing behavior and mechanism of the cylindrical shell. Gao et al. [27] proposed a new cylindrical honeycomb structure of vertically stacked double-arrow honeycomb (DAH). After establishing a mechanical performance analysis model, it was validated through a finite element model. Abayazid et al. [28] studied the response problem of inclined impact by applying loads in axisymmetric shape changes on viscoelastic circular honeycomb walls.
There is insufficient research on the rolling state of circular honeycomb structures, with non-pneumatic tires (NPT) being the main application of fitting honeycomb structures into roller-shaped spaces. The performance of NPT is better than that of traditional pneumatic tires. Studies have shown that the maximum stress on NPT spokes and tread is much lower than that of traditional pneumatic tires, but their load-bearing capacity is higher than that of traditional pneumatic tires [29]. The study of dynamic behavior has been carried out in the extensive research on pneumatic tires. The finite element method is mostly used to study the radial stiffness, displacement, ground pressure, and bearing capacity of NPT [30,31,32]. Li [33] designed a honeycomb hexagonal porous spoke structure and applied it to tires to study the effects of different numbers and arrangements of base holes on tire performance. Genoves et al. [34] elaborated on developing a method to study the mechanical behavior of NPTs through experimental data and numerical methods. Ku et al. [35] established a three-dimensional and numerical analysis model of a new flexible-spoke non-pneumatic tire (FSNPT) type to explore steady-state mechanical characteristics. The steady-state mechanical characteristic curve was obtained, and the relationship between steady-state mechanical characteristics and load was analyzed under single and composite working conditions. Ganniari et al. [36] conducted a numerical analysis to investigate the influence of internal geometric parameters on the weight and mechanical behavior of NPTs. Deng et al. [37] established a three-dimensional nonlinear finite element model of a new non-pneumatic mechanical elastic wheel (MEW) type under steady-state rolling conditions. The reliability and accuracy of the model in terms of radial stiffness, footprint, and longitudinal slip characteristics were verified by comparing numerical simulation and experimental data.
There have been some studies on applying honeycomb structures to forest joint harvesters. Wang et al. [38] introduced the double-arrow honeycomb structure into the improved feeding roller design and proposed a double V-wings honeycomb (DVWH) negative Poisson’s ratio structure. The feeding roller contracted upon contact with the wood due to the tensile expansion effect during loading, resulting in an increase in the number of steel teeth in contact between the roller and the fallen wood, a decrease in stress in the contact area, and a reduction in mechanical damage to the wood. Zhu et al. [39] studied the coupling relationship between the cell structure parameters and the contact area of the DVWH feed roller. Qu et al. [7] divided the equivalent honeycomb group of the structure and conducted dynamic response analysis using simulation. Zhang et al. [40] divided roller-shaped honeycomb structures of different sizes into three levels based on density and studied their radial compression responses. Research on DVWH rollers with attached wings is mostly focused on the compression process. The above research was conducted under quasi-static conditions or uniaxial impact loads without involving the rotation of the feed roller. In order to develop a flexible feeding roller that can adapt to more logging conditions, it is necessary to study further the deformation and mechanical characteristics of the roller-type DVWH structure when rotating under pressure.
The novelty of this article lies in the study of the feed condition of the DVWH structure feed roller. The motion of the feed roller under this condition can be referred to as the driving mode, which rotates while being compressed, which is different from the previous quasi-static compression research on feed rollers. Specifically, this article uses numerical methods to study the deformation characteristics of a roll-shaped DVWH structure under different rotational speeds and axial compression rates during feeding. The equivalent stress and radial displacement rotation angle curves of the nodes during the feeding process of the structure are given, and the deformation characteristics, mainly characterized by the equivalent stress and radial deformation of the nodes, are discussed, as well as the relationship between the rotational speed and compression rate. The conclusion can provide a reference for optimizing high-performance and reliable flexible honeycomb feeding rollers that can adapt to complex and variable logging conditions.

2. Materials and Methods

2.1. Geometry of Feed Roller with DVWH Filling

Among common negative Poisson’s ratio structures such as concave hexagons, double arrows, and stars, double arrows and concave hexagonal structures have the highest Young’s modulus at the same relative density [9]. They have applications in energy absorption and protection and are almost always used in rectangular geometric shapes. The double-arrow honeycomb structure needs to be modified to make it cylindrical. As shown in Figure 2b, the nodes on both sides of the double-arrow honeycomb cell are connected by a load-bearing wing to form a double-V attached-wing honeycomb structure. The multi-layer double-V attached airfoil structure is formed into a circular array along the radial direction, creating a roller shape. The length of the attachment wing increases with the number of layers of the honeycomb roll, and the steel teeth of the feed roll can be fixed on the attachment wing.
Based on the roll-shaped double-V honeycomb structure proposed by Qu [7], the structural parameters in Figure 2b were set, where t is the wall thickness, l is the half-width of the cell, θ1 is the lower cell angle, θ2 is the upper cell angle, r is the half-width of the load-bearing wing, L is the number of layers, N is the number of cell elements, R is the outer diameter of the roller, R0 is the inner diameter of the roller, and T is the width of the roller. The structural model parameters used in the experiment in this article are shown in Table 1.

2.2. Theoretical Basis of Mechanical Properties of DVWH Structures

When deriving the theoretical model, the following assumptions were made regarding the deformation of the solid honeycomb model. Firstly, based on the Eular–Bernoulli beam theory, it was assumed that the deformation caused by the honeycomb structure’s load was mainly the honeycomb wall’s bending deformation, ignoring the honeycomb wall’s tensile and compressive deformation and shear deformation. Furthermore, it was assumed that during the deformation process under external forces, the nodes of the honeycomb were rigid, and the angle between the honeycomb walls remained constant. Based on the above assumptions, it was assumed that the deformation of the feeding roller under force based on the NPR structure was mainly the deformation of the outer layer cells, and mechanical analysis was conducted on a single cell.
According to Larsen [41], the expressions for Poisson’s ratio and the elastic modulus of DVWH structures are:
υ x y = 1 tan θ 1 tan θ 2 ,
E y = E s t l 3 sin 3 θ 1 cos 2 θ 2 + sin 3 θ 2 cos 2 θ 1 sin θ 1 sin θ 2 sin θ 2 cos θ 1 sin θ 1 cos θ 2 ,
where Es is the Young’s modulus of the structural matrix material of the DVWH.
According to the formula derived from Qiao [42], the yield strength of the structure can be calculated using the expressions for Poisson’s ratio and elastic modulus of the component:
σ = σ s t l 2 sin θ 2 cos θ 1 2 sin θ 2 θ 1 ,
where σs is the yield strength of the structural matrix material of the DVWH.
According to Wang [38], K can be written as:
K = d m L ,
where m is the equivalent proportional coefficient of the DVWH structure, d is the compression amount, and L is the total dimension in the direction of structural compression.
According to Ruan [43]:
σ = K t l 2 σ s sin θ 2 cos θ 1 2 sin θ 2 θ 1 + ρ s V 2 ,
where σ is the equivalent stress of the honeycomb structure, ρs is the relative density of the cell, and V is the compression speed.

2.3. FE Model under Driven Modes

All numerical simulation experiments were conducted using finite element analysis software ANSYS 2021 R1/Transient Structural. In order to balance accuracy and simulation experiment duration, the unit size was set to 7 mm, ensuring that the number of grid elements for cell walls AD and BD was 5. The number of grid layers for the loading board was set to 3. The contact form between the roller’s DVWH outer profile and the loading plate was set as surface contact, with a friction coefficient of 0.35, and the walls of each cell were set as self-contact. The rotation constraint was applied to the roller DVWH structure, and the rotation axis was set as the center of the roller-shaped circle. The compression between the log and the feeding roller was simulated by applying pressure to the rigid loading plate. The material of the loading plate was Q345B steel, with a density of 7850 kg/m3, Young’s modulus of 206 GPa, and Poisson’s ratio of 0.3. The roller-shaped DVWH’s base material was polyurethane powder, with a 950 kg/m3 density, Young’s modulus of 1100 MPa, and Poisson’s ratio of 0.41. In the preliminary research of our research group, grid independence testing was conducted on the impact experiment of the roller DVWH structure [44]. When the number of nodes in the finite element model grid exceeded 39,712, its peak stress value converged. In the numerical simulation experiment of the driven mode of the roller DVWH structure used in this work, the number of mesh nodes in the finite element model reached 59,636, which can meet the accuracy requirements.
As shown in Figure 2a, the log is clamped by a pair of rollers. After being flattened horizontally, the rollers begin to feed, accelerate to the set speed, rotate at a constant speed for a specific time, and finally slow down to a stop. The chainsaw cuts the protruding part of the log. According to the workflow of the forest joint harvester, the simulation experiment process was divided into two steps. Firstly, the rigid loading plate was squeezed in the Y-direction at a speed of 0.01 m/s until the honeycomb reached the specified compression rate. During this period, the Z-axis displacement of the loading plate was limited, with boundary conditions of u(Z = 0) = 0, Fx = 0, and u(Y = L) = d. The second step was to maintain the Y-axis displacement of the loading plate. The roller-shaped DVWH rotated at a specified speed around the Z-axis, driving the loading plate to move in the X-direction. The boundary conditions of the loading plate were u(Z = 0) = 0, Fx = 0, and u(Y = L) = d, and the boundary conditions of the roller were u(Z = 0) = 0 and Fx = 0. The out-of-plane displacement of the loading plate and honeycomb was limited throughout the entire process and the X-direction degrees of freedom of the loading plate were released. The value of d is given according to Formula (6) and Table 2, and the speed is given in Table 2.
Compression rate ε and speed υ are essential parameters for simulating the roller feeding process. This article investigates their effects on the rotation process of a DVWH roller with a certain amount of preload. Compression ratio ε is defined as:
ε = d R ,
where R is the radius of the DVWH roller. In order to obtain the influence trend of compression rate and rotational speed, multiple sets of experiments need to be conducted. Due to the fact that the feeding roller is generally in the elastic deformation range during operation, the compression rate ε was taken in the range of 10–15%. The speed of the feed roller of the combined logging machine during the uniform rotation stage is 320 mm/s [2]. Because the logging machine usually cuts the fallen wood into a fixed length during operation, the linear speed was used to represent the rotational speed. When conducting simulation experiments on feed rollers of different sizes, the linear speed is converted to angular speed based on their radius. Speed υ was in the range of 100 mm/s–320 mm/s. The parameter settings for compression ratio and speed in the experiment are shown in Table 2.
For the convenience of discussion, we name the nodes of the roll-shaped honeycomb structure and the studied cell columns. As shown in Figure 2b, the nodes where the cell is connected to the wing are B and A in the direction of roller rotation. C is the node where the upper cell corner is located, and D is where the lower cell corner is located. The outermost cell node is distinguished by adding the subscript e. The studied cell column is called I, and the cell column adjacent to I and in contact with the loading plate before it is called α. The column of cells adjacent to I and in contact with the loading plate after it is called β. The process of the simulation experiment is shown in Figure 3.

3. Numerical Results

3.1. Equivalent Stress of Nodes in Driven Mode

The roller DVWH structure can be regarded as a circular array of double V-wing structures, and each row of cells will repeatedly undergo the same load during the rotation process of the roller. Therefore, only one row of cells in the roller needs to be analyzed. Generally speaking, the larger the load and the faster the speed of the workpiece, the shorter its lifespan and the easier it is to be damaged. Therefore, this section focuses on experiments with the highest load. Taking the simulation experiment under the ε = 15%, υ = 320 mm/s condition as an example, the deformation characteristics of the roller honeycomb structure cell column I during rotation under the Y-axis compression state were mainly analyzed from the deformation and stress changes of nodes.
During the experimental process, the equivalent stress and strain energy changes of each node in the I-cell column were analyzed at a linear speed of 320 mm/s and a compression rate of 15%. The results are shown in Figure 4, and the reference lines in the figure are: (1) α-C: X = 115°, representing the Ae node of the cell column α, in contact with the loading plate; (2) Ae-C: X = 135°, indicating the Ae node of cell column I, in contact with the loading plate; (3) Be-R: X = 214.7°, indicating the Be node of cell column I, detached from the loading plate; and (4) β-R: X = 242.6°, representing the Be node of the cell column β, detached from the loading board. It can be seen that the equivalent stress peaks at each node were concentrated in the α-C to β-R period. In the contact process between cell column I and the loading plate, due to inertial effects, the equivalent stress of the nodes farther away from the plate was minor, but De was higher than the maximum equivalent stress values of Ae and Be by 21.9% and 30.6%, respectively. The reason was that during the experimental process, Ae and Be made direct contact with the loading plate, resulting in significant deformation, while the loads of Ae and Be were simultaneously transmitted through the cell wall at node De. Since the Ce node did not make contact with the loading plate at a compression rate of 15%, the peak equivalent stress was only 64.95 MPa, much smaller than for other nodes in the same cell. The Ce node had a smaller radial force and it mainly bore the bending moment generated by bending the cell walls AC and BC.
The variation trend of node strain energy in the interval α-C to β-R was similar to the equivalent stress. From the compression end to the axis of the roller, the peak strain energy gradually decreased. Similar to the stress change situation, the peak strain energy of the De node was significantly higher than that of other nodes, exceeding it by three times, and it was located at 180° with the equivalent stress peak. Moreover, outside the range α-C to β-R, although the stresses at each node were changing, their respective strain energy values remained almost zero due to the small radial displacement generated by the nodes.

3.2. Radial Displacement of Nodes in Driven Mode

Due to the continuous rotation of each node during the experimental process, the position coordinates of each node change are complex and contain much useless information. Therefore, this article’s deformation analysis of the node mainly focuses on its radial displacement.
This section mainly analyzes the radial displacement of each node in the honeycomb structure cell column I in a numerical simulation. Figure 5 shows the radial displacement changes of each node in the I-cell column during the experimental process at a linear speed of 320 mm/s and a compression rate of 15%. From the figure, it can be seen that the closer the cell where the node was located was to the axis of the roller, the smaller the maximum change in radial displacement of the node. That means the compression mainly occurred near the loading plate, and the degree of compression decreased in the direction away from the loading plate. Before making contact with the loading plate, nodes Ae, Ce, De, and D1 experienced radial displacement away from the roller axis. This behavior occurred for a relatively long time at node Ae, while other nodes’ “away from axis” behavior was observed from the α-C starts. The Be node had a radial displacement near the roller axis earlier. The remaining nodes maintained their radial position before and after the contact between their respective cell columns and the loading plate. Except for the nodes of the outermost cell, the maximum radial displacement of nodes located on the symmetrical axis of the cell should be greater than the maximum radial displacement of nodes on both sides. For example, the values of the De node were 79.6% and 49% higher than the maximum radial displacement of A1 and B1, respectively, and D1 nodes were 212.5% and 420.8% higher than the maximum radial displacement values of A2 and B2, respectively. Perhaps this was because node De was connected to Ae and Be, while node D1 was connected to A1 and B1, and the load of the nodes on both sides was transferred radially to the inner layer’s D node. As shown in the figure, the radial displacement of all the nodes, except for node Be, underwent varying degrees of instantaneous fluctuations at 180° and 200°, with the fluctuation degree at 180° being smaller than at 200°. That is because, during the compression process, the cell walls AD and BD bent in the opposite direction of rotation, and at 180°, the compression reached the maximum bending degree and then began to unload, causing fluctuations in the transient stage. At 200°, the bending direction of the cell wall suddenly changed, resulting in significant fluctuations.
The analysis of each node in cell column I shows that the stress peaks, maximum radial displacement, and energy changes of Ae, Be, and De are significantly greater than those of the other nodes, with the De node changes being more significant than the first two. However, due to direct contact with the loading plate, the Ae and Be nodes have unique deformation characteristics. Therefore, the following section mainly analyzes the effects of compression ratio and rotational speed on the deformation characteristics of the Ae, Be, and De nodes.

3.3. Deformation Characteristics under Different Compression Rates

In Section 3.3 and Section 3.4, for the Ae, Be, and De nodes in the roller-shaped DVWH structure, based on numerical simulation results, the equivalent stress and radial displacement variation curves of these nodes under different compression rates and rotational speeds are plotted. Preliminary analysis was conducted from the curves’ peak size, variation amplitude, and fluctuation degree.

3.3.1. Deformation Characteristics of Node Ae

Figure 6 shows the equivalent stress and radial displacement of Ae nodes under different compression ratios (10–15%) at a line speed of 320 mm/s. The majority of the partial layout in Figure 6b is a stacked Y-axis offset line map with dimensionless and physically meaningless vertical coordinates, only showing the differences between different curves.
The radial displacement trend of the Ae node at each compression rate was the same. As it approached the loading plate, it produced a radial displacement far from the roller axis and gradually increased in a stepped shape, contrary to the negative Poisson’s ratio effect of the honeycomb structure in the in-plane uniaxial compression experiment. This may be due to the fact that the tensile expansion effect of the negative Poisson’s ratio structure is more pronounced under quasi-static compression compared to dynamic load [45]. After making contact with the loading plate, the radial displacement of node Ae was limited. When the radius of the roller at node Ae was perpendicular to the loading plate, the radial displacement of node Ae reached its minimum value, which is the difference between the outer contour radius of the roller and the compression amount. After leaving the loading plate at node Ae, the radial displacement returned to its initial value and remained unchanged. In addition to the minimum radial displacement affected by compression, the difference between the curves is mainly reflected in the stepped increase stage of the radial displacement value before the Ae node makes contact with the loading plate. Compared with Figure 4a, it can be seen that the above stage is the stage where the Ae node produces the maximum equivalent stress peak. From the locally enlarged image in Figure 6b, it can be seen that the radial displacement curve was constantly in frequent small oscillations, and within the experimental range, the amplitude of small oscillations gradually decreased as the compression rate increased.
The compression rate had little effect on the stress variation characteristics of the Ae node. The Ae node’s stress was positively correlated with the compression rate during the entire roller rotation process. Due to curve oscillation, there was no strict correlation between the stresses at Ae nodes in the Ae-C to Be-R range. As the compression rate increased, the third stress curve peak value gradually decreased in the α-C to β-R range.

3.3.2. Deformation Characteristics of Node Be

This section mainly displays the Be node’s radial displacement and equivalent stress under different compression rates in the experimental results. Figure 7 shows the equivalent stress and radial displacement changes of node Be under different compression ratios (10–15%) at a linear speed of 320 mm/s.
It can be seen that the radial displacement changes curve of node Be was roughly symmetrical with that of the Ae node, except that the maximum radial displacement of node Be was after 180°. As the Be node approached the loading plate in cell column I, its radial position slowly approached the roller axis, opposite to the Ae node moving away from the roller axis. The reason for this is that the Ae node also exerted pressure on cell column I while moving away from the axis. Node Ae shifted outward from its original radius, causing a component of the pressure on column I to node toward the axis, leading to the behavior of the Be node approaching the axis. Macroscopically, it can also be seen as a manifestation of negative Poisson’s ratio effect. After the Be node left the loading plate, the rebound did not stop. The radial displacement of the Be node exceeded the original outer contour radius, and within the experimental range, the smaller the compression rate, the greater the radial displacement exceedance. The exceedance amplitude at a 10% compression rate was 1.84%, and the exceedance amplitude at a 15% compression rate was 0.68%. Subsequently, the radial displacement of the Be node began to exhibit an oscillation with gradually decreasing amplitude, and its value gradually approached the original outer contour radius. From the locally enlarged image, it can be seen that there are slight oscillations throughout the curve, and within the experimental range, the amplitude of these oscillations is negatively correlated with the compression rate.
Making a comparison with the equivalent stress curve of the Ae node, both of them in the α-C to β-R interval can be divided into three curve peaks, and the rotation angle of the roller at the time of the peak stress at the Be node was about 24° later. The effect of compression rate on the equivalent stress of the Be node can be divided into three situations. Before the first wave peak (160°), the higher the compression rate, the greater the stress value. There is no strict correlation between compression rate and stress value from the end of the first wave peak to β-R. After β-R, the higher the compression rate, the smaller the stress value, until the curve gradually approaches zero.

3.3.3. Deformation Characteristics of Node De

This section mainly displays the radial displacement and equivalent stress of the De node under different compression rates in the experimental results. Figure 8 shows the equivalent stress and radial displacement curves of node De under different compression ratios (10–15%) at a linear velocity of 320 mm/s.
Ignoring the influence of instantaneous fluctuations due to the compression of the loading plate, the curve in Figure 8b with a 15% compression rate reached its minimum value at 189.19°. As the compression rate decreased, the time when the corresponding curve reached its minimum value gradually advanced, and the curve with a 10% compression rate reached its minimum value at 180.74°. Affected by the Ae and Be nodes, the De node was displaced away from the roller axis near Ae-C and Be-R. From the partially enlarged image, it can be seen that before the roller rotated to about 142°, as the compression rate increased, the radial displacement corresponding to each rotation angle of the De node also increased. After the curve interleaved near 142°, the situation was opposite, and the radial displacement curve with a higher compression rate was lower than the radial displacement curve with a lower compression. In the locally enlarged image, it can also be seen that there were small oscillations at all times in the curve. The higher the compression rate, the smaller the amplitude of the small oscillations.
From Figure 8a, it can be seen that before Be-R, the greater the compression rate at each rotation angle, the greater the equivalent stress at the De node. After Be-R, the situation was the opposite; the higher the compression rate, the smaller the equivalent stress. Then, in the later stage of the same rotation cycle, the equivalent stress approached zero. The equivalent stress of the De node peaked at about 180° and was greatly affected by compression rate. The peak stress at a 15% compression rate was 230.97 MPa, which was 207.9% of the peak stress at a 10% compression rate. In addition, as the compression rate decreased, the magnitude of the decrease in the equivalent stress peak of the De node also decreased.

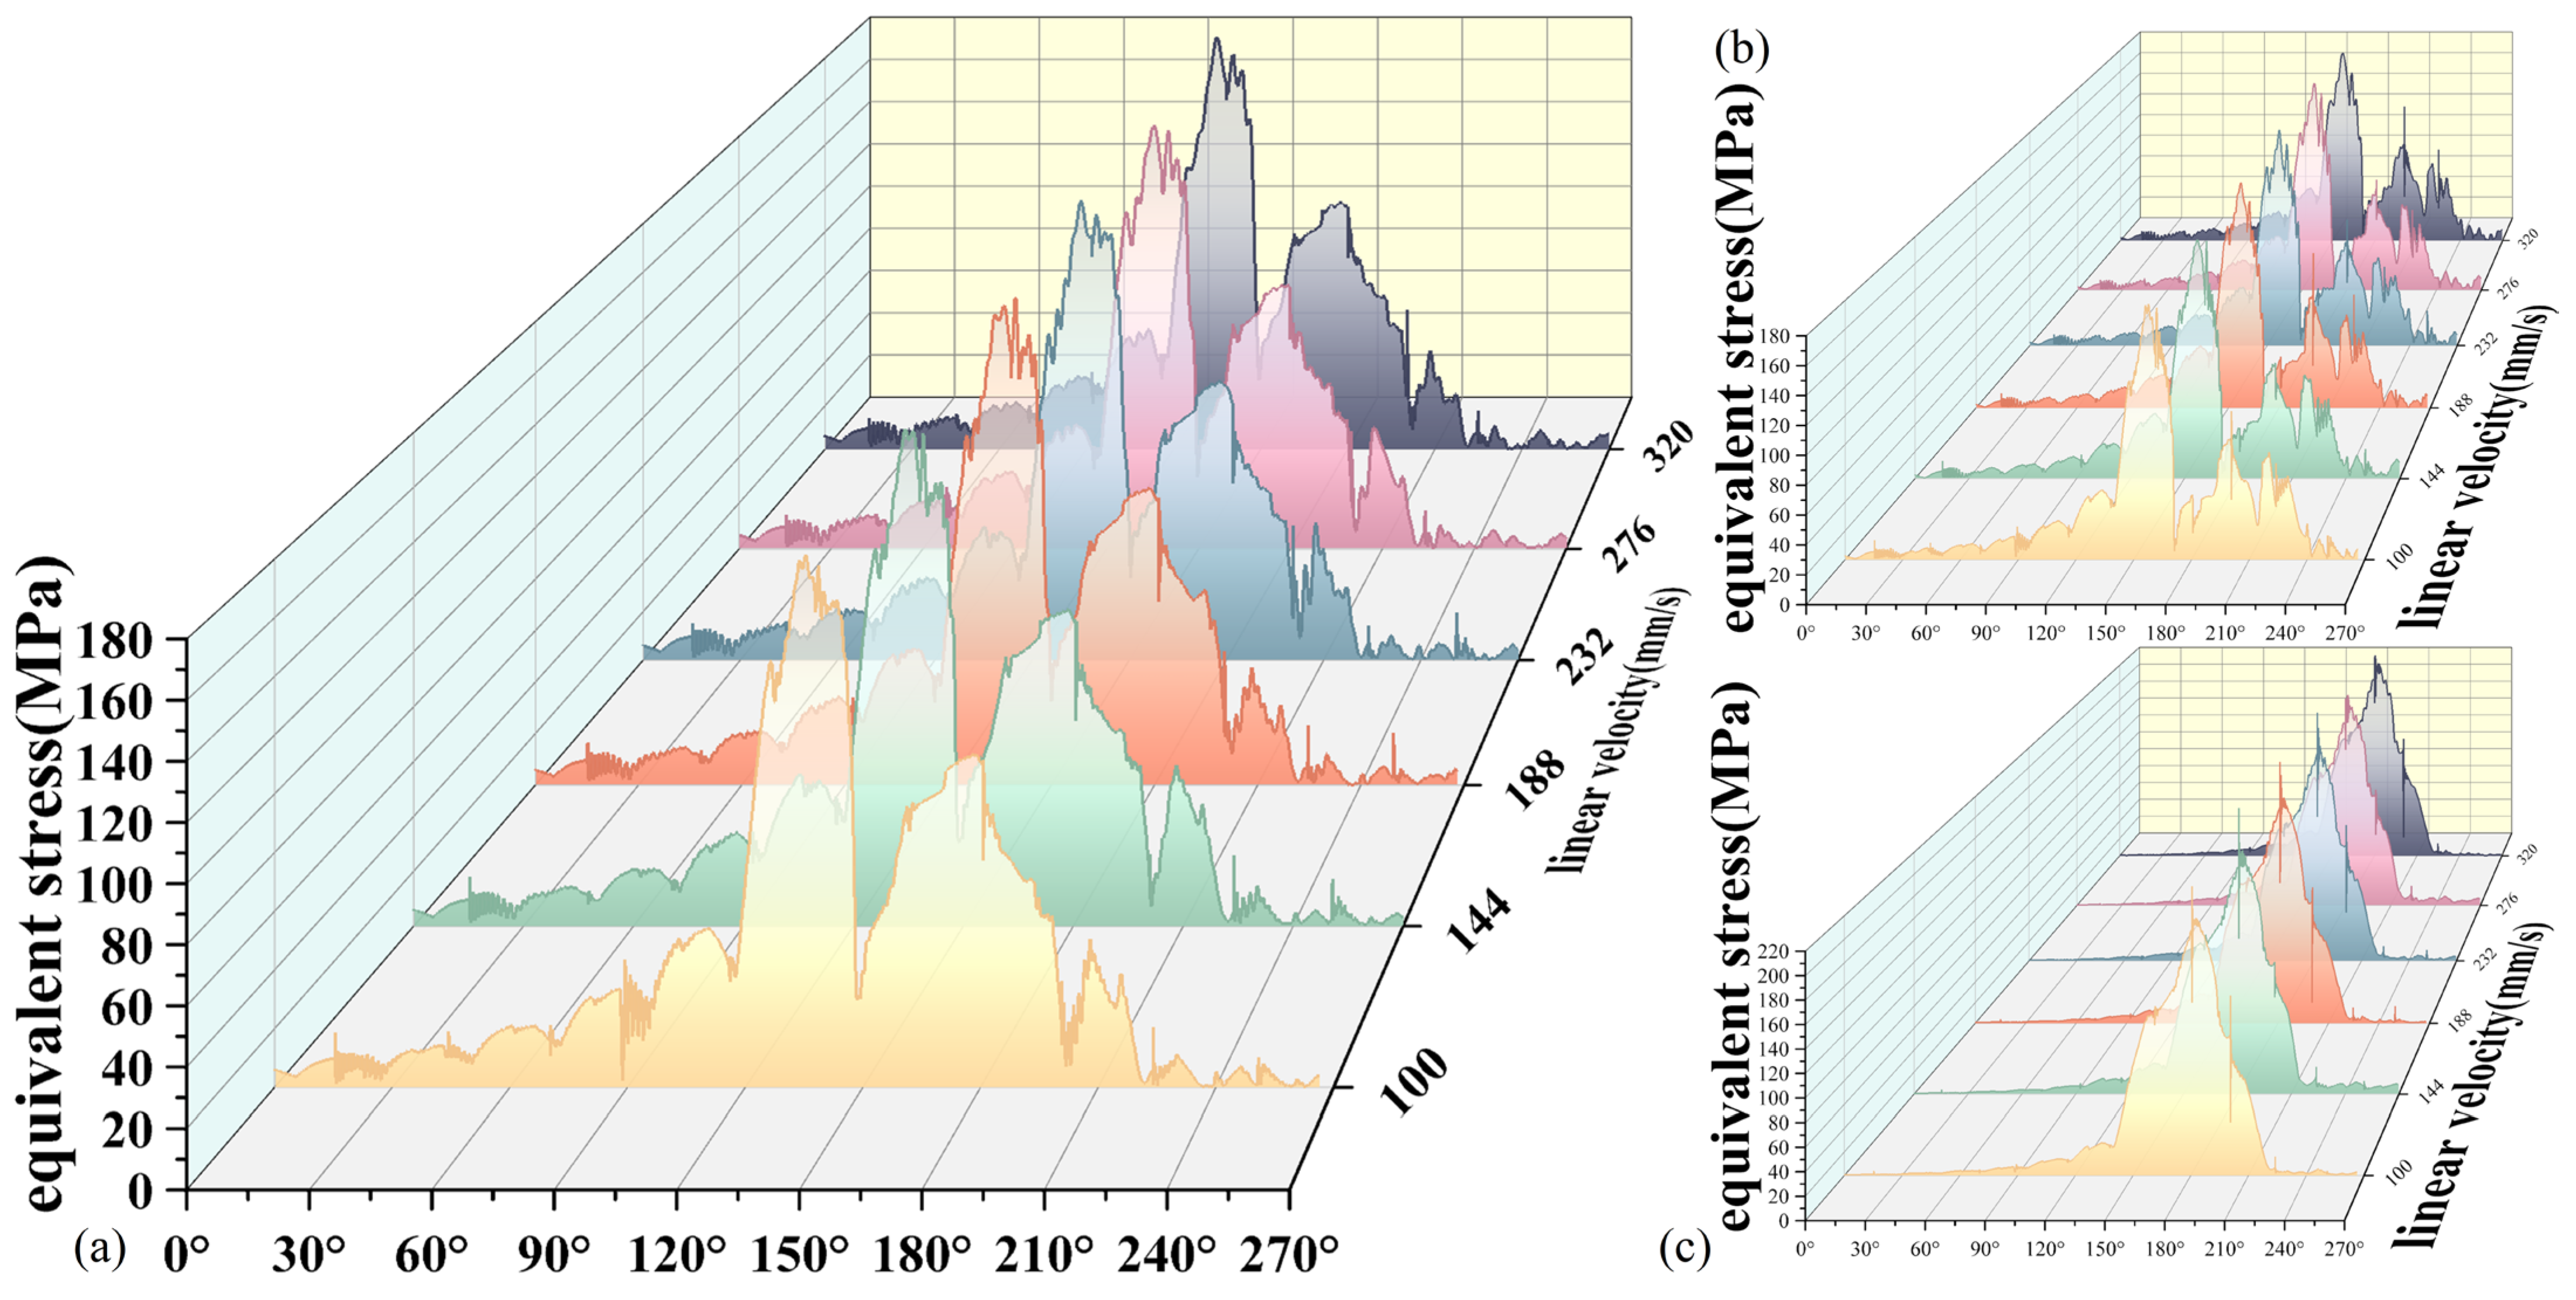
3.4. Deformation Characteristics under Different Rotation Rates

This section presents the equivalent stress and radial displacement curves of Ae, Be, and De nodes in the simulated feed experiment at different rotational speeds, and it conducts a preliminary analysis of the relationship between the changes in rotational speed and the equivalent stress and radial displacement. It was proposed to use the feed performance efficiency to evaluate the energy absorption efficiency of the roller.
Figure 9 and Figure 10 show the equivalent stress and radial displacement changes of nodes Ae, Be, and De at different linear speeds (100–320 mm/s) at a compression rate of 15%. The figure shows that under a 15% compression rate and a linear velocity range of 100 mm/s to 320 mm/s, the change in linear velocity had no significant effect on the equivalent stress and radial displacement of the Ae node. There were minor differences among them, such as small fluctuations occurring within the 200°–225° range of the radial displacement curve of Ae and De nodes and the 137.5°–156° range of Be nodes.
In order to evaluate the feed performance of roller honeycomb better, an evaluation index of feed performance efficiency (EF) was proposed, which can represent the node’s performance α-C to β-R, the energy absorption characteristics per unit area, and per unit time during the process. Figure 11 shows the variation of node EF at different linear speeds (100–320 mm/s) for nodes Ae, Be, and De at a compression rate of 15%. From the figure, it can be seen that under the condition of a 15% compression rate and a linear speed range of 100 mm/s to 320 mm/s, the EF also increased with the increase in rotational speed. Due to the limited numerical values of the experimental conditions, the EF curve in Figure 11 does not exhibit extreme values.

4. Discussion

Based on the numerical simulation results and curves presented in Section 3, this chapter further explores the deformation characteristics of nodes Ae, Be, and De, analyzes in depth the causes of equivalent stress and the radial displacement curve characteristics, explores the energy changes of nodes in critical travel, the sensitivity to radial displacement behavior after compression, and energy absorption efficiency, as well as the relationship between the compression rate and rotational speed.
Due to the contact with the loading plate at node Ae, according to its stress–strain rotation angle curve characteristics, the curve can be divided into three regions within the range α-C to β-R, namely stage I, stage II, and stage III, as shown in Figure 12a. The Ae node’s maximum stress and strain energy peaks occurred at the moment of contact with the loading plate, at 189.51 MPa and 421.91 MJ, respectively. Between Ae-C and Be-R, the stress curve generated a second peak, with an extreme value of 113.65 MPa. The curve generated a third peak before Be-R, with a peak of 45.49 MPa. At stage I, node Ae had not yet made contact with the loading plate, and the cell column α was starting to be squeezed by the loading plate and it was transmitting the load clockwise and backward; a wave peak in stage I was generated. As the roll-shaped honeycomb structure rotated, the attachment wings between the two cells became gradually parallel to the loading plate, and the equivalent stress at node Ae decreased until it made contact with the loading plate. During the contact process between the Ae node and the loading plate, the distance between Ae and the roller axis gradually decreased, forming a phase II wave peak. After the Ae node and loading plate contact was relieved, the curve entered stage III. Due to the effects of rotation and friction, the latter cell produced a circumferential tensile force on the cell where the Ae node was located, forming a peak range again until the Be node left the loading plate and stage III ended.
Figure 13 shows the relationship between the compression rate and the magnitude of work performed by the Ae and Be node equivalent stress in stages I, II, and III, as well as the percentage of work in each stage to the total amount. It can be seen from Figure 13a that within the range of 10% to 15% compression rate, as the compression rate increased, the total amount of equivalent stress work also increased. The amount of work performed in stages I and II was positively correlated with the compression rate. The amount of work performed in stage III decreased as the compression rate increased, and the decrease gradually slowed. The proportion of work performed in stage III decreased accordingly. When the compression rate increased, the increase in the proportion of work by equivalent stress in stage II was significantly greater than that in stage I. This phenomenon may be because as the compression rate increased, the compression degree of the roller-shaped honeycomb increased, the deformation degree of the cells near the loading plate increased, and the contact area between the plate and the loading plate increased. The node stresses in the three stages all increased to varying degrees, while the second stage was the interval between the Ae node and the loading plate, so the proportion of equivalent stress work performed by the nodes in the second stage also increased. Based on Figure 6b, it can be seen that, depending on the direction of rotation, the cells will accumulate in stage I and quickly return to their normal radial position after leaving the loading plate. Therefore, an increase in compression rate will strengthen the stacking effect of the cells before they make contact with the loading plate, while stage III gradually weakens or even disappears.
In Section 3.3.1, the phenomenon of the radial displacement of node Ae increasing in a stepped pattern before Ae-C was analyzed. This was due to the cell column α under the compression of the loading plate; the compression behavior being transmitted clockwise and backward; Ae in cell column I being subjected to the cell column α; the force transmitted from Be; the obtuse angle between the direction and the radial direction of column I; and the radial component of the stress nodes toward the outside of the roller. In addition, the compression effect weakened every time the stress was transmitted to a row of cells. Therefore, as cell column I approached the loading plate and moved away from the axis, the degree of distance gradually increased until Ae made contact with the loading plate.
Figure 13b shows that, similar to node Ae, the Be node’s equivalent stress change process can also be divided into three stages. As shown in Figure 12b, the Be node’s equivalent stress division interval was between Ae-C and β-R since Be made contact with the loading plate after the Ae node. Figure 13b shows the relationship between the compression rate and the amount of work performed by the equivalent stress at the Be node in stages I, II, and III, as well as the percentage of work performed in each stage to the total amount. Similar to the variation in equivalent stress at node Ae, within the experimental range of 10% to 15% compression rate, the total work performed by the equivalent stress at node Be increased as the compression rate increased. In stage I, there was a positive correlation between the work performed and the compression rate. In stage II, the amount of work performed was higher than 11%, with a compression rate of 10%, followed by a gradual increase in the work performed. The amount of work performed in stage III was slightly higher at an 11% compression rate than at 10%, and then the amount of work performed in stage III showed a downward trend. When different from the Ae node, the proportion of work performed by the Be node in stage II at each compression rate was about 30%, and the percentage of work performed by the Be node in stage III was higher than that of the Ae node. During the time the Be node was passing through the loading plate, the work performed in stages I and II increased as the compression rate increased. However, the work performed in stage I dominated. From Figure 7b, it can be seen that the Be node made contact with the loading plate near 175°, which means that in stage I, the Be node was subjected to stress transmitted from the Ae node through the Ce node, while in stage II, it was limited by the loading plate and was mainly affected by the force applied by the loading plate. It can be seen that the effect of the Ae node on the equivalent stress of the Be node was greater than that of the loading plate.
As shown in Figure 5, the Ae node exhibited displacement toward the outside of the roller before coming into contact with the loading plate, and the degree of outward displacement was affected by the compression rate. The difference between the maximum and minimum radial displacement of node Ae within one revolution of the roller is called the maximum radial displacement amplitude, ∆R. In order to study the effect of the compression rate on the radial displacement of nodes, radial displacement–compression sensitivity is proposed:
η = Δ R d
The ratio of the maximum radial displacement amplitude to the actual compression amount is used to evaluate the sensitivity of nodes’ radial position changes to the loading plate’s compression behavior in the feed mode.
Figure 14 shows the Ae node’s maximum radial displacement amplitude and radial displacement–compression sensitivity variation under different compression rates at a linear speed of 320 mm/s. It can be seen that within the experimental range, the value of η was the highest at a compression rate of 11%, with a slight change in the compression rate range of 10% to 13% and the highest change in the compression rate range of 13% to 14%. The overall trend of η changes decreased as the compression rate increased.
The Be node also experienced displacement toward the outside of the roller during stage III, which occurred after cell column I left the loading plate. Figure 15 shows node Be’s maximum radial displacement amplitude and radial displacement–compression sensitivity under different compression rates (10–15%) at a linear velocity of 320 mm/s. It can be seen that within the experimental range, the maximum radial displacement of the Be node during one revolution of the roller showed a decreasing trend. When the compression ratio was 12% and 13%, the radial displacement sensitivity of node Be suddenly decreased, and the sensitivity also showed a decreasing trend as the compression ratio increased.
Figure 16 shows the radial displacement–compression sensitivity of node De at different compression rates (10–15%) at a linear speed of 320 mm/s, as well as the rotation angle of the roller when reaching the maximum and minimum radial displacement. At a compression rate of 10%, the moment when the De node reached its maximum and minimum radial displacement was 134.42° and 180.74°, respectively. As the compression rate increased, the moment when it reached its maximum and minimum radial displacement gradually moved back. At a compression rate of 15%, the above moments were 139.06° and 189.19°, respectively. The difference in the moments when a node reaches its maximum and minimum radial displacement indicates that the compression rate affects the circumferential deformation of the cell. Since the rotation of the roller starts from the axis and transmits torque outwards, within the experimental range, the larger the compression rate, the greater the circumferential displacement of the cells in different layers after rotation, and the farther away from the axis, the greater the circumferential displacement.
Figure 17 shows the overall EF of cell column I under the experimental conditions of all the parameter combinations. It can be seen that whether grouped under a fixed speed or a fixed compression rate, the change in EF is positively correlated with speed and compression rate. As the compression rate increases, the growth of EF slows down, with its growth rate decreasing from 12.7% to 8.3%. The growth rate of EF with increasing speed is about 44%, indicating that the change in EF at a speed increment of 44 mm/s in the experiment is more significant than the change in compression rate by 1%. To some extent, it can be proposed that the roller DVWH structure in the uniform feed mode can improve its speed and compression rate and achieve higher energy absorption efficiency. Due to the limitations of the experimental parameter range, the peak EF structure was not demonstrated.

5. Conclusions

A series of numerical simulations were conducted in this work, and the nodes’ deformation characteristics were studied in the driven mode under different compression rates and rotational speeds, for a forest harvester roller filled with DVWH. The variation characteristics of equivalent stress and radial displacement of nodes were obtained. This work focused on the influence of compression rate and rotational speed on the equivalent stress and radial displacement of nodes near the loading side cell element. The following conclusions can be drawn:
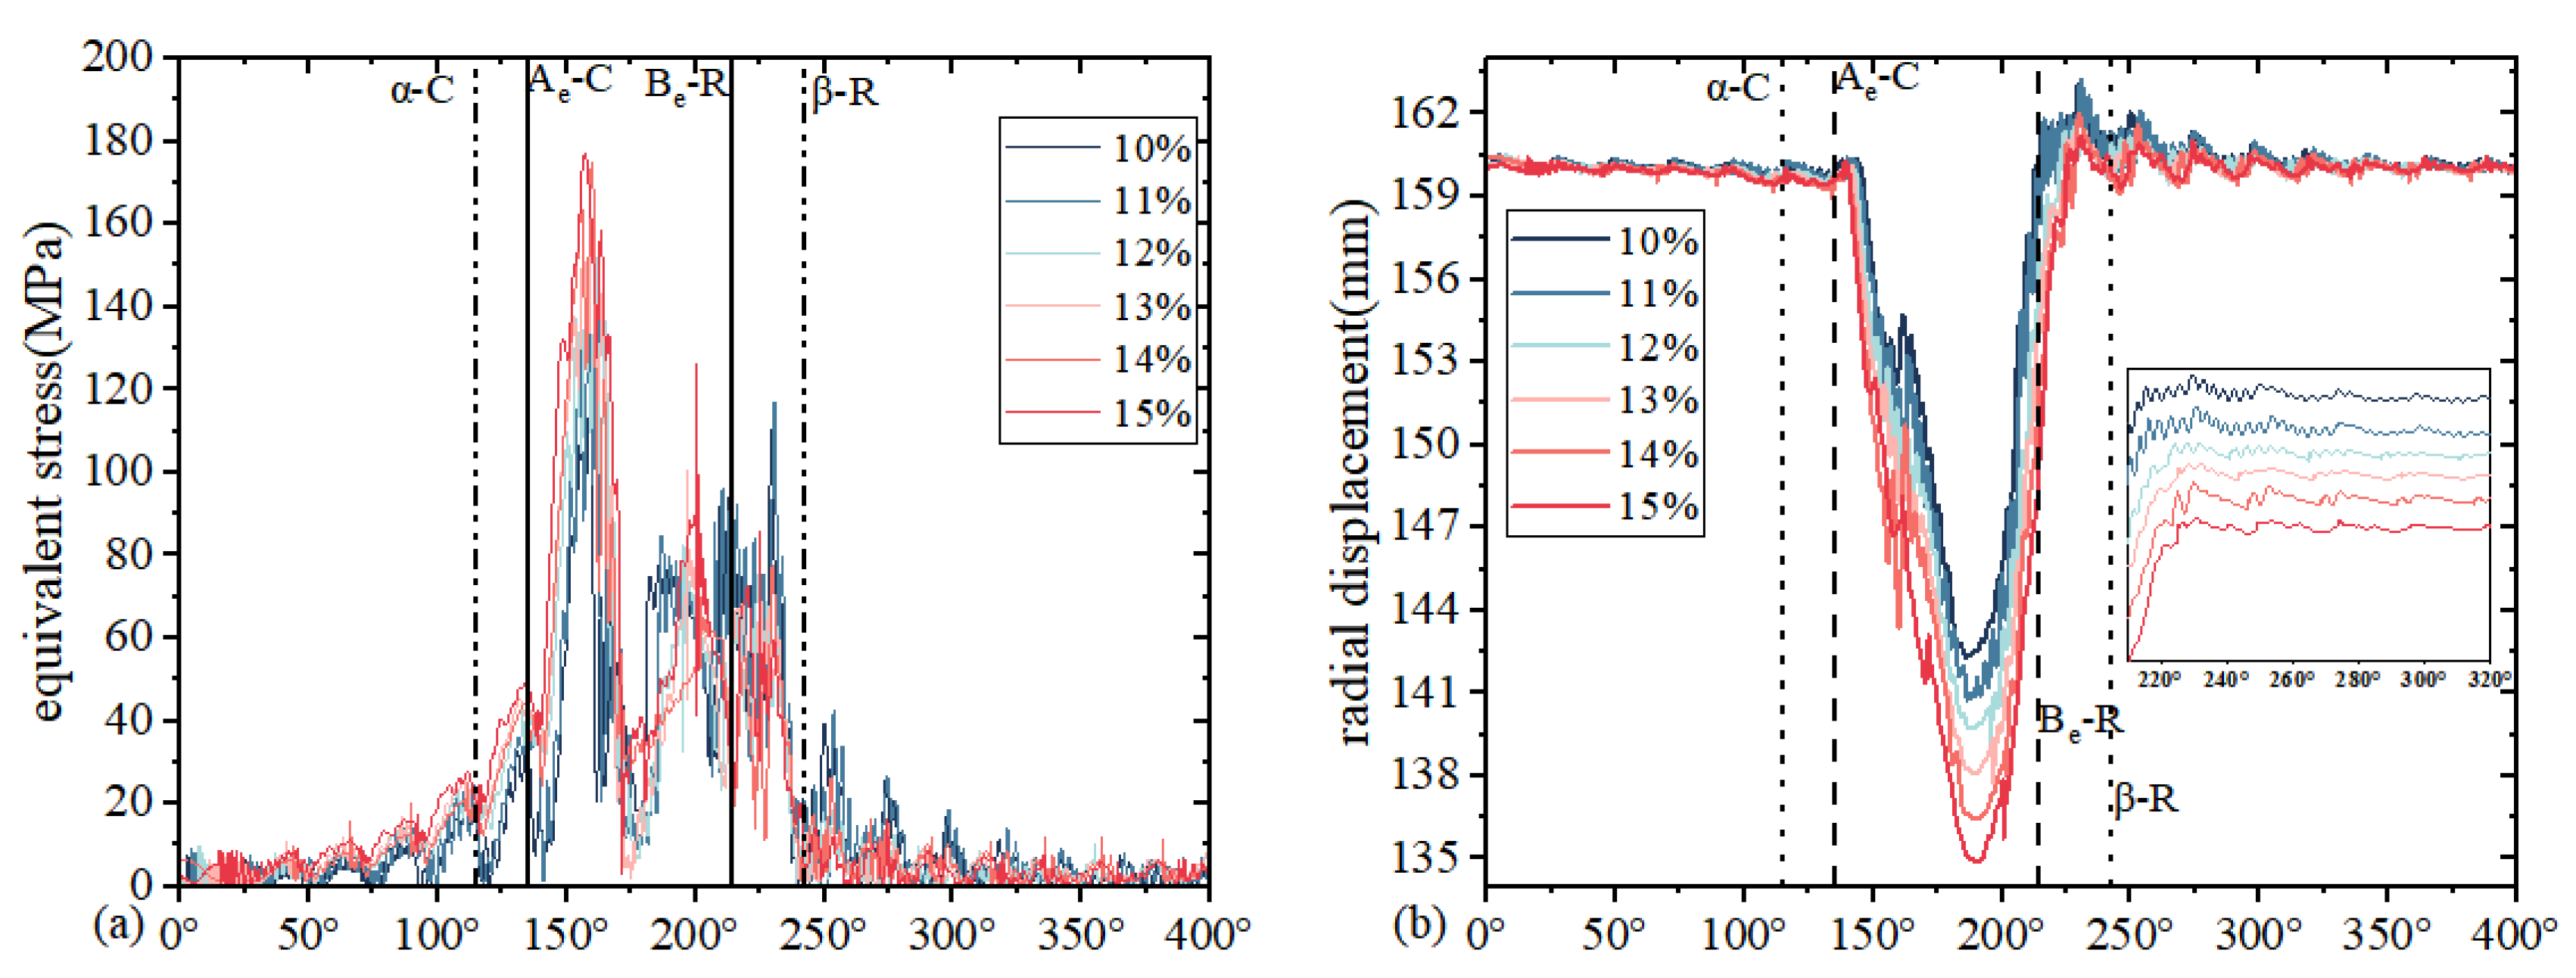
  • The numerical results indicated that the closer the node was to the loading side, the greater the equivalent stress and radial displacement. In the outermost cell element that made direct contact with the loading plate, the equivalent stress and radial displacement of De node were higher than those of the Ae node and Be node, with De’s peak equivalent stress being 21.9% and 30.6% higher than Ae’s and Be’s. In addition, its significant changes were concentrated in passing through the loading plate on the left and right sides of the cell column; that is, the roller rotates between 115° and 242.6°. In the short time before making contact with the loading plate, the load on the node is the highest.
  • Due to the different loading positions, the outermost cells’ deformation characteristics of the roller DVWH structure were different from those of the inner layer. The deformation characteristics of the former were related to the contact state of the loading plate and can be divided into three stages based on the equivalent stress curve characteristics: before contact, during contact, and after contact. The curve of the latter cannot reflect the boundaries of the above states.
  • Within the experimental range, the deformation characteristics of nodes were sensitive to compression rate, and the equivalent stress and radial displacement of nodes were positively correlated with compression rate. Taking De nodes as an example, at a 10% compression rate, their maximum changes in radial displacement were 14.93 mm, and the equivalent stress peak was 111.9 MPa. At a 15% compression rate, their maximum changes in radial displacement were 17.2 mm, and the equivalent stress peak was 230.9 MPa. The deformation characteristics of nodes were less sensitive to rotational speed. The radial displacement curves of Ae and De nodes with different rotational speeds only had differentiation in the range of 200°–225°, while the radial displacement curves of Be nodes with different rotational speeds only had differentiation in the range of 137.5°–156°.
  • At different compression rates, the radial displacement of nodes had different sensitivity to the degree of compression. Overall, the higher the compression rate, the less sensitive the radial displacement of nodes. At a compression rate of 10%, the radial displacement–compression sensitivities of Ae, Be, and De nodes are 1.294, 1.287, and 0.927, respectively. At a compression rate of 15%, the radial displacement–compression sensitivities of Ae, Be, and De nodes are 1.228, 1.096, and 0.717, respectively.
  • The compression rate impacted the deformation characteristics of nodes in the time domain, and an increase in compression rate would cause the moment when the node produces the maximum radial displacement to shift back, with a range of 1° to 3°.
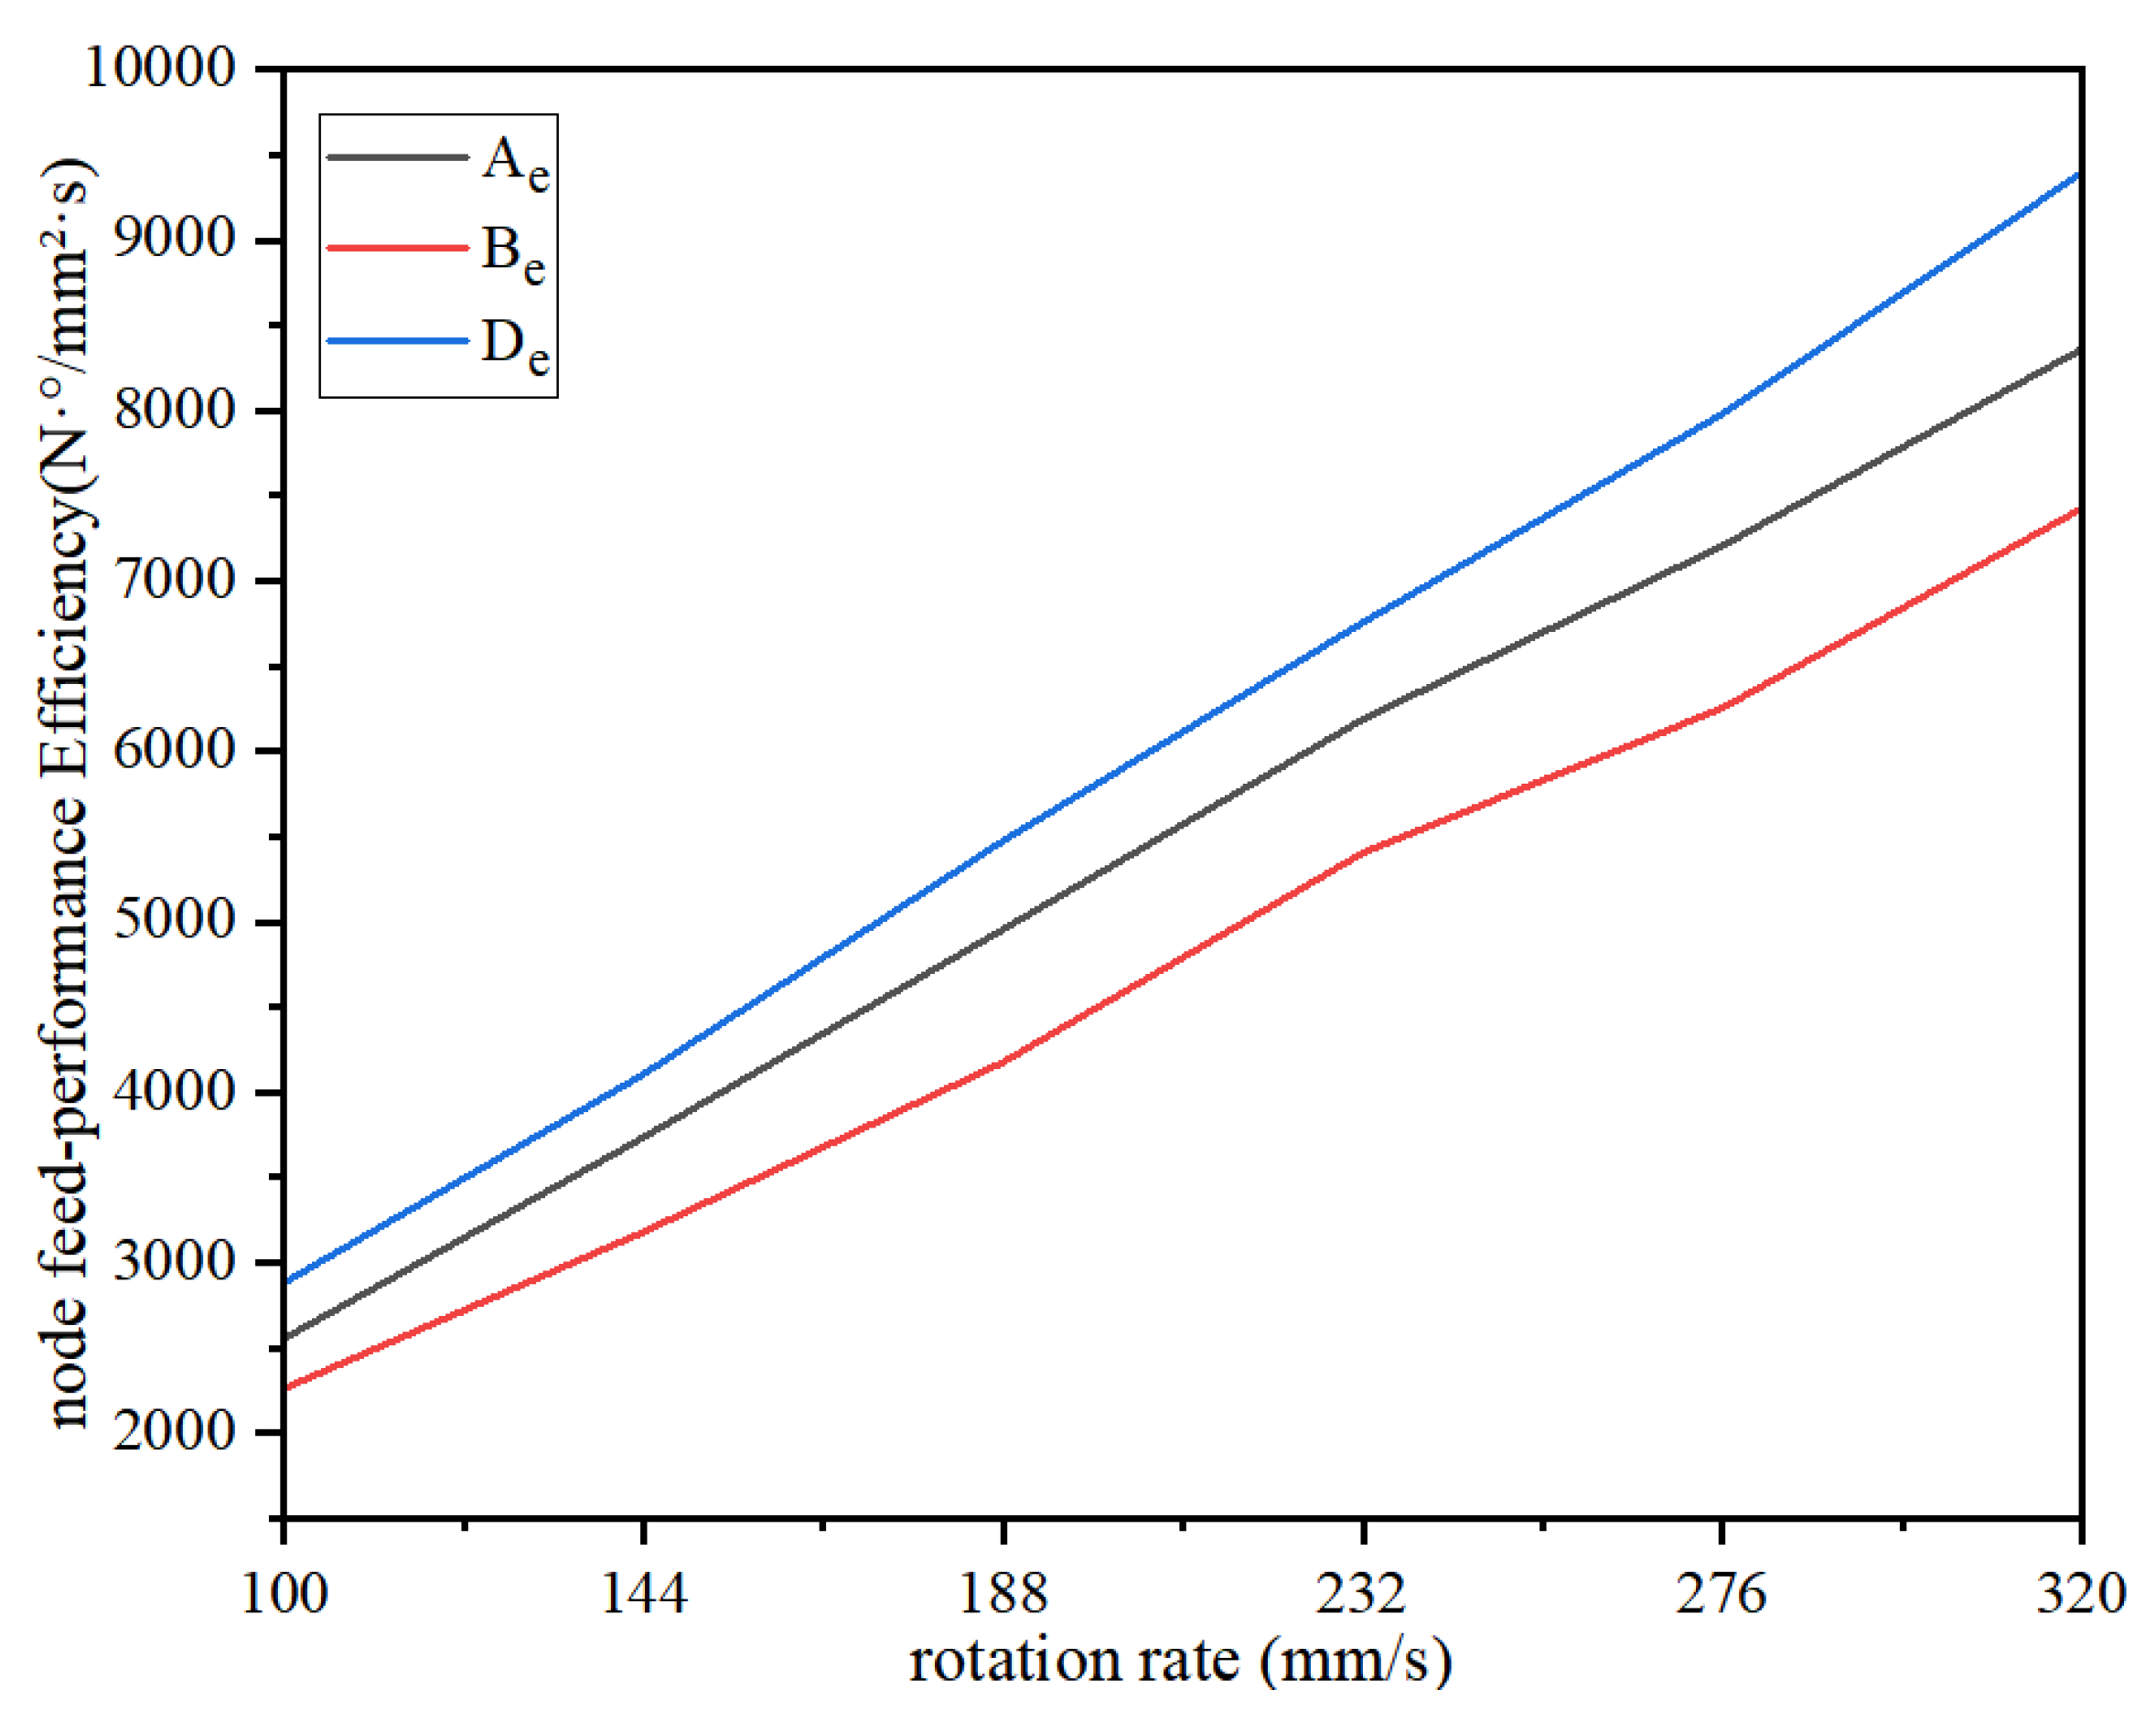
  • For the DVWH under the uniform driven mode, the energy absorption characteristics per unit area and per unit time reflected by the index feed performance efficiency (EF) positively correlate with the speed and compression rate. The EF increased the compression rate by 1% at a growth rate of 8.3% to 12.7% while increasing the compression rate by 44 mm/s at a growth rate of about 44%.

Author Contributions

Conceptualization, D.W.; methodology, W.Z. and D.W.; validation, W.Z.; formal analysis, W.Z.; investigation, D.W.; resources, D.W.; data curation, W.Z.; writing—original draft preparation, W.Z.; writing—review and editing, D.W.; visualization, W.Z.; supervision, D.W.; project administration, D.W.; funding acquisition, D.W. All authors have read and agreed to the published version of the manuscript.

Funding

This research was funded by contract research of non-government-funded projects (2022092803003).

Institutional Review Board Statement

Not applicable.

Informed Consent Statement

Not applicable.

Data Availability Statement

The data that support the findings of this study are available on request from the corresponding author.

Conflicts of Interest

The authors declare no conflicts of interest.

References

  1. Wang, Y.L. Review on China’s Plantation Development Since the Reform and Opening Up. For. Resour. Manag. 2019, 6–11. [Google Scholar] [CrossRef]
  2. Pu, S.; Liu, J.H. Development Process and Current Situation of Forestry Harvester Head. Mech. Eng. Autom. 2016, 219–221. [Google Scholar]
  3. Berendt, F.; de Miguel-Diez, F.; Wallor, E.; Blasko, L.; Cremer, T. Comparison of Different Approaches to Estimate Bark Volume of Industrial Wood at Disc and Log Scale. Sci. Rep. 2021, 11, 15630. [Google Scholar] [CrossRef] [PubMed]
  4. Nuutinen, Y.; Väätäinen, K.; Asikainen, A.; Prinz, R.; Heinonen, J. Operational Efficiency and Damage to Sawlogs by Feed Rollers of the Harvester Head. Silva Fenn. 2010, 44, 165. [Google Scholar] [CrossRef]
  5. Strandgard, M.; Walsh, D.; Mitchell, R. Productivity and Cost of Whole-tree Harvesting without Debarking in a Eucalyptus Nitens Plantation in Tasmania, Australia. South. For. J. For. Sci. 2015, 77, 173–178. [Google Scholar] [CrossRef]
  6. Lu, J.; Yang, T.B.; Di, X.H. Design for feed rollers of harvesting Head Based on Pro/Engineering. For. Eng. 2014, 30, 59–62. [Google Scholar] [CrossRef]
  7. Qu, Y.; Wang, D. Analyses on the Roller Structure of Equivalent Honeycombs for Forest Harvester under Impact Loading. Compos. Struct. 2021, 262, 113355. [Google Scholar] [CrossRef]
  8. Wang, Z. Recent Advances in Novel Metallic Honeycomb Structure. Compos. Part B Eng. 2019, 166, 731–741. [Google Scholar] [CrossRef]
  9. Qi, C.; Jiang, F.; Yang, S. Advanced Honeycomb Designs for Improving Mechanical Properties: A Review. Compos. Part B Eng. 2021, 227, 109393. [Google Scholar] [CrossRef]
  10. Álvarez Elipe, J.C.; Díaz Lantada, A. Comparative Study of Auxetic Geometries by Means of Computer-Aided Design and Engineering. Smart Mater. Struct. 2012, 21, 105004. [Google Scholar] [CrossRef]
  11. Yang, H.; Ma, L. Design and Characterization of Axisymmetric Auxetic Metamaterials. Compos. Struct. 2020, 249, 112560. [Google Scholar] [CrossRef]
  12. Yang, C.; Vora, H.D.; Chang, Y. Behavior of Auxetic Structures under Compression and Impact Forces. Smart Mater. Struct. 2018, 27, 025012. [Google Scholar] [CrossRef]
  13. Wang, Z.; Lu, Z.; Yao, S.; Zhang, Y.; Hui, D.; Feo, L. Deformation Mode Evolutional Mechanism of Honeycomb Structure When Undergoing a Shallow Inclined Load. Compos. Struct. 2016, 147, 211–219. [Google Scholar] [CrossRef]
  14. Shen, J.; Ge, J.; Xiao, J.; Liang, J. In-Plane Impact Dynamics of Honeycomb Structure Containing Curved Reentrant Sides with Negative Poisson’s Ratio Effect. Mech. Adv. Mater. Struct. 2022, 29, 1489–1497. [Google Scholar] [CrossRef]
  15. Shao, Y.; Meng, J.; Ma, G.; Ren, S.; Fang, L.; Cao, X.; Liu, L.; Li, H.; Wu, W.; Xiao, D. Insight into the Negative Poisson’s Ratio Effect of the Gradient Auxetic Reentrant Honeycombs. Compos. Struct. 2021, 274, 114366. [Google Scholar] [CrossRef]
  16. Li, Z.; Liu, D.; Qian, Y.; Wang, Y.; Wang, T.; Wang, L. Enhanced Strength and Weakened Dynamic Sensitivity of Honeycombs by Parallel Design. Int. J. Mech. Sci. 2019, 151, 672–683. [Google Scholar] [CrossRef]
  17. Zhang, E.T.; Liu, H.; Ng, B.F. Mechanics of Re-Entrant Anti-Trichiral Honeycombs with Nature-Inspired Gradient Distributions. Int. J. Mech. Sci. 2023, 259, 108597. [Google Scholar] [CrossRef]
  18. Liu, W.; Zhang, Y.; Guo, Z.; Li, D.; Zhao, S.; Xie, W. Analyzing In-Plane Mechanics of a Novel Honeycomb Structure with Zero Poisson’s Ratio. Thin-Walled Struct. 2023, 192, 111134. [Google Scholar] [CrossRef]
  19. Zou, Q.L.; Zhou, X.L.; Wang, R.Z.; Liu, H.; Liu, Y. Energy evolution of hexagonal honeycomb under different graded cyclic loading and unloading modes. J. Chongqing Univ. 2023, 46, 45–55. [Google Scholar]
  20. Zou, Q.; Zhou, X.; Wang, R.; Ning, Y.; Chen, Z.; Kong, F.; Liu, Y. Load-Carrying and Energy-Absorbing Performance of Honeycombs with Different Cross Sections under Cyclic Loading. Mater. Today Commun. 2022, 33, 104582. [Google Scholar] [CrossRef]
  21. Wu, X.; Yu, H.; Guo, L.; Zhang, L.; Sun, X.; Chai, Z. Experimental and Numerical Investigation of Static and Fatigue Behaviors of Composites Honeycomb Sandwich Structure. Compos. Struct. 2019, 213, 165–172. [Google Scholar] [CrossRef]
  22. Chen, S.; Tan, X.; Hu, J.; Zhu, S.; Wang, B.; Wang, L.; Jin, Y.; Wu, L. A Novel Gradient Negative Stiffness Honeycomb for Recoverable Energy Absorption. Compos. Part B Eng. 2021, 215, 108745. [Google Scholar] [CrossRef]
  23. Hao, Z.; Liu, C.; Wang, H.; Simon, J.-W.; Wang, J.; Li, Y. Crushing Behavior of Curved Nomex Honeycombs under Combined Shear-Compression Loads. Int. J. Mech. Sci. 2022, 228, 107480. [Google Scholar] [CrossRef]
  24. Kelvina Florence, S.J.; Renji, K.; Subramanian, K. Modal Density of Honeycomb Sandwich Composite Cylindrical Shells Considering Transverse Shear Deformation. Int. J. Acoust. Vib. 2018, 23, 11241. [Google Scholar] [CrossRef]
  25. Ling, B.; Wei, K.; Qu, Z.; Fang, D. Design and Analysis for Large Magnitudes of Programmable Poisson’s Ratio in a Series of Lightweight Cylindrical Metastructures. Int. J. Mech. Sci. 2021, 195, 106220. [Google Scholar] [CrossRef]
  26. Wang, S.; Wang, H.; Ding, Y.; Yu, F. Crushing Behavior and Deformation Mechanism of Randomly Honeycomb Cylindrical Shell Structure. Thin-Walled Struct. 2020, 151, 106739. [Google Scholar] [CrossRef]
  27. Gao, Q.; Liao, W.H.; Wang, L. An Analytical Model of Cylindrical Double-Arrowed Honeycomb with Negative Poisson’s Ratio. Int. J. Mech. Sci. 2020, 173, 105400. [Google Scholar] [CrossRef]
  28. Abayazid, F.F.; Carpanen, D.; Ghajari, M. New Viscoelastic Circular Cell Honeycombs for Controlling Shear and Compressive Responses in Oblique Impacts. Int. J. Mech. Sci. 2022, 222, 107262. [Google Scholar] [CrossRef]
  29. Jin, X.; Hou, C.; Fan, X.; Sun, Y.; Lv, J.; Lu, C. Investigation on the Static and Dynamic Behaviors of Non-Pneumatic Tires with Honeycomb Spokes. Compos. Struct. 2018, 187, 27–35. [Google Scholar] [CrossRef]
  30. Suvanjumrat, C.; Rugsaj, R.; Phromjan, J. Comparison of Two Different Surface for Rolling Airless Tire by Finite Element Method. IOP Conf. Ser. Mater. Sci. Eng. 2021, 1137, 012023. [Google Scholar] [CrossRef]
  31. Zang, L.; Wang, X.; Yan, P.; Zhao, Z. Structural Design and Characteristics of a Non-Pneumatic Tire with Honeycomb Structure. Mech. Adv. Mater. Struct. 2022, 29, 4066–4073. [Google Scholar] [CrossRef]
  32. Wu, T.; Li, M.; Zhu, X.; Lu, X. Research on Non-Pneumatic Tire with Gradient Anti-Tetrachiral Structures. Mech. Adv. Mater. Struct. 2021, 28, 2351–2359. [Google Scholar] [CrossRef]
  33. Li, Y.W.; Zang, L.G.; Lv, T. Omtimization design and research of honeycomb porous structure spoke plate non-pneumatic tire. J. Chongqing Univ. Technol. Sci. 2022, 36, 25–33. [Google Scholar]
  34. Genovese, A.; Garofano, D.; Sakhnevych, A.; Timpone, F.; Farroni, F. Static and Dynamic Analysis of Non-Pneumatic Tires Based on Experimental and Numerical Methods. Appl. Sci. 2021, 11, 11232. [Google Scholar] [CrossRef]
  35. Ku, L.; Fu, H.; Chen, K.; Zhang, J.; Bi, S.; Zhou, L. Numerical Analysis of Steady-State Mechanical Characteristics of the Flexible Spoke Non-Pneumatic Tire under Multiple Working Conditions. J. Terramechan. 2023, 106, 35–45. [Google Scholar] [CrossRef]
  36. Ganniari-Papageorgiou, E.; Chatzistergos, P.; Wang, X. The Influence of the Honeycomb Design Parameters on the Mechanical Behavior of Non-Pneumatic Tires. Int. J. Appl. Mech. 2020, 12, 2050024. [Google Scholar] [CrossRef]
  37. Deng, Y.; Zhao, Y.; Lin, F.; Xiao, Z.; Zhu, M.; Li, H. Simulation of Steady-State Rolling Non-Pneumatic Mechanical Elastic Wheel Using Finite Element Method. Simul. Model. Pract. Theory 2018, 85, 60–79. [Google Scholar] [CrossRef]
  38. Wang, D.; Wang, D.; Liu, J.H.; Huang, Q.Q. Mechanics Characteristics of Feeding Roller Filled with Honeycomb Structure. J. Northeast. For. Univ. 2020, 48, 93–99+104. [Google Scholar] [CrossRef]
  39. Zhu, X.C.; Wang, D.; Liu, J.H.; Huang, Q.Q. Coupling relationship between structure parameters of double-V-wings honeycomb whit negative Poisson’s ratio and log contact area. J. Huazhong Agric. Univ. 2021, 40, 253–260. [Google Scholar] [CrossRef]
  40. Zhang, G.Q.; Wang, D.; Qu, Y.F.; Liu, J.H. Radial compression response of honeycomb rollers with multi dense degrees for forest harvester. J. Beijing For. Univ. 2022, 44, 135–145. [Google Scholar]
  41. Larsen, U.D.; Signund, O.; Bouwsta, S. Design and Fabrication of Compliant Micromechanisms and Structures with Negative Poisson’s Ratio. J. Microelectromechanical Syst. 1997, 6, 99–106. [Google Scholar] [CrossRef]
  42. Qiao, J.X.; Chen, C.Q. Impact Resistance of Uniform and Functionally Graded Auxetic Double Arrowhead Honeycombs. Int. J. Impact Eng. 2015, 83, 47–58. [Google Scholar] [CrossRef]
  43. Ruan, D.; Lu, G.; Wang, B.; Yu, T.X. In-Plane Dynamic Crushing of Honeycombs—A Finite Element Study. Int. J. Impact Eng. 2003, 28, 161–182. [Google Scholar] [CrossRef]
  44. Qu, Y.F.; Wang, D.; Zhu, X.C. Analyses on key techniques and application performance of honeycomb feeding roller for forest combine harvester. J. Anhui Agric. Univ. 2021, 496–503. [Google Scholar] [CrossRef]
  45. Zhang, J.; Lu, G.; You, Z. Large Deformation and Energy Absorption of Additively Manufactured Auxetic Materials and Structures: A Review. Compos. Part B Eng. 2020, 201, 108340. [Google Scholar] [CrossRef]
Figure 1. The damage to logs and the feeding roller of LAKO 43 forest harvester [7].
Applsci 14 02082 g001
Figure 2. Schematic diagram of roller DVWH structure: (a) The feeding roller of the logging machine clamps trees. (b) Main structural parameters and naming of nodes and cell columns. (c) Idealized experimental methods.
Applsci 14 02082 g002
Figure 3. Finite element model for simulating driven experiment of roller DVWH structure.
Applsci 14 02082 g003
Figure 4. Equivalent stress and energy changes at various nodes in cell column I at 320 mm/s and 15% conditions: (a) Ae. (b) Be. (c) Ce. (d) De. (e) A1. (f) B1. (g) D1. (h) A2. (i) B2.
Applsci 14 02082 g004
Figure 5. Radial displacement of each node in cell column I at 320 mm/s and 15% conditions.
Applsci 14 02082 g005
Figure 6. Equivalent stress and radial displacement of node Ae under different compression ratios at a line speed of 320 mm/s: (a) equivalent stress and (b) radial displacement.
Applsci 14 02082 g006
Figure 7. Equivalent stress and radial displacement of node Be under different compression ratios (10–15%) at a line speed of 320 mm/s: (a) equivalent stress and (b) radial displacement.
Applsci 14 02082 g007
Figure 8. Equivalent stress and radial displacement changes of De nodes under different compression ratios (10%–15%): (a) equivalent stress and (b) radial displacement.
Applsci 14 02082 g008
Figure 9. Equivalent stress changes of nodes at different linear speeds (100–320 mm/s): (a) Ae node. (b) Be node. (c) De node.
Applsci 14 02082 g009
Figure 10. Radial displacement changes of nodes at different linear speeds (100–320 mm/s): (a) Ae node. (b) Be node. (c) De node.
Applsci 14 02082 g010
Figure 11. Node EF of Ae, Be, and De nodes at different linear speeds (100 mm/s–320 mm/s).
Applsci 14 02082 g011
Figure 12. Ae and Be nodes three stages division of period in α-C to β-R: (a) Ae. (b) Be.
Applsci 14 02082 g012
Figure 13. Work by the equivalent stress in the direction of rotation at Ae and Be points in stages I, II, and III under different compression rates at a line speed of 320 mm/s: (a) Ae and (b) Be.
Applsci 14 02082 g013
Figure 14. Radial displacement–compression sensitivity of Ae node at different compression rates at a line speed of 320 mm/s.
Applsci 14 02082 g014
Figure 15. Radial displacement–compression sensitivity of Be point at different compression rates at a line speed of 320 mm/s.
Applsci 14 02082 g015
Figure 16. Radial displacement–compression sensitivity and rotation angle at maximum and minimum radial displacement of De point under different compression rates at a line speed of 320 mm/s.
Applsci 14 02082 g016
Figure 17. Overall EF of cell column I under different linear speeds (100 mm/s–320 mm/s) and compression ratios (10–15%).
Applsci 14 02082 g017
Table 1. Main structural parameters of the DVWH structure model.
R/mmR0/mmt/mmθ1θ2r/mmLT/mm
160.1683.530°75°20.3350
Table 2. Setting the value of compression rate ε and speed υ.
ParameterValue
ε 10%11%12%13%14%15%
v (mm/s)100144188232276320
Disclaimer/Publisher’s Note: The statements, opinions and data contained in all publications are solely those of the individual author(s) and contributor(s) and not of MDPI and/or the editor(s). MDPI and/or the editor(s) disclaim responsibility for any injury to people or property resulting from any ideas, methods, instructions or products referred to in the content.

