
Flexural Behavior of a New Precast Insulation Mortar Sandwich Panel

Abstract
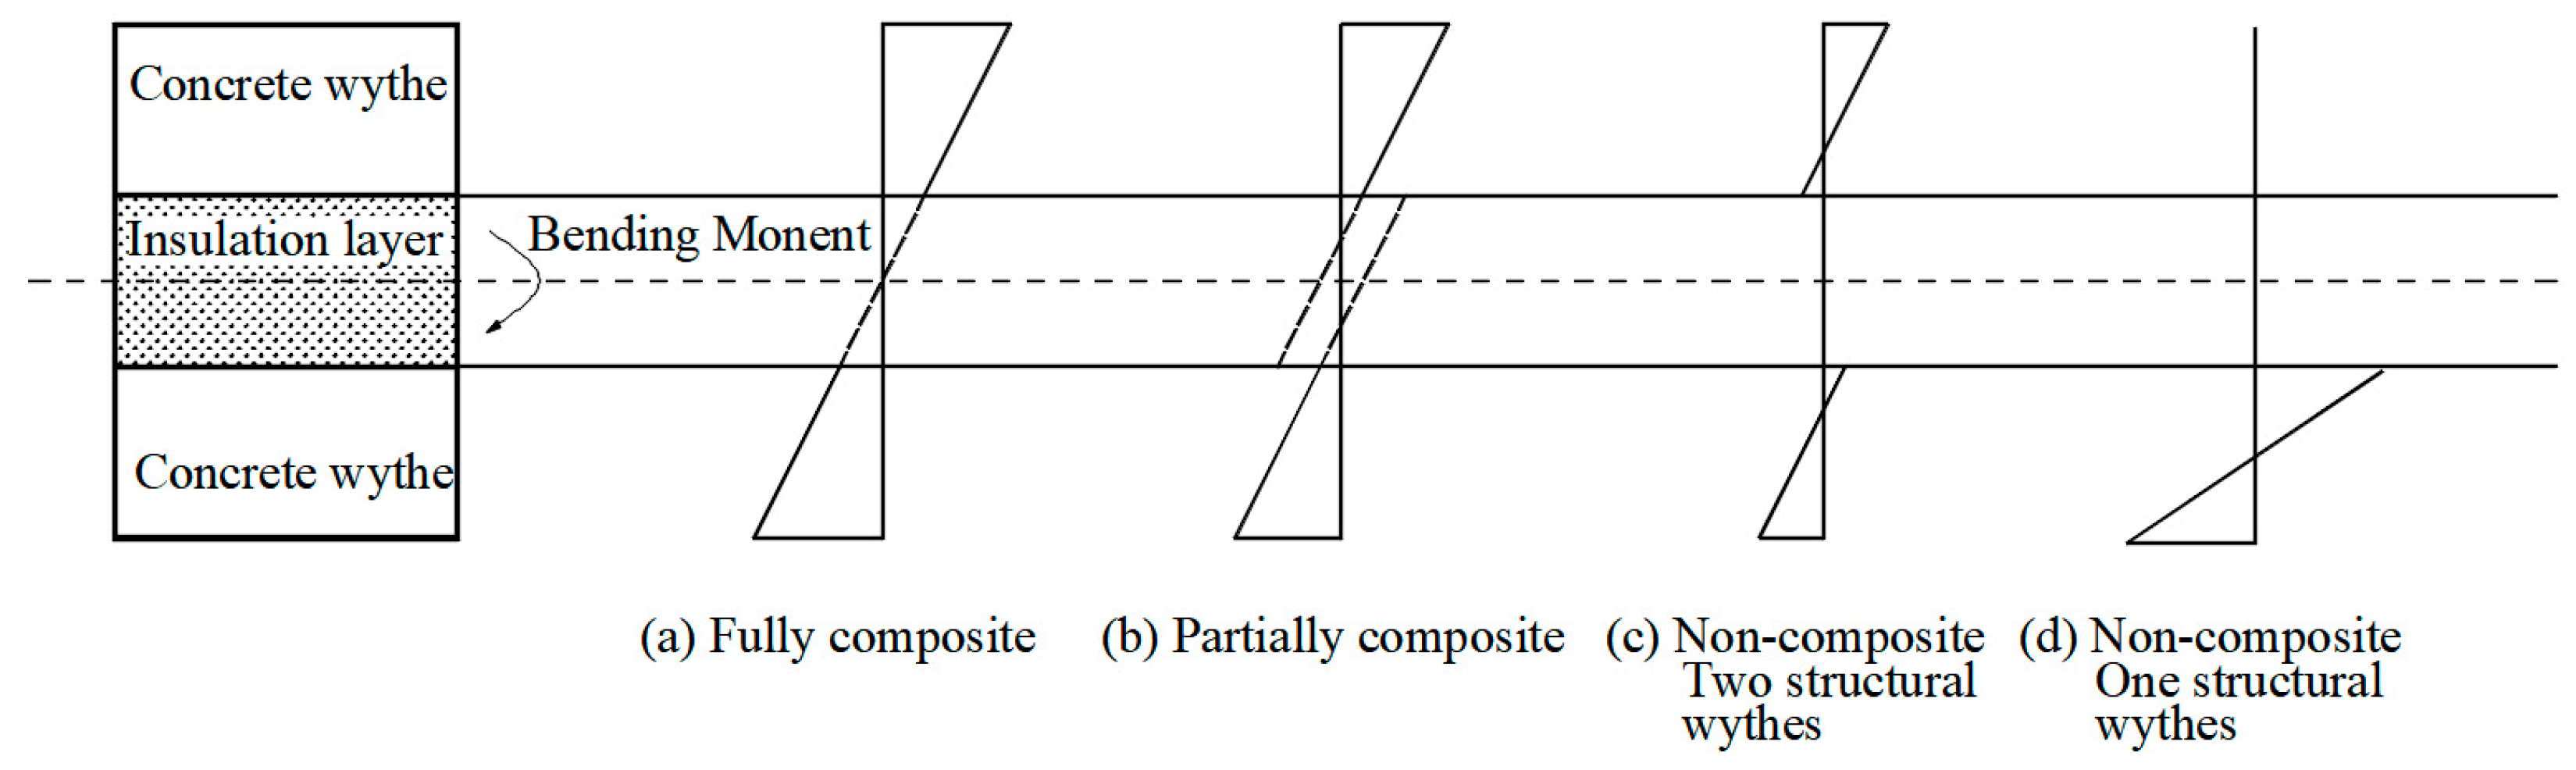
1. Introduction
2. Experimental Investigations
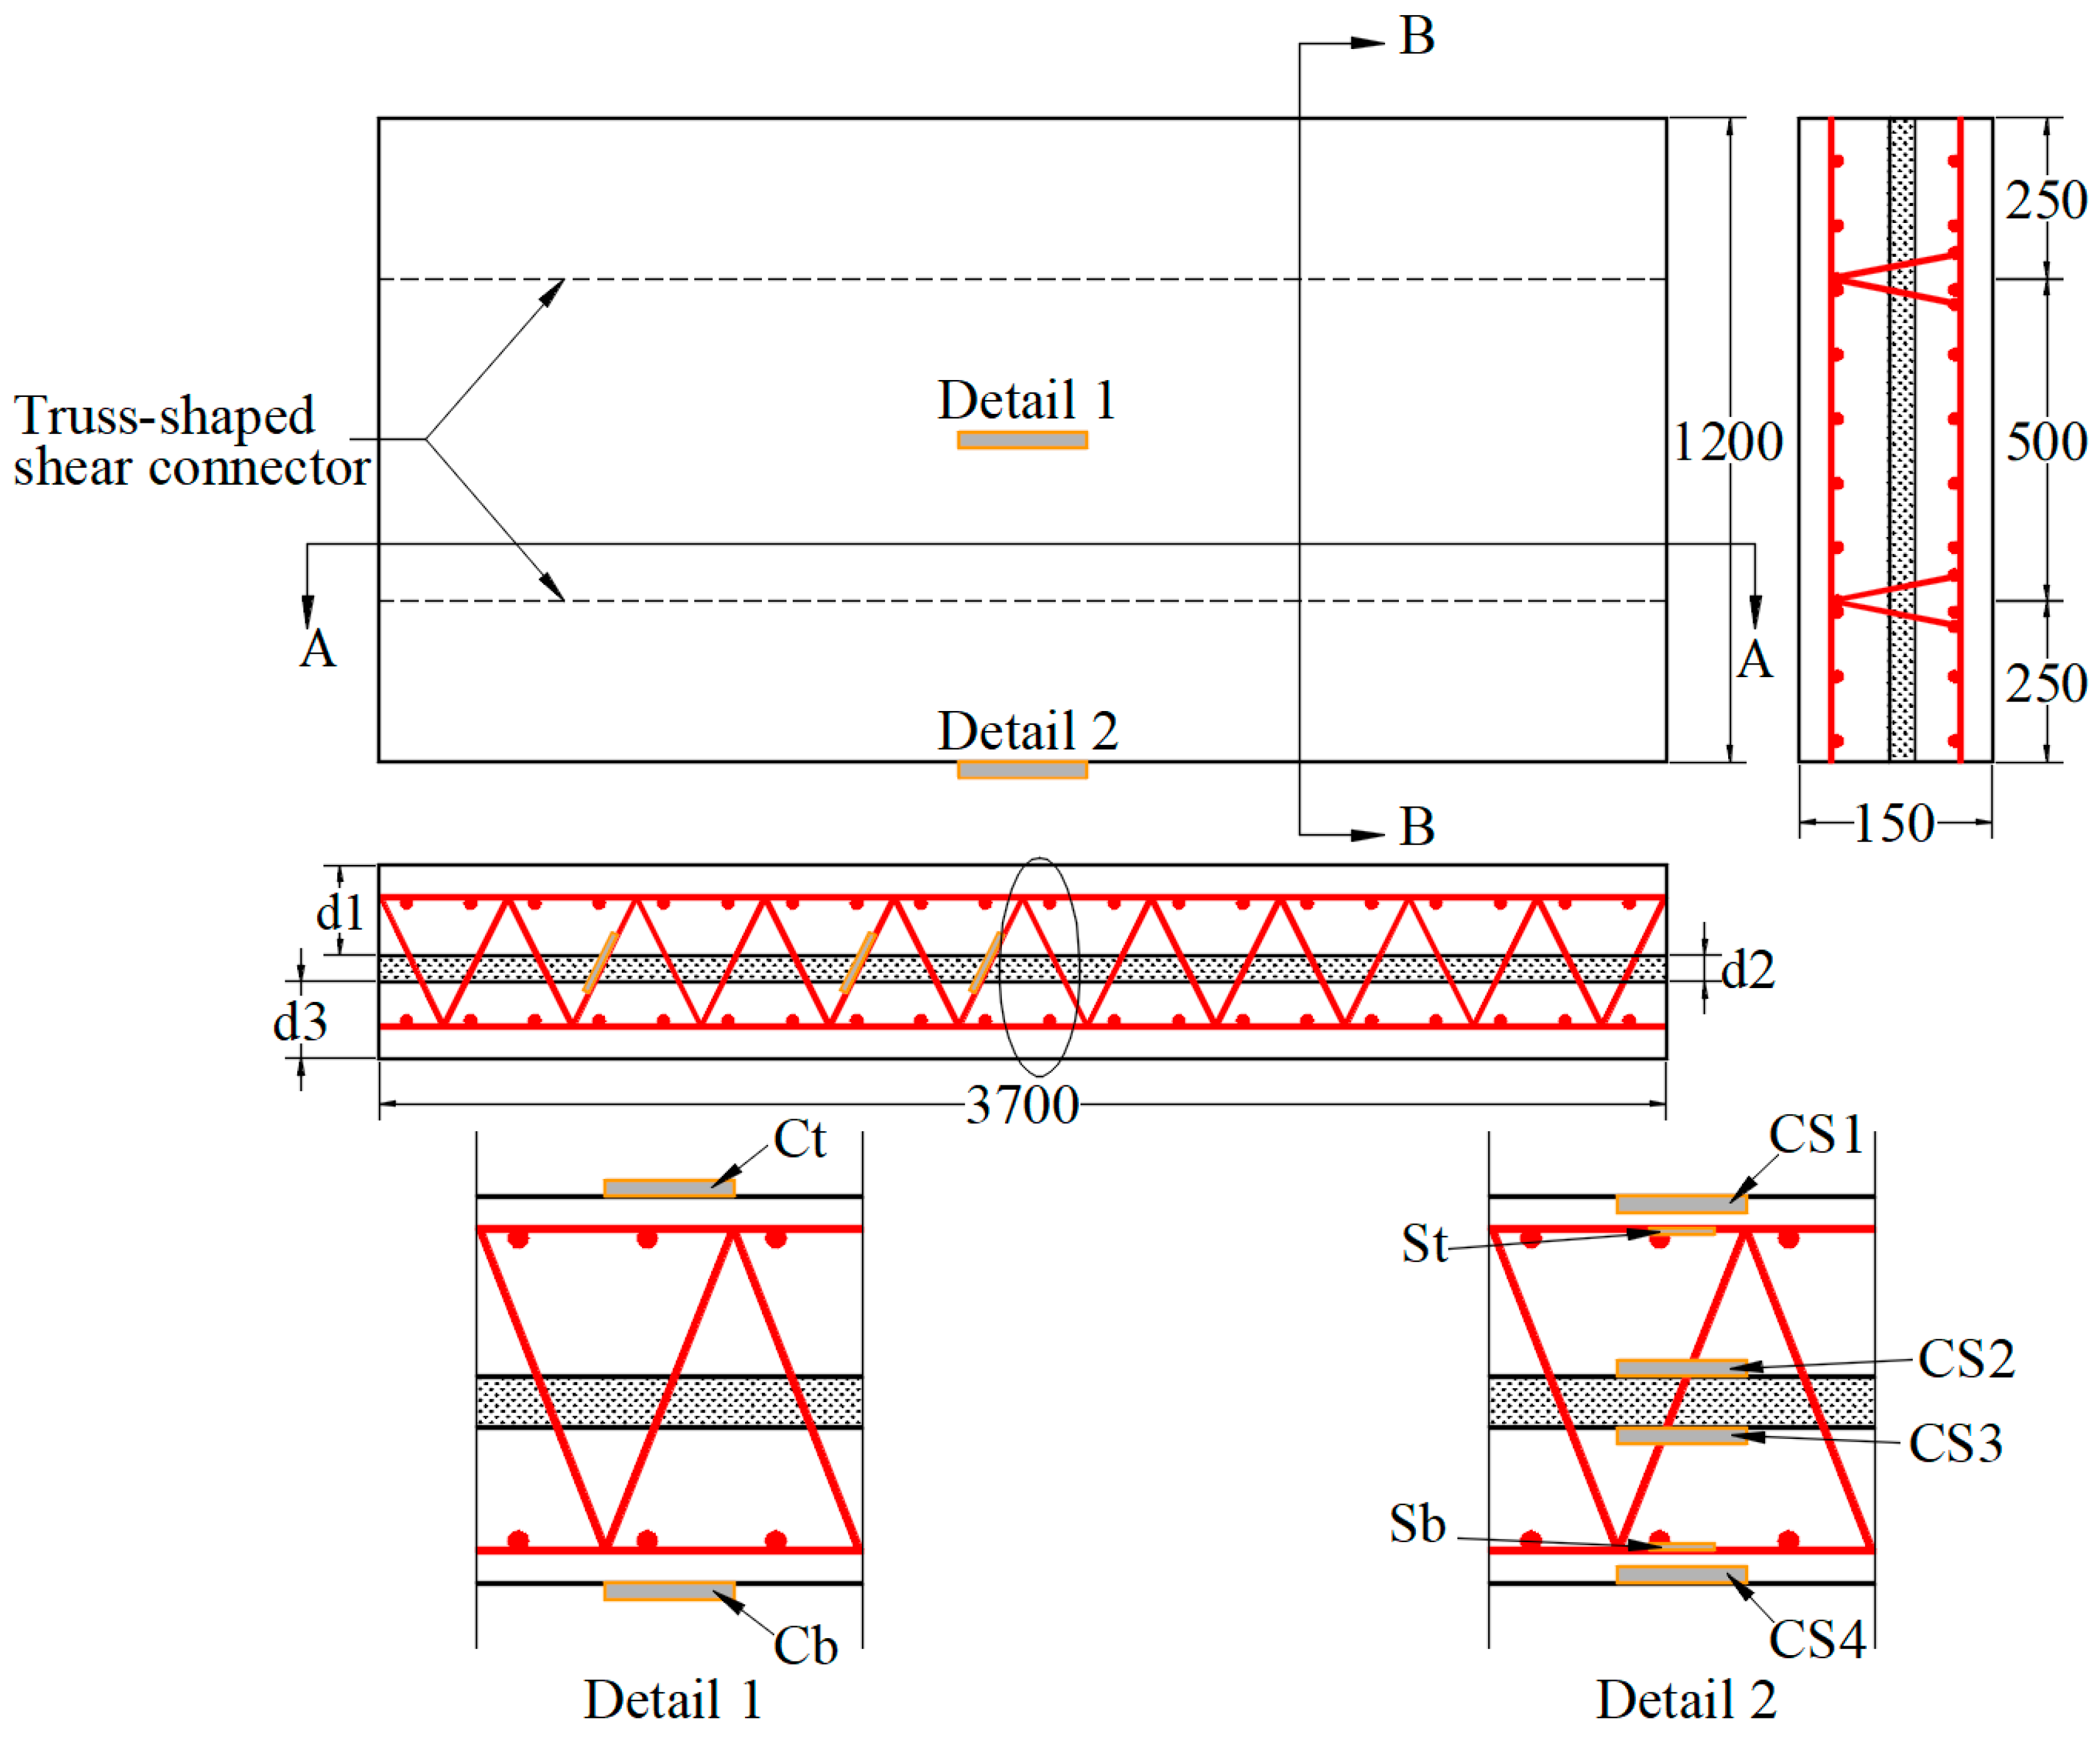
2.1. Design of Panels
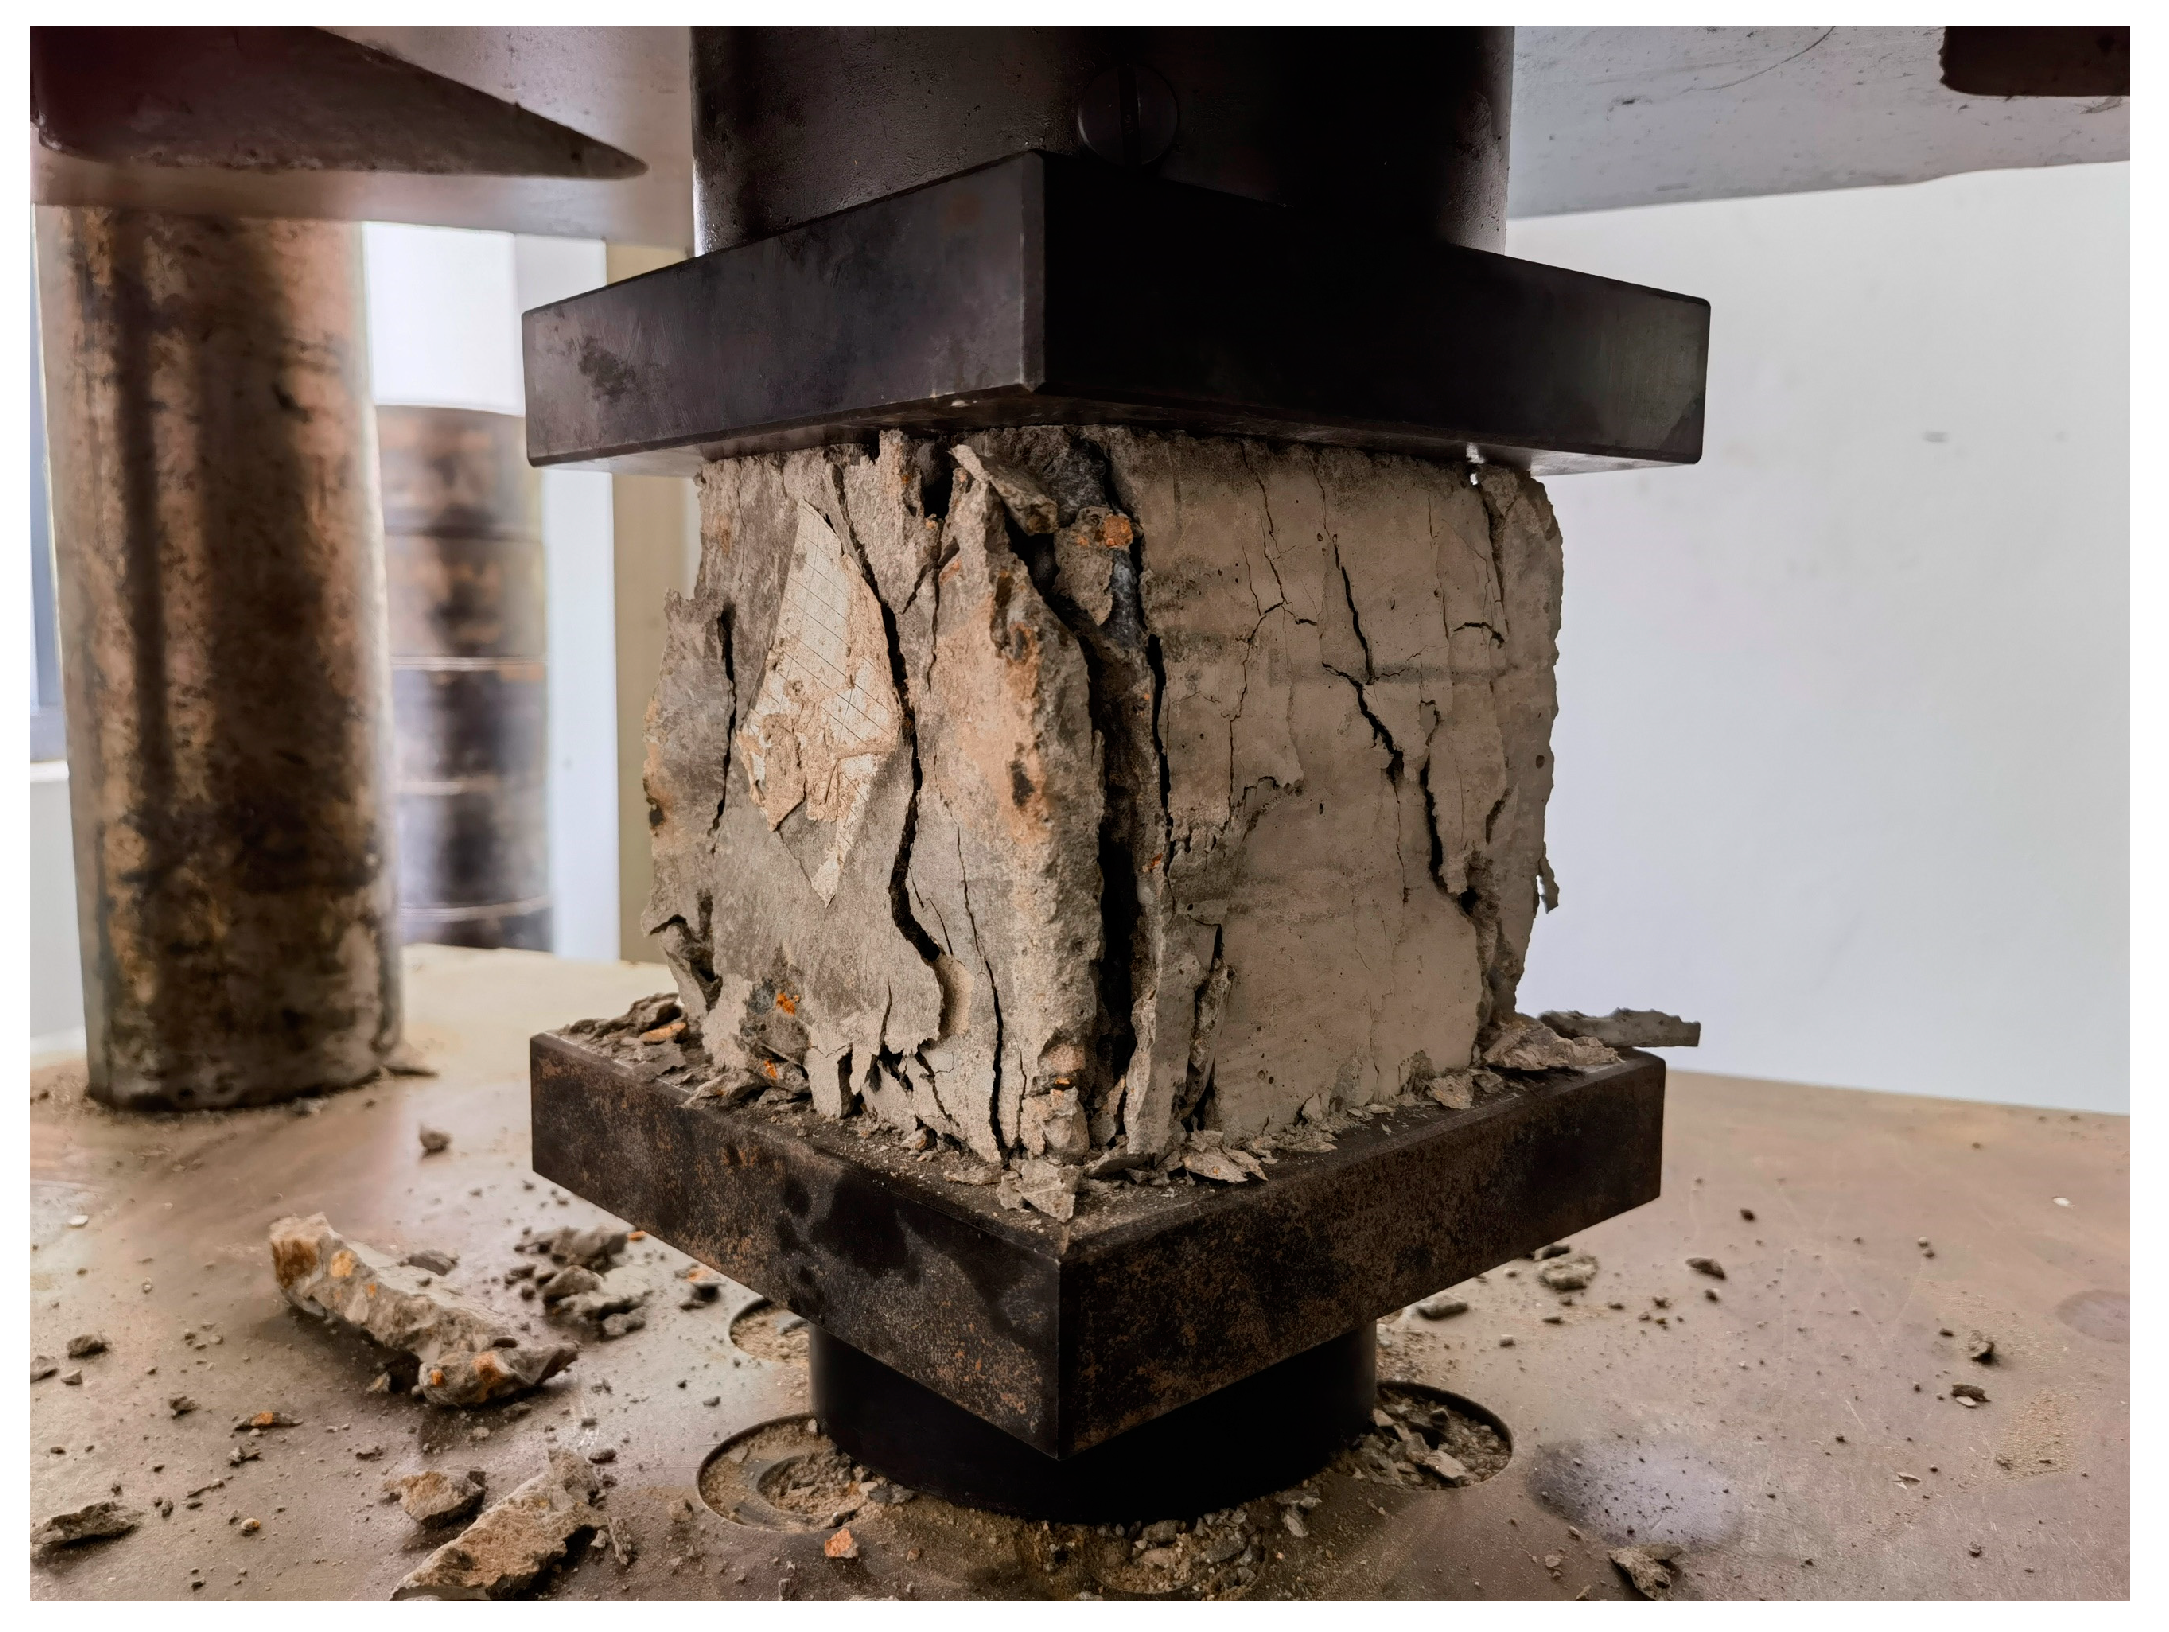
2.2. Material Properties and Specifications
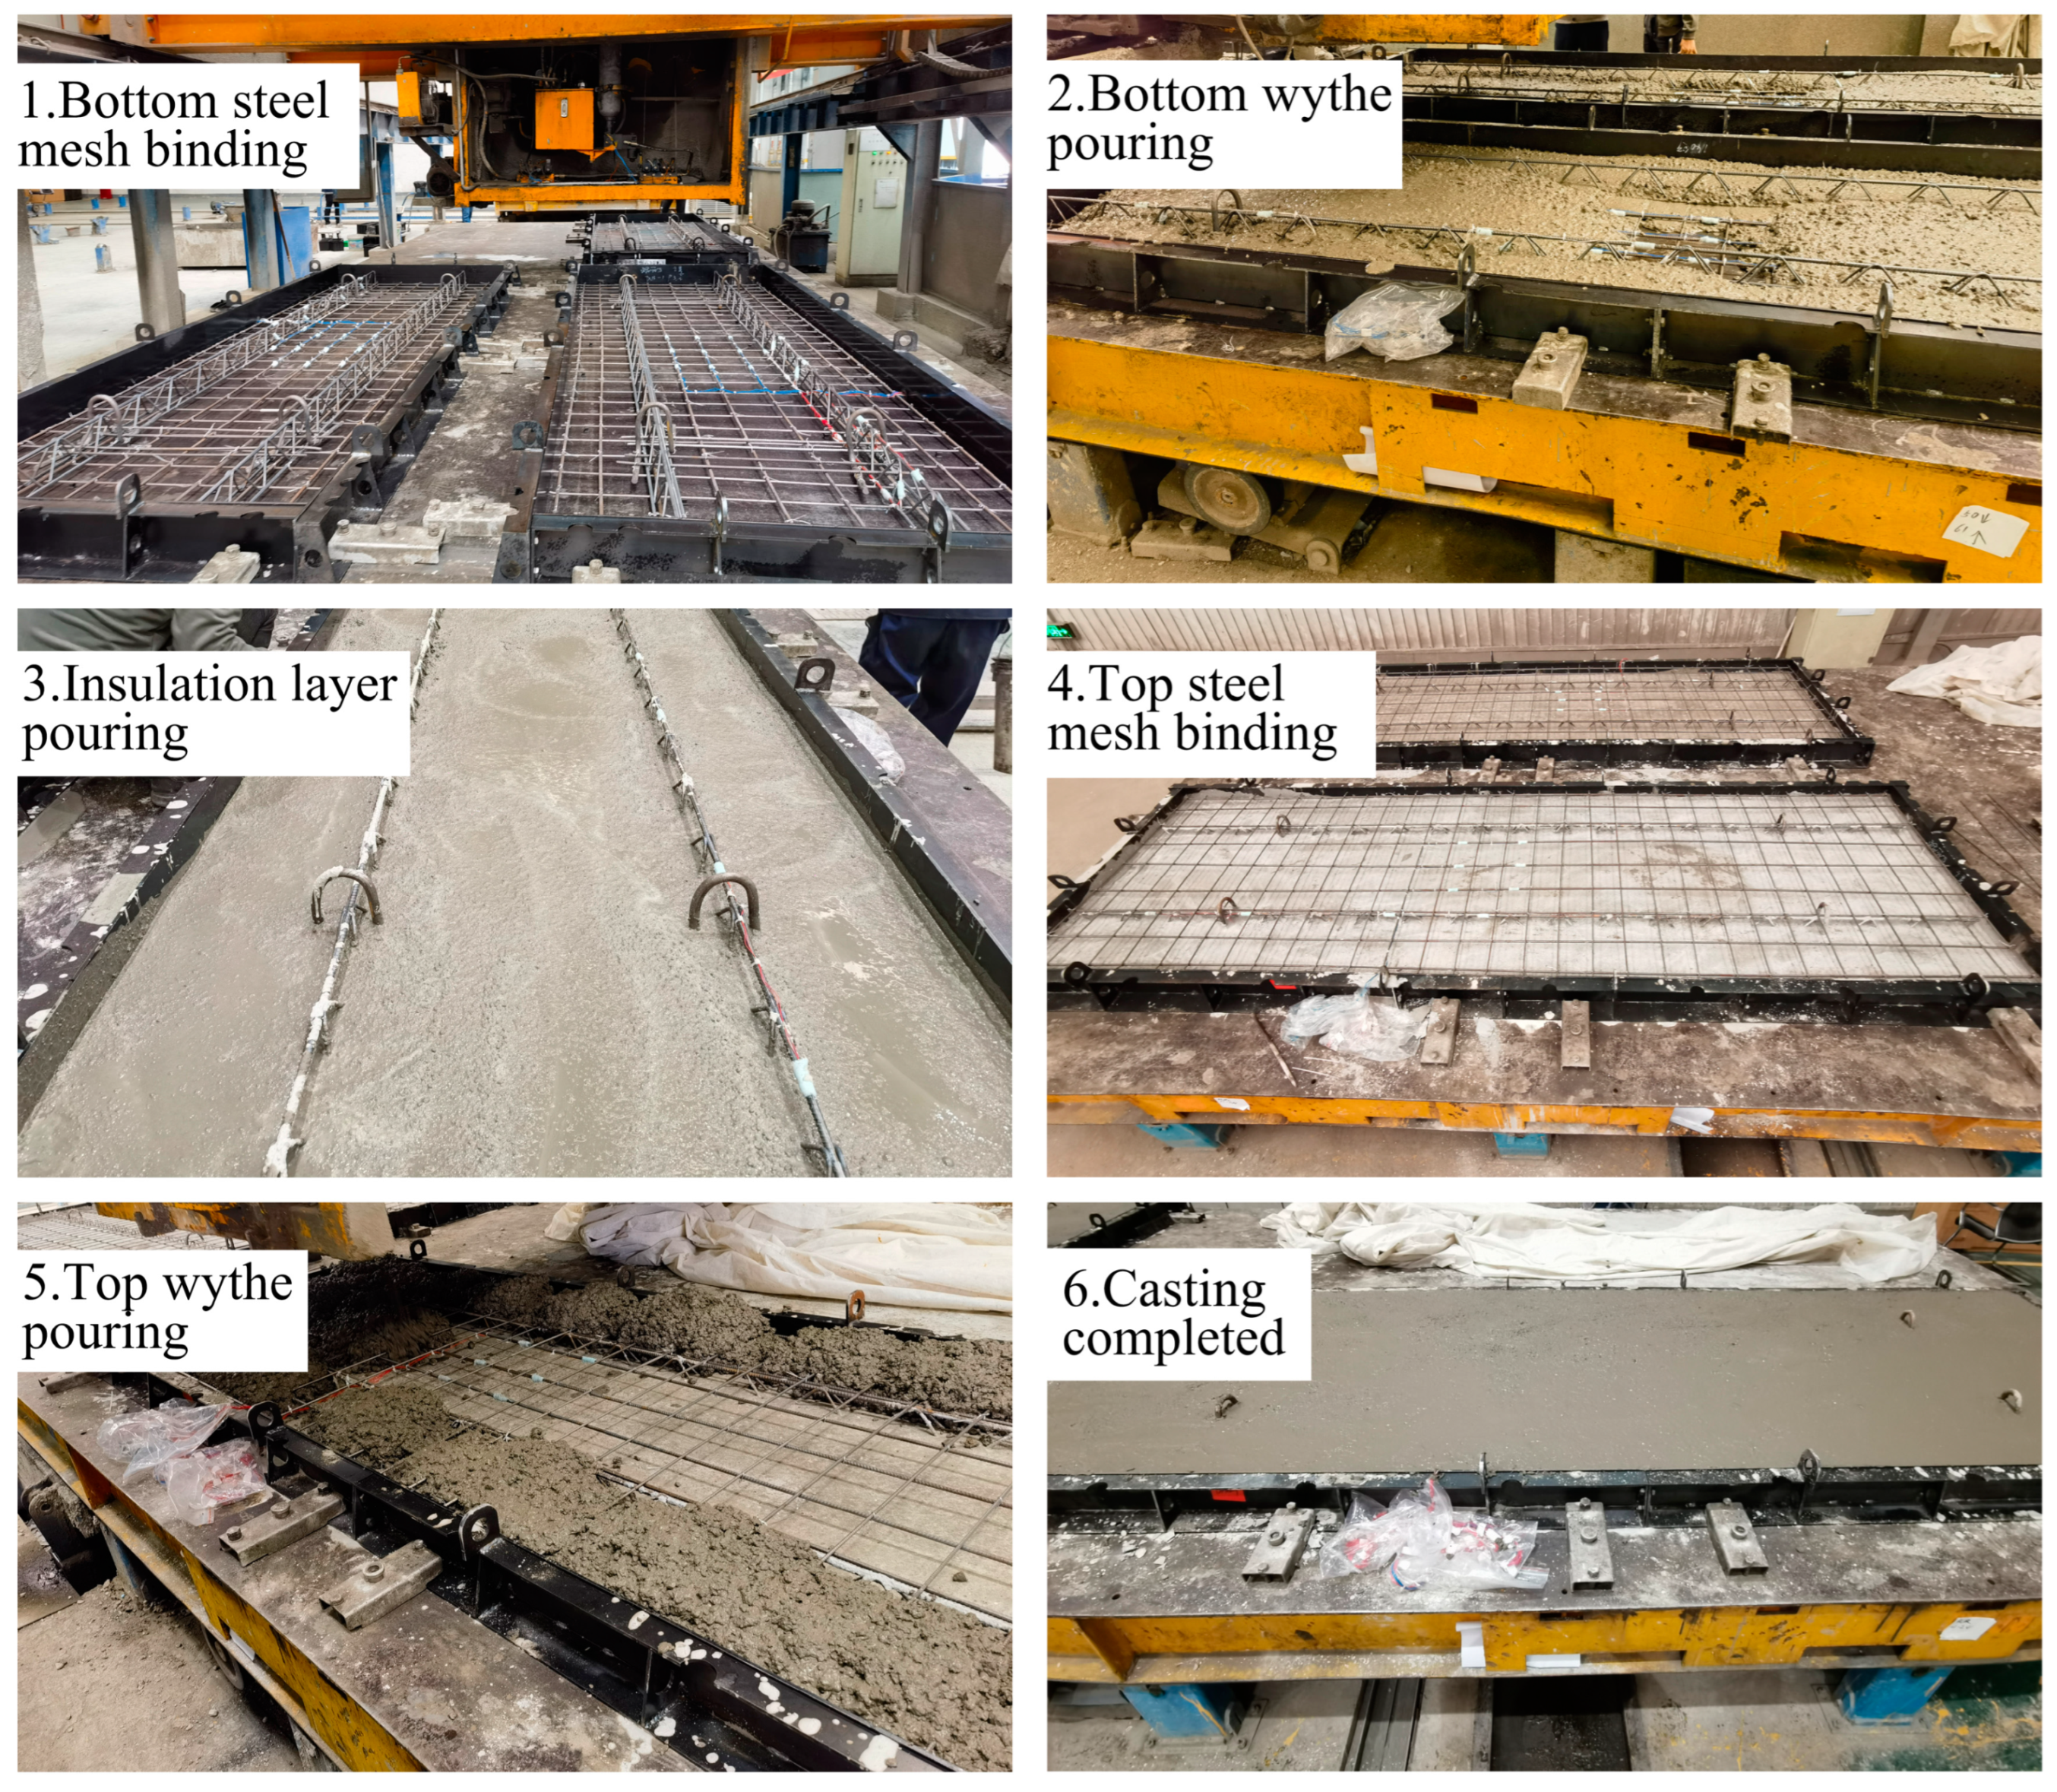
2.3. Casting of PIMSP
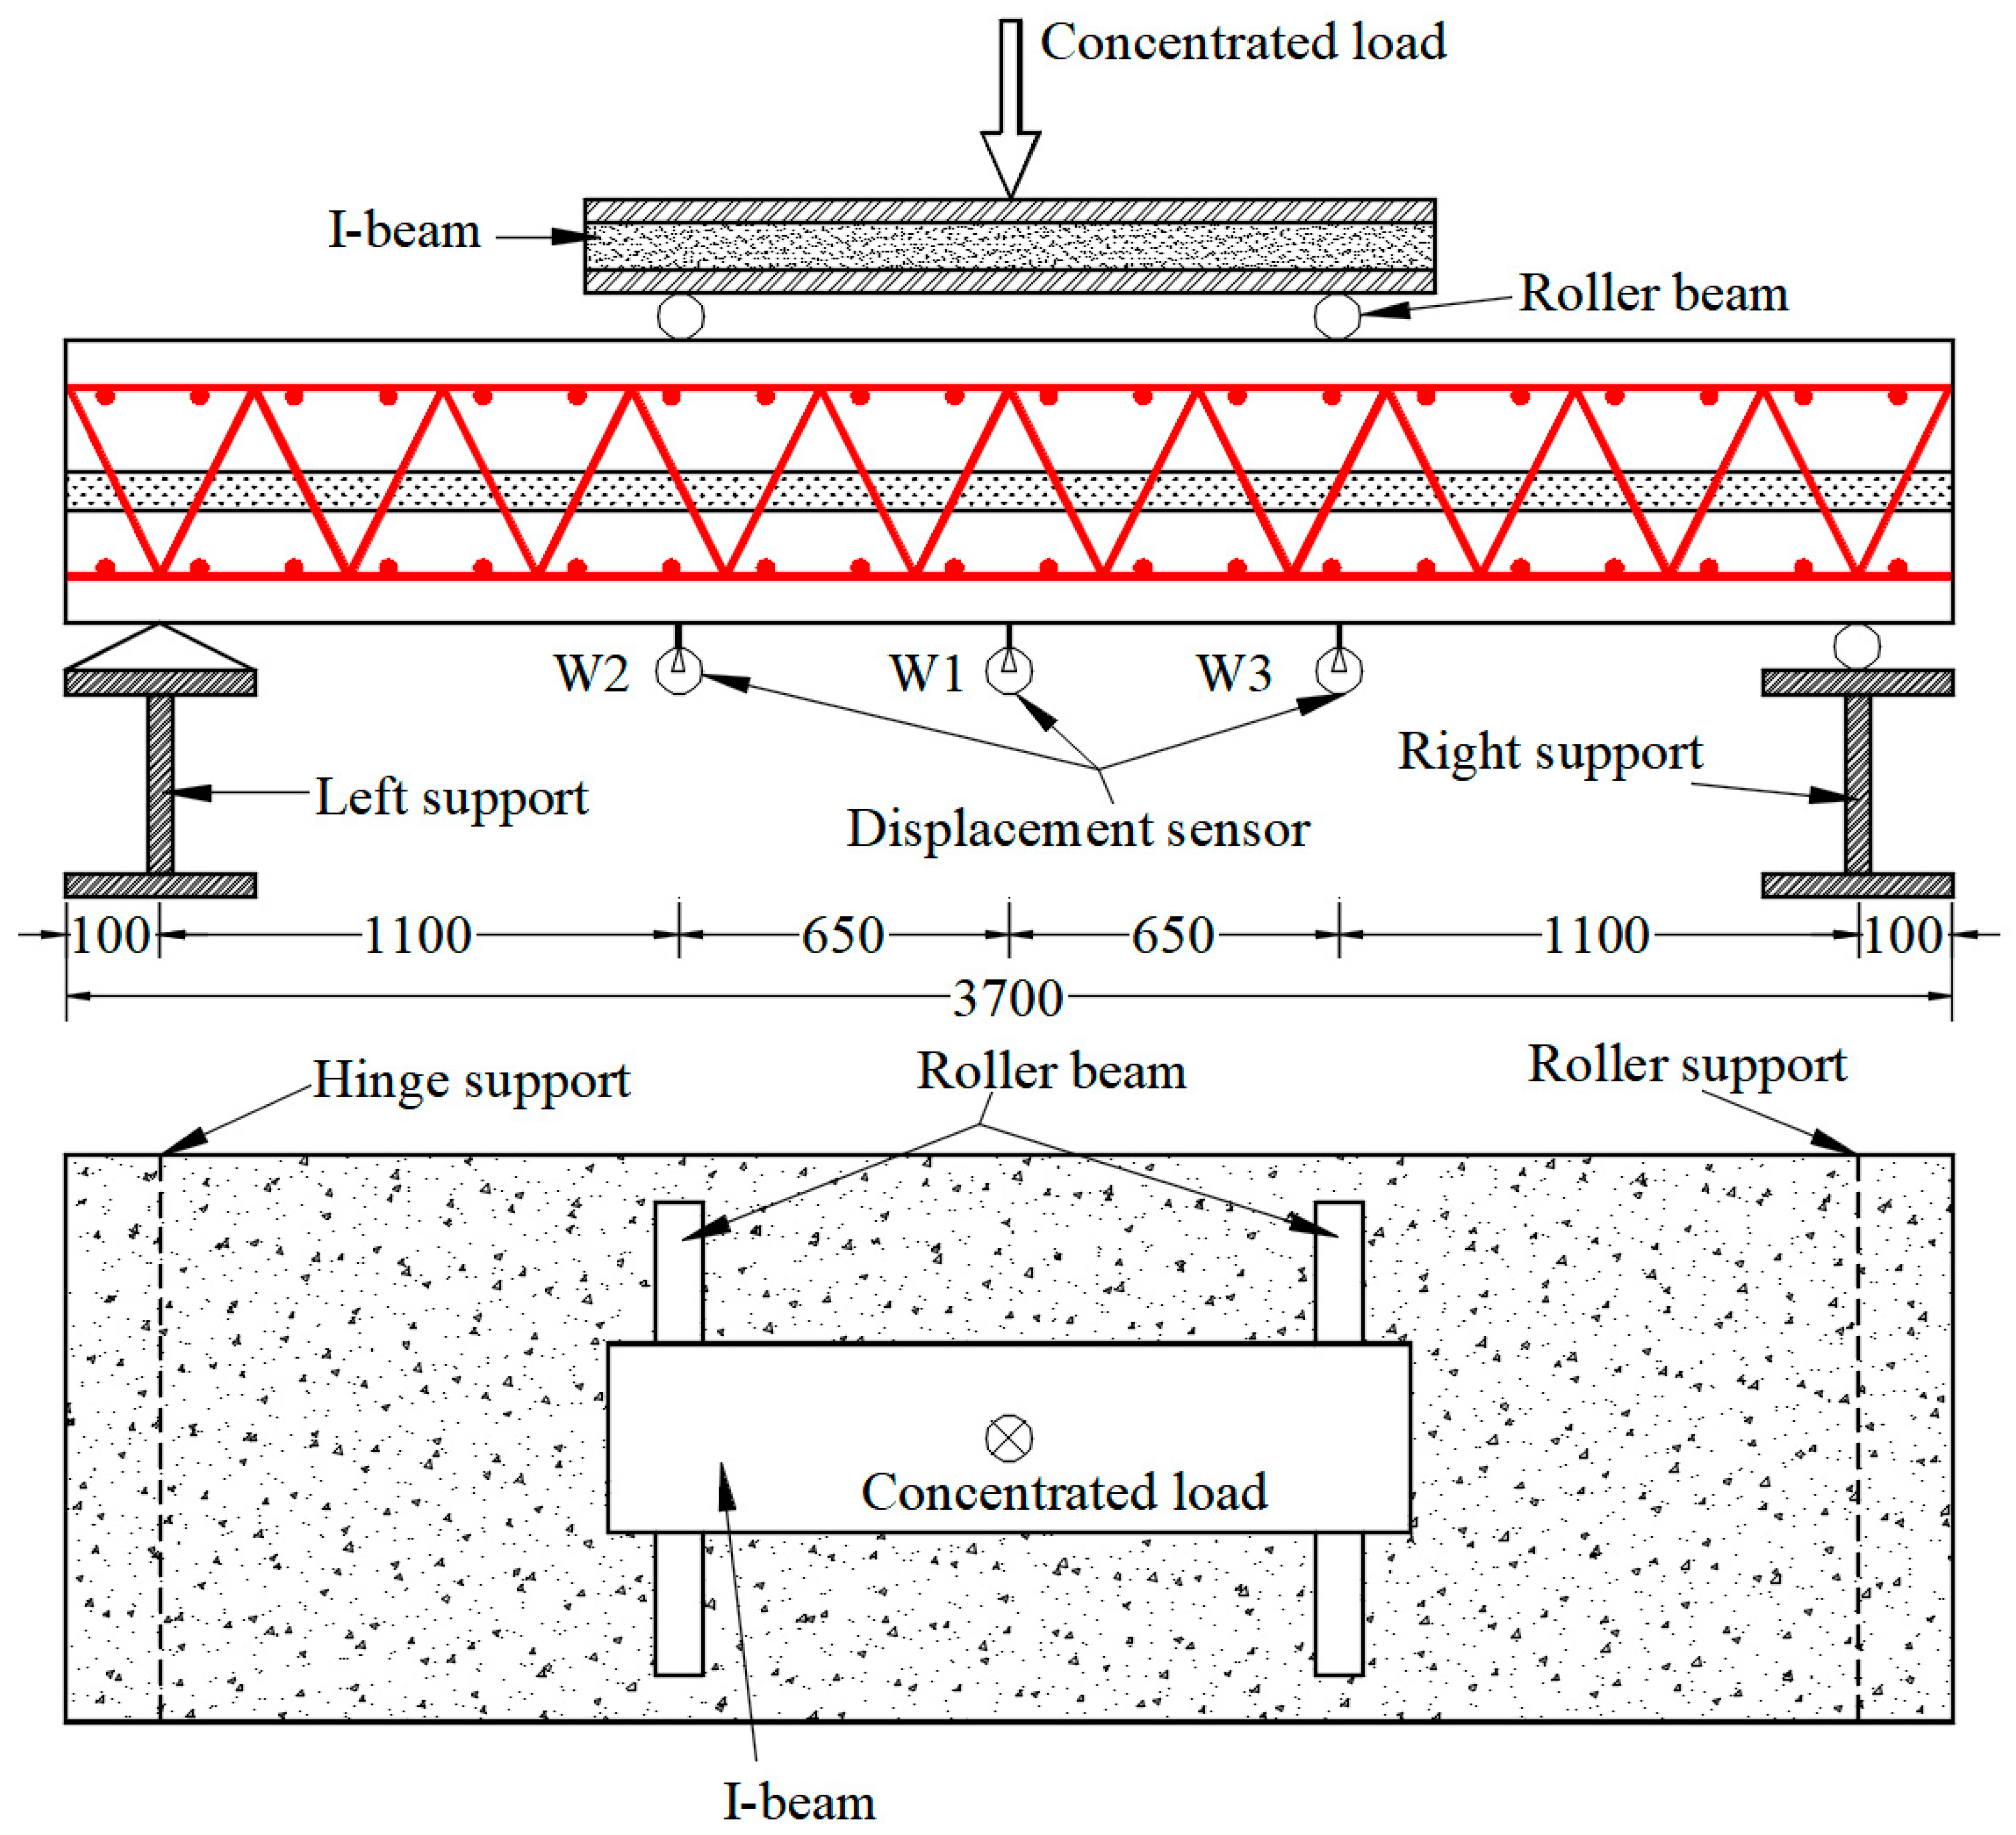
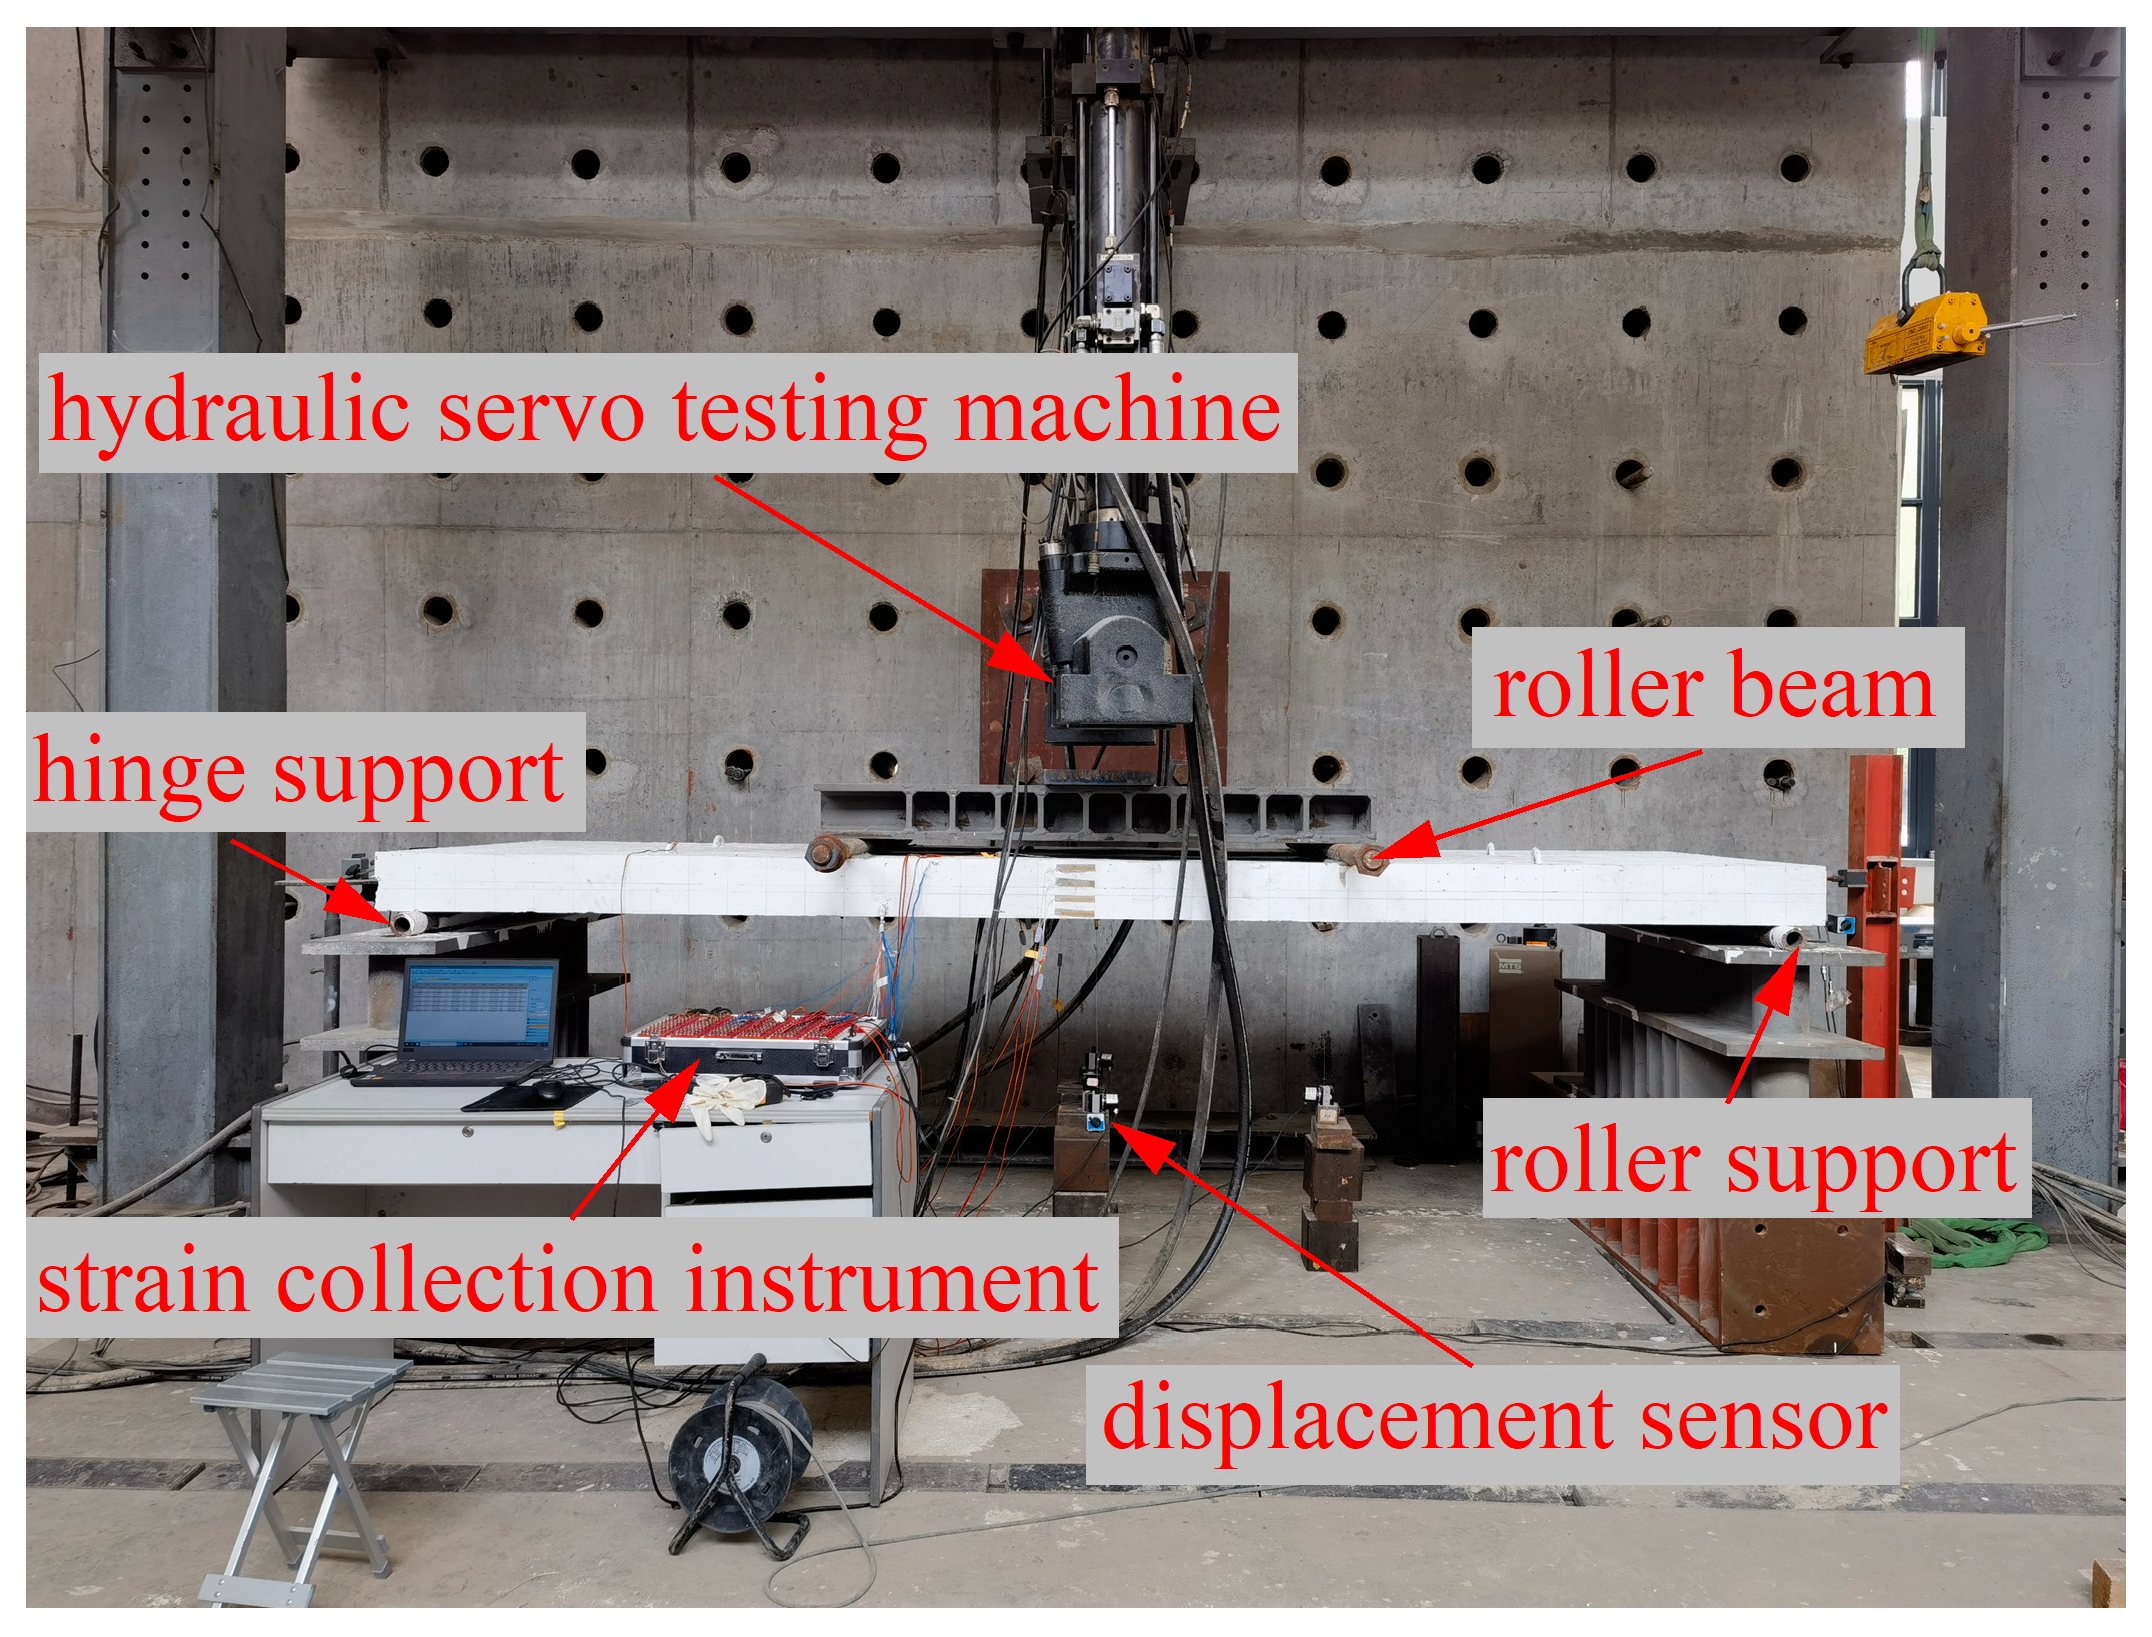
2.4. Instrument Preparation and Monitoring
2.5. Test Procedure
3. Results and Discussion
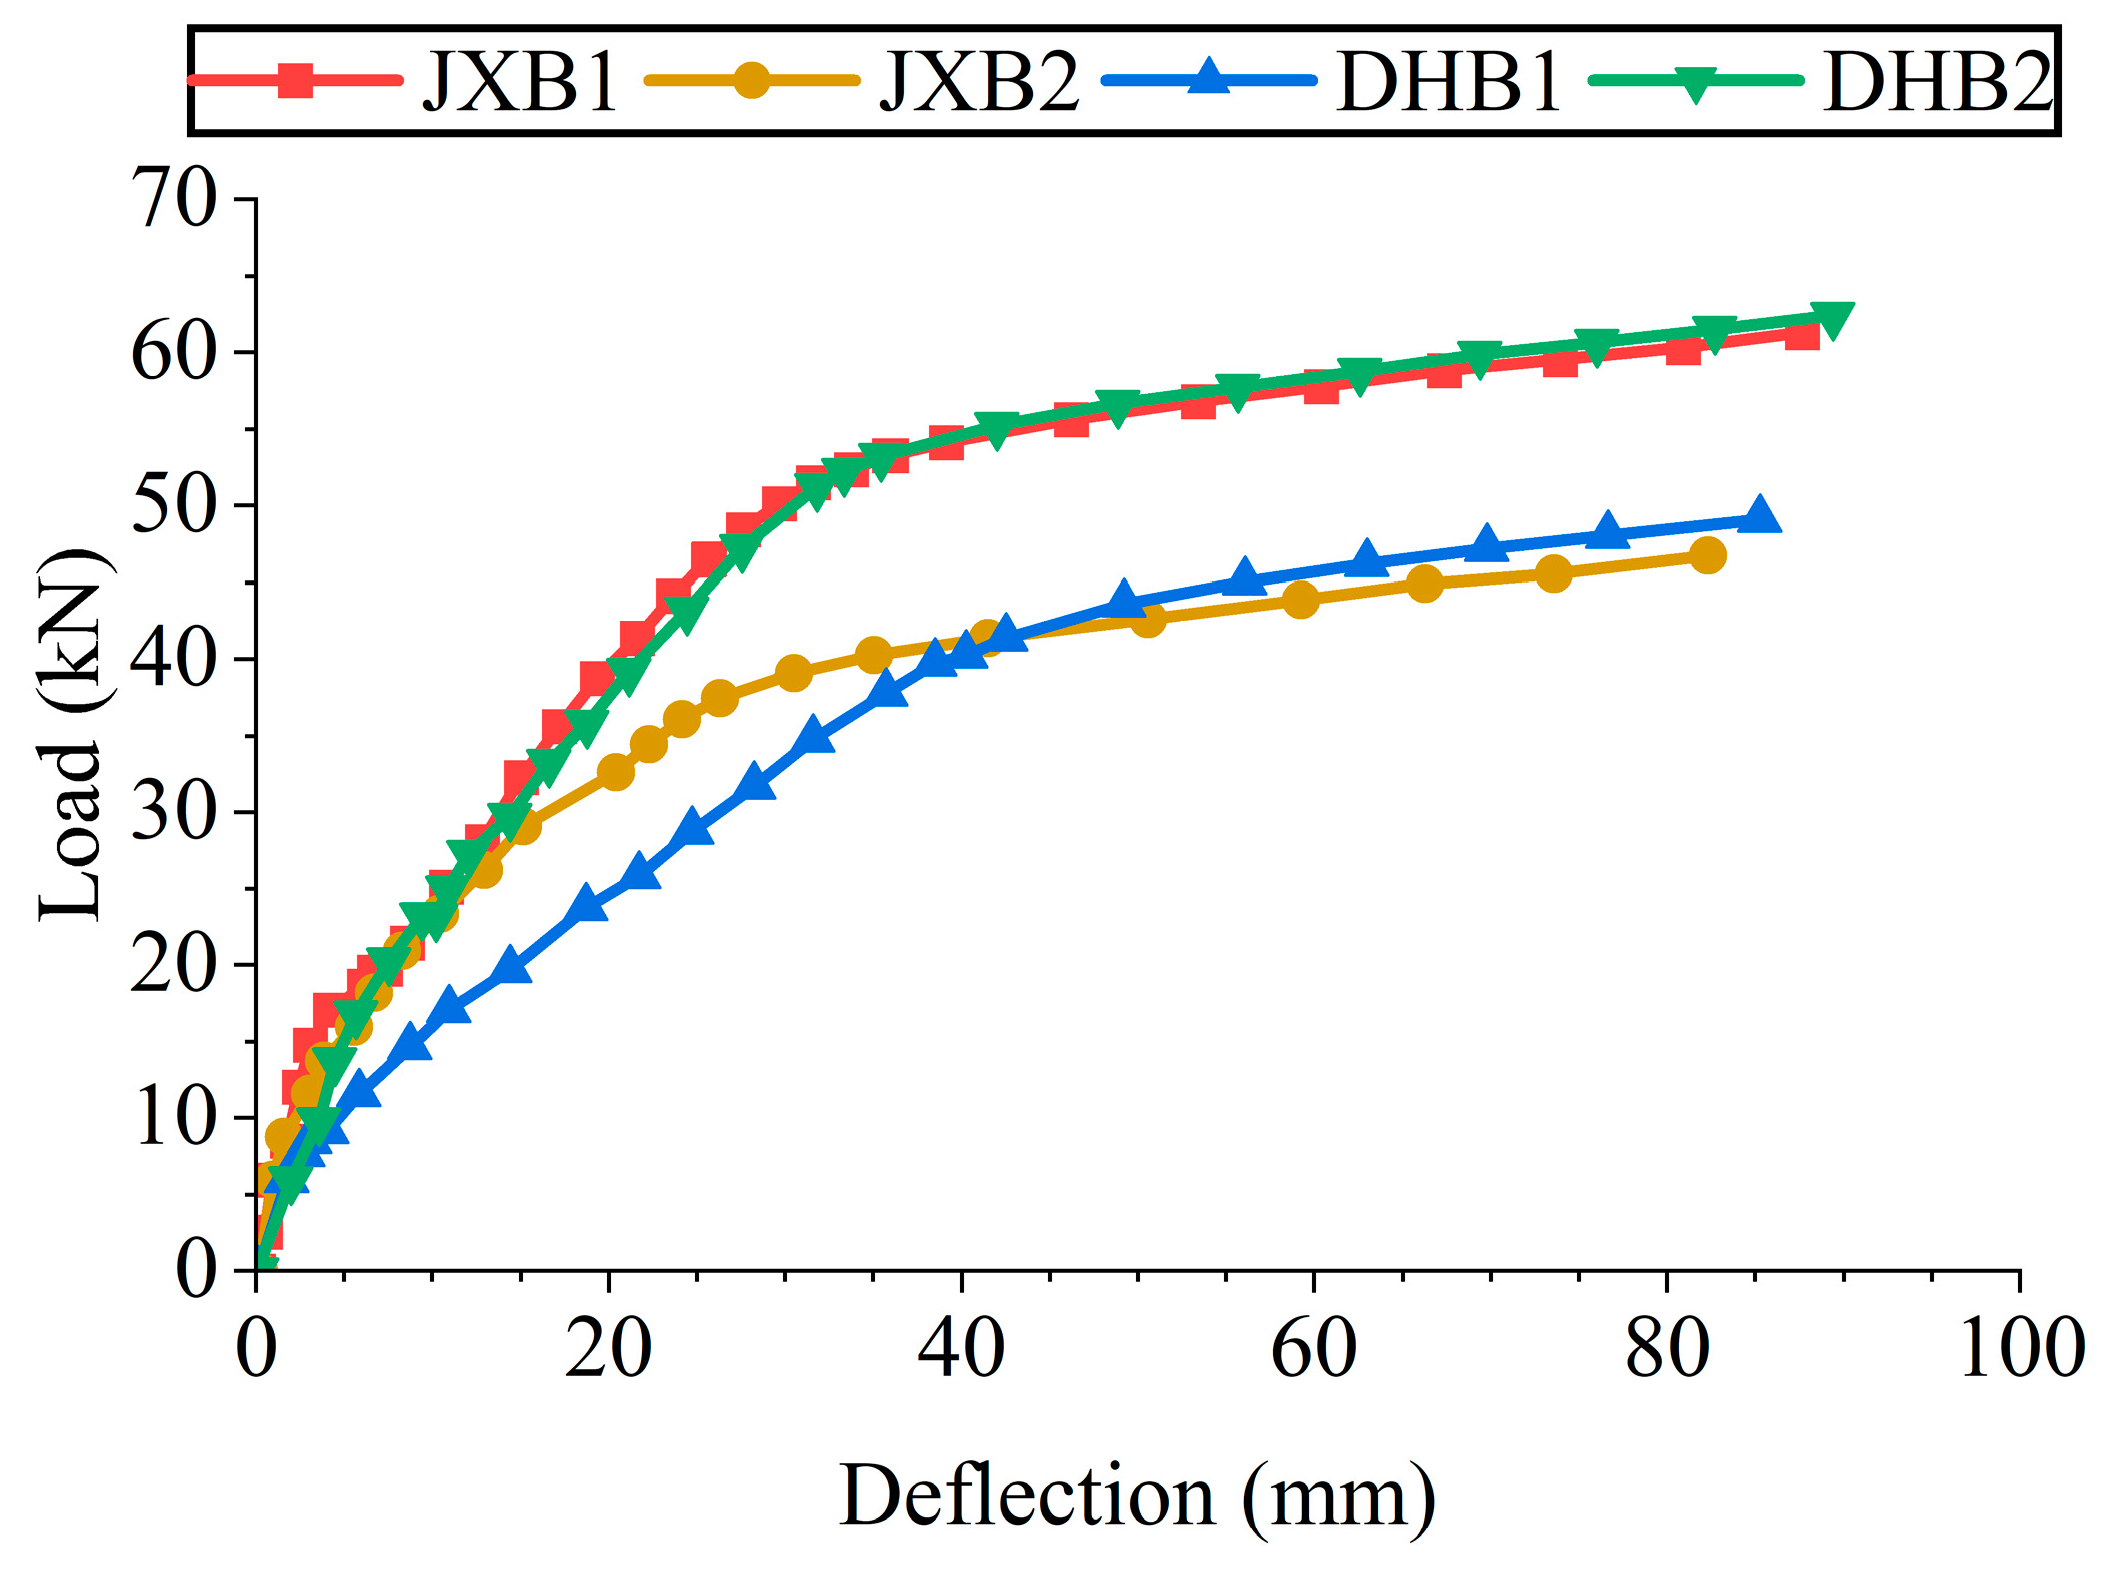
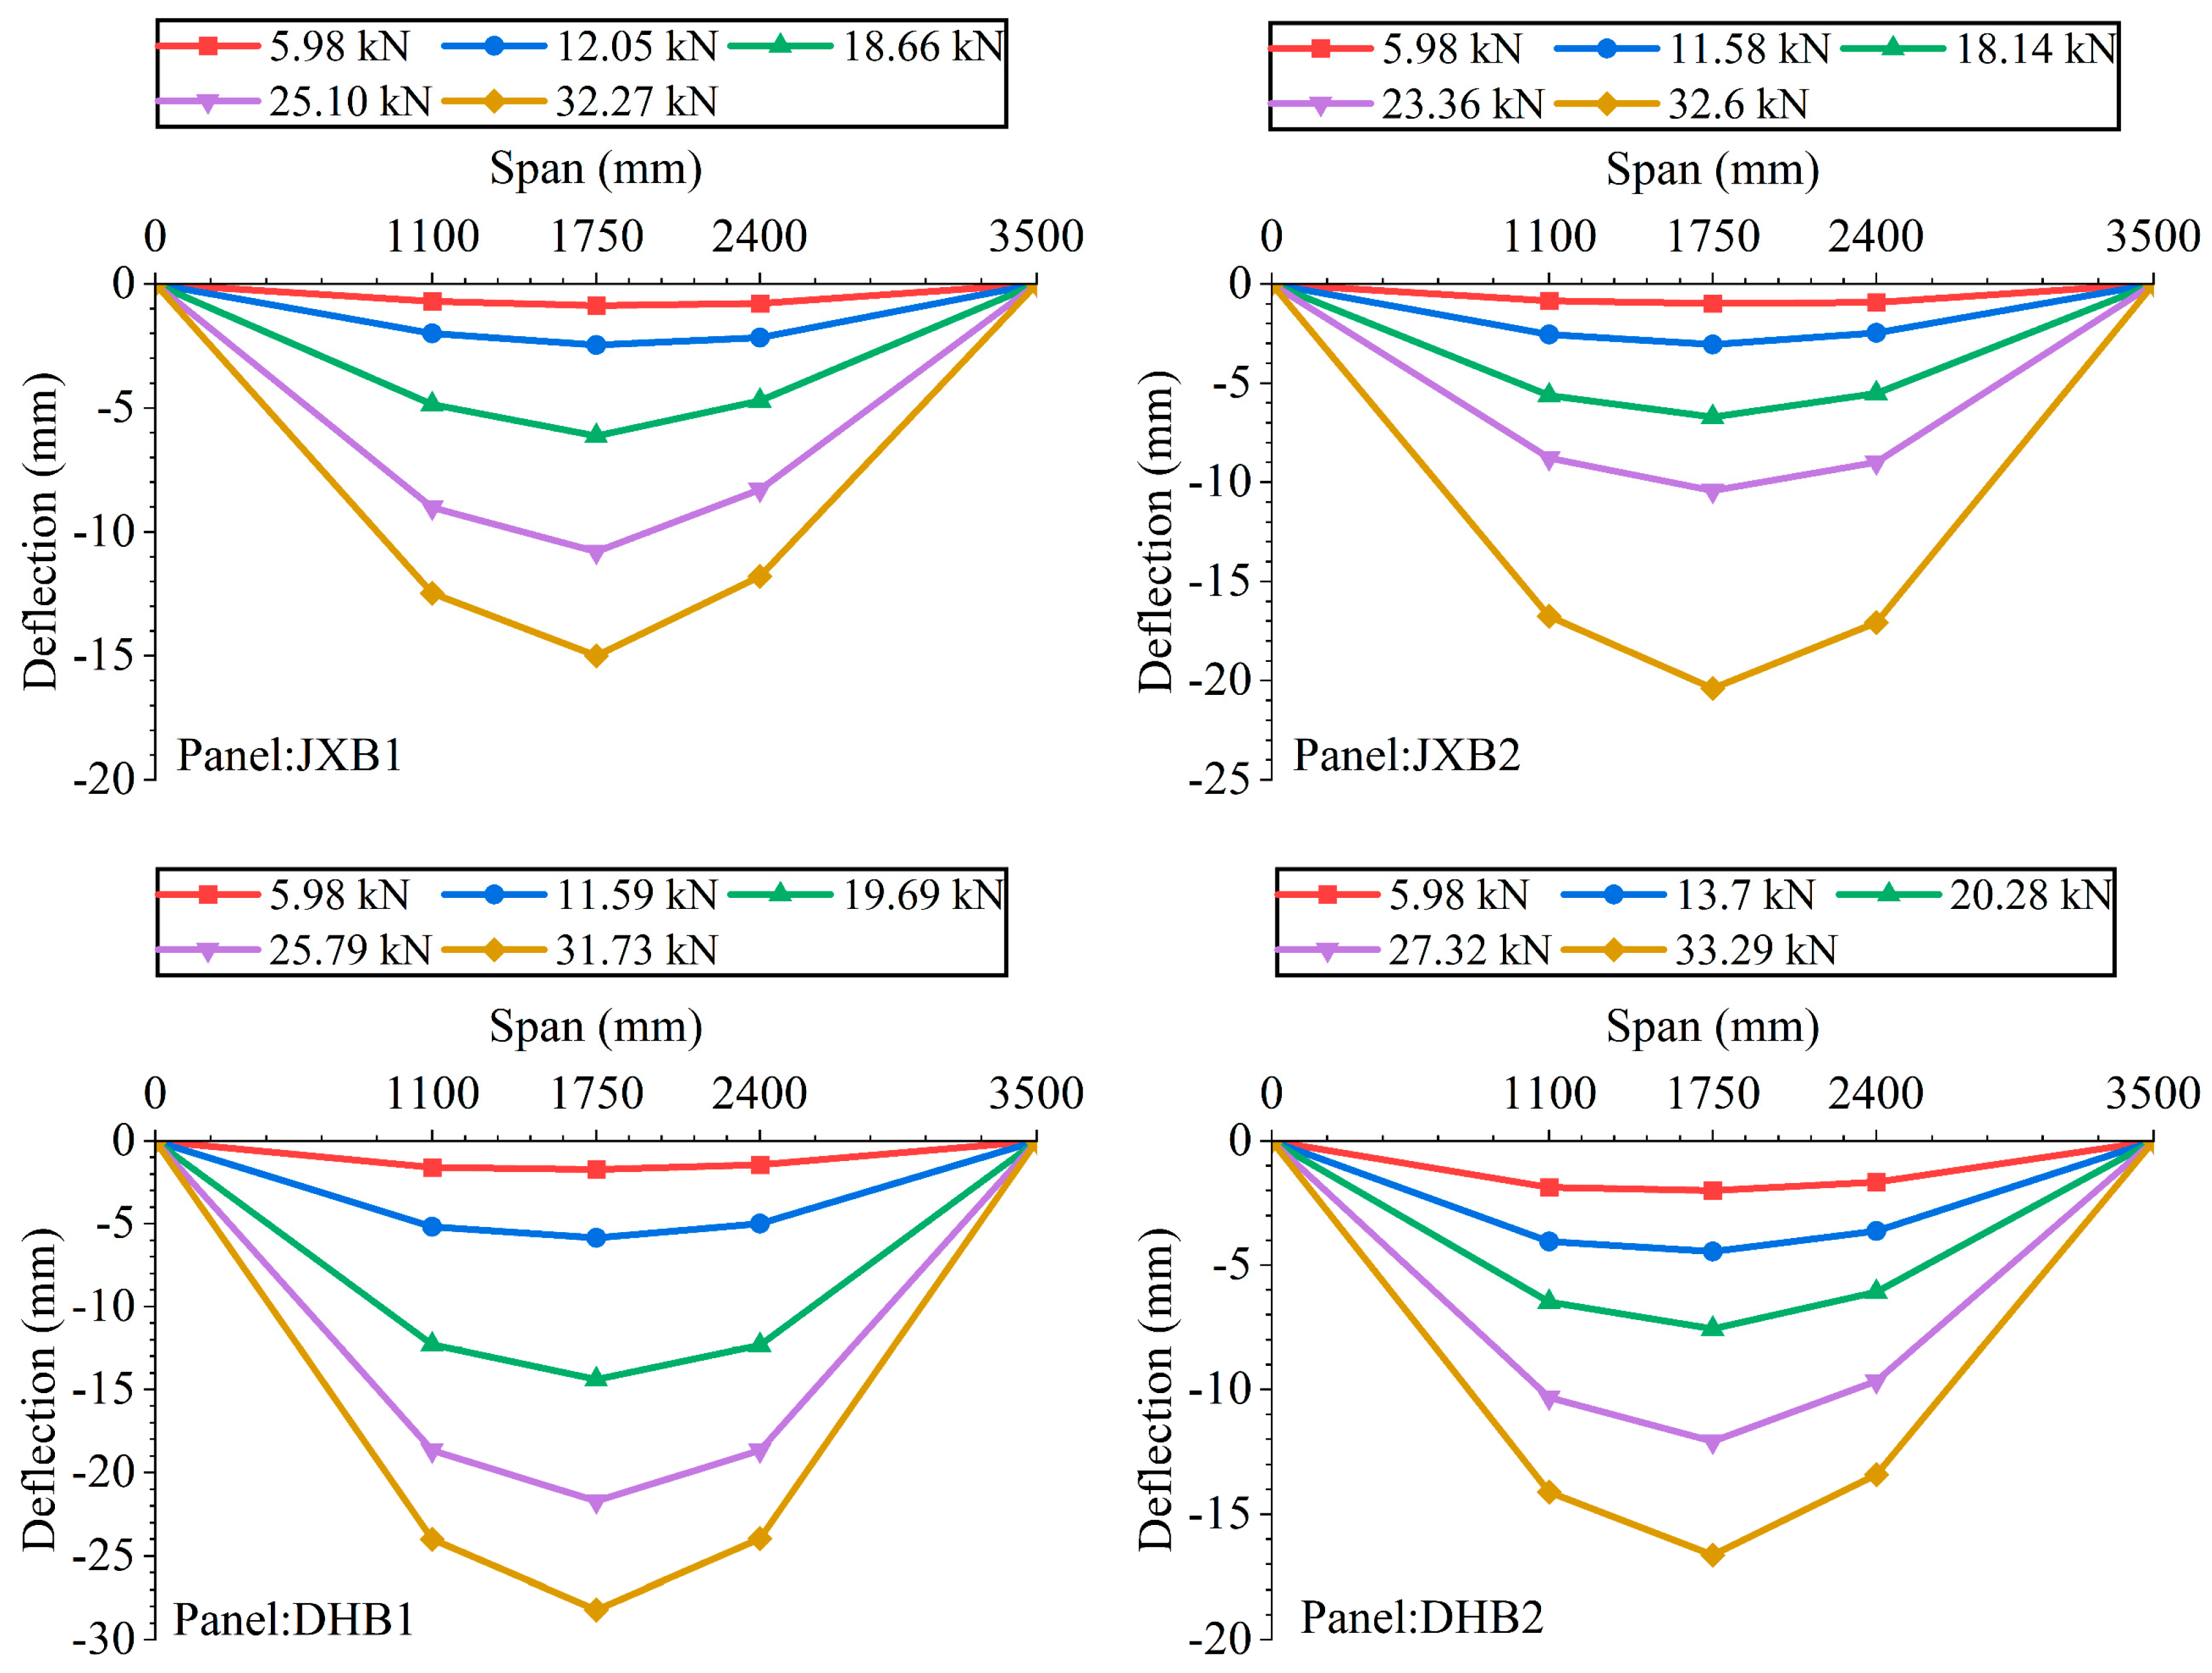
3.1. Load-Deflection Profile
3.2. Load–Strain Relationship in Steel Bars
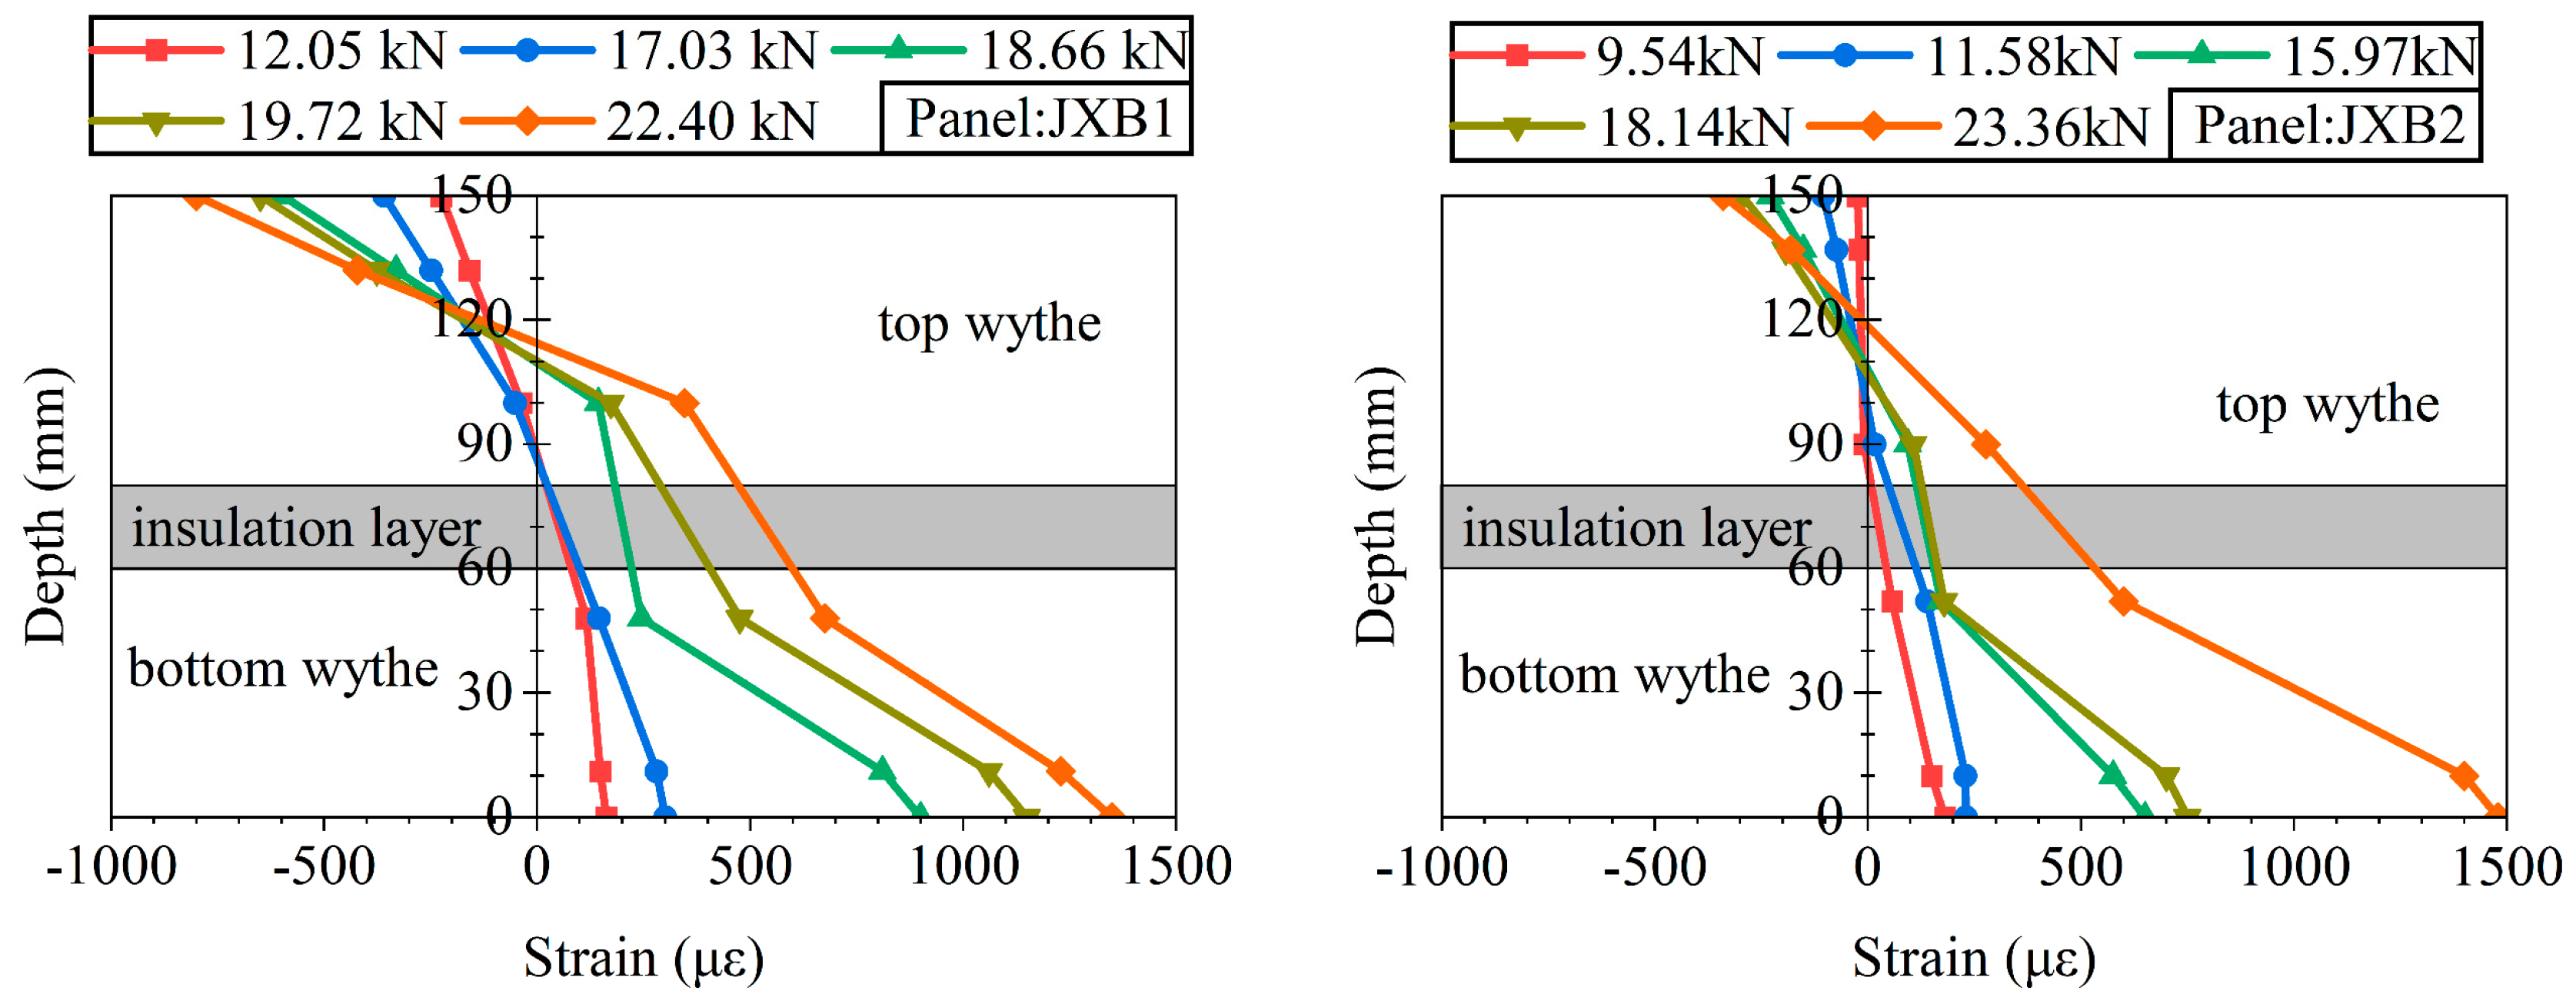
3.3. Load–Strain Relationship on Concrete Surface
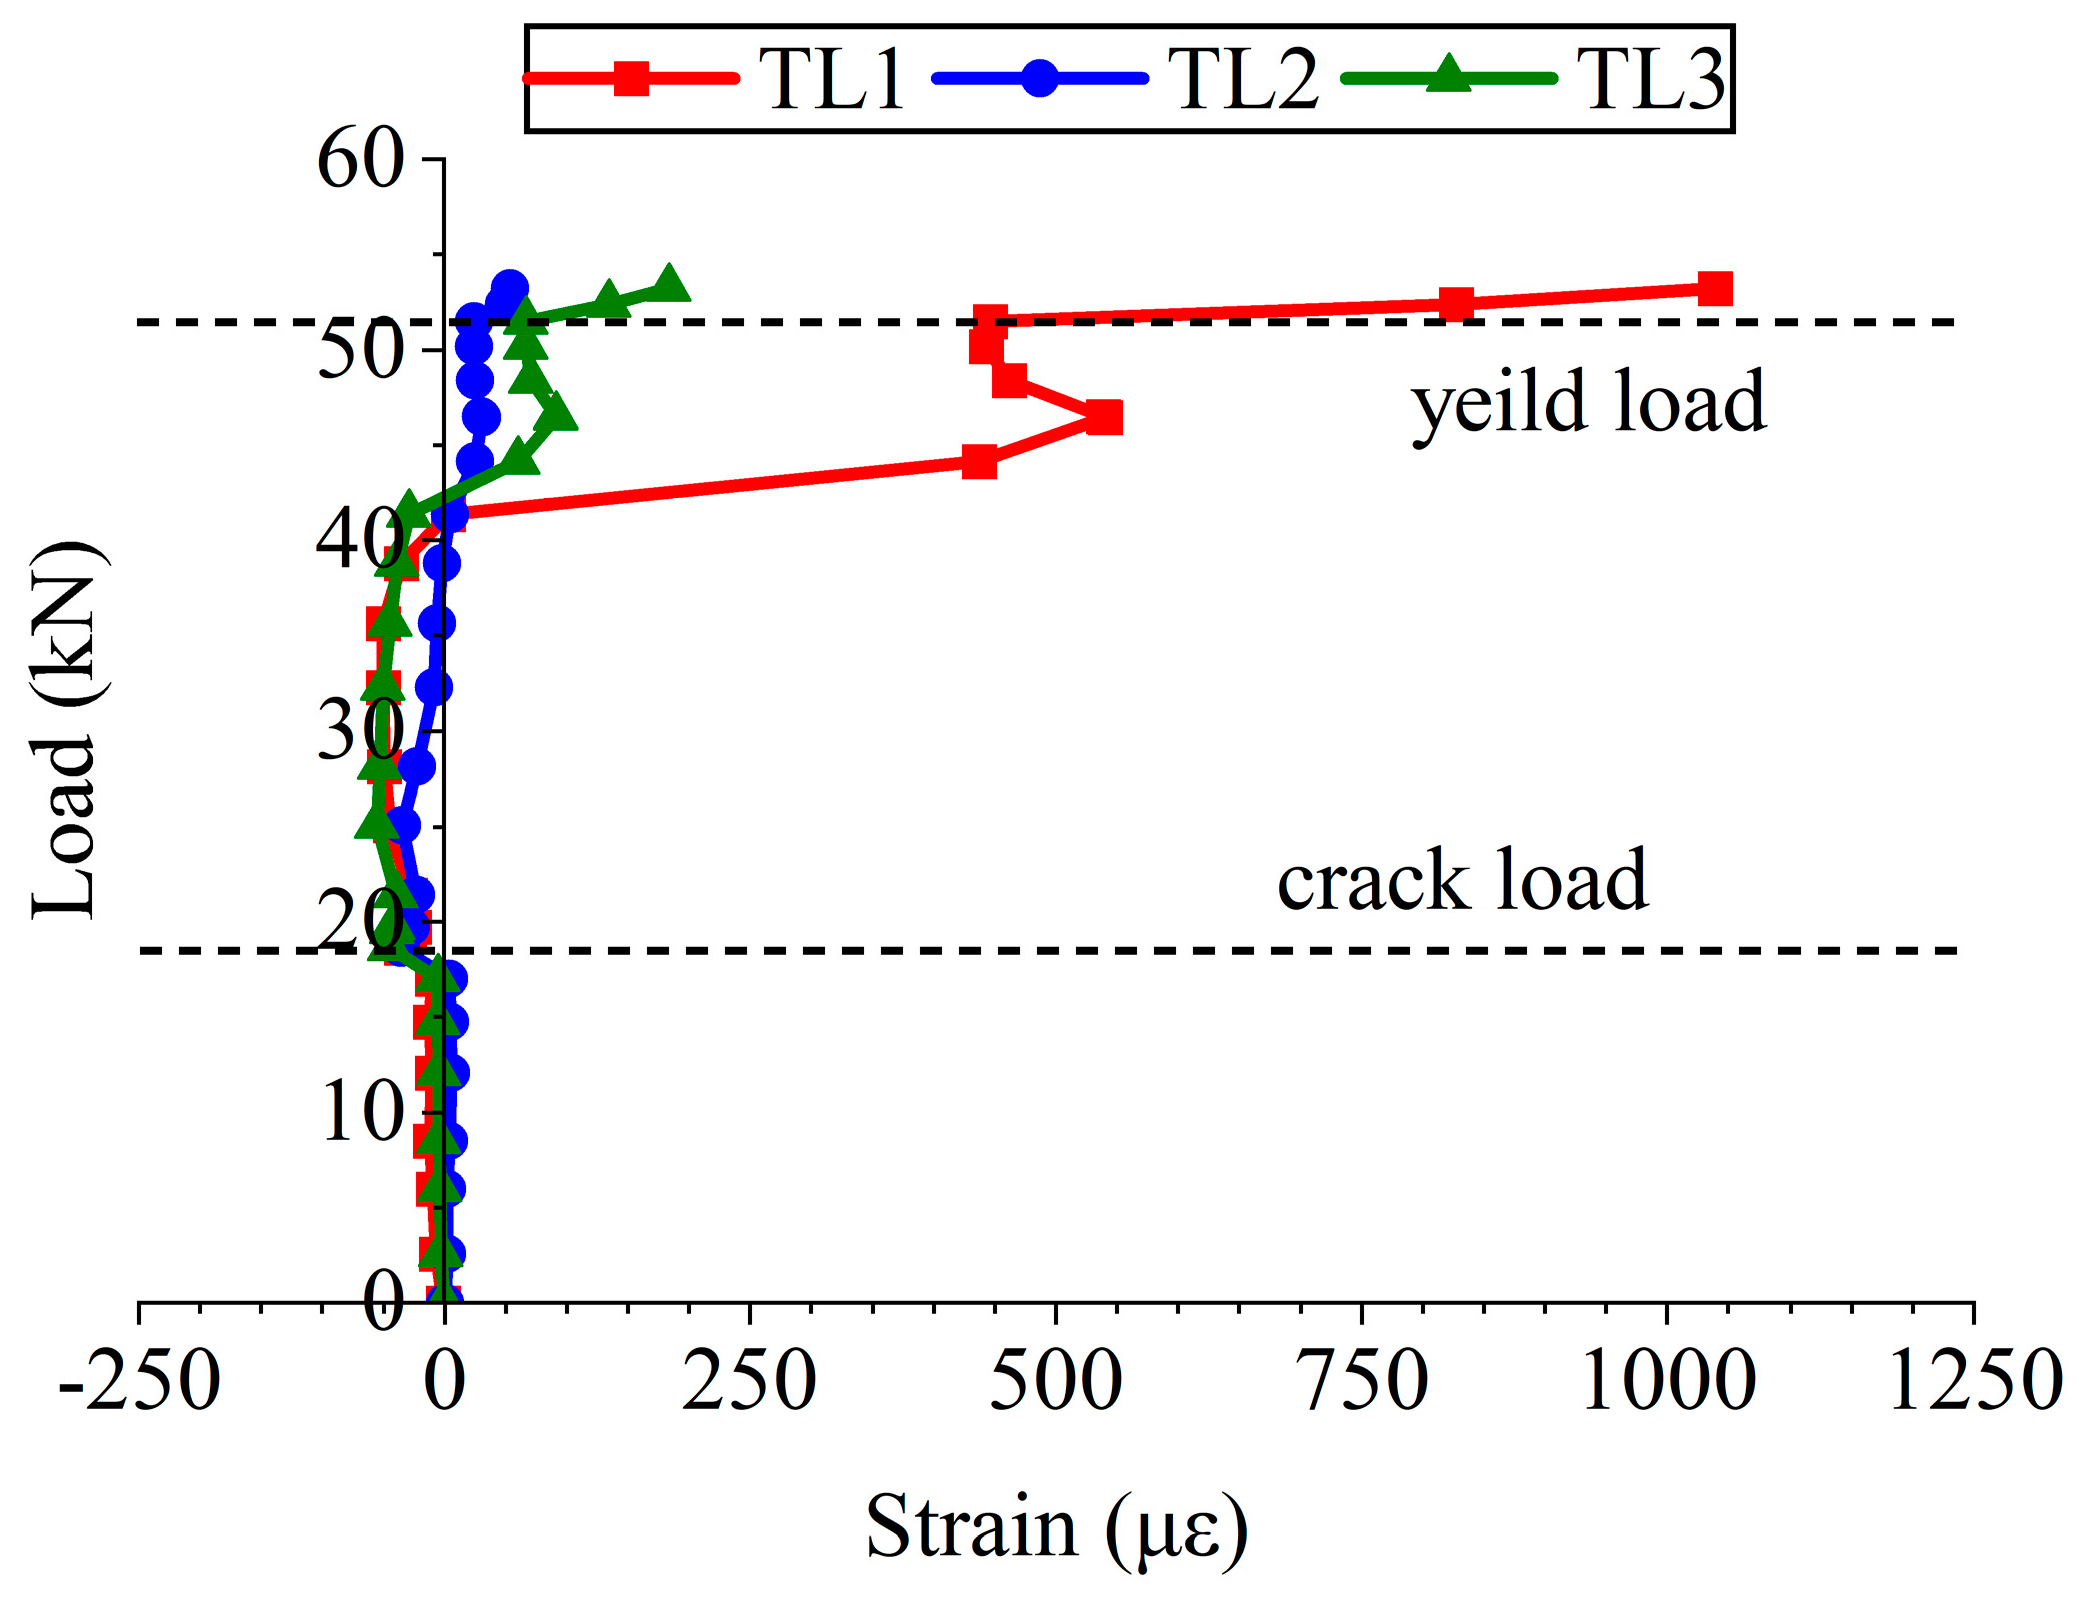
3.4. Load–Strain Relationship in Truss Leg
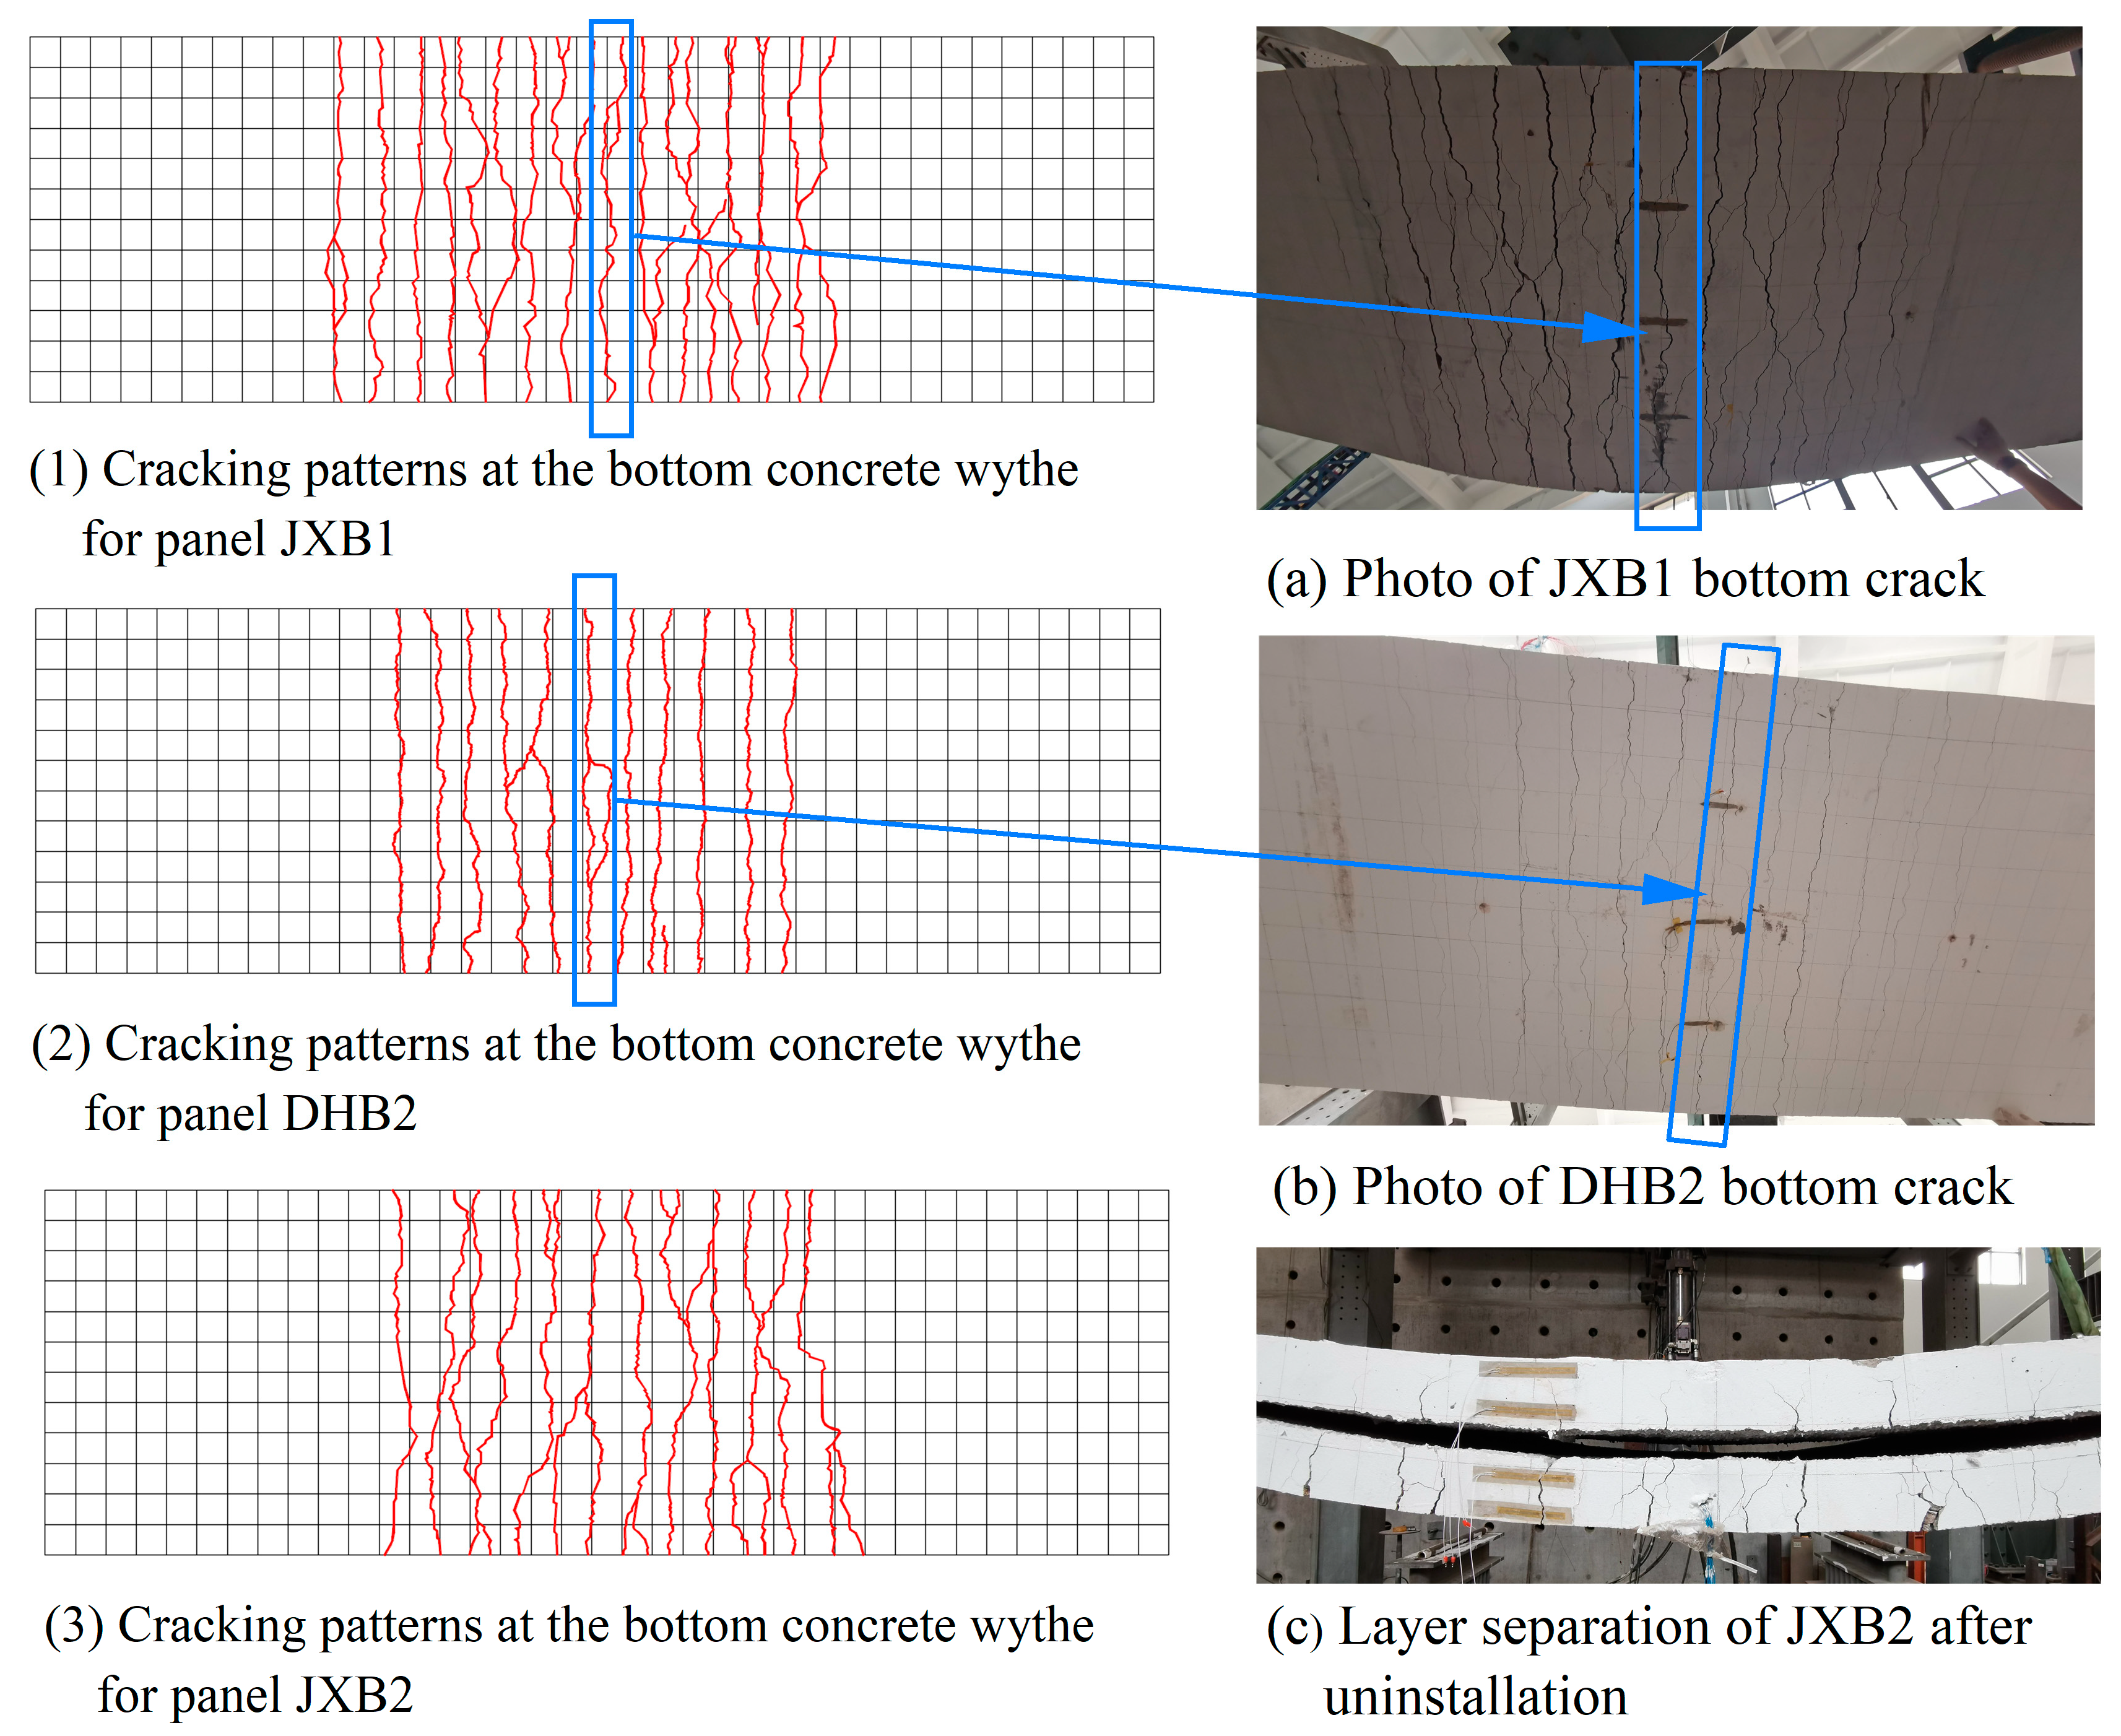
3.5. Cracking Patterns
4. Finite Element Analysis
4.1. Form of Finite Element Models
4.2. Typical Elements Used
4.3. One-Way PIMSP Slab Model
5. Comparison of Results
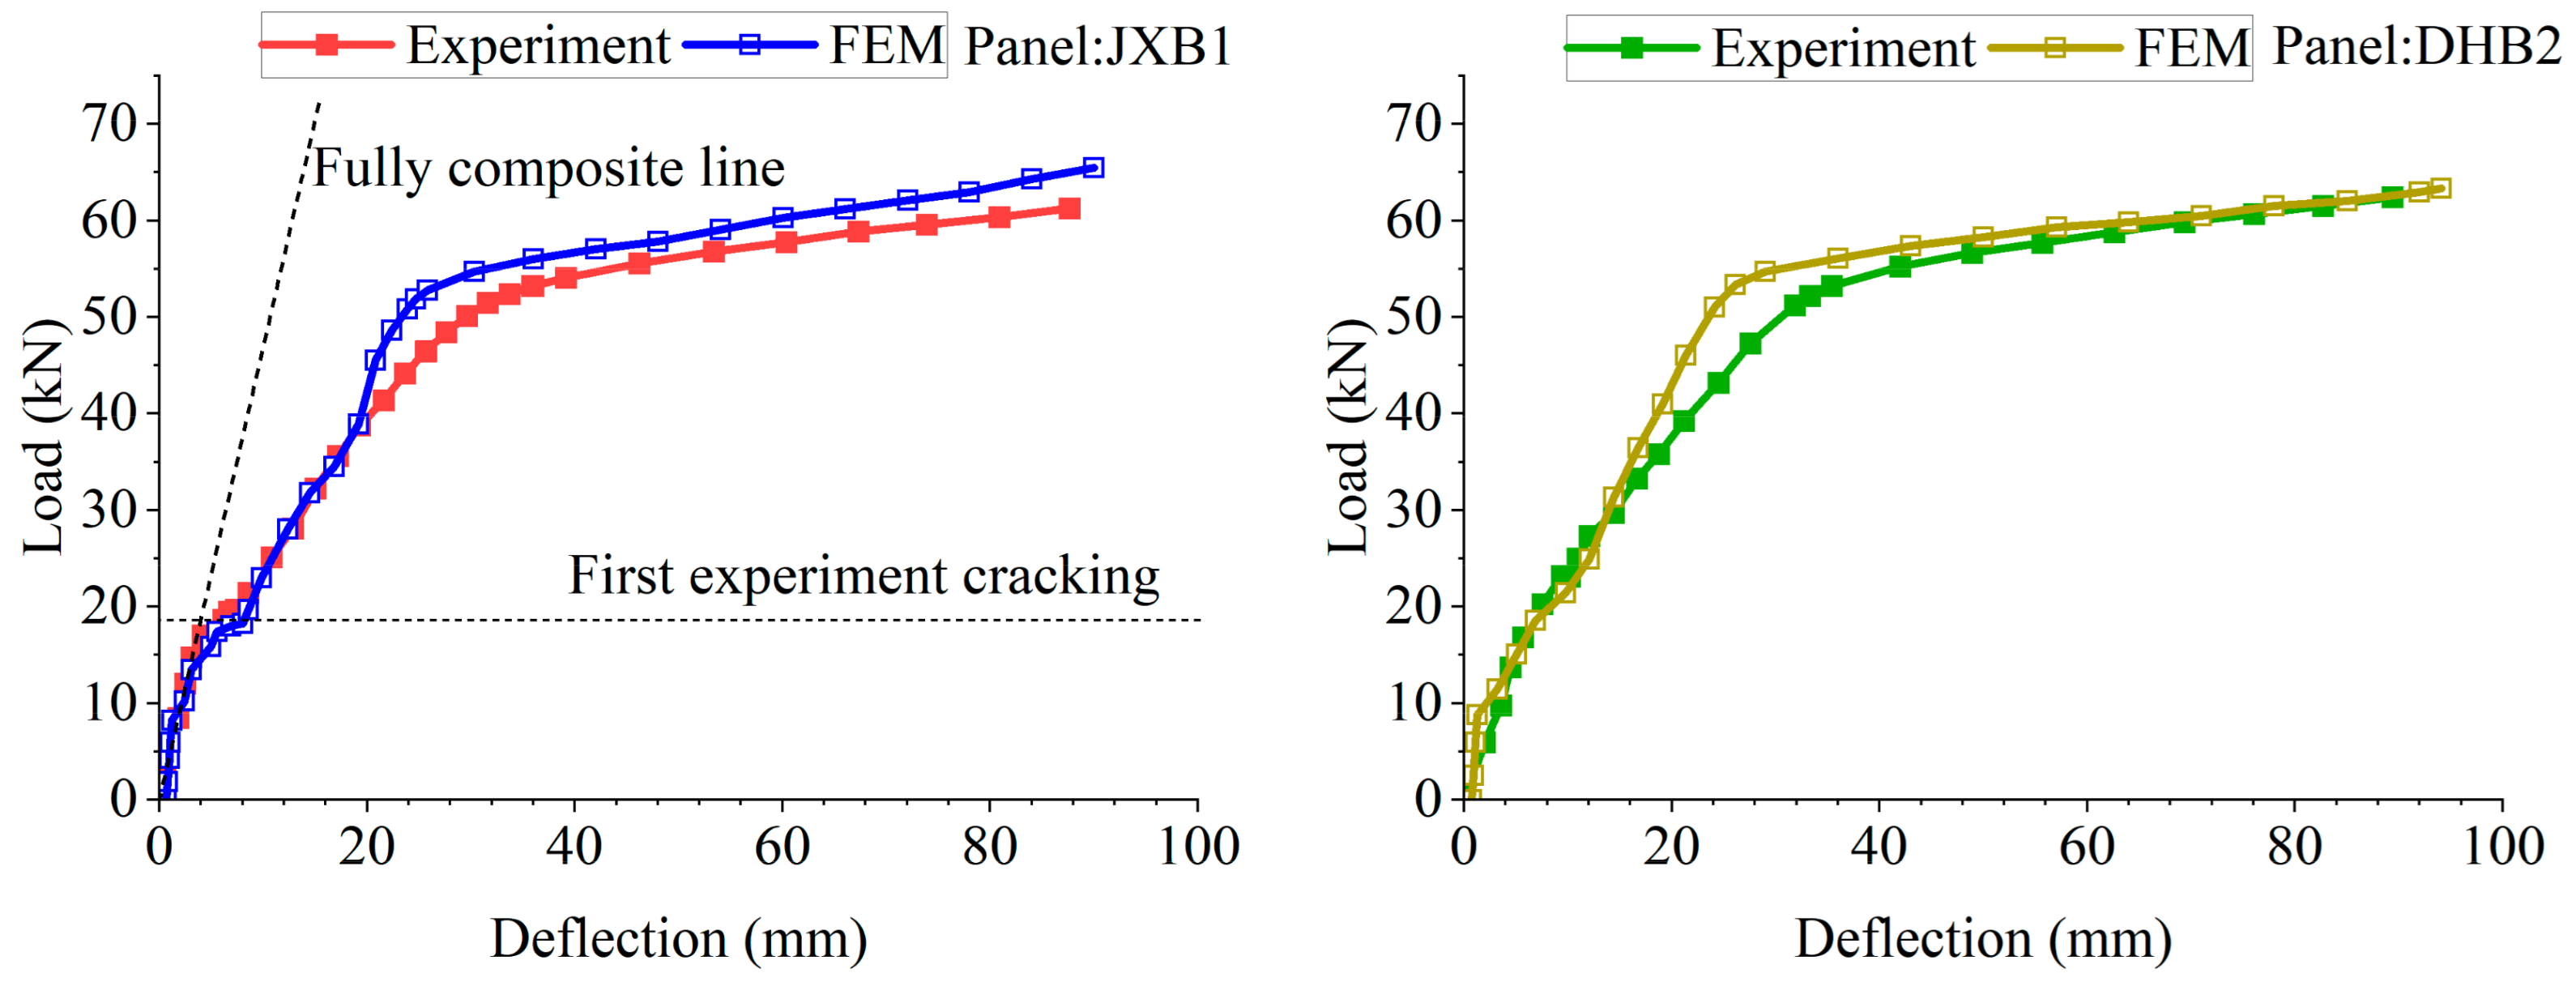
5.1. Load-Deflection Profile
5.2. Strain Distribution
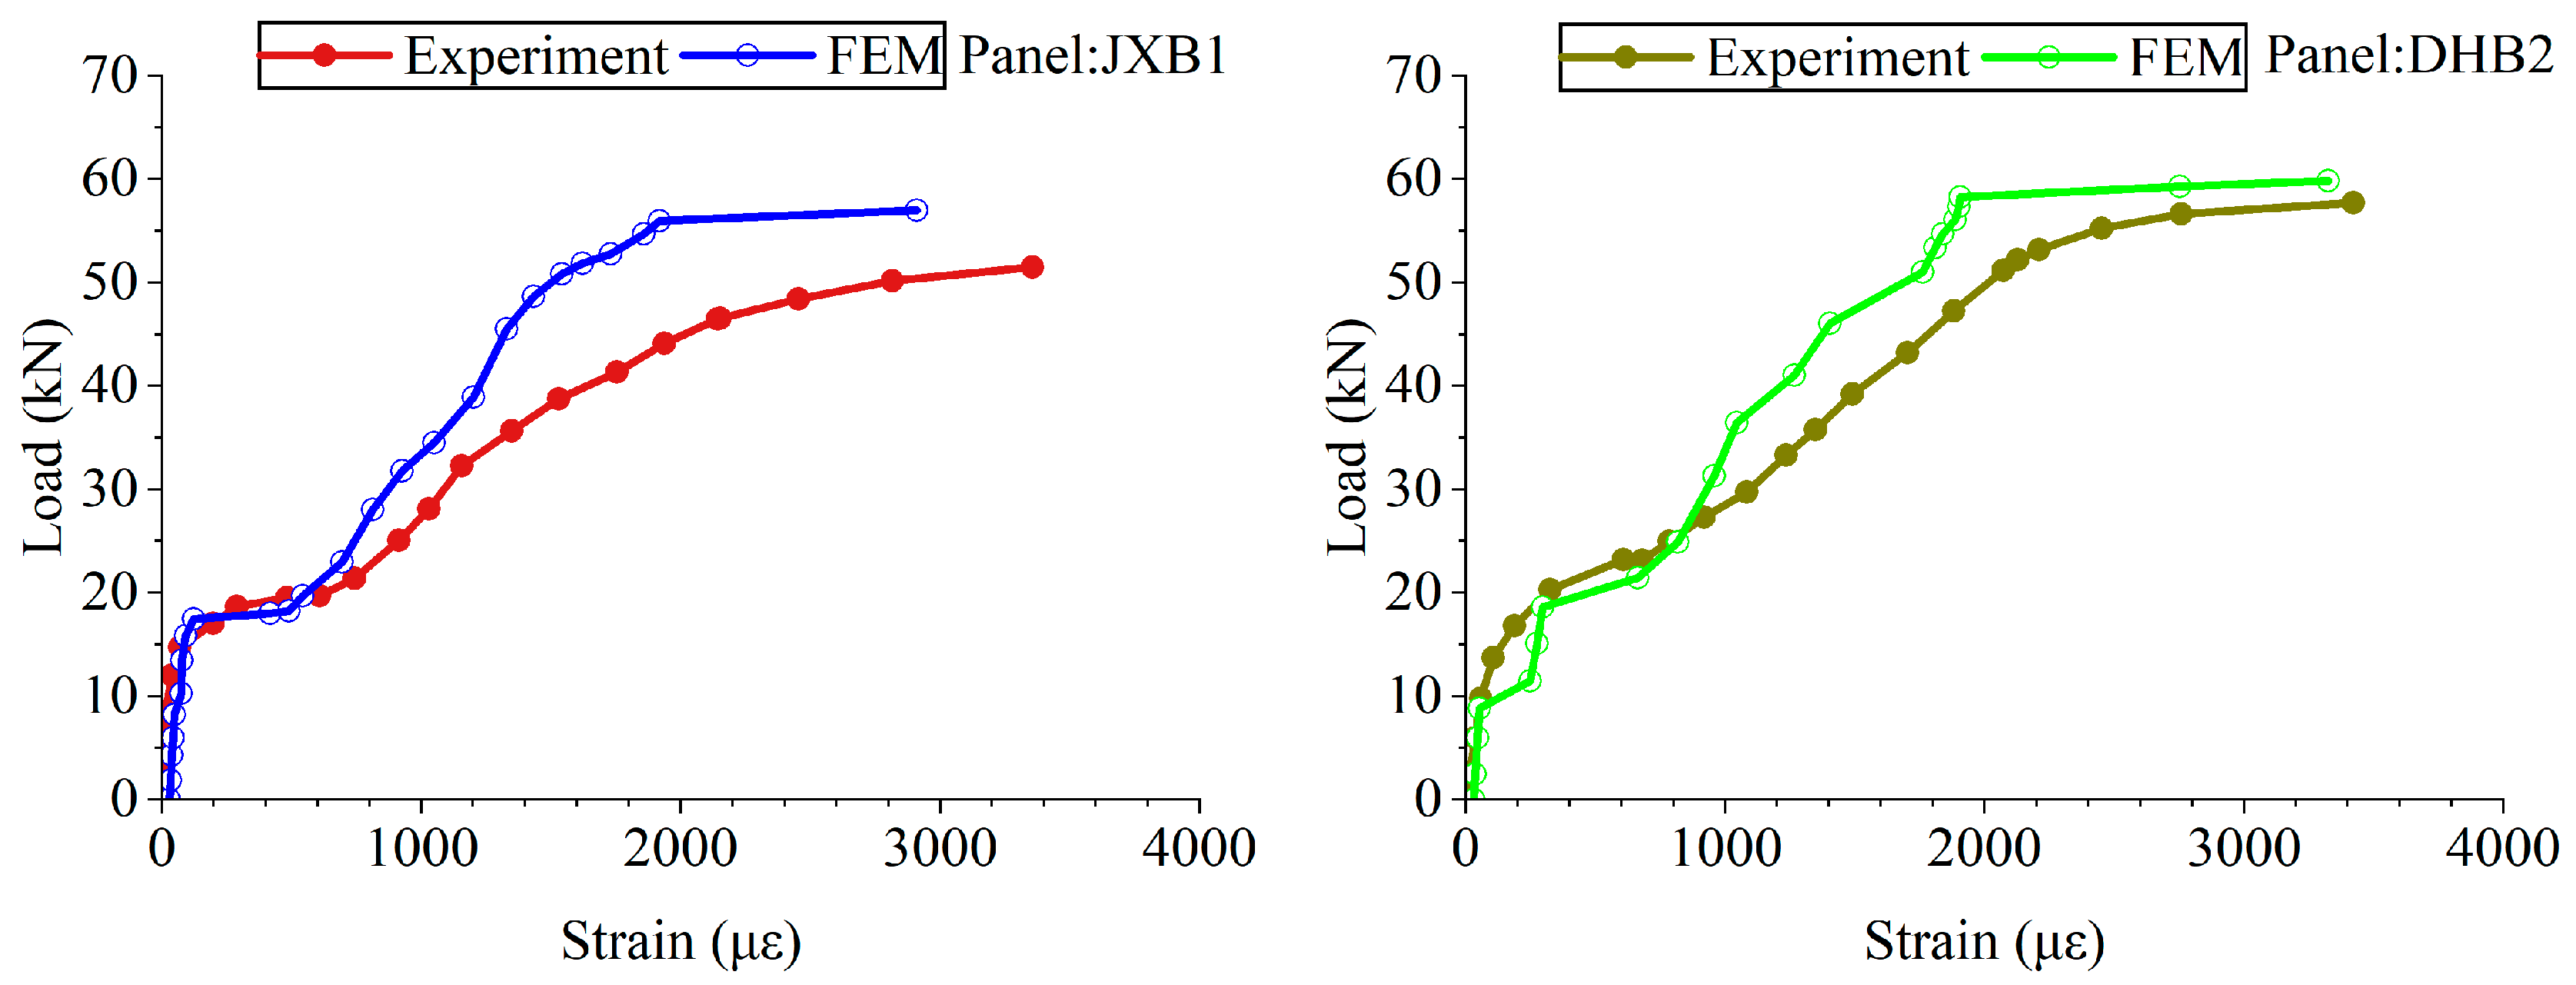
5.3. Load–Strain Relationship in Steel Bars
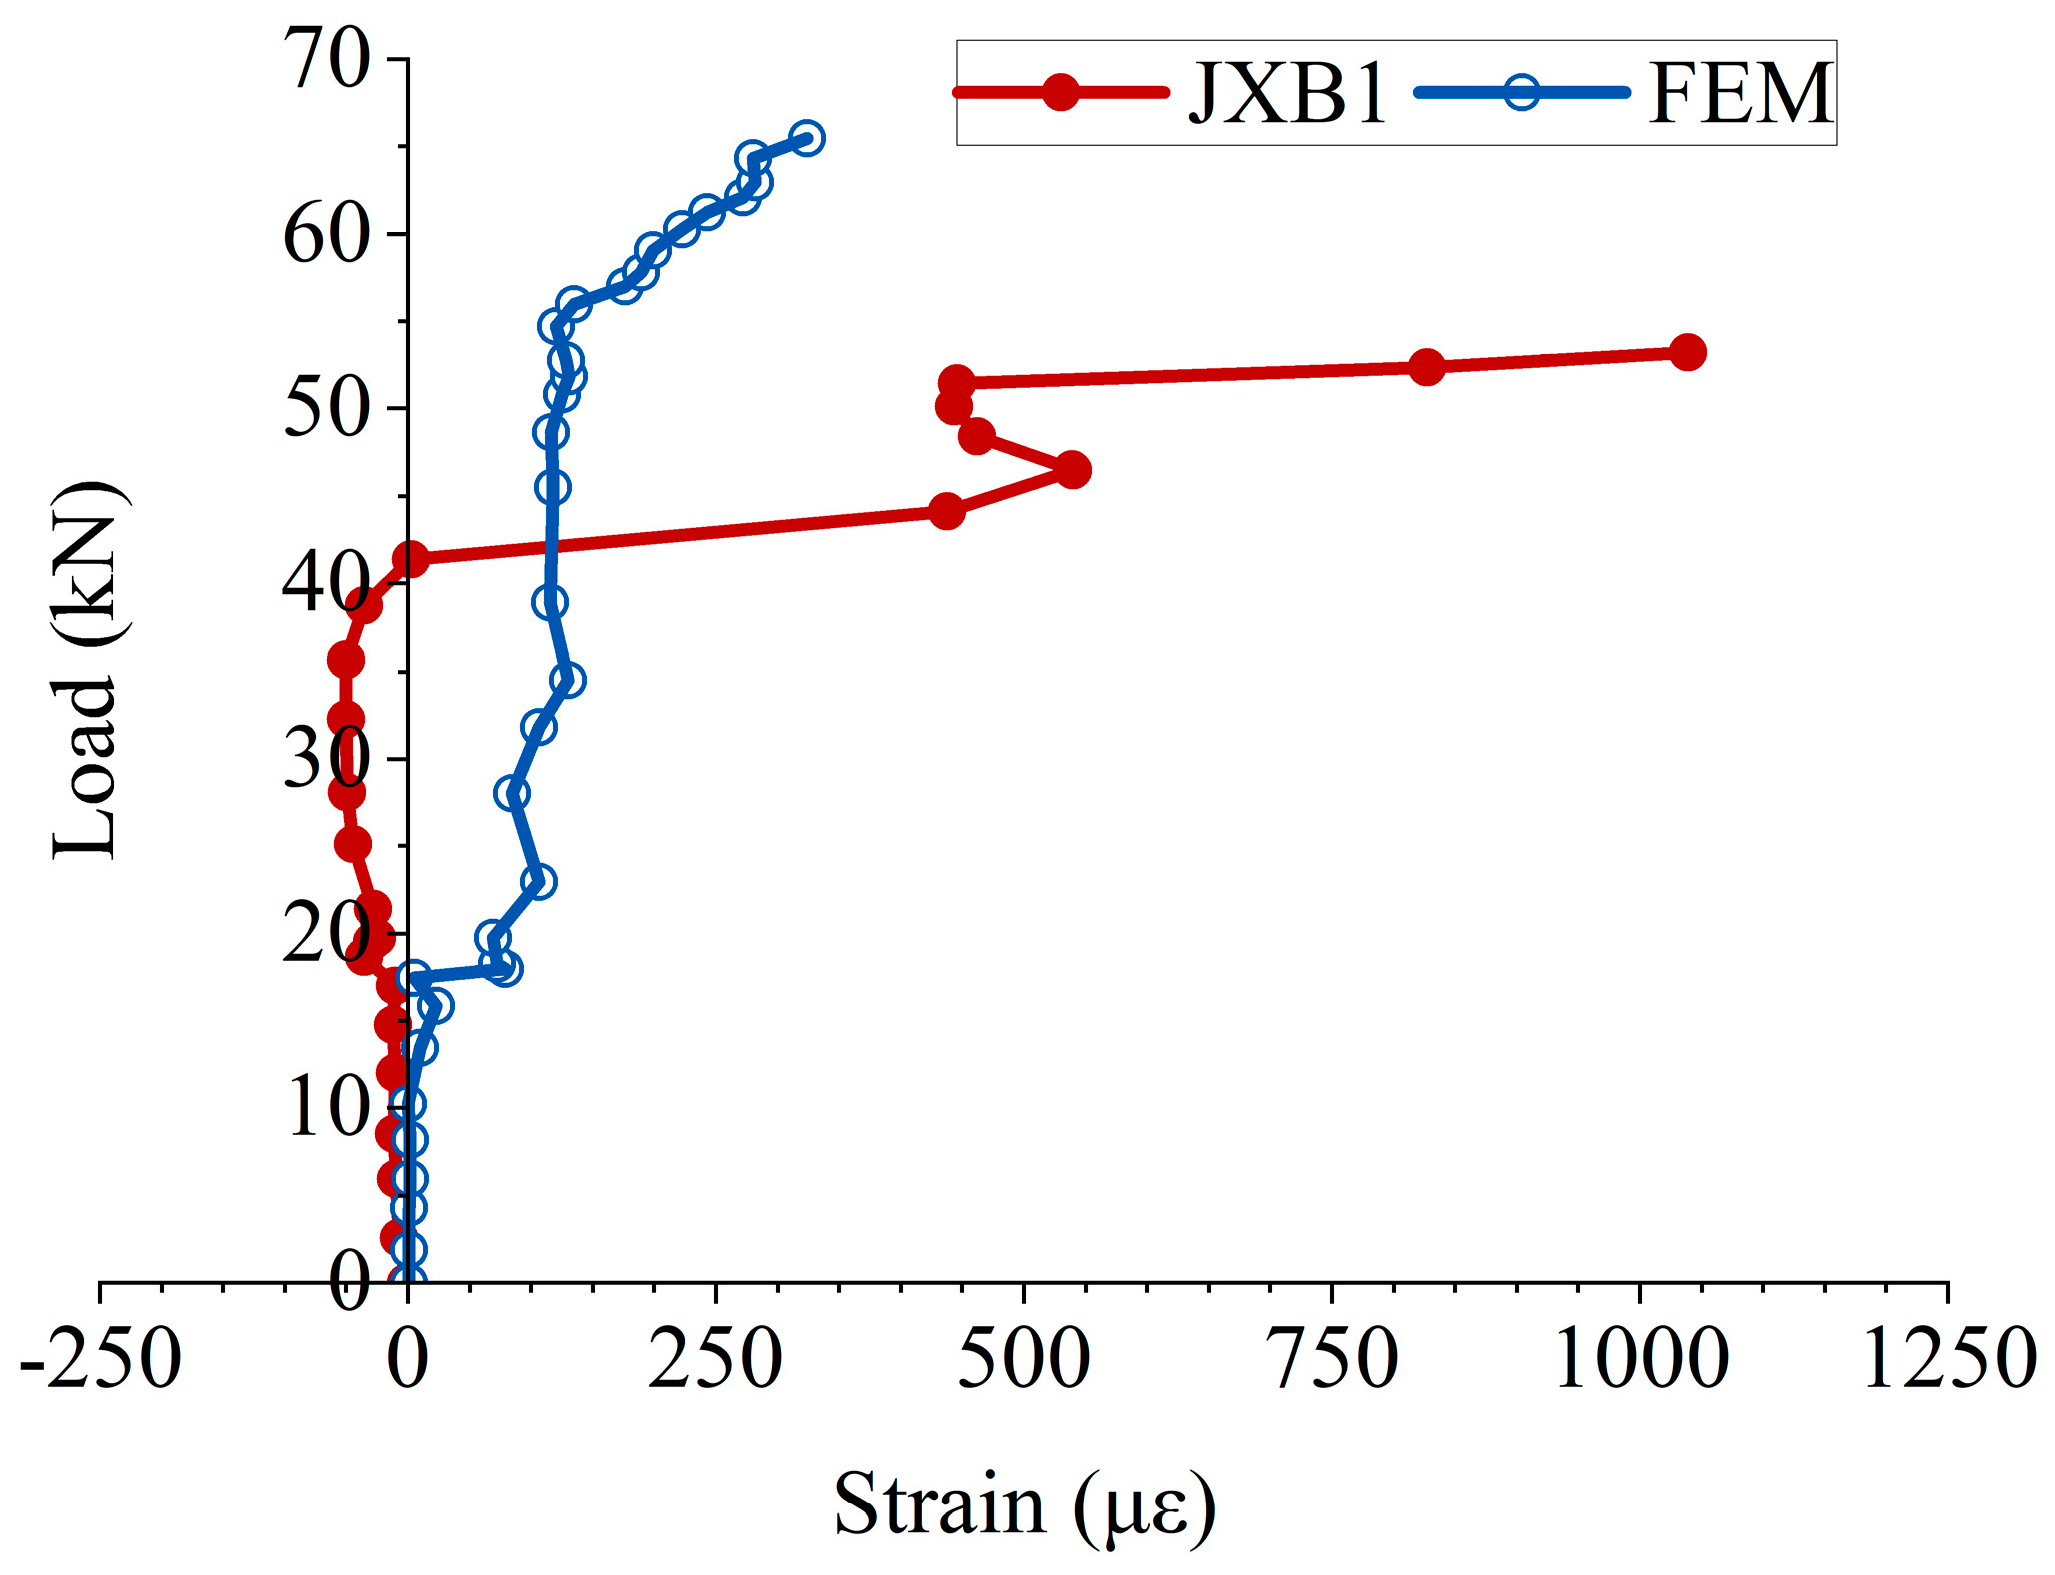
5.4. Load–Strain Relationship in Truss Leg
6. Conclusions
Author Contributions
Funding
Institutional Review Board Statement
Informed Consent Statement
Data Availability Statement
Acknowledgments
Conflicts of Interest
References
- Einea, A. Structural and Thermal Efficiency of Precast Concrete Sandwich Panel Systems. 1992. Available online: https://api.semanticscholar.org/CorpusID:138315946 (accessed on 11 April 2023).
- Einea, A.; Salmon, D.C.; Fogarasi, G.J.; Culp, T.D.; Tadros, M.K. State-of-the-Art of Precast Concrete Sandwich Panels. PCI J. 1991, 36, 78–98. [Google Scholar] [CrossRef]
- Amran, Y.H.M.; Rashid, R.S.M.; Hejazi, F.; Safiee, N.A.; Ali, A.A.A. Response of precast foamed concrete sandwich panels to flexural loading. J. Build. Eng. 2016, 7, 143–158. [Google Scholar] [CrossRef]
- Einea, A.; Salmon, D.C.; Tadros, M.K.; Culp, T.D. A new structurally and thermally efficient precast sandwich panel system. PCI J. 1994, 39, 90–101. [Google Scholar] [CrossRef]
- Losch, E.D.; Hynes, P.W.; Andrews, R., Jr.; Browning, R.; Cardone, P.; Devalapura, R.; Donahey, R.; Freedman, S.; Gleich, H.A.; Goettsche, G.; et al. State of the art of precast/prestressed concrete sandwich wall panels. PCI J. 2011, 56, 131–176. [Google Scholar]
- Benayoune, A.; Samad, A.A.A.; Trikha, D.N.; Ali, A. Buckling Characteristics of Precast Concrete Sandwich Wall Panels. In Proceedings of the 2nd Word Engineering Congress, Sarawak, Malaysia, 1 January 2002. [Google Scholar]
- Mohamad, N.; Hassan, N. The Structural Performance of Precast Lightweight Foam Concrete Sandwich Panel with Single and Double Shear Truss Connectors Subjected to Axial Load. Adv. Mater. Res. 2013, 634–638, 2746–2751. [Google Scholar] [CrossRef]
- Joseph, J.D.R.; Prabakar, J.; Alagusundaramoorthy, P. Experimental studies on through-thickness shear behavior of EPS based precast concrete sandwich panels with truss shear connectors. Compos. Part B Eng. 2019, 166, 446–456. Available online: https://api.semanticscholar.org/CorpusID:140002852 (accessed on 11 April 2023). [CrossRef]
- Jiang, H.; Guo, Z.; Liu, J.; Liu, H. The Shear Behavior of Precast Concrete Sandwich Panels with W-shaped SGFRP Shear Connectors. KSCE J. Civ. Eng. 2018, 22, 3961–3971. [Google Scholar] [CrossRef]
- Yang, X.; Liu, H.X.; Cheng, W. Experimental Study on Flexural Property of Precast Cavity Concrete Sandwich Wall Panels. In IOP Conference Series: Earth and Environmental Science; IOP Publishing: Bristol, UK, 2020; Volume 508, Available online: https://api.semanticscholar.org/CorpusID:225618962 (accessed on 19 April 2023).
- Zhai, X.; Ying, W.; Xueming, W. Experimental Study on Shear Performance of New Composite Connector for Precast Concrete Sandwich Panels. 2017. Available online: https://api.semanticscholar.org/CorpusID:114028138 (accessed on 19 April 2023).
- Luebke, J.; Pozo-Lora, F.F.; Al-Rubaye, S.; Maguire, M. Out-of-Plane Flexural Behavior of Insulated Wall Panels Constructed with Large Insulation Thicknesses. Materials 2023, 16, 4160. Available online: https://api.semanticscholar.org/CorpusID:259049147 (accessed on 17 February 2024).
- Arevalo, S.I.; Tomlinson, D. Experimental thermal bowing response of precast concrete insulated wall panels with stiff shear connectors and simple supports. J. Build. Eng. 2020, 30, 101319. [Google Scholar] [CrossRef]
- Pozo-Lora, F.F.; Maguire, M. Thermal bowing of concrete sandwich panels with flexible shear connectors. J. Build. Eng. 2020, 29, 101124. [Google Scholar] [CrossRef]
- Bush, T.D.; Wu, Z.M. Flexural analysis of prestressed concrete sandwich panels with truss connectors. PCI J. 1998, 43, 76–86. [Google Scholar] [CrossRef]
- Pfeifer, D.W.; Hanson, J.A. Precast Concrete Wall Panels: Flexural Stiffness of Sandwich Panels. 1965. Available online: https://api.semanticscholar.org/CorpusID:138027186 (accessed on 11 April 2023).
- Joseph, J.D.R.; Prabakar, J.; Alagusundaramoorthy, P. Precast concrete sandwich one-way slabs under flexural loading. Eng. Struct. 2017, 138, 447–457. [Google Scholar] [CrossRef]
- Hu, X. Characteristics and Application of Thermal Mortar Materials in Building Materials. Mater. Today Proc. 2020, 22, 2539–2543. [Google Scholar] [CrossRef]
- Bai, F.; Sun, Y.; Liu, X.; Li, X. A theoretical perspective on the effective distribution of shear connectors in sandwich structure. Compos. Struct. 2021, 272, 114139. [Google Scholar] [CrossRef]
- Cox, B.; Syndergaard, P.; Al-Rubaye, S.; Pozo-Lora, F.F.; Tawadrous, R.; Maguire, M. Lumped GFRP star connector system for partial composite action in insulated precast concrete sandwich panels. Compos. Struct. 2019, 229, 111465. [Google Scholar] [CrossRef]
- Salmon, D.C.; Einea, A. Partially Composite Sandwich Panel Deflections. J. Struct. Eng. 1995, 121, 778–783. [Google Scholar] [CrossRef]
- Benayoune, A.; Samad, A.A.A.; Trikha, D.N.; Ali, A.A.A.; Ellinna, S.H.M. Flexural behaviour of pre-cast concrete sandwich composite panel—Experimental and theoretical investigations. Constr. Build. Mater. 2008, 22, 580–592. [Google Scholar] [CrossRef]
- O’Hegarty, R.; Kinnane, O. Review of precast concrete sandwich panels and their innovations. Constr. Build. Mater. 2020, 233, 117145. [Google Scholar] [CrossRef]
- Tawil, H.B.; Tan, C.G.; Sulong, N.H.R.; Nazri, F.M.; Sherif, M.M.; El-Shafie, A.S. Mechanical and Thermal Properties of Composite Precast Concrete Sandwich Panels: A Review. Buildings 2022, 12, 1429. Available online: https://api.semanticscholar.org/CorpusID:252265720 (accessed on 15 May 2023). [CrossRef]
- West, R.P.; Kinnane, O. Composite Behaviour of Thin Precast Concrete Sandwich Panels. 2021. Available online: https://api.semanticscholar.org/CorpusID:236649807 (accessed on 15 May 2023).
- Mlynarczyk, A.J.; Pessiki, S.P. Experimental Evaluation of the Composite Behavior of Precast Concrete Sandwich Wall Panels. PCI J. 2003, 48, 54–71. [Google Scholar]
- Bush, T.D.; Stine, G.L. Flexural behavior of composite precast concrete sandwich panels with continuous truss connectors. PCI J. 1994, 39, 112–121. [Google Scholar] [CrossRef]
- Choi, I.-H.; Kim, J.; Kim, H.-R. Composite Behavior of Insulated Concrete Sandwich Wall Panels Subjected to Wind Pressure and Suction. Materials 2015, 8, 1264–1282. [Google Scholar] [CrossRef]
- Chris, P.P.; Rajeev, S.; Lawrence, D.R. Structural Performance of Hybrid GFRP/Steel Concrete Sandwich Panels. J. Compos. Constr. 2008, 12, 570–576. [Google Scholar] [CrossRef]
- Gara, F.; Ragni, L.; Roia, D.; Dezi, L. Experimental behaviour and numerical analysis of floor sandwich panels. Eng. Struct. 2012, 36, 258–269. [Google Scholar] [CrossRef]
- Huang, Q.; Hamed, E. Nonlinear finite element analysis of composite precast concrete sandwich panels made with diagonal FRP bar connectors. Compos. Struct. 2019, 212, 304–316. [Google Scholar] [CrossRef]
- Suidan, M.; Schnobrich, W.C. Finite Element Analysis of Reinforced Concrete. J. Struct. Div. 2019, 99, 2109–2122. [Google Scholar] [CrossRef]
- Yaman, T.S.; Lucier, G.W. Shear Transfer Mechanism between CFRP Grid and EPS Rigid Foam Insulation of Precast Concrete Sandwich Panels. Buildings 2023, 13, 928. Available online: https://api.semanticscholar.org/CorpusID:257887540 (accessed on 11 April 2023). [CrossRef]


| Name of Panel | Top Wythe d1 (mm) | Insulation Layer d2 (mm) | Bottom Wythe d3 (mm) | L × b × d (mm × mm × mm) |
|---|---|---|---|---|
| DHB1 | 70 | 0 | 60 | 3700 × 1200 × 130 |
| DHB2 | 90 | 0 | 60 | 3700 × 1200 × 150 |
| JXB1 | 70 | 20 | 60 | 3700 × 1200 × 150 |
| JXB2 | 70 | 20 | 60 | 3700 × 1200 × 150 |
| Materials | fcu (MPa) | ft (MPa) | Ec (GPa) |
|---|---|---|---|
| concrete | 48.28 | 3.71 | 29.8 |
| insulation mortar | 5.8 | 0.5 | 1.0 |
| Steel Materials | Diameter (mm) | Yield Stress fy (MPa) | Stress at Ultimate Strength (MPa) | Es (GPa) |
|---|---|---|---|---|
| Steel reinforcement | 8 | 570 | 694 | 194 |
| truss chord | 10 | 531 | 690 | 214 |
| truss leg | 6 | 400 | 707 | 201 |
| Items | Experiment of JXB1 | FEA of JXB1 | Experiment of DHB2 | FEA of DHB2 |
|---|---|---|---|---|
| 1st cracking load (kN) | 17.0 | 17.5 | 20.3 | 18.6 |
| Increase rate of deflection curve before cracking (mm/kN) | 0.25 | 0.30 | 0.39 | 0.37 |
| Increase rate of deflection curve after cracking (mm/kN) | 0.61 | 0.61 | 0.64 | 0.47 |
| Location of cracking | Mid-span | Mid-span | Mid-span | Mid-span |
| Yield load (kN) | 50.2 | 55.9 | 52.2 | 58.2 |
| Increase rate of deflection curve after yield (mm/kN) | 6.5 | 5.8 | 7.2 | 9.5 |
Disclaimer/Publisher’s Note: The statements, opinions and data contained in all publications are solely those of the individual author(s) and contributor(s) and not of MDPI and/or the editor(s). MDPI and/or the editor(s) disclaim responsibility for any injury to people or property resulting from any ideas, methods, instructions or products referred to in the content. |
© 2024 by the authors. Licensee MDPI, Basel, Switzerland. This article is an open access article distributed under the terms and conditions of the Creative Commons Attribution (CC BY) license (https://creativecommons.org/licenses/by/4.0/).
Share and Cite
Zhang, M.; Feng, W.; Chen, K.; Li, B. Flexural Behavior of a New Precast Insulation Mortar Sandwich Panel. Appl. Sci. 2024, 14, 2071. https://doi.org/10.3390/app14052071
Zhang M, Feng W, Chen K, Li B. Flexural Behavior of a New Precast Insulation Mortar Sandwich Panel. Applied Sciences. 2024; 14(5):2071. https://doi.org/10.3390/app14052071
Chicago/Turabian StyleZhang, Mingshan, Weirong Feng, Kepeng Chen, and Benyue Li. 2024. "Flexural Behavior of a New Precast Insulation Mortar Sandwich Panel" Applied Sciences 14, no. 5: 2071. https://doi.org/10.3390/app14052071
APA StyleZhang, M., Feng, W., Chen, K., & Li, B. (2024). Flexural Behavior of a New Precast Insulation Mortar Sandwich Panel. Applied Sciences, 14(5), 2071. https://doi.org/10.3390/app14052071