Article

Microstructure Study on Very High Cycle Fatigue of an Additively Manufactured Aluminium Alloy via Advanced Characterization Methods

1
School of Aeronautics, Northwestern Polytechnical University, Xi’an 710072, China
2
School of Aircraft, Xi’an Aeronautical Institute, Xi’an 710000, China
3
Overall Designing Institute of Hubei Space Technology Academy, Wuhan 430040, China
*
Author to whom correspondence should be addressed.
Appl. Sci. 2024, 14(5), 2025; https://doi.org/10.3390/app14052025
Submission received: 4 December 2023 / Revised: 17 February 2024 / Accepted: 27 February 2024 / Published: 29 February 2024
(This article belongs to the Section Materials Science and Engineering)

Abstract

:

Featured Application

This work presents a typical case of using advanced material characterization techniques such as focused ion beam (FIB), scanning electron microscopy (SEM), and transmission electron microscopy (TEM) to study the key microstructure in the engineering failure of an additively manufactured (AM) aluminum alloy after very high cycle fatigue (VHCF).

Abstract

The engineering application of additively manufactured (AM) metallic materials is quite limited by their fatigue behaviors, which are very inconsistent with that of conventionally wrought or cast ones. Here, based on advanced material characterization techniques, such as focused ion beam (FIB), scanning electron microscopy (SEM), and transmission electron microscopy (TEM), the microstructures underneath fracture surfaces were thoroughly investigated in an AM aluminum (AlSi10Mg) alloy with horizontal and vertical building orientation enduring very high cycle fatigue (VHCF) loading under the stress ratios R = −1, 0, and 0.5. Two VHCF failure specimens A and B were representatively selected to further examine SEM and TEM sample preparation via FIB milling. Specimen A was horizontally printed and failed at R = −1; specimen B was vertically printed and failed at R = 0. TEM samples A1 and B1 were lifted from locations near the crack initiation sites on the fracture surfaces of specimens A and B; The locations of TEM samples A2 and B2 kept away from the crack origin sites but still within the “fish-eye” region of crack steady growth. TEM observations show that there was no characteristic microstructure induced by VHCF in different oriented specimens and under various R values.

1. Introduction

Fatigue is ubiquitous, and causes the vast majority failure of engineering structures and materials [1,2]. In this paper, fatigue is defined as a degradation of mechanical properties leading to failure of a material or a component under cyclic loading [3], when the failure cycles Nf ≥ 107, i.e., very high cycle fatigue (VHCF) [4,5]. Additive manufacturing or 3D printing is a new promising technology with the aim being to produce net or near-net components with complex configurations, which is emerging to replace the traditionally subtractive machining, such as turning, milling, grinding, etc., as an alternative method [6]. In view of this point, additively manufactured (AM) metallic materials have drawn significant attention from both academia and industry [7]. For AM metallic materials, fatigue performance, especially in VHCF regime, has become a key factor restricting their engineering applications [6,8,9,10,11,12,13,14,15,16,17].
As the most abundant metallic element in the Earth’s crust, aluminum and its alloys are widely applied in engineering as structural materials beneficial to their superior mechanical properties: high strength-to-weight ratio, low mass density, and good corrosion resistance [18]. Cast aluminum alloys [7,18,19], e.g., AlSi10Mg [10,17,20], AlSi7Mg [21], and AlSi12 [22], have excellent melting fluidity, which makes them extensively used in 3D printing of metals and alloys as one of the most popular AM metallic materials.
According to the traditional paradigm of fatigue research, S-N (stress amplitude σa versus Nf) data have always been the most effective tools [23], and the fractography [24] is often used to conduct a post mortem analysis for understanding the fatigue failure process. With regard to the study of VHCF, fatigue crack initiation keeps crucial role for accounting a vast majority failure life, about 90% at Nf ≥ 107, and greater than 99% at Nf ≥ 108 in high-strength steels [25]. For high-strength steels, their S-N data exhibit typical duplex or staircase shapes, their fracture surfaces are well defined, and then the failure types can be determined [26]. In the first slope of S-N data from low-cycle to high-cycle fatigue (HCF), crack initiation tends to occur on the specimen surface due to persistent slip band or other mechanisms [27]. In the second slope of S-N data beyond a quite large number of failure cycles, usually Nf ≥ 106, fatigue cracks prefer to specimen interior, and with “fish eye” (FiE) morphology frequently originated at nonmetallic inclusion [25,26,27]. Similar phenomena and S-N behaviors have also been reported in many titanium alloys with different microstructures [28,29].
Nevertheless, there is no such type of S-N data in aluminum alloys [2,3,30]. On the contrary, even VHCF cracks may not initiate inside the specimen, and cannot cause internal FiE fracture like that in high-strength steels [25,26,27,31,32] and some titanium alloys [28,29]. Besides S-N data and the fractography, the microstructure underneath the fracture surface is another important objective which can help us to comprehend the accumulative process of fatigue damage [1]. For high-strength steels, fine granular area (FGA) is a characteristic region of crack initiation in VHCF regime [25,26,27], which is identified as a thin layer with nanocrystalline and fine-grained structure [33,34,35,36] top on the both side of a pair of fracture surfaces [35]. For many titanium alloys, there are several rough area (RA) regions with crack initiation from high-cycle to very high cycle stage [5]. While under stress ratio R = −1, i.e., symmetric cyclic axial loading (push-pull), the microstructure underneath the fracture surface within the RA region of VHCF crack initiation is characterized as having layers of nanograins and refined grains with a thickness of tens to hundreds of nanometers [4,5,29]. It is noted that nanograin formation does not only occur in the crack initiation region on the fracture surface of VHCF under negative stress ratios, particularly R = −1, but also appears in the ridge tips of ductile dimples on the broken surface of metallic materials endured monotonic tension [37].
Consequently, Ref. [38] points out that nanograin formation and microstructure refinement are typical features of VHCF crack initiation at the nano-scale. Based on this, their failure types can be redefined and the process of fatigue damage can be understood from another perspective [17]. In this paper, the research mainly focuses on the crack initiation-induced microstructure of an AM aluminum alloy (AlSi10Mg) (MSE Supplies LLC, Tucson, AZ, USA) with horizontal and vertical building orientations under various stress ratios (R = −1, 0, and 0.5) after VHCF loading via advanced material characterization techniques, including scanning electron microscopy (SEM) [39], focused ion beam (FIB) [40], and transmission electron microscopy (TEM) [41].

2. Material and Specimen

2.1. Additive Manufacturing Process

The studied material is an AM aluminum alloy fabricated by selective laser melting (SLM), laser powder bed fusion (L-PBF), or laser-based powder bed fusion of metals (PBF-LB/M). In this process, the pre-alloyed powder with gas atomization was used to print the tensile and fatigue specimens with different building orientations (horizontal and vertical).
Table 1 shows nominal chemical composition of the pre-alloyed aluminum powder on weight percent. Obviously, the powder is AlSi10Mg alloy; and then, after the process of PBF-LB/M, the AM material is also the same AlSi10Mg alloy. Table 2 gives five key printing parameters of the process: laser power p; layer thickness t; scanning speed v; hatch spacing h; and the combination Ev = p/(tvh), i.e., the volumetric laser energy density [42]. The printing strategy is similar to that described in the literature [8,9,17].

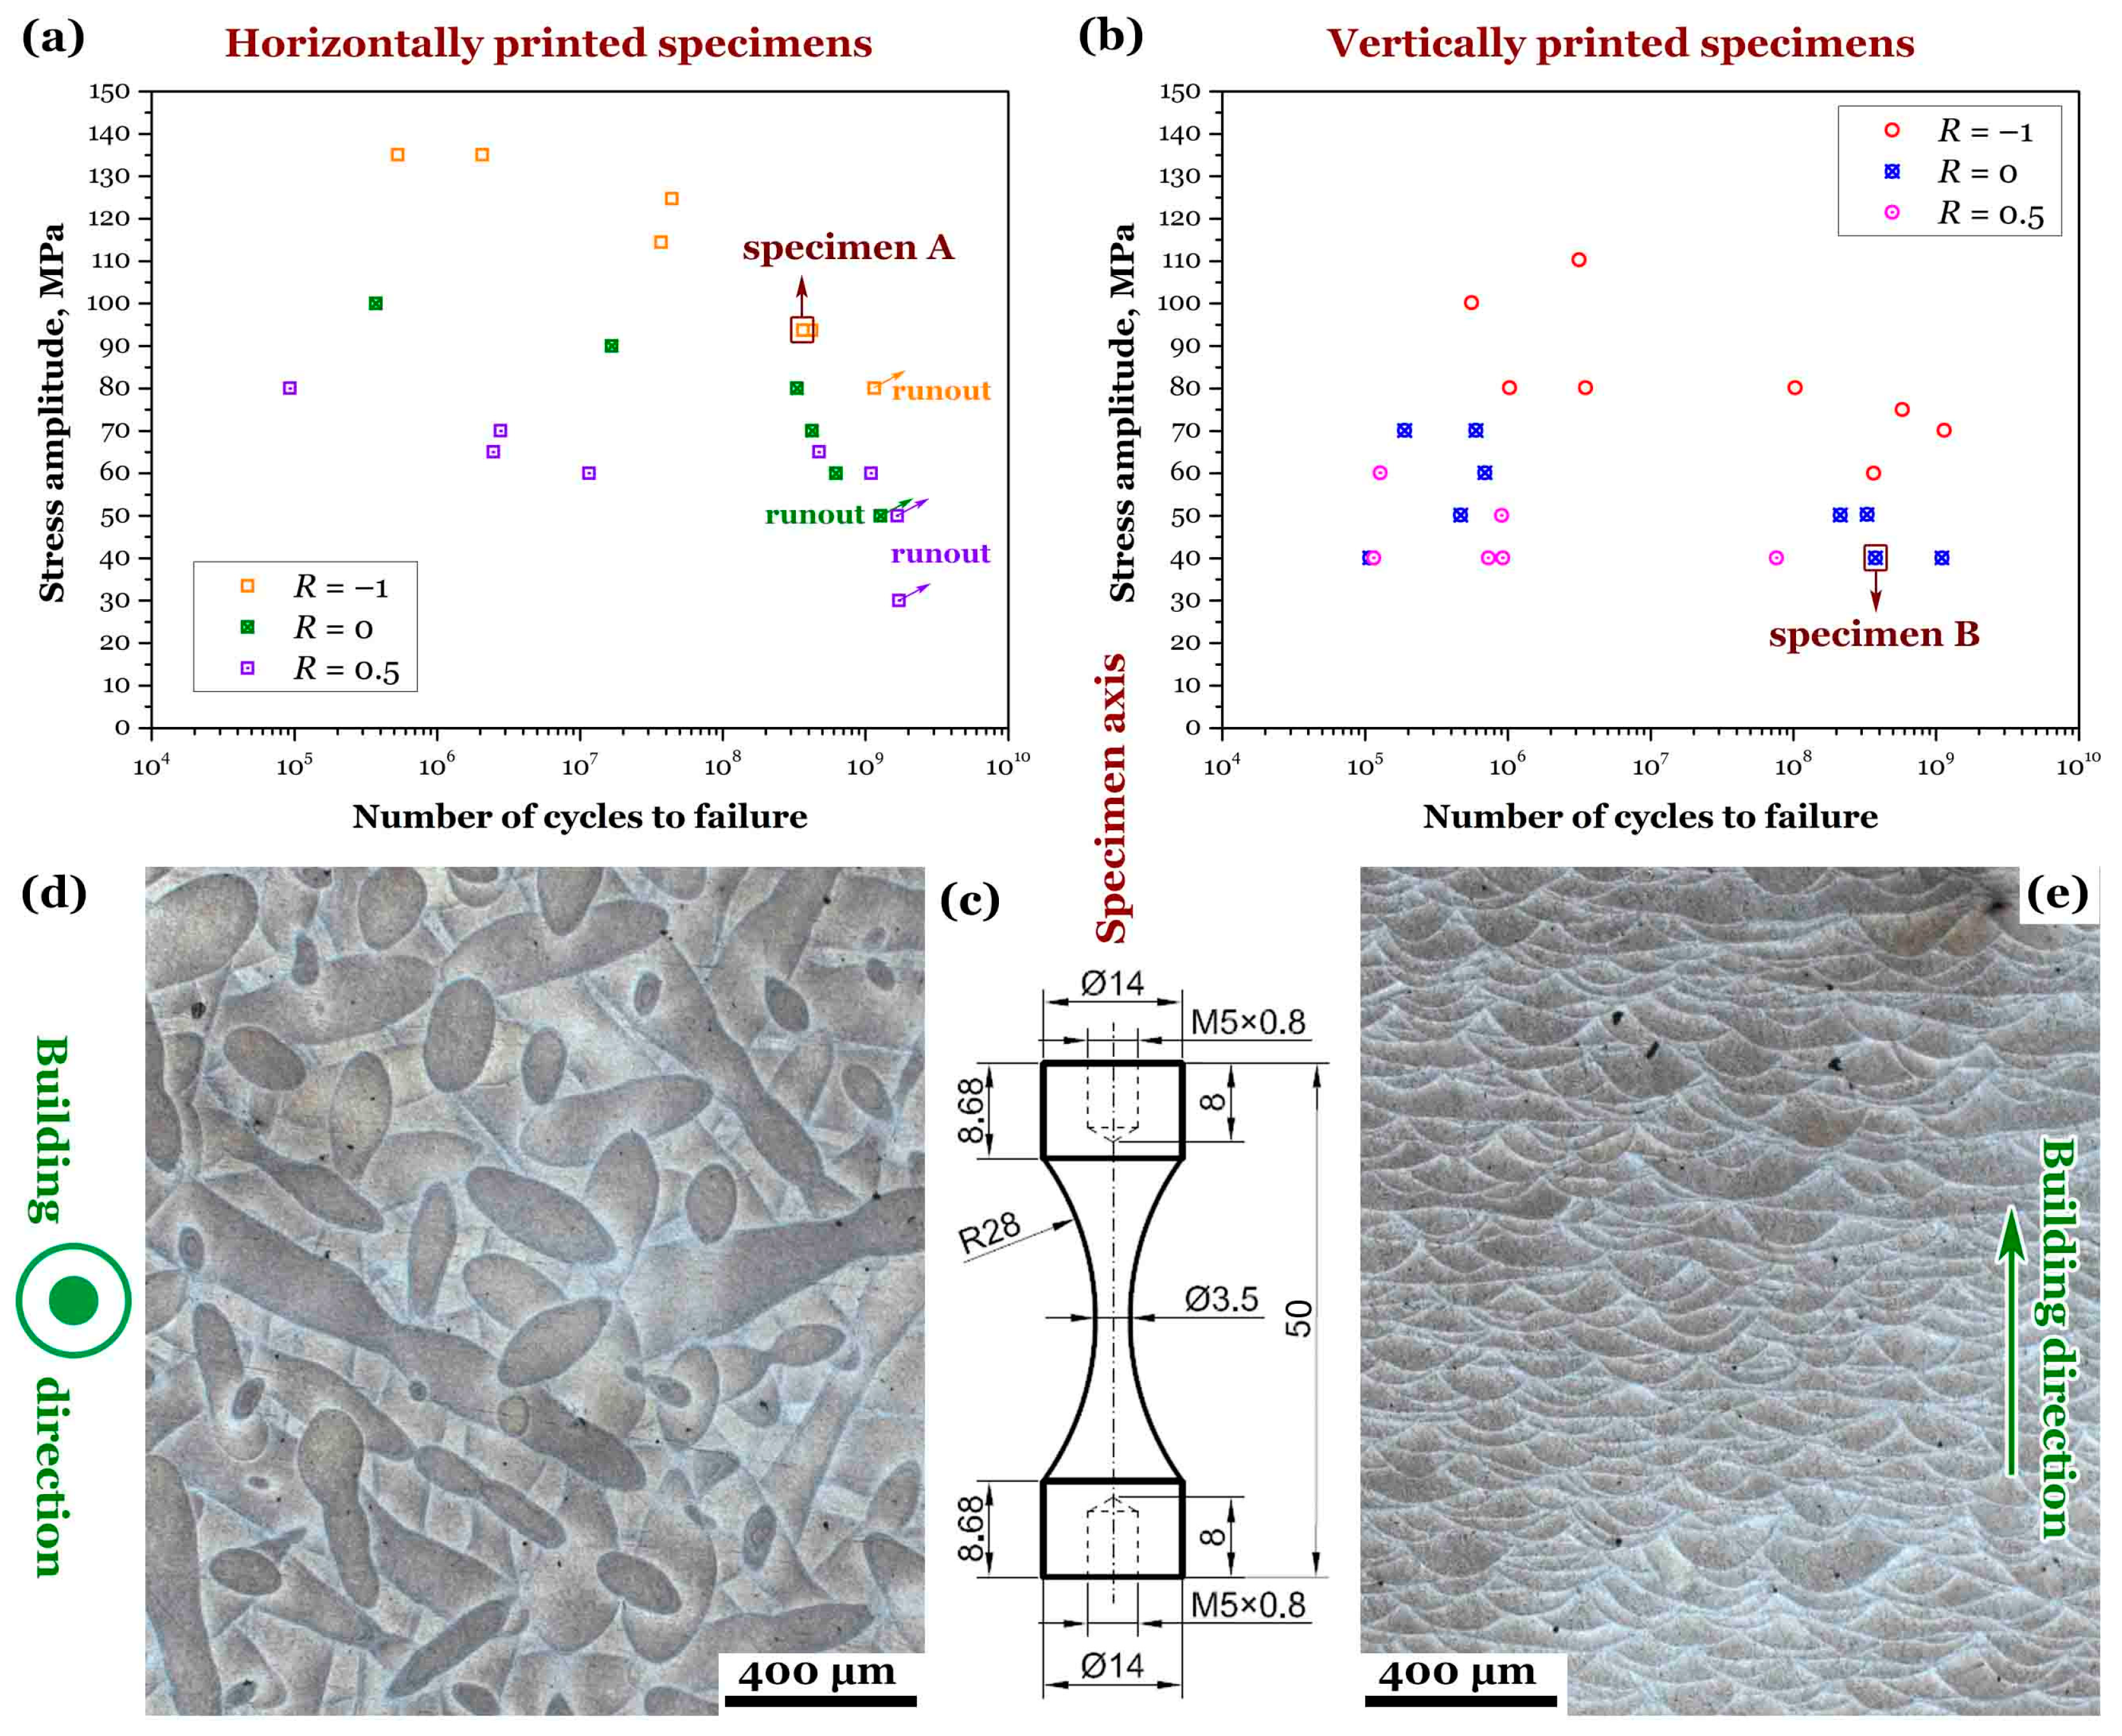
2.2. Anisotropic Behavior of Tensile Properties

Five tensile specimens with dog-bone shape of gauge length 56 mm and minimum diameter 10 mm were monotonically stretched until final fracture under quasi-static tension at a loading speed of 2 mm/min, in which two specimens were horizontally printed, and the other three were vertically printed.
For the horizontally printed specimens, along the specimen axis, i.e., perpendicular to the building direction, the obtained mechanical properties as follows: yield stress σ0.2 = 278 MPa, ultimate tensile stress σu = 465 MPa, elongation at fracture δ = 11.5%. For the vertically printed specimens, along the specimen axis, i.e., parallel to the building direction, the obtained mechanical properties as follows: yield stress σ0.2 = 244 MPa, ultimate tensile stress σu = 435 MPa, elongation at fracture δ = 3.8%.

2.3. Fatigue Specimen, Data, and Microstructure

Figure 1a,b exhibit fatigue behaviors of horizontally and vertically printed specimens in terms of S-N data with stress ratios R = −1, 0 and 0.5 under axial loading with vibration frequency of 20 k ± 500 Hz at room temperature and in ambient air by using an ultrasonic equipment (GF20-TC, Lasur, Paris, France) superimposed an tensile machine, as described in Ref. [43]. Figure 1c illustrates the size and geometry of the ultrasonic fatigue specimens which were designed to satisfy the resonant condition [43].
Figure 1d,e present the original 3D printed microstructure of the AM aluminum alloy perpendicular and parallel to the building direction under optical microscopy (OM: Axiovert 200 MAT, Zeiss, White Plains, NY, USA). In Figure 1d,e, the light regions are Al-rich and Si-poor, and the dark regions are Si-rich and Al-poor.

3. Results and Discussion

3.1. Selected VHCF Specimens A and B

Two representative specimens A and B were selected for further SEM analysis as box marked in Figure 1a,b. Specimen A was horizontally printed and failed in the VHCF regime at R = −1, with the following details: σm = 1 MPa, σa = 93 MPa, Nf = 3.67 × 10⁸ cycles. Specimen B was vertically printed and failed in VHCF regime at R = 0, with the following details: σm = 40 MPa, σa = 40 MPa, Nf = 3.82 × 10⁸ cycles.
Figure 2 shows the typical SEM appearance for VHCF crack initiation of the AM aluminum alloy with different building orientations under various R values via a Helios Nanalab 600i (FEI, Hillsboro, OR, USA). Figure 2a,b is a medium-magnification SEM image with a same tilted angle, displaying the internal FiE fractures of specimens A and B; Figure 2c–f is a high-magnification SEM image on the top view, showing the local broken surface around the locations A1, A2, B1, and B2 prepared to lift TEM samples A1, A2, B1, and B2 via FIB milling with the dual FIB/SEM beam system (Helios Nanalab 600i, FEI, Hillsboro, OR, USA).

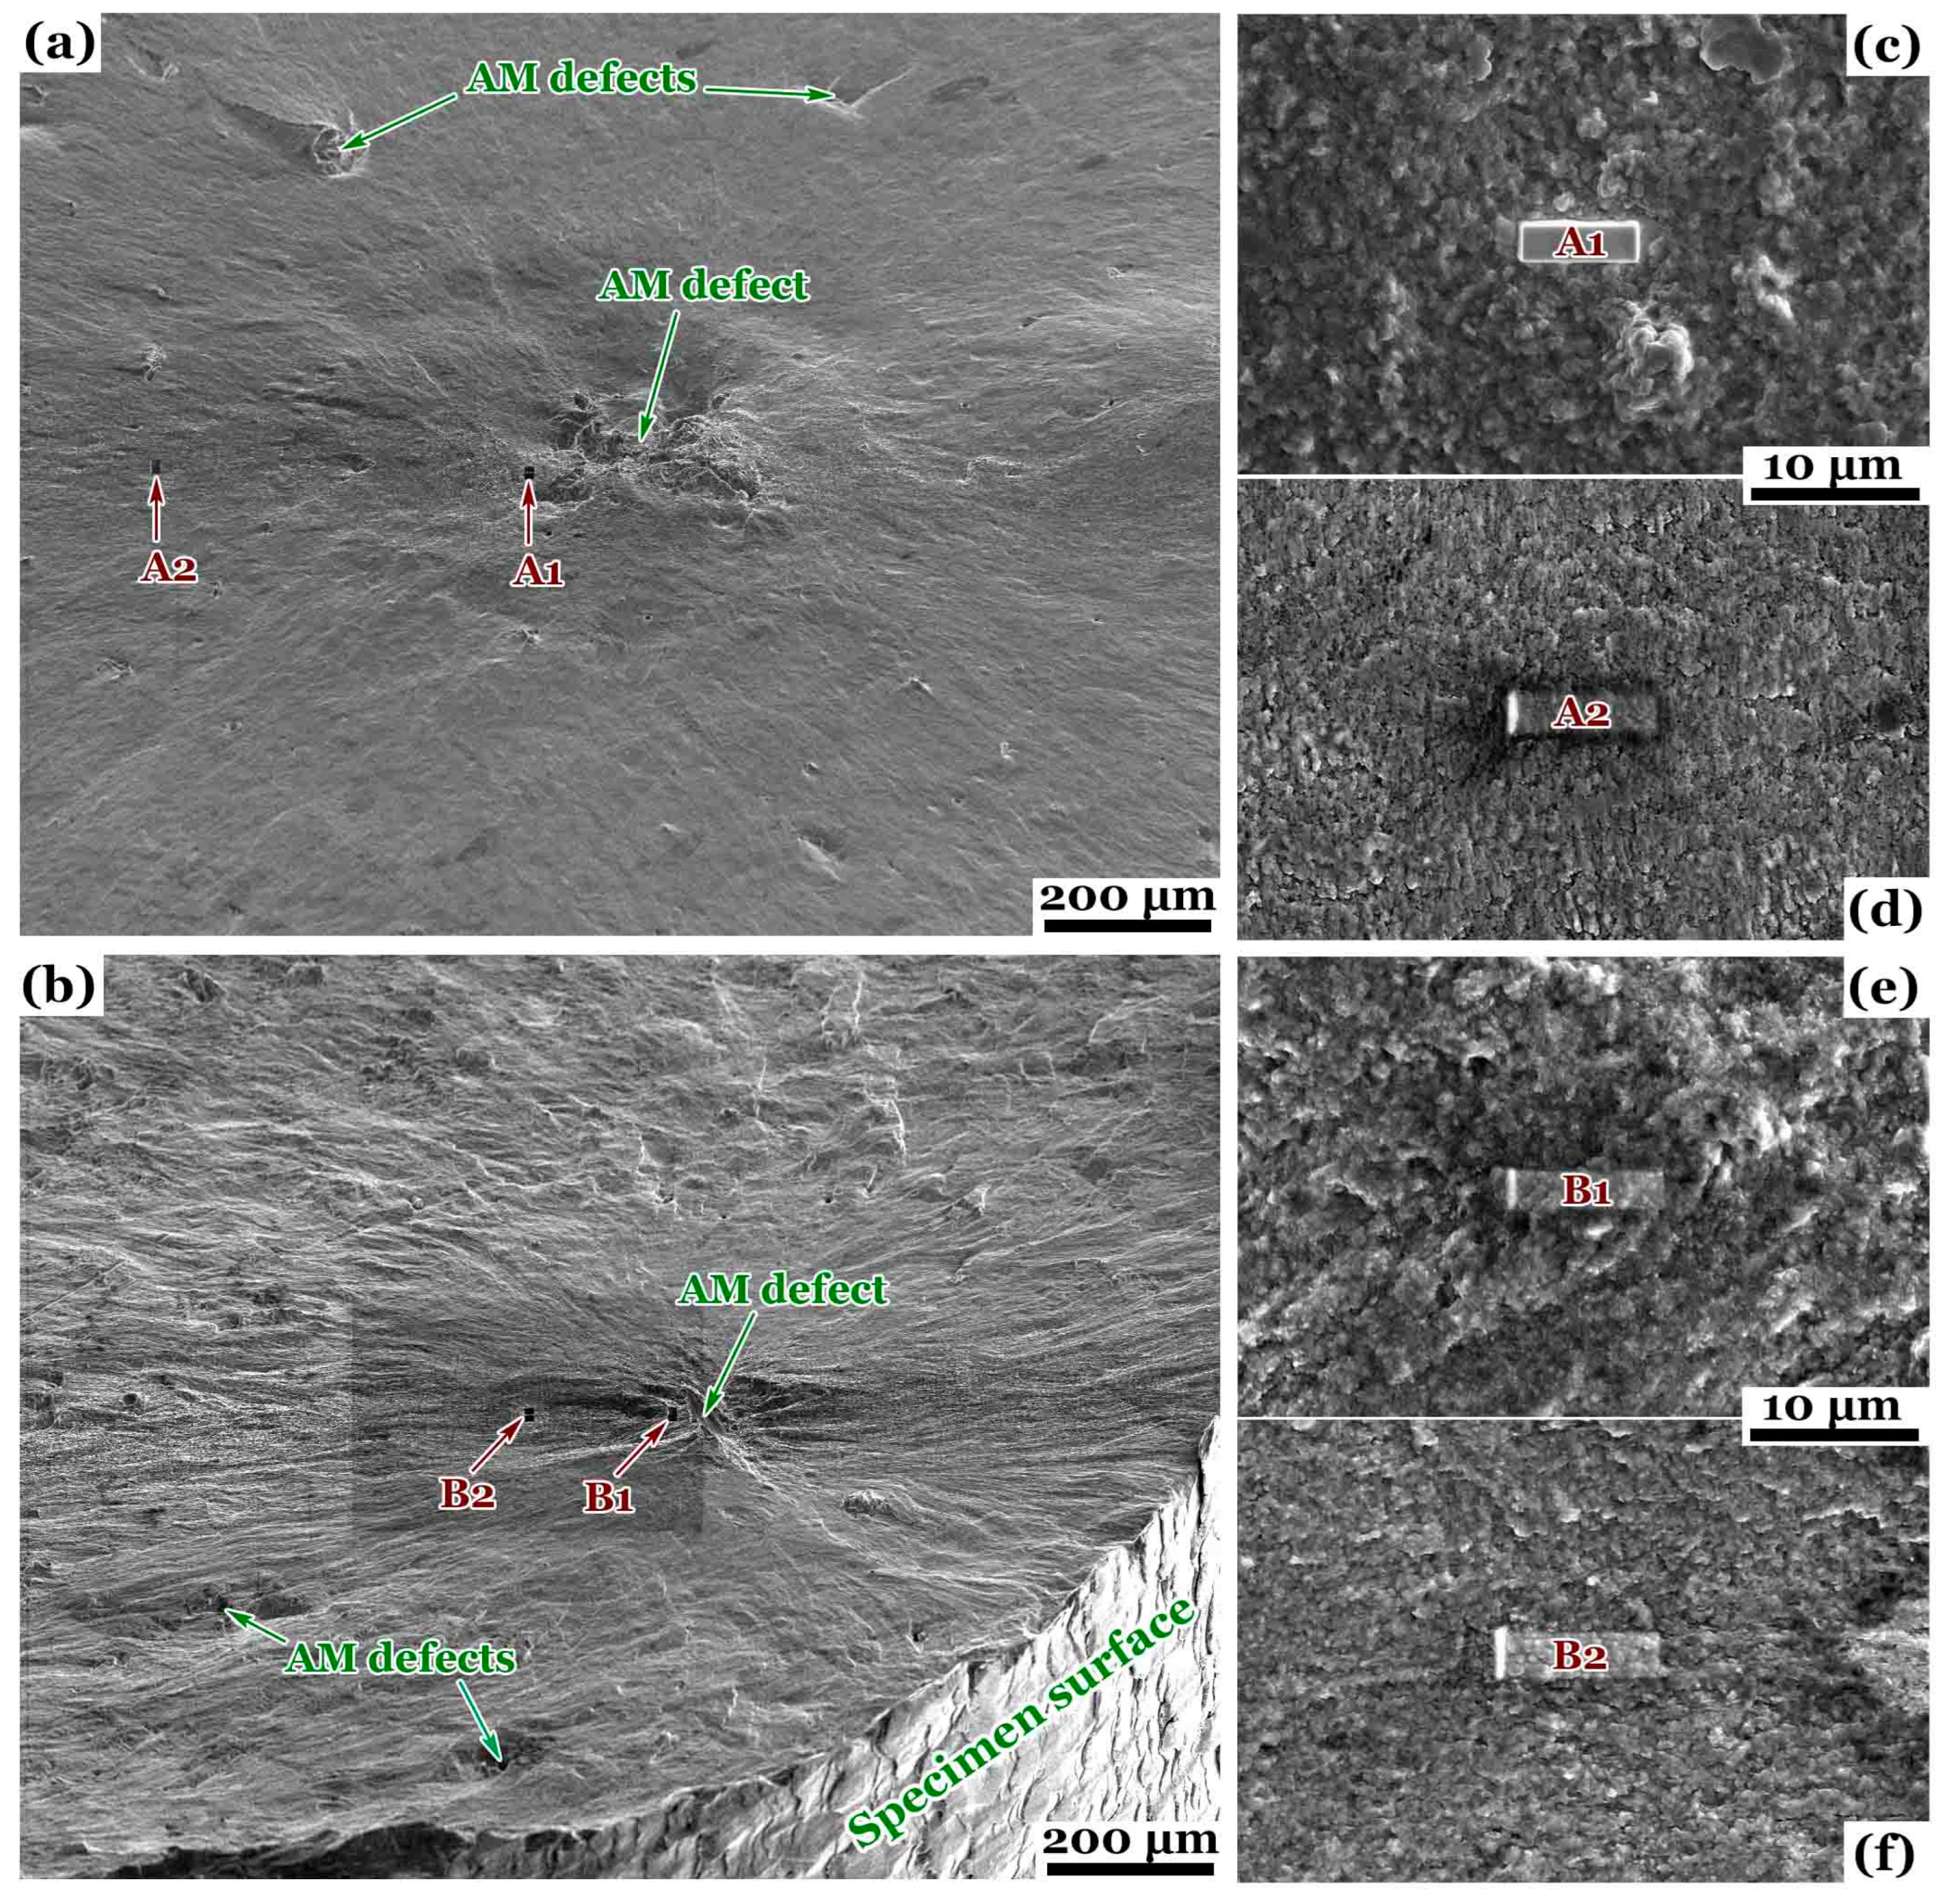
3.2. Typical SEM Morphology of Crack Initiation

In comparison with Figure 2a,b, there is no obvious difference in the fracture surfaces of specimens A and B, except that the FiE area of specimen A is larger than specimen B, the size of the AM defect-induced VHCF in specimen A is greater than specimen B, and the crack initiation site at specimen B is comparatively closer to the specimen surface than specimen A. The main crack of VHCF originated from an AM defect which is the biggest one on the FiE region.
These trivial variances are not very typical, but are dependent on the intrinsic distribution of AM defects inside the fatigue specimen. This defect distribution can be approximately considered random, so even with the same fatigue life Nf, there can be very different patterns of the AM defect that lead to the initiation of VHCF cracks. Generally, the following can be stated in these two cases: within the FiE regions, the fracture surface is relatively flat, smooth, and with small roughness; outside the FiE region, the surface roughness increases significantly.

3.3. Local Fractography along Crack Growth Path

Specimen A was selected to represent the horizontally printed AM aluminum alloy under VHCF loading at negative stress ratios. Two TEM samples A1 and A2 were excavated from locations A1 and A2 pointed by arrows in Figure 2a. Specimen B was selected to represent the vertically printed AM aluminum alloy under VHCF loading at positive stress ratios. Two TEM samples B1 and B2 were excavated from locations B1 and B2 pointed by arrows in Figure 2b.
On the fracture surfaces, locations A1 and B1 are close to the initiation site of main VHCF cracks, and at the periphery of the AM defect which induced the final failure of specimens A and B, respectively. Contrarily, locations A2 and B2 are properly far away from the initiation site but still within the FiE region. Specifically, location A2 is farther away from the fatigue origin than location B2.
Figure 2c,e show the local SEM images on the locations A1 and B1, which appear to have a not very clearly granular morphology. Figure 2d,f show the local SEM images on the locations A2 and B2, which appear to have a mixed morphology of striations and granules. In general, striations and granules exhibit a trade-off relationship. Figure 2c of location A1 has the highest degree of granularity, followed by Figure 2e of location B1; Figure 2d of location A2 has the highest clearness of fatigue striations, followed by Figure 2f of location B2.

3.4. TEM Sample Preparation by Using FIB Technique

On locations A1, A2 and B1, B2 of fracture surfaces in specimens A and B, FIB technique was used to prepare TEM samples of thins film along the specimen axes. The details of the procedure are as follows [4,29,40]:
  • A rectangular platinum layer was physically vapor-deposited on the posited location to protect the selective fracture surface and the microstructure underneath guided by beams of ions and electrons via a gas injection system of the FIB/SEM microscope. The platinum layers were labeled as A1, A2, B1, and B2 in Figure 2c–f with small translucent blocks.
  • On both long sides of the rectangular layer, two trenches were milled from the unprotected fracture surface with spattered Ga+ cations, and obtained a rough sample of profile microstructure which was still connected with the matrix on three planes.
  • By tilting the fractured specimen, the sample was separated from the matrix with FIB etching, and attached to the tip of a nano-manipulator (OmniProbe, Oxford Instrument, Abingdon, UK).
  • Lifted out the rough sample of about length 10 μm, depth 5 μm and thickness 1 μm; and then mounted on an FIB-TEM grid holder; eventually thinned and polished to a foil of about length 5 μm, depth 4 μm and thickness 50 nm.

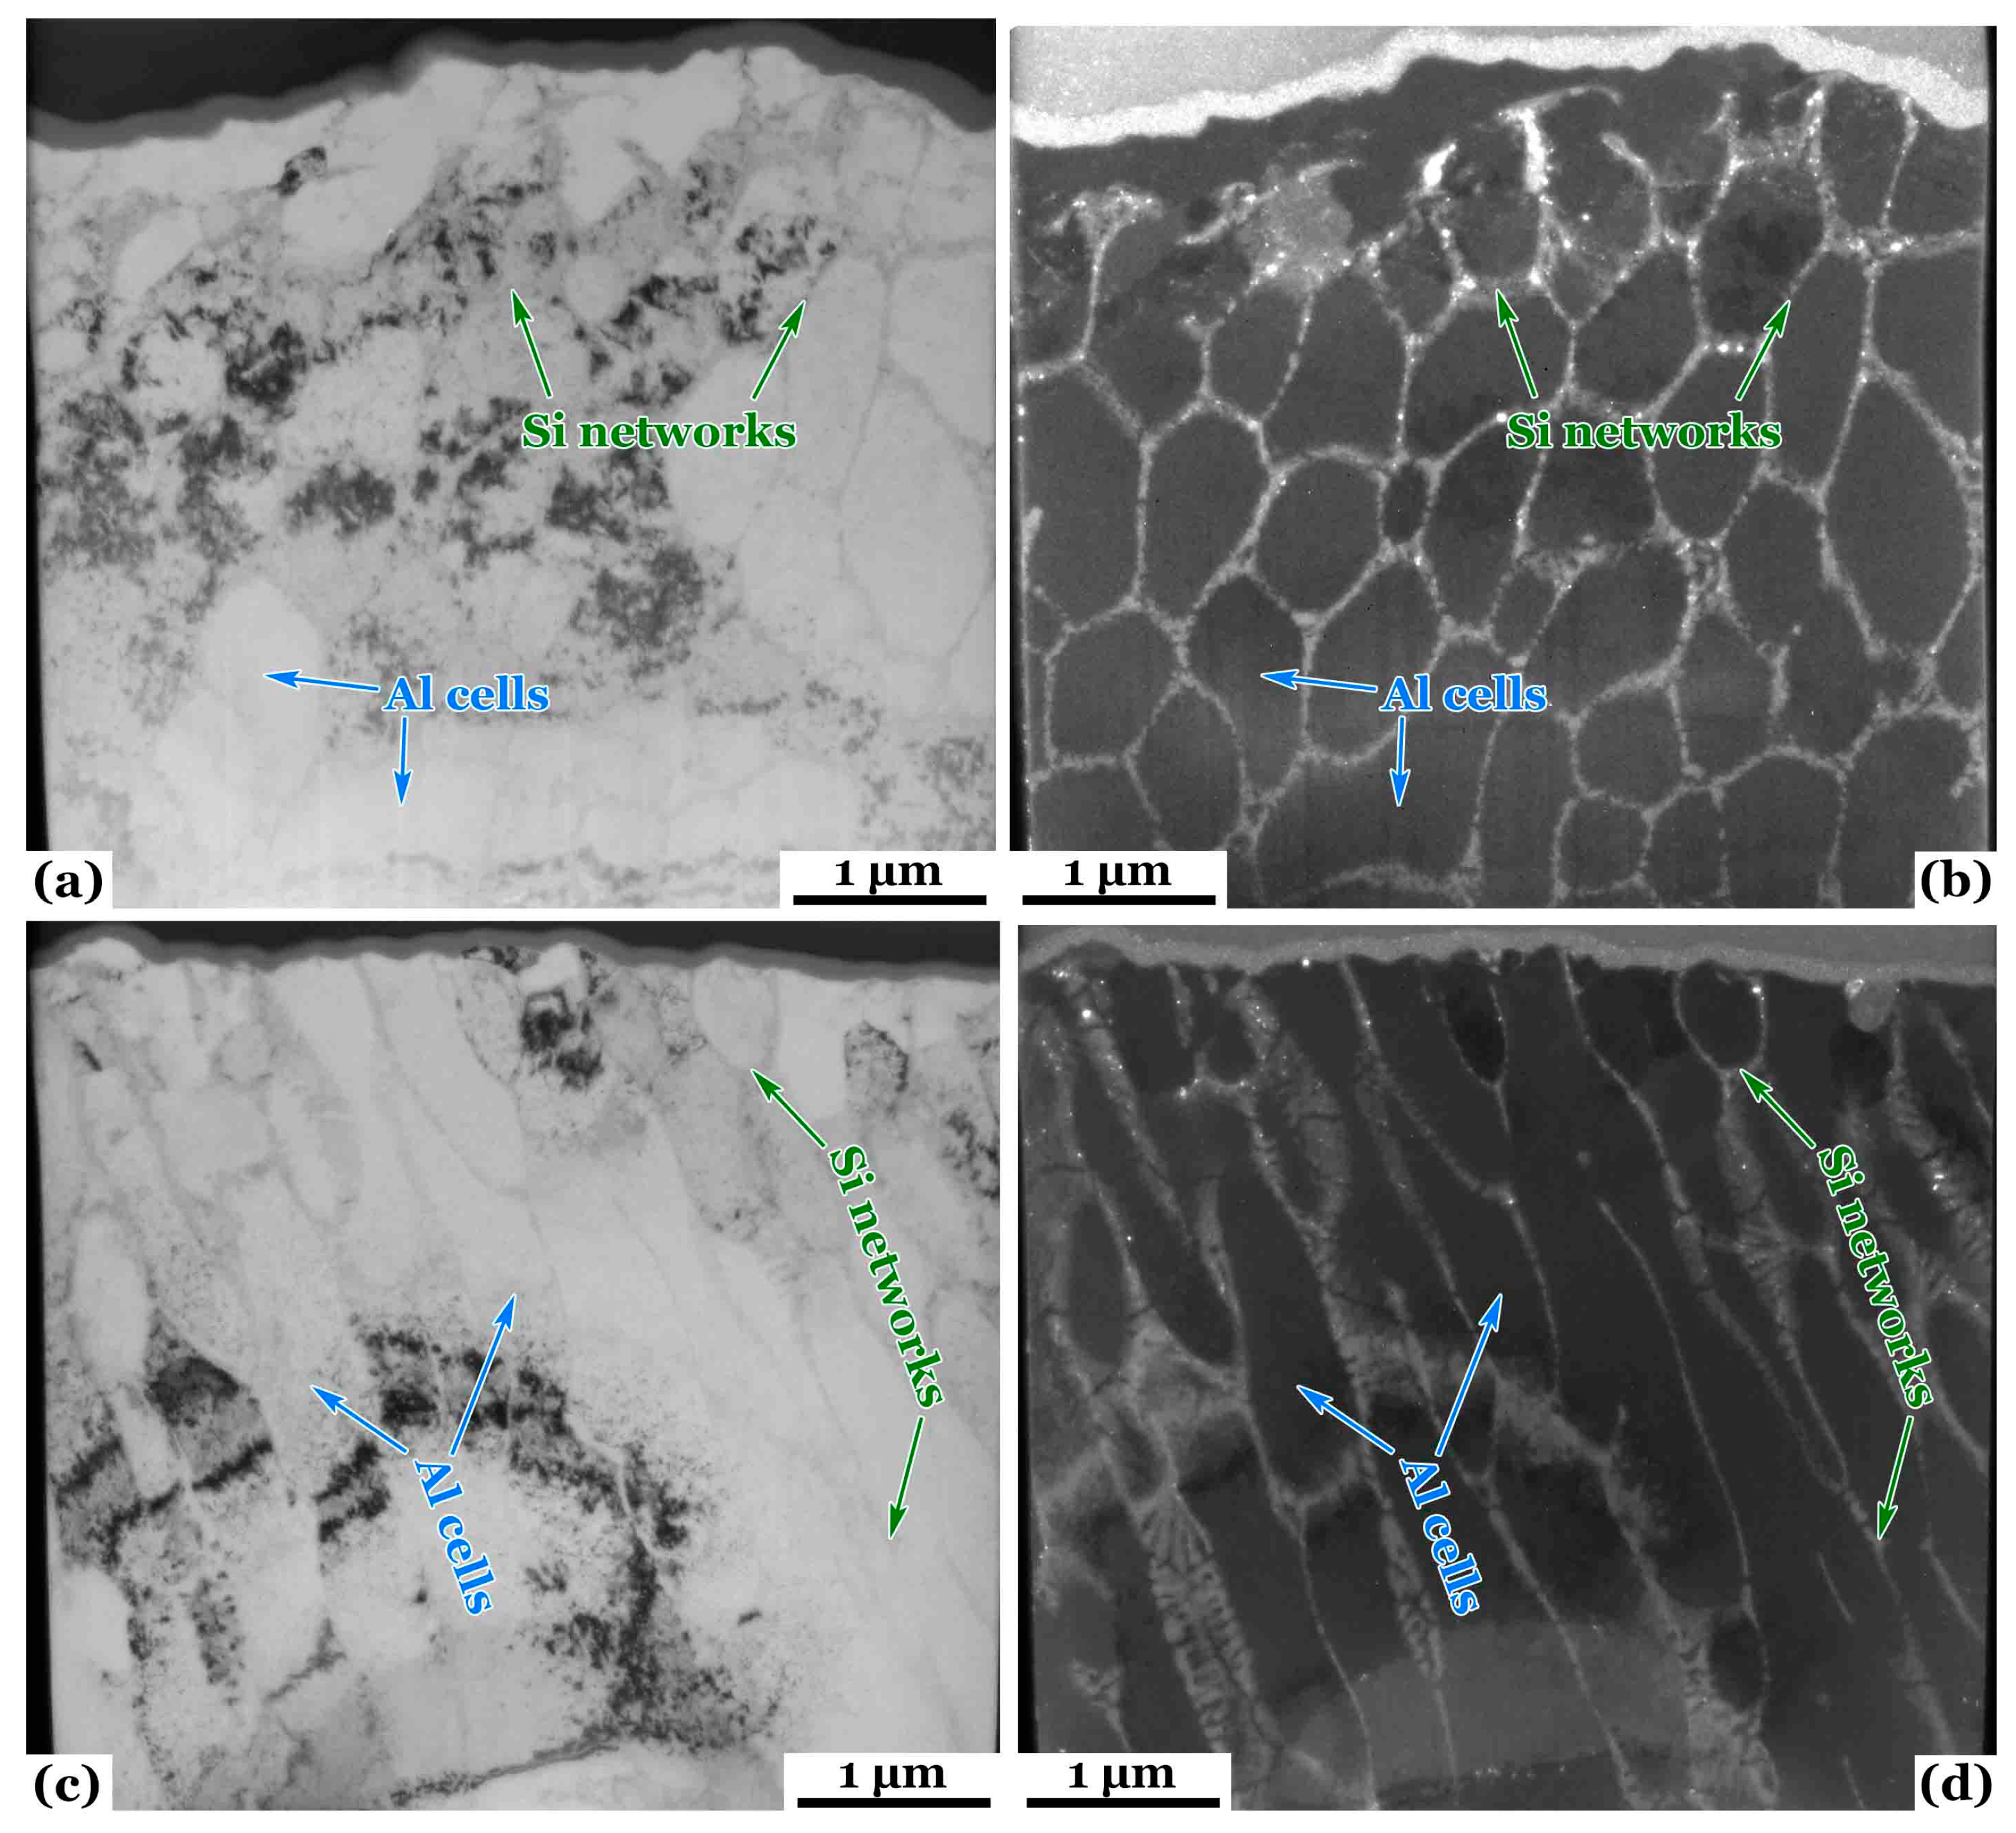
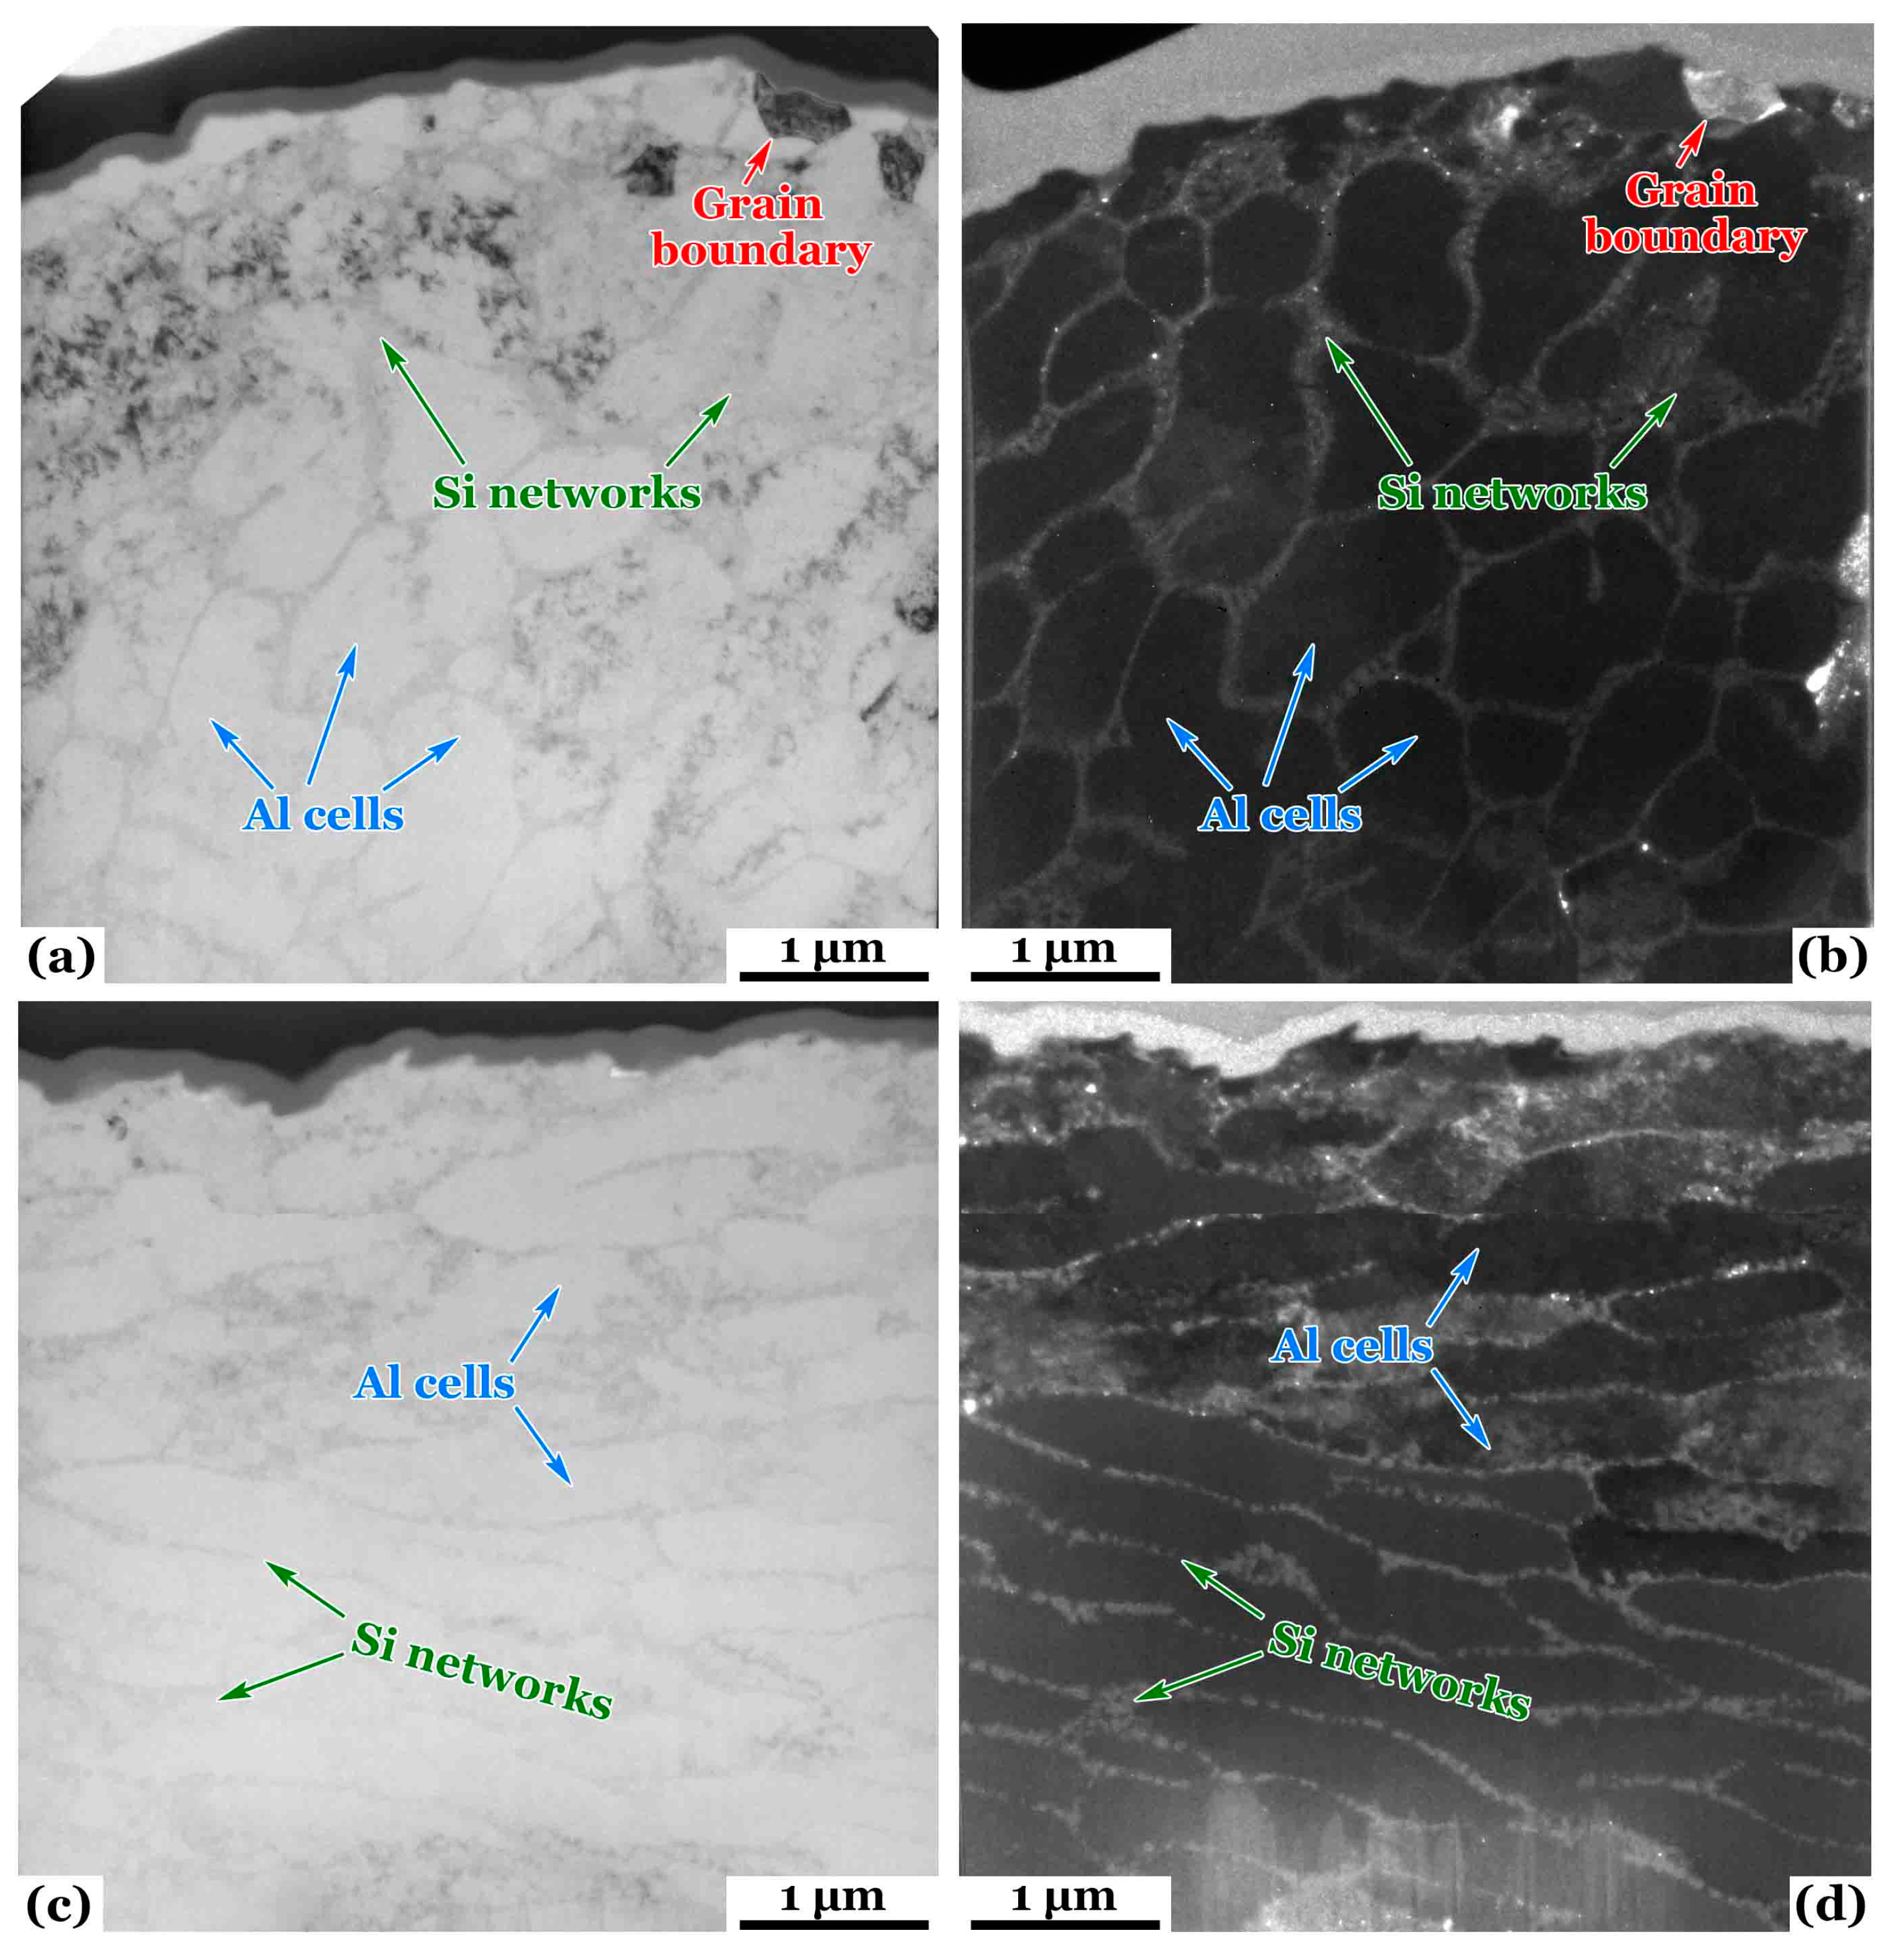
3.5. Al cell, Si Network and Grain Boundary Distribution

TEM samples A1, A2 and B1, B2 were carefully examined through transmitted electrons under 300 kV of accelerating voltage to characterize the profile microstructure along the specimen axes, i.e., perpendicular and parallel to the building direction of the AM aluminum alloy, in a microscope (Tecnai G2 F30 S-Twin, FEI, Hillsboro, OR, USA). Figure 3 and Figure 4 demonstrate bright- and dark-field images of TEM samples A1, A2 and B1, B2, respectively.
In each subfigure of Figure 3 and Figure 4, VHCF loading direction is along the height of the image, and the uppermost curve of the microstructure corresponds to the fracture surface profile. Above the profile curve, there are two protective layers of platinum, the inner one was guided by electron beam, and the outer one was guided by Ga+ cations, as described in Ref. [4]. In bright-field images of microstructures, the light areas are Al-rich regions, and the gray areas are Si-rich regions. Contributing to different crystallographic orientations of Al and Si [44], the Si-rich regions are quite easy to identify in dark-field images. Contrary to the situation in bright-field images, for dark-field ones, the black areas are Al-rich regions, the white areas are Si-rich regions, and the sparkling particles might be rearranged Si precipitates according to Ref. [17]’s opinion.
In Figure 3 and Figure 4, Si networks and Al cells are typical microstructure features with characteristic size of sub micrometers. Basically, Si-rich regions are interconnected with each other to constitute a continuous web of Si networks, and the rest can be regarded as many isolated islands, namely Al cells. In TEM samples A1 and B1, Al cells and Si networks are near-equiaxed; and in samples A2 and B2, Al cells and Si networks are all elongated. It is noted that the elongation in samples A2 and B2 are with different directions. In comparison with Figure 3a–d and Figure 4c,d, there is only one grain of Al solid solution in sample A1, A2, and B2. This means that all Al cells are with the same orientation, and most of the Si networks keep another same orientation in these samples. In comparison with Figure 4a,b, only a few (two or three) nanograins with size about hundreds of nanometers appear in the upper right corner of sample B1, and the grain boundaries are clearly visible. In the neighbor of nanograins, there is still only one big grain whose equivalent size is larger than 6 μm.

3.6. VHCF-Induced Fracture and Microstructure Features

For the grain structure, the results reported in this paper are not consistent with those in the literature [4,5,9,17,29,33,34,35,36,38,45]. There are no observed nanograins in the crack initiation region of VHCF at R = −1, but a few nanograins formed underneath a very local area with a size of about several micrometers on the fracture surface adjacent to the VHCF origin under R = 0. One probable explanation is that the nanograin thermal stability of aluminum alloys [46] differs from the cases of high-strength steels or titanium alloys, and the failure cycle is not sufficient to satisfy NCP (numerous cyclic pressing) conditions proposed by Hong et al. [35]. In accordance with Ref. [17], VHCF life beyond 4 × 10⁸ cycles is necessary for microstructure refinement at R = −1. Nevertheless, it cannot explain why nanograin formation can occur in VHCF of R = 0, although there are only a few number of nanograins and within the very limited small area at the marginal region around the crack initiation site.
For the distribution of chemical elements, Si networks are broken and disappeared in the profile surface layer of TEM sample A1. As shown in Figure 3b, it seems that Si precipitates with various orientations sparkle along the subsurface of dark-field image. Outside of the surface layer, the Si networks and Al cells in sample A1 are not distinctly different from other TEM samples, except for shapes and orientations. The shapes and orientations of Si networks and Al cells are closely tied with the original AM microstructure, depending on the location of TEM sampling. In addition, the rearranged Si is preferred to precipitate in the region near the fracture surface on the profile microstructure of VHCF loaded specimens.
The phenomena of Si networks partially dissolved, rearranged, and precipitated are most pronounced in sample A1, followed by sample B1, again in sample B2, and lastly in sample A2. This ranking is completely identical to that of the granulation degrees for the local fracture surfaces around the samples, as described in Section 3.3. These characterizations confirm that the granulation of the fracture surface and the redistribution of Si elements near the fracture surface are the main characteristics of crack initiation in the AM aluminum alloy experienced VHCF. These behaviors of granulation and redistribution have little to do with the stress ratios R, but are positively correlated with the distance between the location and the crack source. It is implied that the granulation and redistribution are more dominated by the loading cycle. Only when the loading cycles are similar does the effect of negative stress ratios emerge, causing the significant Si rearrangement in sample A1 and the maximum roughness around the TEM sample location on the fracture surface of specimen A under VHCF loading at R = −1.

4. Conclusions

In this paper, the microstructures underneath the fracture surfaces within crack initiation areas of horizontally and vertically printed specimens of an additively manufactured (AM) aluminum alloy (AlSi10Mg) under very high cycle fatigue (VHCF) at various stress ratios R = −1, 0 and 0.5 were investigated by using advanced material characterization techniques of scanning electron microscopy (SEM), focused ion beam (FIB), and transmission electron microscopy (TEM).
The main conclusions are as follows:
  • Broadly, there are no characteristic microstructures of both grain size and chemical element distribution induced by fatigue crack initiation and growth in the differently oriented AM aluminum alloy under very high cyclic loading with various R values of stress ratios.
  • A few nanograins were observed at a very local region around the crack initiation site of a vertically AM AlSi10Mg under VHCF loading at R = 0.
  • The granulation of fracture surface and Si arrangement underneath the fracture surface occur in the neighboring area of VHCF crack initiation in the AM aluminum alloy with various orientations and under different R values.
  • VHCF loading cycles are the first key factor dominating the behaviors of fracture surface granulation and chemical element arrangement, and the negative stress ratios are the second.

Author Contributions

Conceptualization, L.L., Y.M. and S.W.; methodology, L.L.; investigation, L.L., Y.M. and S.W.; resources, L.L., Y.M., G.L. and S.W.; data curation, L.L.; writing—original draft preparation, L.L.; writing—review and editing, L.L., G.L. and S.W.; visualization, L.L. and Y.M.; supervision, G.L. and S.W.; project administration, L.L. and S.W.; funding acquisition, L.L. and S.W. All authors have read and agreed to the published version of the manuscript.

Funding

This investigation was funded by the Research fund of Xi’an Aeronautical University, grant number 2019KY1120.

Institutional Review Board Statement

Not applicable.

Informed Consent Statement

Not applicable.

Data Availability Statement

The data presented in this study are available on request from the corresponding author (privacy).

Acknowledgments

L.L., Y.M. and S.W. sincerely thank the Northwestern Polytechnical University, L.L. appreciates Xi’an Aeronautical University, for their great support.

Conflicts of Interest

The authors declare no conflicts of interest. The funders had no role in the design of the study; in the collection, analyses, or interpretation of data; in the writing of the manuscript; or in the decision to publish the results.

References

  1. Suresh, S. Fatigue of Materials, 2nd ed.; Cambridge University Press: Cambridge, UK, 1998. [Google Scholar]
  2. Schijve, J. Fatigue of Structures and Materials, 2nd ed.; Springer: Dordrecht, Germany, 2009. [Google Scholar]
  3. Meyers, M.A.; Chawla, K.K. Mechanical Behavior of Materials, 2nd ed.; Cambridge University Press: Cambridge, UK, 2009. [Google Scholar]
  4. Pan, X.; Su, H.; Sun, C.; Hong, Y. The behavior of crack initiation and early growth in high-cycle and very-high-cycle fatigue regimes for a titanium alloy. Int. J. Fatigue 2018, 115, 67–78. [Google Scholar] [CrossRef]
  5. Pan, X.; Hong, Y. High-cycle and very-high-cycle fatigue behaviour of a titanium alloy with equiaxed microstructure under different mean stresses. Fatigue Fract. Eng. Mater. Struct. 2019, 42, 1950–1964. [Google Scholar] [CrossRef]
  6. Sanaei, N.; Fatemi, A. Defects in additive manufactured metals and their effect on fatigue performance: A state-of-the-art review. Prog. Mater. Sci. 2021, 117, 100724. [Google Scholar] [CrossRef]
  7. Gibson, I.; Rosen, D.; Stucker, B.; Khorasani, M. Additive Manufacturing Technologies, 3rd ed.; Springer: Cham, Switzerland, 2021. [Google Scholar]
  8. Qian, G.; Jian, Z.; Qian, Y.; Pan, X.; Ma, X.; Hong, Y. Very-high-cycle fatigue behavior of AlSi10Mg manufactured by selective laser melting: Effect of build orientation and mean stress. Int. J. Fatigue 2020, 138, 105696. [Google Scholar] [CrossRef]
  9. Du, L.; Pan, X.; Qian, G.; Zheng, L.; Hong, Y. Crack initiation mechanisms under two stress ratios up to very-high-cycle fatigue regime for a selective laser melted Ti-6Al-4V. Int. J. Fatigue 2021, 149, 106294. [Google Scholar] [CrossRef]
  10. Piette, T.D.; Warren, R.J.; Spangenberger, A.G.; Hummelt, E.J.; Lados, D.A. Microstructure evolution, fatigue crack growth, and ultrasonic fatigue in as-fabricated laser powder bed and conventionally cast Al-10Si-0.4Mg: A mechanistic understanding and integrated flaw-sensitive fatigue design methods. Mater. Sci. Eng. A 2021, 825, 141892. [Google Scholar] [CrossRef]
  11. Tridello, A.; Fiocchi, J.; Biffi, C.A.; Rossetto, M.; Tuissi, A.; Paolino, D.S. Effect of microstructure, residual stresses and building orientation on the fatigue response up to 109 cycles of an SLM AlSi10Mg alloy. Int. J. Fatigue 2022, 160, 106825. [Google Scholar] [CrossRef]
  12. Hattingh, D.G.; Botha, S.; Bernard, D.; James, M.N.; Plessis, A.D. Corrosion fatigue of Ti-6Al-4V coupons manufactured by directed energy deposition. Fatigue Fract. Eng. Mater. Struct. 2022, 45, 1969–1980. [Google Scholar] [CrossRef]
  13. Behvar, A.; Berto, F.; Haghshenas, M. A review on isothermal rotating bending fatigue failure: Microstructural and lifetime modeling of wrought and additive manufactured alloys. Fatigue Fract. Eng. Mater. Struct. 2023, 46, 3545–3595. [Google Scholar] [CrossRef]
  14. Tusher, M.M.H.; Ince, A. Effect of stress-relieved heat treatment on very high cycle fatigue performance of additive manufactured Ti-6Al-4V alloy. Fatigue Fract. Eng. Mater. Struct. 2023, 46, 3982–4000. [Google Scholar] [CrossRef]
  15. Tusher, M.M.H.; Ince, A. A systematic review on high cycle and very high cycle fatigue behavior of laser powder bed fused (L-PBF) Al-Si alloys. Eng. Fail. Anal. 2023, 154, 107667. [Google Scholar] [CrossRef]
  16. Centola, A.; Ciampaglia, A.; Tridello, A.; Paolino, D.S. Machine learning methods to predict the fatigue life of selectively laser melted Ti6Al4V components. Fatigue Fract. Eng. Mater. Struct. 2023, 46, 4350–4370. [Google Scholar] [CrossRef]
  17. Pan, X.; Du, L.; Qian, G.; Hong, Y. Microstructure features induced by fatigue crack initiation up to very-high-cycle regime for an additively manufactured aluminium alloy. J. Mater. Sci. Technol. 2024, 173, 247–260. [Google Scholar] [CrossRef]
  18. Mondolfo, L.F. Aluminium Alloys: Structure and Properties; Butterworths: London, UK, 1976. [Google Scholar]
  19. Aboulkhair, N.T.; Simonelli, M.; Parry, L.; Ashcroft, I.; Tuck, C.; Hague, R. 3D printing of aluminium alloys: Additive manufacturing of aluminium alloys using selective laser melting. Prog. Mater. Sci. 2019, 106, 100578. [Google Scholar] [CrossRef]
  20. Boban, J.; Ahmed, A. Defect mitigation and surface enhancement of additively manufactured AlSi10Mg internal features using electro-thermal post-treatment. Mater. Lett. 2023, 353, 135267. [Google Scholar] [CrossRef]
  21. Nasab, M.H.; Romano, S.; Gastaldi, D.; Beretta, S.; Vedani, M. Combined effect of surface anomalies and volumetric defects on fatigue assessment of AlSi7Mg fabricated via laser powder bed fusion. Addit. Manuf. 2020, 34, 100918. [Google Scholar]
  22. Vora, P.; Mumtaz, K.; Todd, I.; Hopkinson, N. AlSi12 in-situ alloy formation and residual stress reduction using anchorless selective laser melting. Addit. Manuf. 2015, 7, 12–19. [Google Scholar] [CrossRef]
  23. Wöhler, A. Wöhler’s experiments on the strength of metals. Engineering 1867, 4, 160–161. [Google Scholar]
  24. Hull, D. Fractography: Observing, Measuring and Interpreting Fracture Surface Topography; Cambridge University Press: Cambridge, UK, 1999. [Google Scholar]
  25. Hong, Y.; Lei, Z.; Sun, C.; Zhao, A. Propensities of crack interior initiation and early growth for very-high-cycle fatigue of high strength steels. Int. J. Fatigue 2014, 58, 144–151. [Google Scholar] [CrossRef]
  26. Sakai, T.; Sato, Y.; Oguma, N. Characteristic S-N properties of high-carbon-chromium-bearing steel under axial loading in long-life fatigue. Fatigue Fract. Eng. Mater. Struct. 2002, 25, 765–773. [Google Scholar] [CrossRef]
  27. Sakai, T.; Nakagawa, A.; Oguma, N.; Nakamura, Y.; Ueno, A.; Kikuchi, S.; Sakaida, A. A review on fatigue fracture modes of structural metallic materials in very high cycle regime. Int. J. Fatigue 2016, 93, 339–351. [Google Scholar] [CrossRef]
  28. Pan, X.; Qian, G.; Wu, S.; Fu, Y.; Hong, Y. Internal crack characteristics in very-high-cycle fatigue of a gradient structured titanium alloy. Sci. Rep. 2020, 10, 4742. [Google Scholar] [CrossRef] [PubMed]
  29. Pan, X.; Xu, S.; Qian, G.; Nikitin, A.; Shanyavskiy, A.; Palin-Luc, T.; Hong, Y. The mechanism of internal fatigue-crack initiation and early growth in a titanium alloy with lamellar and equiaxed microstructure. Mater. Sci. Eng. A 2020, 798, 140110. [Google Scholar] [CrossRef]
  30. Mayer, H.; Ede, C.; Allison, J.E. Influence of cyclic loads below endurance limit or threshold stress intensity on fatigue damage in cast aluminium alloy 319-T7. Int. J. Fatigue 2005, 27, 129–141. [Google Scholar] [CrossRef]
  31. Atrens, A.; Hoffelner, W.; Duerig, T.W.; Allison, J.E. Subsurface crack initiation in high cycle fatigue in Ti6Al4V and in a typical martensitic stainless steel. Scr. Metall. 1983, 17, 601–606. [Google Scholar] [CrossRef]
  32. Bathias, C. There is no infinite fatigue life in metallic materials. Fatigue Fract. Eng. Mater. Struct. 1999, 22, 559–565. [Google Scholar] [CrossRef]
  33. Oguma, N.; Harada, H.; Sakai, T. Mechanism of long life fatigue fracture induced by interior inclusion for bearing steel in rotating bending. J. Soc. Mater. Sci. Jpn. 2003, 52, 1292–1297. [Google Scholar] [CrossRef]
  34. Grad, P.; Reuscher, B.; Brodyanski, A.; Kopnarski, M.; Kerscher, E. Mechanism of fatigue crack initiation and propagation in the very high cycle fatigue regime of high-strength steels. Scr. Mater. 2012, 67, 838–841. [Google Scholar] [CrossRef]
  35. Hong, Y.; Liu, X.; Lei, Z.; Sun, C. The formation mechanism of characteristic region at crack initiation for very-high-cycle fatigue of high-strength steels. Int. J. Fatigue 2016, 89, 108–118. [Google Scholar] [CrossRef]
  36. Liu, L.; Ma, Y.; Liu, S.; Wang, S. The fatigue behaviors of a medium-carbon pearlitic wheel-steel with elongated sulfides in high-cycle and very-high-cycle regimes. Materials 2021, 14, 4318. [Google Scholar] [CrossRef]
  37. Pan, X.; Qian, G.; Hong, Y. Nanograin formation in dimple ridges due to local severe-plastic-deformation during ductile fracture. Scr. Mater. 2021, 194, 11363. [Google Scholar] [CrossRef]
  38. Pan, X.; Su, H.; Liu, X.; Hong, Y. Multi-scale fatigue failure features of titanium alloys with equiaxed or bimodal microstructures from low-cycle to very-high-cycle loading numbers. Mater. Sci. Eng. A 2024, 890, 145906. [Google Scholar] [CrossRef]
  39. Ul-Hamid, A. A Beginners’ Guide to Scanning Electron Microscopy; Springer: Cham, Switzerland, 2009. [Google Scholar]
  40. Lozano-Perez, S. A guide on FIB preparation of samples containing stress corrosion crack tips for TEM and atom-probe analysis. Micron 2008, 39, 320–328. [Google Scholar] [CrossRef] [PubMed]
  41. Fultz, B.; Howe, J. Transmission Electron Microscopy and Diffractometry of Materials; Springer: Berlin, Germany, 2001. [Google Scholar]
  42. Thijs, L.; Verhaeghe, F.; Craeghs, T.; Humbeeck, J.; Kruth, J. A study of the microstructural evolution during selective laser melting of Ti-6Al-4V. Acta Mater. 2010, 58, 3303–3312. [Google Scholar] [CrossRef]
  43. Bathias, C.; Paris, P. Gigacycle Fatigue in Mechanical Practice; Marcel Dekker: New York, NY, USA, 2005. [Google Scholar]
  44. Marioara, C.D.; Andersen, S.J.; Birkeland, A.; Holmestad, R. Orientation of silicon particles in a binary Al-Si alloy. J. Mater. Sci. 2008, 43, 4962–4971. [Google Scholar] [CrossRef]
  45. Pan, X.; Xu, S.; Nikitin, A.; Shanyavskiy, A.; Palin-Luc, T.; Hong, Y. Crack initiation induced nanograins and facets of a titanium alloy with lamellar and equiaxed microstructure in very-high-cycle fatigue. Mater. Lett. 2024, 357, 135769. [Google Scholar] [CrossRef]
  46. Fang, L.; Zhong, Y.; Wang, B.; Xu, W.; Li, X.; Lu, K. Ultrahard and super-stable pure aluminum with Schwarz crystal structure. Mater. Res. Lett. 2023, 11, 662–669. [Google Scholar] [CrossRef]
Figure 1. Fatigue properties and microstructure of an additively manufactured aluminum alloy. S-N data for horizontally (a) and vertically (b) printed specimens; (c) specimen geometry, dimensions in mm; optical micrographs showing scanning tracks and melt pools on latitudinal (d) and longitudinal (e) sections along the building direction.
Applsci 14 02025 g001
Figure 2. Typical morphologies for fatigue crack initiation areas of representatively selected specimens with different building orientations in very high cycle regime under various stress ratios: (a) tilted view for specimen A, horizontally printed, R = −1, σm = 1 MPa, σa = 93 Mpa, Nf = 3.67 × 10⁸ cycles; (b) tilted view for specimen B, vertically printed, R = 0, σm = 40 Mpa, σa = 40 Mpa, Nf = 3.82 × 10⁸ cycles; enlarged SEM images (c,d) showing TEM sampling locations A1 and A2 for specimen A; enlarged SEM images (e,f) showing TEM sampling locations B1 and B2 for specimen B.
Applsci 14 02025 g002
Figure 3. TEM characterizations for sample A1 cut from specimen A: (a) bright-field image, (b) dark-field image. TEM characterizations for sample A2 cut from specimen A: (c) bright-field image, (d) dark-field image. Specimen A printed horizontally and failed by fatigue loading of R = −1, σm = 1 MPa, σa = 93 MPa, and Nf = 3.67 × 10⁸ cycles.
Applsci 14 02025 g003
Figure 4. TEM characterizations for sample B1 cut from specimen B: (a) bright-field image, (b) dark-field image. TEM characterizations for sample B2 cut from specimen B: (c) bright-field image, (d) dark-field image. Specimen B printed vertically and failed by fatigue loading of R = 0, σm = 40 MPa, σa = 40 MPa, and Nf = 3.82 × 10⁸ cycles.
Applsci 14 02025 g004
Table 1. Nominal chemical composition (weight percent) of the pre-alloyed AlSi10Mg powder.
AlSiMgFeTiOther
Balance9.750.220.0920.011<0.01
Table 2. Key printing parameters for the additively manufactured aluminum alloy.
p [W]t [mm]v [mm/s]h [mm]Ev [J/mm3]
3700.0513000.1930
Disclaimer/Publisher’s Note: The statements, opinions and data contained in all publications are solely those of the individual author(s) and contributor(s) and not of MDPI and/or the editor(s). MDPI and/or the editor(s) disclaim responsibility for any injury to people or property resulting from any ideas, methods, instructions or products referred to in the content.

