Article

Bearing Capacity of a Shallow Foundation above the Soil with a Cavity Based on Rigid Plastic Finite Element Method

1
Field Engineering for the Environment, Graduate School of Engineering, Hokkaido University, Kita 13, Nishi 8, Kita-Ku, Sapporo 060-8628, Hokkaido, Japan
2
Division of Civil Engineering, Hokkaido University, Kita 13, Nishi 8, Kita-Ku, Sapporo 060-8628, Hokkaido, Japan
*
Author to whom correspondence should be addressed.
Appl. Sci. 2024, 14(5), 1975; https://doi.org/10.3390/app14051975
Submission received: 5 December 2023 / Revised: 19 January 2024 / Accepted: 26 February 2024 / Published: 28 February 2024
(This article belongs to the Section Civil Engineering)

Abstract

:
Based on the Rigid Plastic Finite Element Method (RPFEM), this study investigates the performance of the footing on the soil with a cavity. The RPFEM is used in plane strain conditions and necessitates only a few materials to predict the bearing capacity: the unit weight of the soil, the cohesion, the shear resistance angle, and the dilation angle. Considering diverse soil types, including cohesive and intermediate soils, the findings are presented through dimensionless 2D charts in which the horizontal axis X and vertical axis Y are normalized to parameters R and H, representing the horizontal and vertical dimensions of the plastic mechanism beneath the footing in the absence of the soil cavity. Analyzing geometric factors such as footing width B and cavity characteristics (shape, size, and location), the study reveals that the farther the cavity, the less it impacts the footing performance. The distribution of the normalized bearing capacity across the (X, Y) space elucidates the expansion and variation of the influence zone. Equations incorporating the mentioned geometric parameters and soil shear strengths are proposed and verified with data in the literature. In cohesive soils, the influence zone predominantly extends vertically, following the expansion of the slip surface in no void condition. Conversely, for intermediate soils, the zone of influence exhibits a dependency on the shear resistance angle, resulting in an extension in one direction more than the other. Illustrating typical failure mechanisms, the study delves into detailed discussions to enhance comprehension of how the cavities affect the bearing capacity of the footing.

1. Introduction

Underground cavities appear as the results of natural processes and human activities or occasionally as the action of both combined. These actions may cause the ground on which we live to displace. Whether the ground displacements are large and catastrophic or small and slow, their cumulative impact during the lifetime of humans or civilizations may be large and destructive. Underground cavities either directly damage the built environment and everything constructed by humans or cause it to be more vulnerable to other hazards such as flooding. Around the world, as the demand for land grows and humans increasingly modify their environment, more and more people might be exposed to the instabilities caused by underground cavities [1]. The collapse of the ground into subsurface cavities is a very widespread and potentially damaging phenomenon because of the large depressions (sinkholes) created and its sudden occurrence.
Sinkholes occur due to the erosion of the bedrock or geo-materials around the cavity and can be triggered by rainfall, earthquake, drought, mining, drilling, pumping, tunneling works, etc. [2]. Sinkhole activities are commonly the most peculiar hazard in the karst environment [3,4,5]. A karst environment occurs in over 20% of the earth’s ice-free continental area, and around 25% of the global population depends on the karst water supply [6]. The fragility of karst settings, enhanced by human activity, is expected to rise, therefore inducing more sinkholes in the future [7].
The bearing capacity of a shallow foundation is a non-negligible issue in the geotechnical engineering community. Baus and Wang [8] conducted an experimental and analytical investigation of the bearing capacity of the footing above void on silty clay using a finite element method considering the soil as an elastic perfectly plastic material. They found that, for each footing, there exists a critical depth below which the presence of a cavity has a negligible impact on the performance of the footing. Kiyosumi et al. [9] conducted a series of 1G tests under plane strain conditions on stiff ground with continuous square cavities. The authors revealed three types of failure modes for a single void: bearing failure without void failure, bearing failure with void failure, and void failure without bearing failure. Wu et al. [10] used an adaptive finite limit analysis (AFELA) code and generalized Hoek–Brown failure criterion to investigate a footing-cavity system with eccentric load in rock masses. Several other studies discussed this complex issue under several assumptions [11,12,13,14,15,16]. Most of the previous studies have investigated this issue by calculating a stability number N under several different assumptions [12,17]. However, these methods are not straightforward to determine the stability level.
While some studies have touched upon the influence of cavities, mostly focusing on cases where the footing and the cavity are centered, there is a gap in comprehensively addressing how a single cavity with its size and eccentric location to the footing affects the behavior of the Bearing Capacity of the footing. Also, much of the reported research on this subject has been empirical, being associated often with specific locations [12], making it a reasonable need to provide holistic solutions by incorporating the soil strength parameters. Investigating the impact of the cavity at an offset distance to the footing is crucial in preventing unforeseen hazards to engineering structures or human activities. Therefore, it is necessary to develop for this purpose robust means of risk assessment and effective mitigation strategies for footings in the vicinity of underground cavities. Identifying potential failure modes and quantifying or evaluating stability levels will contribute to devising practical and cost-effective mitigation measures that will be crucial for ensuring the safety and reliability of structures in real-world scenarios. By addressing these issues, significant contributions to advancing the understanding of footing cavity system, refining design practices, and enhancing the resilience of foundations can be achieved.
In this paper, a parametric study of the influence of the cavity within the cohesive soils and intermediate soils on the bearing capacity of the footing is investigated by employing the Rigid Plastic Finite Element Method. The RPFEM is used in two dimensions under a plane strain condition with an associative flow rule. The investigation of the performance of a shallow foundation above the ground with a cavity considering the variable location and geometry of the cavity is conducted. In addition, the study aims to clarify and establish the influence zone of the cavity on the footing by considering the combination of the geometrical parameters of the cavity and the shear strength of the soils. Finally, a formula that accounts for the shear strength parameters of the soils, as well as the geometry of the cavity, is proposed to predict the stability level. In this study, the terms “cavity” and “void” are used interchangeably.

2. Problem Definition

2.1. Finite Element Mesh and Boundary Conditions

Figure 1 depicts the typical soil model utilized in this study, featuring the footing and cavity system. In the scenario examined, a shallow foundation with a width denoted as B is placed on the ground with a cavity. The foundation is subjected to uniform vertical loads in homogeneous soil under plane strain conditions. The uniform load is applied to the foundation base, and the foundation is not embedded. The soil characteristics include the cohesion c, the shear resistance angle ϕ, and the unit weight γ. The cavity’s shape is square and circular (though it is worth mentioning that the circular configuration is not illustrated here) in the homogeneous soft soil material. To mitigate boundary effects, the model’s boundaries are selected to be sufficiently large. The dimensions of the model are specified as a width of 40 m and a height of 18 m. Vertical displacements are exclusively permitted at the lateral boundaries. At the bottom horizontal boundary, displacements in the horizontal and vertical directions are strictly restricted. Two crucial distances are defined in the context of the cavity: h (m), representing the vertical gap between the ground surface and the cavity’s center, and D (m), denoting the diameter of the cavity (applicable for a circular cavity as well). Additionally, r (m) is the horizontal distance between the centerlines of the cavity and the footing. This study assumes that the cavity remains unsupported and statically stable under its self-weight. For enhanced accuracy in the solution, the mesh sizes are deliberately finer around the footing base and the surrounding area. Notably, the cavity’s location varies for each analysis case.

2.2. Analysis Parameters

The analysis parameters described in Figure 1 were varied to evaluate the performance of the footing on the soil with cavity. Table 1 shows the different ranges of values on geometry used in the analysis.
The parameters listed in Table 1 are consistent with those used by Kiyosumi et al. [18] who documented void sizes in Japanese uncemented calcareous sediments ranging from less than 1 m to approximately 10 m. Furthermore, numerous studies on cavity-related issues, including those by various authors, have employed cavities within a similar size range as the present study [9,13,16]. In certain instances, larger values were utilized, with the shear strength parameters of the soils being comparable [8,12], etc. Consequently, the selected cavity sizes in Table 1 are deemed reasonable, aligning with established practices observed in the relevant literature.
Table 2 shows the soil properties used in the analysis. The properties considered for the footing are cohesion c = 50,000 kPa and a shear resistance angle ϕ = 0 deg to model a rigid footing. The soil-footing contact is assumed rough.

3. Outline of the Simulation Method

3.1. Rigid Plastic FEM Constitutive Equation

The Rigid Plastic Finite Element Method (RPFEM) was developed by Tamura et al. [19,20] and upgraded by Hoshina et al. [21] and Nguyen et al. [22]. The RPFEM calculates the limit load without any assumption of a potential failure mode. The method has been successfully used to examine geotechnical problems [23,24]. The RPFEM using the rigid plastic constitutive equation with the Drucker–Prager yield function necessitates only a few soil parameters such as the unit weight, the cohesion, the shear resistance angle, and the dilatancy angle, which is its advantage.
The Drucker–Prager yield function is used in plane strain conditions with an associated flow rule. The Drucker–Prager yield function is expressed as follows:
f σ = α I 1 + J 2 κ = 0
where, I 1 = t r ( σ ) is the first invariant of the stress tensor σ and J 2 = 1 2 S : S is the second invariant of deviator stress tensor S. α and κ are soil parameters corresponding to the shear resistance angle and cohesion, respectively, and are expressed as
α = tan ϕ 9 + 12 tan 2 ϕ ,     κ = 3 c 9 + 12 tan 2 ϕ
where c is the cohesion and ϕ is the shear resistance angle.
The volumetric strain rate ε ˙ v for the rigid plastic constitutive equation is expressed as follows:
ε ˙ v = t r ε ˙ = t r λ f ( σ ) σ = t r   λ α I + S 2 J 2 = 3 α 3 α 2 + 1 2 e ˙
where λ is the plastic multiplier and e ˙ is the norm of the strain rate ε ˙ . I express the unit stress tensors. The strain rate ε, which is purely a plastic component, should satisfy the volumetric constraint condition on the dilation property of the soil as
h ε ˙ = ε ˙ v 3 α 3 α 2 + 1 2 e ˙ = ε ˙ v η e ˙ = 0
Any strain rate that is compatible with the Drucker–Prager yield criterion must satisfy the kinematical constraints of equations Equation (4). η is one coefficient determined by Equation (4), which is one of the dilation characteristics. The dilation constitutive equation is expressed by the Lagrange method after Tamura [25] as follows:
σ = κ 3 α 2 + 1 2 ε ˙ e ˙ + β I η ε ˙ e ˙ = 0
The first term expresses the stress component, uniquely determined for the yield function. The second term expresses the indeterminate stress component along with the yield function. The indeterminate parameter β remains unknown until the boundary value problem is solved. Equation (6) introduces the constraint condition on the strain rate into the constitutive equation by using the penalty method.
σ = κ 3 α 2 + 1 2 ε ˙ e ˙ + P ( ε ˙ v η e ˙ ) I η ε ˙ e ˙ = 0
where P is the penalty constant. This technique makes the computation faster and more stable. It is worth mentioning that the RPFEM is developed based on the upper bound theory of the limit analysis and is effective in the calculation of the bearing capacity of strip footings on all types of soil. The penalty method introduced in the constraint condition is necessary to obtain the collapse load. Since the penalty method incorporates the constraint condition directly into the governing equation, this leads to high computational efficiency. In the simulation, the footing is modeled by the rigid plastic constitutive equation as a rigid material to focus on the plastic behavior of the soils around the footing and the cavity under the vertical loading. Therefore, the elastic modulus and Poisson’s ratio are not necessary for this simulation method, and this applies to all types of simulated foundations. A noted property of the method is that in the constitutive equation, the relationship between the stress and the strain is specified. The norm of strain rate is substantially indeterminate as the focus aims at the limit state of the structure. The stress is determined for the normalized strain rate using its norm to determine the limit load coefficient for the prescribed load. The distribution of the norm of strain in the soil structure indicates the failure pattern. A small norm value indicates a rigid body behavior, however, which cannot be described by the constitutive equation in plastic theory. In the analysis, a threshold value e ˙ o , small enough to express the rigid body, was introduced and the norm of plastic strain rate e is replaced by e ˙ o to avoid dividing any zero in the constitutive equation and thus enable calculation of the rigid body.

3.2. Validation of the Simulation Method

The validation of the simulation method employed in this study was conducted by comparing its outcomes with the findings presented by Baus and Wang [8]. Figure 2 illustrates the comparison between the results of the normalized bearing capacity obtained through RPFEM and those reported by Baus and Wang [8]. The material properties considered in this analysis include the cohesion c with a value of 65.6 kPa, the shear resistance angle ϕ set at 13.5 degrees, and the unit weight (γ) equal to 18 kN/m3. The bearing capacity ratio (BC/BCNV), introduced in this study to convey the bearing capacity results, is defined as the ratio of the footing’s bearing capacity on soil with a cavity to that on soil without a cavity. While a slight discrepancy is acknowledged, attributed to differences in the constitutive model, a general alignment in the trend of the bearing capacity ratio is evident in both cases, as depicted in Figure 2.
The comparison yields a noteworthy observation, suggesting a good level of reliability in the simulation method applied in this study. It is important to emphasize that the slight variation in results is primarily linked to distinctions in the constitutive models utilized. Consequently, the overall agreement in the trend of the bearing capacity ratio supports the credibility of the simulation method in this investigation.

4. Results and Discussion

The bearing capacity of a shallow foundation on horizontal ground is recognized to be influenced by the soil strength parameters such as the shear resistance angle, the cohesion, the unit weight, and the footing width [25]. In the context of the footing-cavity system, additional factors, including the location, shape, and size of the cavity, come into play and contribute to the variation in bearing capacity. Consequently, this section presents results that elucidate the impact of geometrical parameters on the footing-cavity system. The discussion also delves into the soil’s shear strength influence on the bearing capacity ratio (BC/BCNV). It is crucial to emphasize that the unit weight is maintained as constant for practical considerations throughout this analysis. This approach allows for a focused examination of the specific influence of geometrical parameters on the footing-cavity system and the corresponding bearing capacity, providing valuable insights into the interplay of these factors.

4.1. Influence of the Geometrical Parameters

This section investigates the impact of geometrical parameters on BC/BCNV, utilizing a c-ϕ soil with c = 10 kPa and ϕ = 30 degrees for analysis. Figure 3a presents the influence of footing width B on BC/BCNV, revealing a decreasing trend along the distance r/D as the footing width changes from 1 m to 2 m. The most significant difference is noted at r/D = 0, gradually diminishing at distant locations. Figure 3b illustrates the difference in BC/BCNV resulting from cavity shape, with a notably higher value observed for a circular cavity. The smooth stress distribution around the circular cavity leads to a less pronounced impact on the bearing capacity compared to cases with square cavities. Kuwano and Ohara [26] highlighted a substantial decrease in the bearing capacity of a footing above square or rectangular cavities. Additionally, Figure 3b emphasizes the substantial difference in BC/BCNV values when the cavity is directly beneath the footing (r/D = 0) and as it progressively shifts to normalized horizontal distances r/D.
In Figure 3c, the influence of cavity diameter D on BC/BCNV is explored, revealing noticeable variations with increased D. Figure 3d depicts the effects of cavity depth normalized to footing width B as (h-D/2)/B on BC/BCNV. Within the range (h-D/2)/B = 2 to (h-D/2)/B = 4, significant BC/BCNV variations are evident for various normalized horizontal distance values (r/D). Smaller r/D values correspond to steeper slopes between (h-D/2)/B = 2–4. In summary, the considered parameters collectively exert a noticeable impact on Bearing Capacity behavior. Notably, when the cavity is sufficiently distant from the footing, BC/BCNV tends toward 1, indicating the presence of a critical line that elucidates an influence zone.

4.2. Influence of the Soil Strengths on the BC/BCNV of the Footing-Cavity System

4.2.1. Normalization

The analysis of the bearing capacity under several conditions considering different geometrical parameters and soil types (cohesive soils, intermediate soils) is investigated. This study elucidates the correlation of the influence zone by introducing a novel normalization concept based on the boundaries of the footing’s failure surface. These boundaries are established in both horizontal and vertical directions within the ground without cavity, as depicted in Figure 4. The failure surface beneath the footing is conceptualized with three zones, as documented in the literature [25,27], specifically applicable to homogeneous soil subjected to vertical loading. The lateral expansion of the failure domain primarily depends on the shear resistance angle.
The newly introduced normalization parameters are the dimensions R and H. Table 3 shows the parameters R and H for the various types of ground without the cavity obtained by the RPFEM results. It is worth noting that these values are empirically obtained from the results of simulation with RPFEM on deformation analysis of footing on the soil without voids (Figure 5). As a reference, empirical determination of the plastic mechanism or failure surface has been used to determine failure domains in the case of total and effective stress analyses [23,26].
These parameters exert significant influence by governing the development of the failure mode in the footing-cavity system. When the cavity lies outside the failure domain, i.e., when (r-D/2) > R and (h-D/2) > H, its impact on the footing’s performance diminishes with increasing distances of (r-D/2) and (h-D/2). Conversely, critical failure modes emerge when the cavity is situated within the footing’s failure domain. Consequently, the results are presented as the distribution of BC/BCNV within the plane of normalized distances, with (r-D/2)/R representing the X-axis and (h-D/2)/H for the Y-axis, respectively.
The space (X, Y) is divided into two primary regions, distinguished by BC/BCNV values below 1 and equal to 1, with the critical line serving as the demarcation between these areas. The region corresponding to BC/BCNV equal to 1, indicated in grey in the figures, is referred to as a stable zone or a no-influence zone. This designation signifies that, within this area, the presence of the cavity has a negligible impact on the performance of the footing. It is important to note that, due to numerical errors, the boundary between these two main zones is occasionally set at 0.98 or 0.99 throughout this paper.

4.2.2. Influence of the Cohesive Soil Materials

The analysis of BC/BCNV for the footing-cavity system is conducted in cases involving cohesive soils. Figure 6a shows the variation of BC/BCNV with r/D for a cohesive soil material (c = 10 kPa). The results exhibit a single line, visible only for the scenario of a shallow cavity within the range r/D = 4 to r/D = 10. It is noteworthy that the value of BC/BCNV barely reaches unity along the horizontal axis. This is attributed to the dominance of shear stress induced by the soil unit weight around the cavity over cohesive resistant forces. In particular, the range between r/D = 0 and r/D = 4 is an initially unstable area and is out of the target of this study. Figure 6b–d shows the failure mechanism for a cavity at the points K, L, and M, respectively. The strain distributions reveal a general shear failure at the footing base and roof failure at the cavity with an extension of relatively small strain between the footing and the cavity. In addition, the closer the footing and cavity are, the stronger the interaction inducing the void and bearing failure (Figure 6b,c).
Figure 7 illustrates the distribution of normalized BC/BCNV within the plane defined by normalized distances X and Y when soil cohesion c is set at 50 kPa. This representative result corresponds to a footing size of B = 1 m and a cavity size of D = 1 m. The findings reveal that BC/BCNV increases with the augmentation of both X and Y. The BC/BCNV varies within the range of 0.80 to 0.99 (approximately 1). It is also observed that the influence of the cavity in this type of soil is 3 times more emphasized in the vertical direction than in the horizontal direction. This is because, for the cohesive soils, the slip surface beneath the footing is not expanding widely in the horizontal direction. The passive earth pressure at the rigid wedge directly beneath the footing is decreased due to the presence of the void.

4.2.3. Influence of the Intermediate Soil Materials

The intermediate soil types were differentiated based on variations in cohesion c and shear resistance angle ϕ. These categories include soil with low cohesion and low shear resistance angle ϕ, soil with low c and high ϕ, soil with high c and low ϕ, and soil with high c and high ϕ. In Figure 8a, the BC/BCNV variation is depicted within a soil characterized by low cohesion (c = 10 kPa) and a low shear resistance angle (ϕ = 20 deg). The influence zone, where the ratio BC/BCNV is less than 1, remarkably expands in the vertical direction. This expansion is attributed to the low shear resistance angle, causing the soil to exhibit cohesive-like behavior. Furthermore, a small area, highlighted in black (BC/BCNV = 0.3), indicates a more significant influence than observed in other cases, as it falls below the allowable BC with a factor of safety of 3. Figure 8b illustrates the distribution of BC/BCNV when the shear resistance of the previous c-ϕ soil is increased to ϕ = 30 deg. The trend in the footing’s performance with the cavity’s location remains consistent with the previous case. However, the expansion in the Y direction is comparatively reduced compared to the scenario in Figure 8a, and an area showing BC/BCNV less than the allowable BC is not observed.
Figure 8c,d presents the distribution of BC/BCNV with distances X and Y for a c-ϕ soil with high cohesion (c = 50 kPa) and low shear resistance angle (ϕ = 20 deg), and high shear resistance angle (ϕ = 30 deg), respectively. In comparison to the preceding cases (Figure 8a,b), the influence zone notably contracts in both directions. This contraction implies that a cavity in soil with substantial shear strength is more stable, and the potential to collapse is reduced compared to scenarios involving soil with lower shear strength.
Overall, the influence zone due to the presence of the cavity on the footing exhibits high sensitivity in the vertical direction and low sensitivity in the horizontal direction, particularly evident in soils with smaller shear resistance angles. It is important to highlight that the influence zone in the horizontal direction does not exceed X = 1. The denominator R, integral to the calculation, depends on the shear resistance angle and the dilatancy angle (equivalent to ϕ, given the use of the associated flow rule). A higher dilatancy angle results in a larger R. Consequently, under these conditions, significant expansion of the influence zone in the horizontal direction is limited. Similar considerations apply to the vertical direction, where the variation of H is less pronounced than that of R due to the increasing confining stress with depth, thus explaining the observed sensitivity in the vertical direction.

4.3. Failure Mode

This section displays some failure modes observed within the soil (c-ϕ soils) at some selected locations of the cavity (r = 1 m, 5 m, and 10 m with the cavity size D = 2 m) considering the same geometrical settings for different shear strength parameters. The general deformed models revealed the existence of 2 main failure modes. The Bearing failure where the plastic domain expands only beneath the footing. This failure mode is similar to the condition where there is no cavity within the soil—then, the Bearing and Void failure. This is a combined failure due to the cavity and footing interaction where the plastic domain expands between the underneath of the footing and the vicinity of the cavity. The strain rate concentrates at the footing base as well as the cavity’s edge. The interaction is dependent on the range of distance between the footing and the cavity. So, the interaction ranges from less, medium, or strong interaction regarding the strain rate (see Figure 6). The void failure, where the plastic domain is located mainly at the cavity edges and roof, portrays a possibility of collapse due to the soil’s self-weight. This latter, however, is out of the range of this study. The results show at least the bearing failure as being triggered by the loading conditions and occurs mostly at the shallowest depths.
Figure 9a,b displays the failure modes for the cavity located at the depth (h-D/2) = 8 m and the horizontal distance r = 1 m. The condition case in Figure 9a (Bearing and Void failure) shows that the strain rate is also concentrated at the cavity wall (lower parts). The farther the cavity exists horizontally, the less the interaction between the footing and the cavity occurs. Figure 9b shows that for the identical geometrical conditions with Figure 9a, a change of the failure mode in the case only ϕ is higher is observed. The change of failure to the Bearing failure is remarkable as opposed to Figure 9a. This is due largely to the value of H of the failure domain generated considering this typical shear strength. The failure mechanisms are in agreement with those obtained by Zhao et al. [15] who discussed the bearing capacity and failure mechanism of a rough strip footing located above the cavity by introducing a method that considers random and complex shapes based on an Inverse Discrete Fourier Transform (IDFT).
In Figure 9c,d, with the cavity located at r = 5 m, h-D/2 = 6m, the Bearing and Void failure is observed for the case ϕ = 30 deg (Figure 9c). The footing and the cavity strongly interact, and the failure domain around the cavity portrays a high strain rate. However, when ϕ is higher (ϕ = 40 deg), the failure mode is drastically changed (Figure 9d) to the Bearing failure, similar to Figure 9b. Figure 9b,d reveals that for large shear resistance angles, the influence of the cavity in deeper layers is not significant on the performance of the footing. Figure 9e,f, with the cavity located at r = 10 m, h-D/2 = 2 m, an interesting observation of the failure changes against the shear resistance angle reveals that for the low shear resistance angle ϕ = 30 deg; the influence of the cavity on the footing at shallow depths is ceased at large distance r. This is supported by the only Bearing failure observed in Figure 9e. However, for the case with a large shear resistance angle ϕ = 30 deg, the strong interaction of the footing-cavity system is observed. Briefly, the analyses of the typical failure modes revealed an interesting role of the shear resistance of the soil on the overall stability and expansion of the influence zone of the cavity. It was found that, for the small ϕ, the void failure is accentuated in deep layers while, for the large ϕ, due to the large shear band generated (large R), the void failure occurs mainly for the shallow depths of the cavity and cavity in deep layers do not influence the footing performance (Bearing failure).

4.4. Influence Zone and Critical Boundary Equations

The BC/BCNV distribution within the space (X, Y) of the different soil materials as shown in Figure 7 and Figure 8 produced the critical lines shown in Figure 10 and Figure 11. From these figures, the critical lines are approximately expressed as
Y = p X 2 + q
where X = (r-D/2)/R and Y = (h-D/2)/H. The coefficients p and q are varied depending on the shear strength parameters and the conditions of the soils.
The BC/BCNV in the case of square cavities is the lowest compared with the circular cavities. Therefore, Equation (7) is established based on the square cavities meaning, the worst scenario in terms of the cavity geometry, and can be safely applied to other shapes of the cavity such as circular or oval-shaped cavities.

4.4.1. Influence Zone in the Cohesive Soils

The coefficients p and q for the cohesive soils are shown in Table 4. Figure 10 shows the critical lines for the cohesive soils based on the RPFEM results and the proposed Equation (7) using the coefficient shown in Table 4. It shows a good agreement. It can be expressed from Figure 10 that the influence zone is deeply expanded in the vertical direction.

4.4.2. Influence Zone in the Intermediate Soils

The coefficients p and q for the intermediate soils are shown in Table 5. Figure 11 shows the critical lines for intermediate soils based on the RPFEM results and the proposed Equation (7) using the coefficient shown in Table 5. It shows a good enough agreement and evaluates the critical lines on the safe side although a small discrepancy is observed. It can be expressed from the comparison of these coefficients that the influence zone is influenced more by the cohesions and less by the shear resistance angle.
Based on the above discussion, the RPFEM-obtained solutions can help determine the influence zone of the cavity on the BC/BCNV of the footing resting on various types of soils, depending on the shear strength. In addition, it is possible to determine the necessary depth and radius to investigate the presence of the cavity in practical engineering and it also helps to predict the failure mechanism of the footing-cavity system.

4.5. Discussion

In the preceding sections, results were sequentially presented, exploring the impact of geometrical parameters on the bearing capacity behavior of the footing in the presence of a cavity. Additionally, an examination of the influence of soil strength parameters was undertaken, specifically focusing on cohesive and intermediate soil types. Furthermore, a detailed analysis of typical failure mechanisms was conducted to comprehend variations in stability levels under various conditions. These analyses have contributed to the formulation of proposed solutions aimed at determining the critical boundary of the zone of influence of the cavity on the bearing capacity.
The analysis of geometrical parameters, as depicted in Figure 9, demonstrates that an increase in the footing width B leads to a reduction in the normalized bearing capacity BC/BCNV. This trend is attributed to the heightened footing pressure magnitude, which intensifies the plastic mechanism and deformations, as illustrated in Figure 4. Consequently, a larger footing width is susceptible to the influence of nearby cavities, as highlighted in previous research [18]. Furthermore, the cavity shape analysis indicates that square cavities yield lower BC/BCNV values compared to circular cavities. The circular shape facilitates a smoother stress distribution within the soil, while square cavities result in an expanded stress distribution at the cavity edges. Additionally, the cavity’s proximity to the centerlines of the footing is revealed to exert the most significant influence on bearing capacity. At greater depths or horizontal distances, this influence diminishes, and the bearing capacity tends to recover to values similar to scenarios without a cavity. These findings align with prior studies by various researchers [9,18]. However, it is noteworthy that Al-tabba et al. [27] reported negligible influence on bearing capacity concerning cavity shape. Consequently, our solution design is based on square cavities, representing severe scenarios and providing a conservative approach to ensure safety.
The exploration of soil strength parameters in cohesive and intermediate soils underscores the significance of studying this issue across a diverse range of soil types rather than in localized regions. The introduction of normalized parameters, derived from the plastic mechanism of the footing without a cavity, serves to quantify and establish a well-defined distribution of BC/BCNV within the plane (X, Y) based on geometrical parameters. Cohesive soil cases, within the considered range of cohesion, demonstrate that the bearing capacity is notably affected by cavities beneath the footing, particularly those close to the centerline of the footing. Conversely, in intermediate soils, the distribution of BC/BCNV within the plane (X, Y) is influenced by the combination of cohesion c and shear resistance angle ϕ. Low cohesion and low shear resistance angle soil types predominantly impact the vertical direction (Y), with a larger influence zone compared to cases with higher shear resistance angles. For the latter, the influence decreases in the vertical direction, while in the horizontal direction (X), an impact is observed, especially for shallow cavities at large X (Figure 9a,b). In fact, the slip surface is widened due to its large ϕ; therefore strain rate expands more horizontally. However, the BC/BCNV varies between 0.30 and 0.98 (approx. 1). As the bearing capacity is above the allowable BC at BC/BCNV = 0.3, it can be expected that in this range less impact on the footing occurs. The cases of intermediate soils with high cohesion with variable ϕ (Figure 9c,d) showed the BC/BCNV = 0.65–0.98 with a larger influence zone when ϕ is low. For this last case, as previously, these results also revealed that ϕ controls the direction of the zone influence. However, within the soils with larger strengths, the influence of the cavity is mostly at shallow depths.
In deep depths, soils with larger strengths exhibit reduced influence of the cavity due to the nonlinear increase of shear strength with ϕ as a function of depth. The observed results align with findings by Zhou et al. [28] who investigated strip footing bearing capacity on c-ϕ soils with square voids. Comparative results of normalized bearing capacity factors (Nc/NcNV) with studies by Kiyosumi [18], Zhou et al. [28], and Lee et al. [29] illustrate agreement with results obtained from RPFEM (
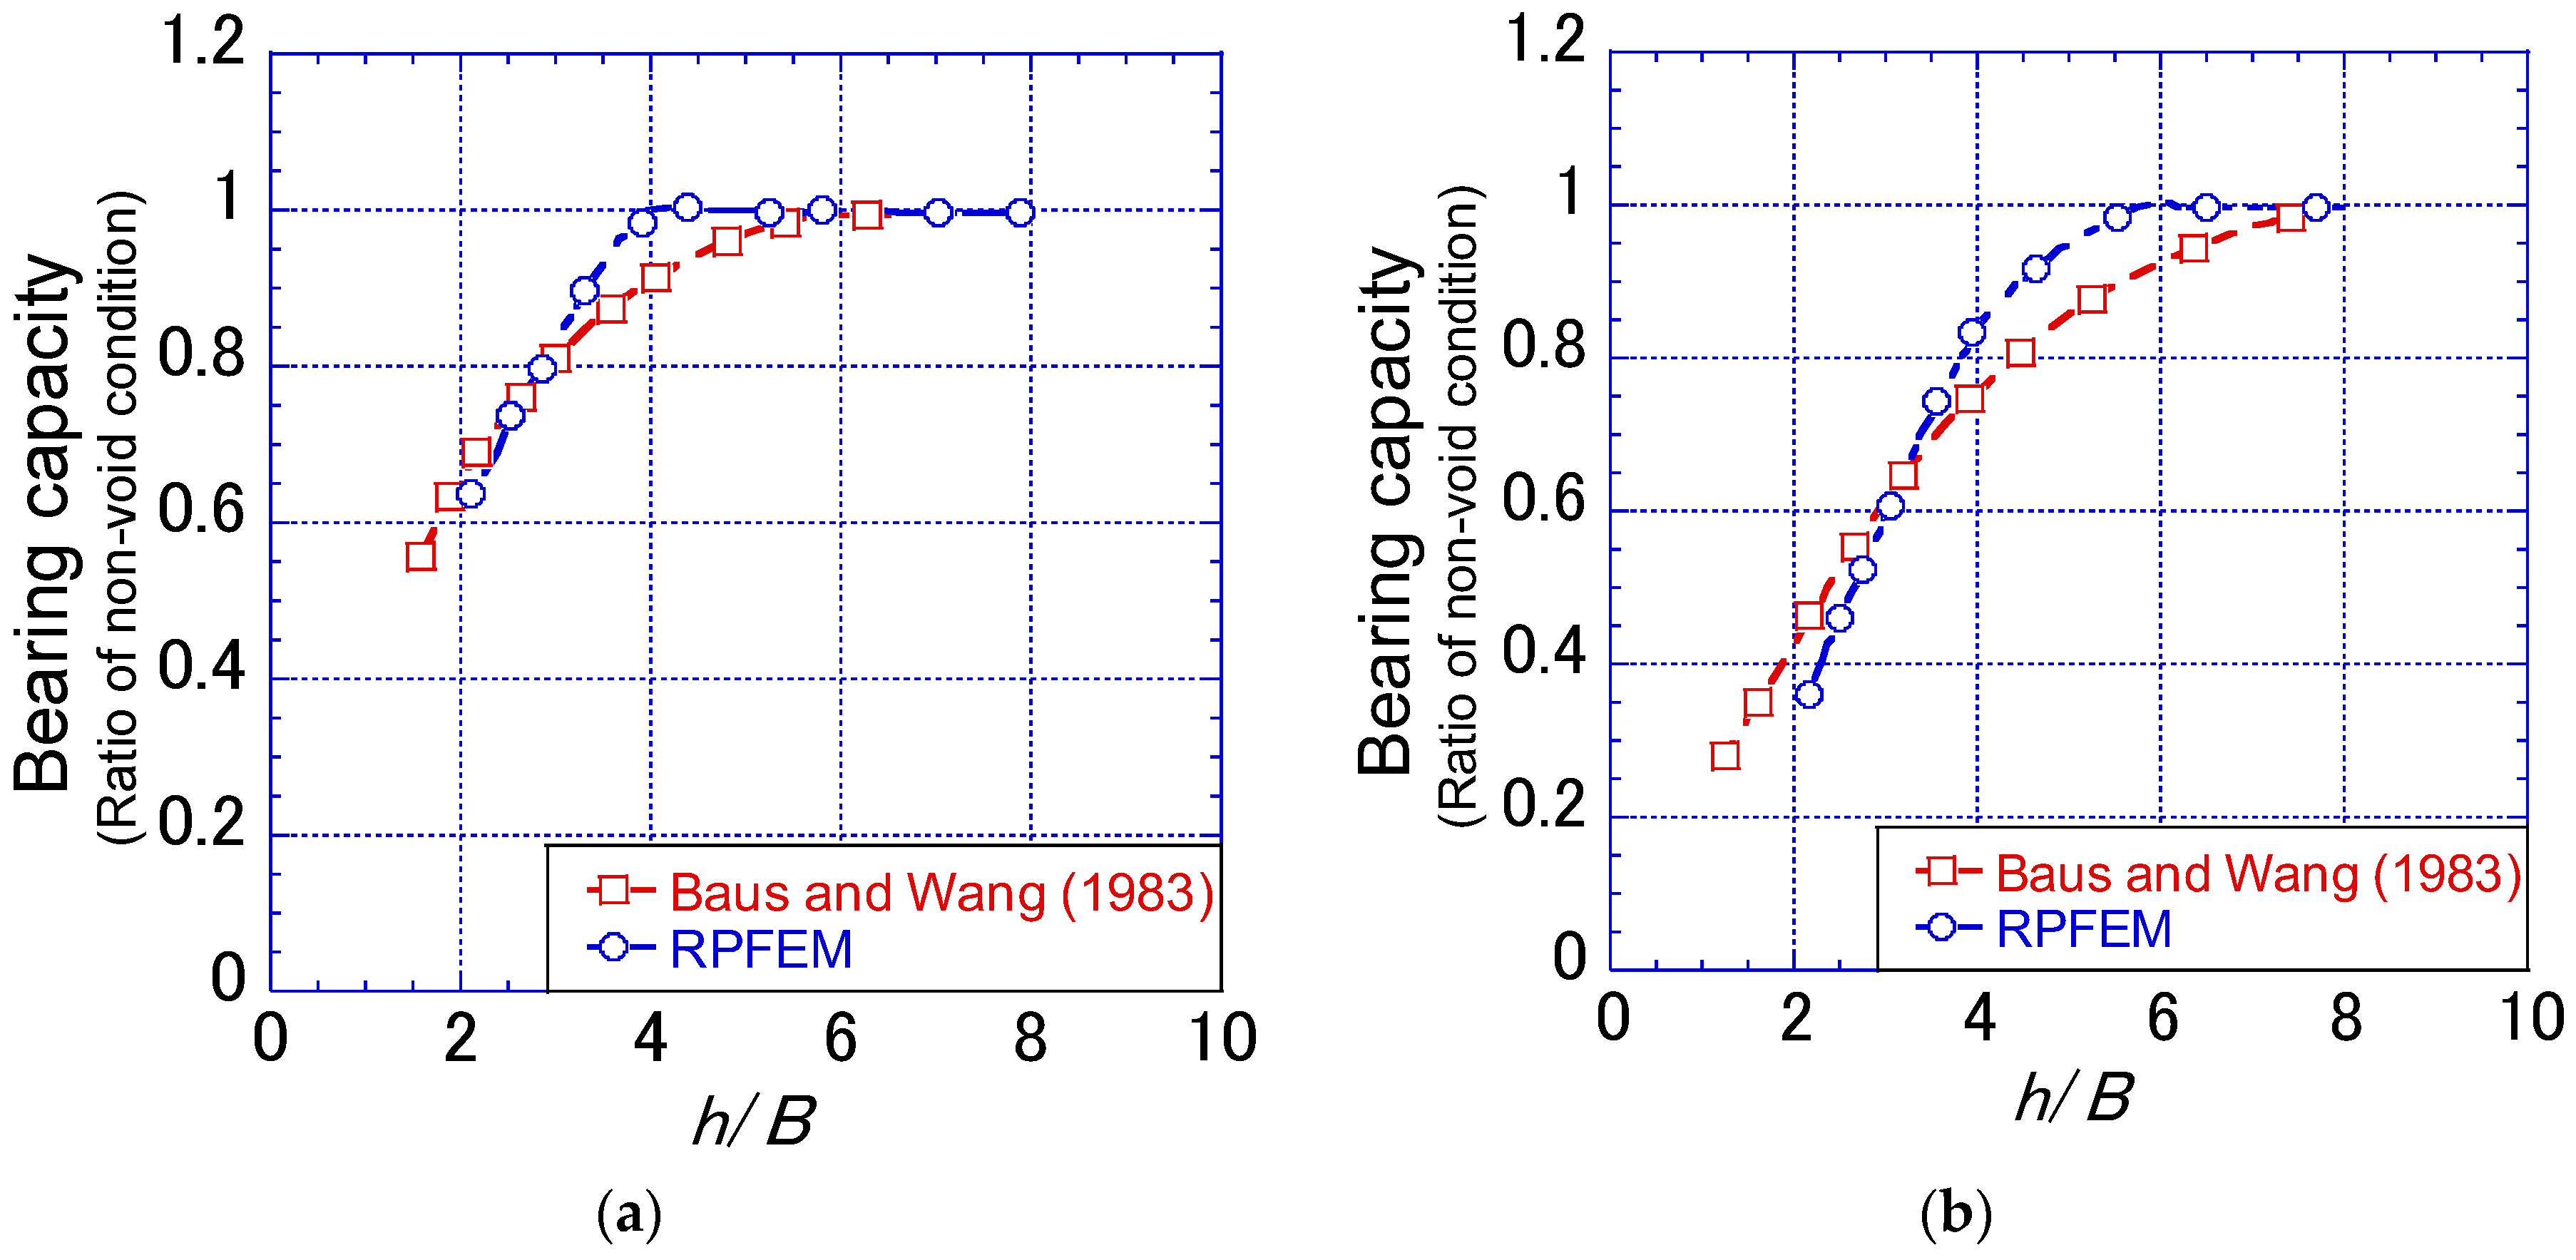
Figure 12).
The failure mechanisms observed in cavities with horizontal gaps from footing centerlines delineate two types of failures, emphasizing the significance of soil shear resistance in predicting failure mechanisms. Bearing failure occurs when cavities are sufficiently distant from the footing centerline and outside the slip surface. On the contrary, bearing and void failure result in rupture lines developing from the edges of the footing to cavity walls and roof, potentially inducing differential settlements over a broader area.
While Zhou et al. [28] confirmed similar behavior, their proposed solution lacks a formula for evaluating stability levels. In contrast, based on RPFEM results, this study proposes an equation for the critical boundary, incorporating normalized parameters R and H, cavity dimensions, and soil strength. This solution confidently predicts the influence zone based on normalized parameters. In summary, RPFEM demonstrates robustness in analyzing the studied issue, encompassing both bearing capacity and stability concerns.

4.6. Example of Engineering Application of the Charts of Influence Zone

For the case study by Yan et al. [30] an application of the critical line’s equation is demonstrated. The study concerned a region in China named Liangshuijing. In the project area, the soil consists of light yellow and hard plastic-like red clay with an average thickness of 9.6 m, and the bedrock mainly consists of light grey, thin-layered, and moderately weathered limestone. The 2.0 m × 2.0 m independent foundation under the column was adopted in the project. The basis depth is 2.0 m, the clay weight γ = 18.2 kN/m3, c = 53 kPa, ϕ = 28 deg. There is an oval cavity with a semi-major axis of 0.3 m and a short half-axis of 0.25 m under 5.0 m of foundation. There are no fillings in the cavity. Based on these data, we introduce a case of utilization of the critical lines with a dry condition to determine stability.
Assuming that the cavity’s centerline coincides with the footing centerline (Figure 13), the coefficients q in Table 5 is determined using b0 = 2.1; b1 = 0.25; b2 = −0.003 based on the shear strength parameters shown above. As a result, the calculated critical boundary is Ycri = 6.75 where X = 0. The stability condition is expressed by comparing the (h-D/2)/H = 1.26 obtained from the provided geometrical conditions (h = 5 m, D = 0.5 m, and H = 3.25 m) to the critical value Ycri of 6.75. This comparison shows that the cavity is involved within the unstable zone and agrees with the results by Yan et al. [30], who estimated an unstable condition based on their calculated stability factor such as 0.982 < 1.0. Even though the comparison with our method is indirect, it can reach a similar conclusion about the state of stability, which is one of our objectives.

5. Limitations

It is noteworthy to mention that the study focuses on the bearing capacity of the footing above square and circular cavities. However, since the results of the square cavities represent a worse scenario, our solution is built based on the results of the square cavities, and thus fewer results of the circular cases were shown. In addition, some researchers confirmed that the shape of the cavity has negligible influence on the bearing capacity characteristic [8,27]. This study is limited to the cases where the soil strengths, especially, are not as large as in rock-like materials. This means that, in the case of a material strength higher than 100 kPa, the solution may not be sufficient. In addition, the cavity size should be within the range of the parameters used in the present study to provide a realistic solution. This being said, future research can focus on much larger cavity sizes and stronger geomaterials. Other aspects in which clarifications are needed should consider the cases of non-homogenous soil materials (layered ground), foundation load inclinations, and most interestingly an examination of the water table level and drainage conditions as the changes in groundwater levels can affect soil properties and the behavior of the footing-cavity system.
In light of our comprehensive study on the influence of cavities on the bearing capacity of footings, we propose a set of recommendations for incorporation into construction practices and codes. It is imperative that construction practitioners and regulatory bodies recognize the potential impact of subsurface voids on the stability of foundations. Our findings underscore the need for applying a straightforward formula to assess the stability level when a cavity is discovered. We suggest the integration that the formula be integrated into the use of real case projects so that it can be improved if necessary. Furthermore, we recommend the development of guidelines within construction codes to address the stability concerns associated with cavities, including specific design methodologies and safety factors. Emphasizing the importance of proactive cavity detection and mitigation measures in construction regulations will contribute to enhanced structural stability and, ultimately, safer built environments. Continuous collaboration between geotechnical engineers, construction professionals, and regulatory authorities is crucial to ensuring the effective implementation of these recommendations in construction practices.

6. Conclusions

The study yielded the following outcomes.
(1)
The RPFEM produced reasonable results of the bearing capacity with a cavity for the highly cohesive soils and the intermediate soils except in the cases where their cohesion and shear resistance angle were low.
(2)
The bearing capacity is influenced by the footing width, the location of the cavity, as well as the shape. The combination of these geometric parameters with the shear strength parameters of the soils provided an understanding of the distribution of the BC/BCNV in the horizontal and vertical direction to clarify the influence zone of the cavity.
(3)
The influence zone is dependent on the shear resistance parameters. By normalizing the influence zone based on the general bearing failure domain parameters in the intact ground, it is found that the influence zone has a great sensitivity in the vertical direction but less in the horizontal direction. It is influenced more by the cohesions and less by the shear resistance angle.
(4)
The equation of the critical equation is proposed to distinguish the influence zone and no influence zone in the simple and robust manners based on the RPFEM results. Its validity was verified by comparing it with the past data in the literature. The proposed equations provide great tools to evaluate and predict dangerous areas for shallow foundations in the vicinity of an identified underground cavity.

Author Contributions

Conceptualization, E.K.L.; Software, K.I.; Validation, K.I.; Formal analysis, E.K.L.; Investigation, E.K.L.; Resources, K.I.; Writing—original draft, E.K.L.; Writing—review & editing, K.I.; Supervision, K.I. All authors have read and agreed to the published version of the manuscript.

Funding

This research received no external funding.

Institutional Review Board Statement

Not applicable.

Informed Consent Statement

Not applicable.

Data Availability Statement

The raw data supporting the conclusions of this article will be made available by the authors on request.

Conflicts of Interest

The authors declare no conflicts of interest.

References

  1. Holzer, T.L. Living with Unstable Ground; American Geological Institute: Alexandria, VA, USA, 2009. [Google Scholar]
  2. Williams, P.W. Encyclopedia of Caves and Karst Science; Gunn, J., Ed.; Fitzroy Dearborn: New York, NY, USA, 2004; Volume 41. [Google Scholar] [CrossRef]
  3. Waltham, T.; Lu, Z. Natural and anthropogenic rock collapse over open caves. Geol. Soc. Lond. Spec. Publ. 2007, 279, 13–21. [Google Scholar] [CrossRef]
  4. Parise, M.; Gunn, J. Natural and Anthropogenic Hazards in Karst Areas: Recognition, Analysis and Mitigation; The Geological Society of London: London, UK, 2007; Volume 16. [Google Scholar]
  5. Zhou, W.; Beck, B.F. Management and mitigation of sinkholes on karst lands: An overview of practical applications. Environ. Geol. 2008, 55, 837–851. [Google Scholar] [CrossRef]
  6. Ford, D.; Williams, P. Karst Hydrogeology and Geomorphology; John Wiley & Sons: Hoboken, NJ, USA, 2007. [Google Scholar]
  7. Khadka, S. A Numerical Study of the Coupled Geomechanical Processes in Sinkholes; University of Toledo: Toledo, OH, USA, 2018. [Google Scholar]
  8. Baus, R.L.; Wang, M.C. Bearing Capacity of Strip Footing above Void. J. Geotech. Eng. 1983, 109, 1–14. [Google Scholar] [CrossRef]
  9. Kiyosumi, M.; Kusakabe, O.; Asce, M.; Ohuchi, M. Model Tests and Analyses of Bearing Capacity of Strip Footing on Stiff Ground with Voids. J. Geotech. Geoenviron. Eng. 2011, 137, 363–375. [Google Scholar] [CrossRef]
  10. Wu, G.; Zhao, M.; Zhang, R.; Liang, G. Ultimate bearing capacity of eccentrically loaded strip footings above voids in rock masses. Comput. Geotech. 2020, 128, 103819. [Google Scholar] [CrossRef]
  11. Ali, H.; Choi, J.H. Risk prediction of sinkhole occurrence for different subsurface soil profiles due to leakage from underground sewer and water pipelines. Sustainability 2020, 12, 310. [Google Scholar] [CrossRef]
  12. Augarde, C.E.; Lyamin, A.V.; Sloan, S.W.; Asce, M. Prediction of Undrained Sinkhole Collapse. J. Geotech. Geoenviron. Eng. 2003, 129, 197–205. [Google Scholar] [CrossRef]
  13. Badie, A.; Wang, M.C. Stability of spread footing above void in clay. J. Geotech. Eng. 1984, 110, 1591–1605. [Google Scholar] [CrossRef]
  14. Yamamoto, K.; Lyamin, A.V.; Wilson, D.W.; Sloan, S.W.; Abbo, A.J. Stability of dual circular tunnels in cohesive-frictional soil subjected to surcharge loading. Comput. Geotech. 2013, 50, 41–54. [Google Scholar] [CrossRef]
  15. Wu, G.; Zhao, H.; Zhao, M. Undrained stability analysis of strip footings lying on circular voids with spatially random soil. Comput. Geotech. 2021, 133, 104072. [Google Scholar] [CrossRef]
  16. Drumm, E.C.; Aktürk, Ö.; Akgün, H.; Tutluoğlu, L. Stability Charts for the Collapse of Residual Soil in Karst. J. Geotech. Geoenviron. Eng. 2009, 135, 925–931. [Google Scholar] [CrossRef]
  17. Keawsawasvong, S.; Ukritchon, B. Undrained stability of a spherical cavity in cohesive soils using finite element limit analysis. J. Rock Mech. Geotech. Eng. 2019, 11, 1274–1285. [Google Scholar] [CrossRef]
  18. Kiyosumi, M.; Kusakabe, O.; Ohuchi, M.; Le Peng, F. Yielding Pressure of Spread Footing above Multiple Voids. J. Geotech. Geoenviron. Eng. 2007, 133, 1522–1531. [Google Scholar] [CrossRef]
  19. Tamura, T.; Kobayashi, S.; Sumi, T. Limit Analysis of Soil Structure by Rigid Plastic Finite Element Method. Soils Found. 1984, 24, 34–42. [Google Scholar] [CrossRef]
  20. Tamura, T.; Kobayashih, S.; Sumi, T. Rigid-Plastic Finite Element Method for Frictional Materials. Soils Found. 1987, 27, 1–12. [Google Scholar] [CrossRef]
  21. Hoshina, T.; Ohtsuka, S.; Isobe, K. Rigid plastic stability analysis for slope including thin weak layer. Jpn. Geotech. J. 2011, 6, 191. [Google Scholar] [CrossRef]
  22. Nguyen, D.L.; Ohtsuka, S.; Hoshina, T.; Isobe, K. Discussion on size effect of footing in ultimate bearing capacity of sandy soil using rigid plastic finite element method. Soils Found. 2016, 56, 93–103. [Google Scholar] [CrossRef]
  23. Iqbal, T.; Ohtsuka, S.; Isobe, K.; Fukumoto, Y.; Kaneda, K. Influence of strip footing size on the ultimate bearing capacity formula for sandy soils. Int. J. GEOMATE 2023, 24, 1–9. [Google Scholar] [CrossRef]
  24. Pham, Q.N.; Ohtsuka, S.; Isobe, K.; Pham, V.N.; Hoang, H.P. Limit load space of rigid strip footing on sand slope subjected to combined eccentric and inclined loading. Comput. Geotech. 2023, 162, 105652. [Google Scholar] [CrossRef]
  25. Tamura, T. Rigid Plastic Finite Element Method in Geotechnical Engineering. In Computational Plasticity, Current Japanese Material Research; Elsevier: London, UK, 1990; pp. 15–23. [Google Scholar]
  26. Cascone, E.; Biondi, G.; Casablanca, O. Groundwater effect on bearing capacity of shallow strip footings. Comput. Geotech. 2021, 139, 104417. [Google Scholar] [CrossRef]
  27. Al-Tabbaa, A.; Russell, L.; O’Reilly, M. Model tests of footings above shallow cavities. Ground Eng. 1989, 22, 39–42. [Google Scholar]
  28. Zhou, H.; Zheng, G.; He, X.; Xu, X.; Zhang, T.; Yang, X. Bearing capacity of strip footings on c–φ soils with square voids. Acta Geotech. 2018, 13, 747–755. [Google Scholar] [CrossRef]
  29. Lee, J.K.; Jeong, S.; Ko, J. Undrained stability of surface strip footings above voids. Comput. Geotech. 2014, 62, 128–135. [Google Scholar] [CrossRef]
  30. Yan, E.; Cheng, J.; Liu, L. Stability Analysis and Evaluation of Soil Cave Foundation under the role of Groundwater in Karst Area. Int. J. Intell. Syst. Appl. 2009, 1, 60. [Google Scholar] [CrossRef]
Figure 1. Problem definition of a footing laying on the soil with a cavity.
Applsci 14 01975 g001
Figure 2. Comparison of the variation of the bearing capacity with the depth to cavity obtained by RPFEM and the study by Baus and Wang [8]. (a) D/B = 1; (b) D/B = 2.
Applsci 14 01975 g002
Figure 3. Effects of different geometrical parameters on the normalized bearing capacity BC/BCNV. (a) Footing width (for cases B = 1, 2 m; D = 1 m); (b) cavity shape (for cases B = 2 m; D = 1 m); (c) cavity size (for cases B = 1 m, D = 1, 2 m); (d) cavity depth (in case B = 1m).
Applsci 14 01975 g003
Figure 4. General bearing failure pattern with the normalization parameters.
Applsci 14 01975 g004
Figure 5. Illustration of the obtention of parameters R and H on the RPFEM deformed model of the footing on the soil without cavity.
Applsci 14 01975 g005
Figure 6. Behavior of the BC/BCNV variations along r/D and the failure modes for cohesive soils with small cohesion (c = 10 kPa). (a) Variation of BC/BCNV along r/D; (b) Point K (r/D = 5); (c) Point L (r/D = 7); (d) Point M (r/D = 10).
Applsci 14 01975 g006
Figure 7. Distribution of the BC/BCNV within the X and Y direction for the cohesive soils (c = 50 kPa).
Applsci 14 01975 g007
Figure 8. Distributions of the BC/BCNV within the X and Y directions for the intermediate soils. (a) c = 10 kPa, ϕ = 20 deg; (b) c = 10 kPa, ϕ = 30 deg; (c) c = 50 kPa, ϕ = 20 deg; (d) c = 50 kPa, ϕ = 30 deg.
Applsci 14 01975 g008
Figure 9. Failure modes for different shear strength parameters c = 10 kPa, ϕ = 30 deg (left) and c = 10 kPa, ϕ = 40 deg (right). (a) B = 1 m, D = 2 m, r = 1 m, h-D/2 = 8 m; (b) B = 1 m, D = 2 m, r = 1 m, h-D/2 = 8 m; (c) B = 1 m, D = 2 m, r = 5 m, h-D/2 = 6 m; (d) B = 1 m, D = 2 m, r = 5 m, h-D/2 = 6 m; (e) B = 1 m, D = 2 m, r = 10 m, h-D/2 = 2 m; (f) B = 1 m, D = 2 m, r = 10 m, h-D/2 = 2 m.
Applsci 14 01975 g009
Figure 10. Critical line in cohesive soil (c = 50 kPa).
Applsci 14 01975 g010
Figure 11. Critical lines for the intermediate soils with variable ϕ. (a) c = 10 kPa; (b) c = 50 kPa.
Applsci 14 01975 g011
Figure 12. Comparison between Nc derived from RPFEM and that of previous studies [18,28,29] (c = 60 kPa and c = 300 kPa).
Applsci 14 01975 g012
Figure 13. Illustration of the model of the footing-cavity system by Yan et al. [30].
Applsci 14 01975 g013
Table 1. Model geometry.
ParametersValues
Cavity depth h-D/2 (m)2, 4, 6, 8
Cavity diameter D (m)1, 2
Horizontal distance r (m)0, 1, 2, 3, 4, 5, 6, 7, 8, 9, 10
Footing width B (m)1, 2
Table 2. Soil parameters.
PropertiesCohesiveIntermediate
Cohesion c (kPa)10, 50, 7510, 50
Shear resistance angle ϕ (deg)010, 20, 30, 40
Unit weight γ (kN/m3)1616
Table 3. (a) Normalization parameters R and H obtained with the RPFEM results. Cohesive soils. (b) Normalization parameters R and H obtained with the RPFEM results. Intermediate soils with small cohesion soils. (c) Normalization parameters R and H obtained with the RPFEM results. Intermediate soils with large cohesion soils.
Cohesion c (kPa)ϕ (deg)B (m)R (m)H (m)
(a)
50012.51.5
024.52.25
(b)
101013.51.5
25.53
20141.5
263
3014.51.75
27.52.75
4017.52.25
27.52.5
(c)
501013.51.5
25.52.75
20141.75
273
3014.52.25
28.53.25
4017.52.5
2124.5
Table 4. Coefficients p and q for cohesive soils.
CoefficientsValues
p−1.5
q2.68
Table 5. Coefficients p and q for intermediate soils.
CoefficientsValues
p a 0 + a 1 × ϕ + a 2 × ϕ 2
q b 0 + b 1 × ϕ + b 2 × ϕ 2
a 0 13.24 + 0.17 × c
a 1 0.42
a 2 0.0061
b 0 12.17 0.19 × c
b 1 0.25
b 2 0.003
Disclaimer/Publisher’s Note: The statements, opinions and data contained in all publications are solely those of the individual author(s) and contributor(s) and not of MDPI and/or the editor(s). MDPI and/or the editor(s) disclaim responsibility for any injury to people or property resulting from any ideas, methods, instructions or products referred to in the content.

