1. Introduction
In recent decades, wire-arc directed energy deposition (arc-DED) technology has gained significant traction within the scientific community, emerging as a focal point to produce additive components. A notable advantage of arc-DED lies in its robust deposition ratios, positioning it favorably among other additive methodologies [
1,
2]. This heightened attention has catalyzed a surge in research, propelling the exploration of 3D-printed part fabrication [
3]. Notably, aerospace applications have taken a prominent role, showcasing promising outcomes [
4,
5]. Of the arc-DED techniques, gas metal arc welding (GMAW) stands out for its elevated deposition rates, surpassing other wire-based technologies, such as plasma-based arc-DED and gas tungsten arc welding (GTAW) [
6,
7]. The utilization of Invar, an alloy, within this realm adds an intriguing dimension, leveraging its distinctive mechanical properties [
8,
9]. Comprising predominantly iron (64%) and nickel (36%) alloys, Invar finds purpose across diverse fields [
10,
11]. Renowned for its superior dimensional stability and mechanical prowess in cryogenic environments, Invar plays a pivotal role in applications demanding precision and reliability, as seen in metrology and aerospace components. The formidable challenge posed by its malleability and low heat conductivity in machining scenarios drives the interest in additive manufacturing for Invar, offering preforms aligning closely with final part geometries [
12,
13,
14]. Invar’s application through PBF-LB/M has revealed optimal energy density ranges for mechanical properties [
15], along with characteristic microstructures [
16].
To advance the implementation of arc-DED technology in complex geometries, the fine-tuning of processes from initial passes has emerged as a key focus [
17]. Understanding the geometry of zero beads has been central, often centering on models that correlate wire feed speed and travel speed (TS) with bead geometry characteristics [
18,
19,
20]. While conventional approaches maintain transverse bead geometry as a constant during deposition, limited studies acknowledge longitudinal variations [
21]. Pinto et al. [
22] reported the real-time determination of weld bead dimensions using passive vision systems and digital image processing. The proper construction of initial beads fundamentally underpins the accurate manufacturing of final walls. Xiong et al. [
23] delve into layer-by-layer forming characteristics analysis in GMAW-based arc-DED, while Donghong et al. [
24] address corner piece generation for intricate geometries. Amid the importance of final bead geometry analysis, the challenge of online process control remains pronounced [
25]. Infrared pyrometry techniques for melt-pool measurement have found favor within integrated process monitoring systems [
26,
27,
28], some even hinting at symmetries in the generated geometries [
9], thus offering a realm of exploration for the research community.
Regarding arc-DED, as the technology continues to advance, it becomes imperative to explore the testing methodologies to contribute to its optimization. Among the forefront of the testing methods is the integration of artificial intelligence (AI) for defect detection in arc-DED [
29]. Researchers have developed sophisticated AI applications, tailored to identifying flaws during the manufacturing process, thus enhancing quality control and efficiency. Additionally, in situ ultrasonic testing (UT) emerges as a pivotal non-destructive technique, utilized during arc-DED component construction. Operating at temperatures up to 100 °C, UT plays a crucial role in defect detection, ensuring the integrity and reliability of fabricated parts [
30].
Furthermore, novel control strategies, such as reinforcement learning, have demonstrated promising outcomes in addressing inherent challenges within arc-DED, such as model non-linearity and process uncertainties. These adaptive strategies empower manufacturers with enhanced control over process parameters, facilitating greater precision and consistency. Additionally, while arc-DED presents opportunities for producing medium-to-large-scale metallic components, ongoing efforts in materials characterization and defect mitigation remain essential in the optimization of product quality and performance [
31].
Throughout history, humanity’s quest for improved materials and fabrication techniques has driven innovation. Contemporary technological advancements have paved the way for novel materials with unprecedented applications. Among these, Invar 36, or FeNi36, has emerged as a versatile Fe-based alloy with exceptional properties. Its notably low coefficient of thermal expansion (CTE) makes it a standout choice. Conventionally, Invar 36 is machined, yet its poor machinability, which is due to its high ductility, low heat conductivity, and substantial work hardening, has sparked exploration into alternative manufacturing methods. Additive manufacturing (AM) stands out as a solution, offering efficient material usage and design flexibility. While the previous literature Manoj Guptahas predominantly explored laser-based powder bed fusion (PBF-LB/M) and power/laser directed energy deposition techniques, the usage of wire materials and electric arcs in AM is garnering renewed attention due to its potential to overcome the limitations of powder-based methods.
Focusing on the wire-based approach, this article delves into the advantages of the arc-DED process, emphasizing its applicability for large- or medium-sized components due to its high deposition rates and cost-effectiveness. Beyond this, the study ventures into the exploitation of modelling techniques to delineate the geometry, with the aim of determining target control parameters. These identified parameters will subsequently serve as the output for a neural network, into which welding and machine parameters are the input. This novel approach not only contributes to improving the understanding and control of the additive manufacturing process with Invar material, but also aligns with the broader goal of raising precision and efficiency in the manufacturing domain.
Taking advantage of arc-DED technology, which has been booming in the scientific community for the last decade, this research focuses on developing a virtual sensor for the indirect measurement of the bead size in Invar material. This innovative methodology integrates internal signals and sensors to obtain crucial measurements without the need for direct physical interaction or conventional measurement methods. The novelty of this paper is encapsulated in the innovative utilization of symmetry analysis techniques to address pivotal inquiries. These encompass an exploration of the geometry of zero beads via symmetry coefficient analysis in both longitudinal and transverse planes, an investigation into the symmetry of the final wall through the use of scanning laser technology, and a pioneering approach to melt-pool monitoring integrating infrared thermography techniques.
3. Results
This section presents the experimental outcomes and the discussions related to the arc-DED process applied to Invar. The chapter is structured into three interconnected subsections, each focusing on distinct aspects of the study. The first segment focuses on the measurement results pertaining to the bead profile, shedding light on the geometry of the initial bead and its implications for process parameters. The subsequent segment unveils the acquisition and analysis of current and voltage signals, offering insights into the dynamic nature of the process. Notably, the final facet of this chapter is dedicated to exploring the potential application of a virtual sensor for height measurement. This application leverages the signals from the generator and wire tractor, aiming to ascertain the height based on these instrumental inputs.
These activities help in the application of arc-DED technology to Invar to develop a virtual sensor for the indirect measurement of the bead size, taking advantage of internal signals and sensors without conventional measurement methods, and implementing a feed-forward neural network (FNN) model for real-time monitoring and highly accurate defect detection.
These interconnected components synergistically contribute to a holistic comprehension of the arc-DED process on Invar, as well as its implications for geometric precision and manufacturing performance.
3.1. The Measurement and Modeling of Zero Bead Geometry
The zero bead (
Figure 2), the first pass of material deposited during arc-DED, plays a crucial role in determining the final geometry and properties of the deposited material. Accurately measuring and modeling the zero bead geometry is essential for optimizing arc-DED parameters and ensuring the consistent quality of the parts. The arc-DED process exhibits a dynamic molten pool, contributing to a challenge in achieving consistent weld bead geometry, particularly at the beginning (arc striking) and end (arc extinguishing) stages.
The image shows a top view of a bead deposited using arc-DED technology. In the setup, the beads are 100 mm long, although the distance between them is not constant. The deposition process forms a molten pool, which contributes to a challenge in achieving consistent weld bead geometry, particularly at the beginning (arc striking) and end (arc extinguishing) stages.
In the arc-DED process, the material deposits into a non-constant molten pool along its trajectory. The material tends to flow towards the hotter region, resulting in a tendency to accumulate at the back of the trajectory, leaving a certain over-dimension at the rear section. Consequently, the initial section may exhibit increased height and width, further compounded by the arc striking effect [
33]. In the middle section, a quasi-stable situation is achieved, characterized by more continuous height and width. Here, the material experiences a relatively balanced state amid the dynamic molten pool, contributing to a more uniform bead geometry. However, as the process approaches its final section, the bead becomes narrower and lower, influenced by both the arc extinction phenomenon and the decreasing molten material flux. This final section reflects a distinctive geometry due to the combined effects of the reduced material flow and the arc extinguishing process.
The bead has a more uniform width and a smoother surface finish in the central section. It is important to note that the variations in the bead geometry seen in the image are relatively small. The study encompasses the central 46 mm of the 100 mm bead, as delineated by the blue dashed lines, incorporating the relevant values within this specified region. However, understanding these variations is important for ensuring consistent part quality and optimizing material properties. In the context of this image, the analysis will focus on the middle section of the bead, where the bead geometry is most uniform and consistent. By measuring and modelling the bead geometry, knowledge is gained that provides crucial information for designing complete components and effectively controlling the arc-DED process. This understanding of bead geometry is critical for the tailoring of the manufacturing process, thus ensuring optimal results and improving the overall quality of the manufactured parts.
The presented method for measuring the geometry of the zero bead consists of scanning the surface of the bead with a laser profilometer at 46 control points in the middle section of the bead. The laser profilometer precisely measures the distance between the laser beam and the bead surface at a series of discrete points, thus capturing a detailed representation of the bead’s transversal profile. The center of mass of the function formed by the measured profile points is calculated (
Figure 3a). To do this in two dimensions, it can be found by first dividing the domain of the function into a regular grid of points. Then, the weighted average of the coordinates of these points can be calculated, where the weights are the values of the function at these points. Equation (3) for
xcm and
zcm represents the calculation of the center of mass in the
x and
z directions, as shown in
Figure 3a, respectively, where
xi and
zi are the point clouds of the profile, and m
i represents the mass associated with each distance component. Equation (3) shows the formula for the center of mass (
xcm,
zcm).
These equations give you the coordinates of the center of mass for a two-dimensional object with either continuous or discrete mass distribution. Adjust the integrals or sums based on the specific form of your mass distribution. The reference plane or dimension 0 is defined using the profilometer, where the initial and final sections of the bead are detrended and adjusted to the zero reference of the plane. This adjustment ensures that the zero reference of the plane aligns with the bead’s starting and ending points, therefore providing a standardized reference point for the measurements. The data can then be used to fit a parabolic equation, representing the idealized parabolic shape of the zero bead (
Figure 3b). The fitted parabola provides valuable insights into the bead’s geometry, including its height and width. Across the 46 profiles extracted from the initial tested bead, the R-squared values vary between 0.807 and 0.948, averaging at 0.887. On average, this indicates that the model accounts for 88.7% of the data variability.
To further enhance the accuracy of the bead geometry representation, 3D modeling techniques can be employed, as can be seen in
Figure 4. In this representation, the fitted parabola is obtained from the 46 measured profiles of the bead in the middle section at a rate of 1 profile per mm in order to develop a full 3D model. By combining the fitted parabola with the measured bead dimensions, a comprehensive 3D model can be developed. This model provides a holistic view of the bead’s shape, size, and distribution of material. The comparison of the 3D model to the theoretical models of zero beads provides valuable insights into the influence of arc-DED parameters on bead geometry. By understanding the relationship between the process parameters and bead shapes, engineers can optimize arc-DED settings, allowing them to achieve the desired bead geometry and material properties.
The measuring and modeling of the zero bead geometry with arc-DED is a critical step in understanding and optimizing the process. The insights gained from these measurements can be used to ensure the consistent quality of the parts, enhance material properties, and optimize the design of arc-DED applications.
Table 3 summarizes the results of the bead height (h) and bead width (w) for the manufacturing conditions. Three measurements are taken at locations along the trajectory of tests 1 to 9, denoted as w1, w2, and w3, and h1, h2, and h3. These measurements correspond to the widths (w1, w2, w3) and heights (h1, h2, h3) along the initial, middle, and final sections, respectively, of the 46 profiles extracted for each bead.
The data indicates that there is a significant relationship between the welding parameters and the resulting bead dimensions. As the wire feed speed and deposition rate increase, the average bead width (w) and height (h) also increase. Conversely, increasing the traverse speed leads to a decrease in the average width and height of the beads.
This suggests that the wire feed speed and deposition rate primarily influence the heat input, while the traverse speed primarily affects the melt pool shape. In
Figure 5, the correlation of the ratio and the wire feed speed with the width and height are shown. Looking at the evolution of the bead height and width, it follows that a higher ratio leads to a taller and wider bead, unlike the wire feed speed, which does not seem to have such a direct relationship, and is more likely to have a quadratic effect.
The implications of these findings for arc-DED Invar manufacturing are that the desired bead dimensions can be controlled via the adjustment of the welding parameters. For applications requiring wider and taller beads, higher wire feed speeds and deposition rates can be employed. As for the effect of currents and voltages in zero bead scenarios, although beyond the proposed test, it would have an impact on the melt behavior, solidification, and ultimately the geometry of the resulting bead. It is envisaged that the higher heat input will cause the melt pool to be wider, leading to a wider and lower bead. This analysis could be used to refine the manufacturing process, ensure consistency, and produce high quality weld beads in a variety of scenarios. For applications requiring narrower and shorter beads, higher traverse speeds can be used.
3.2. The Geometry Analysis of Wall Fabrication with Optimized Parameters
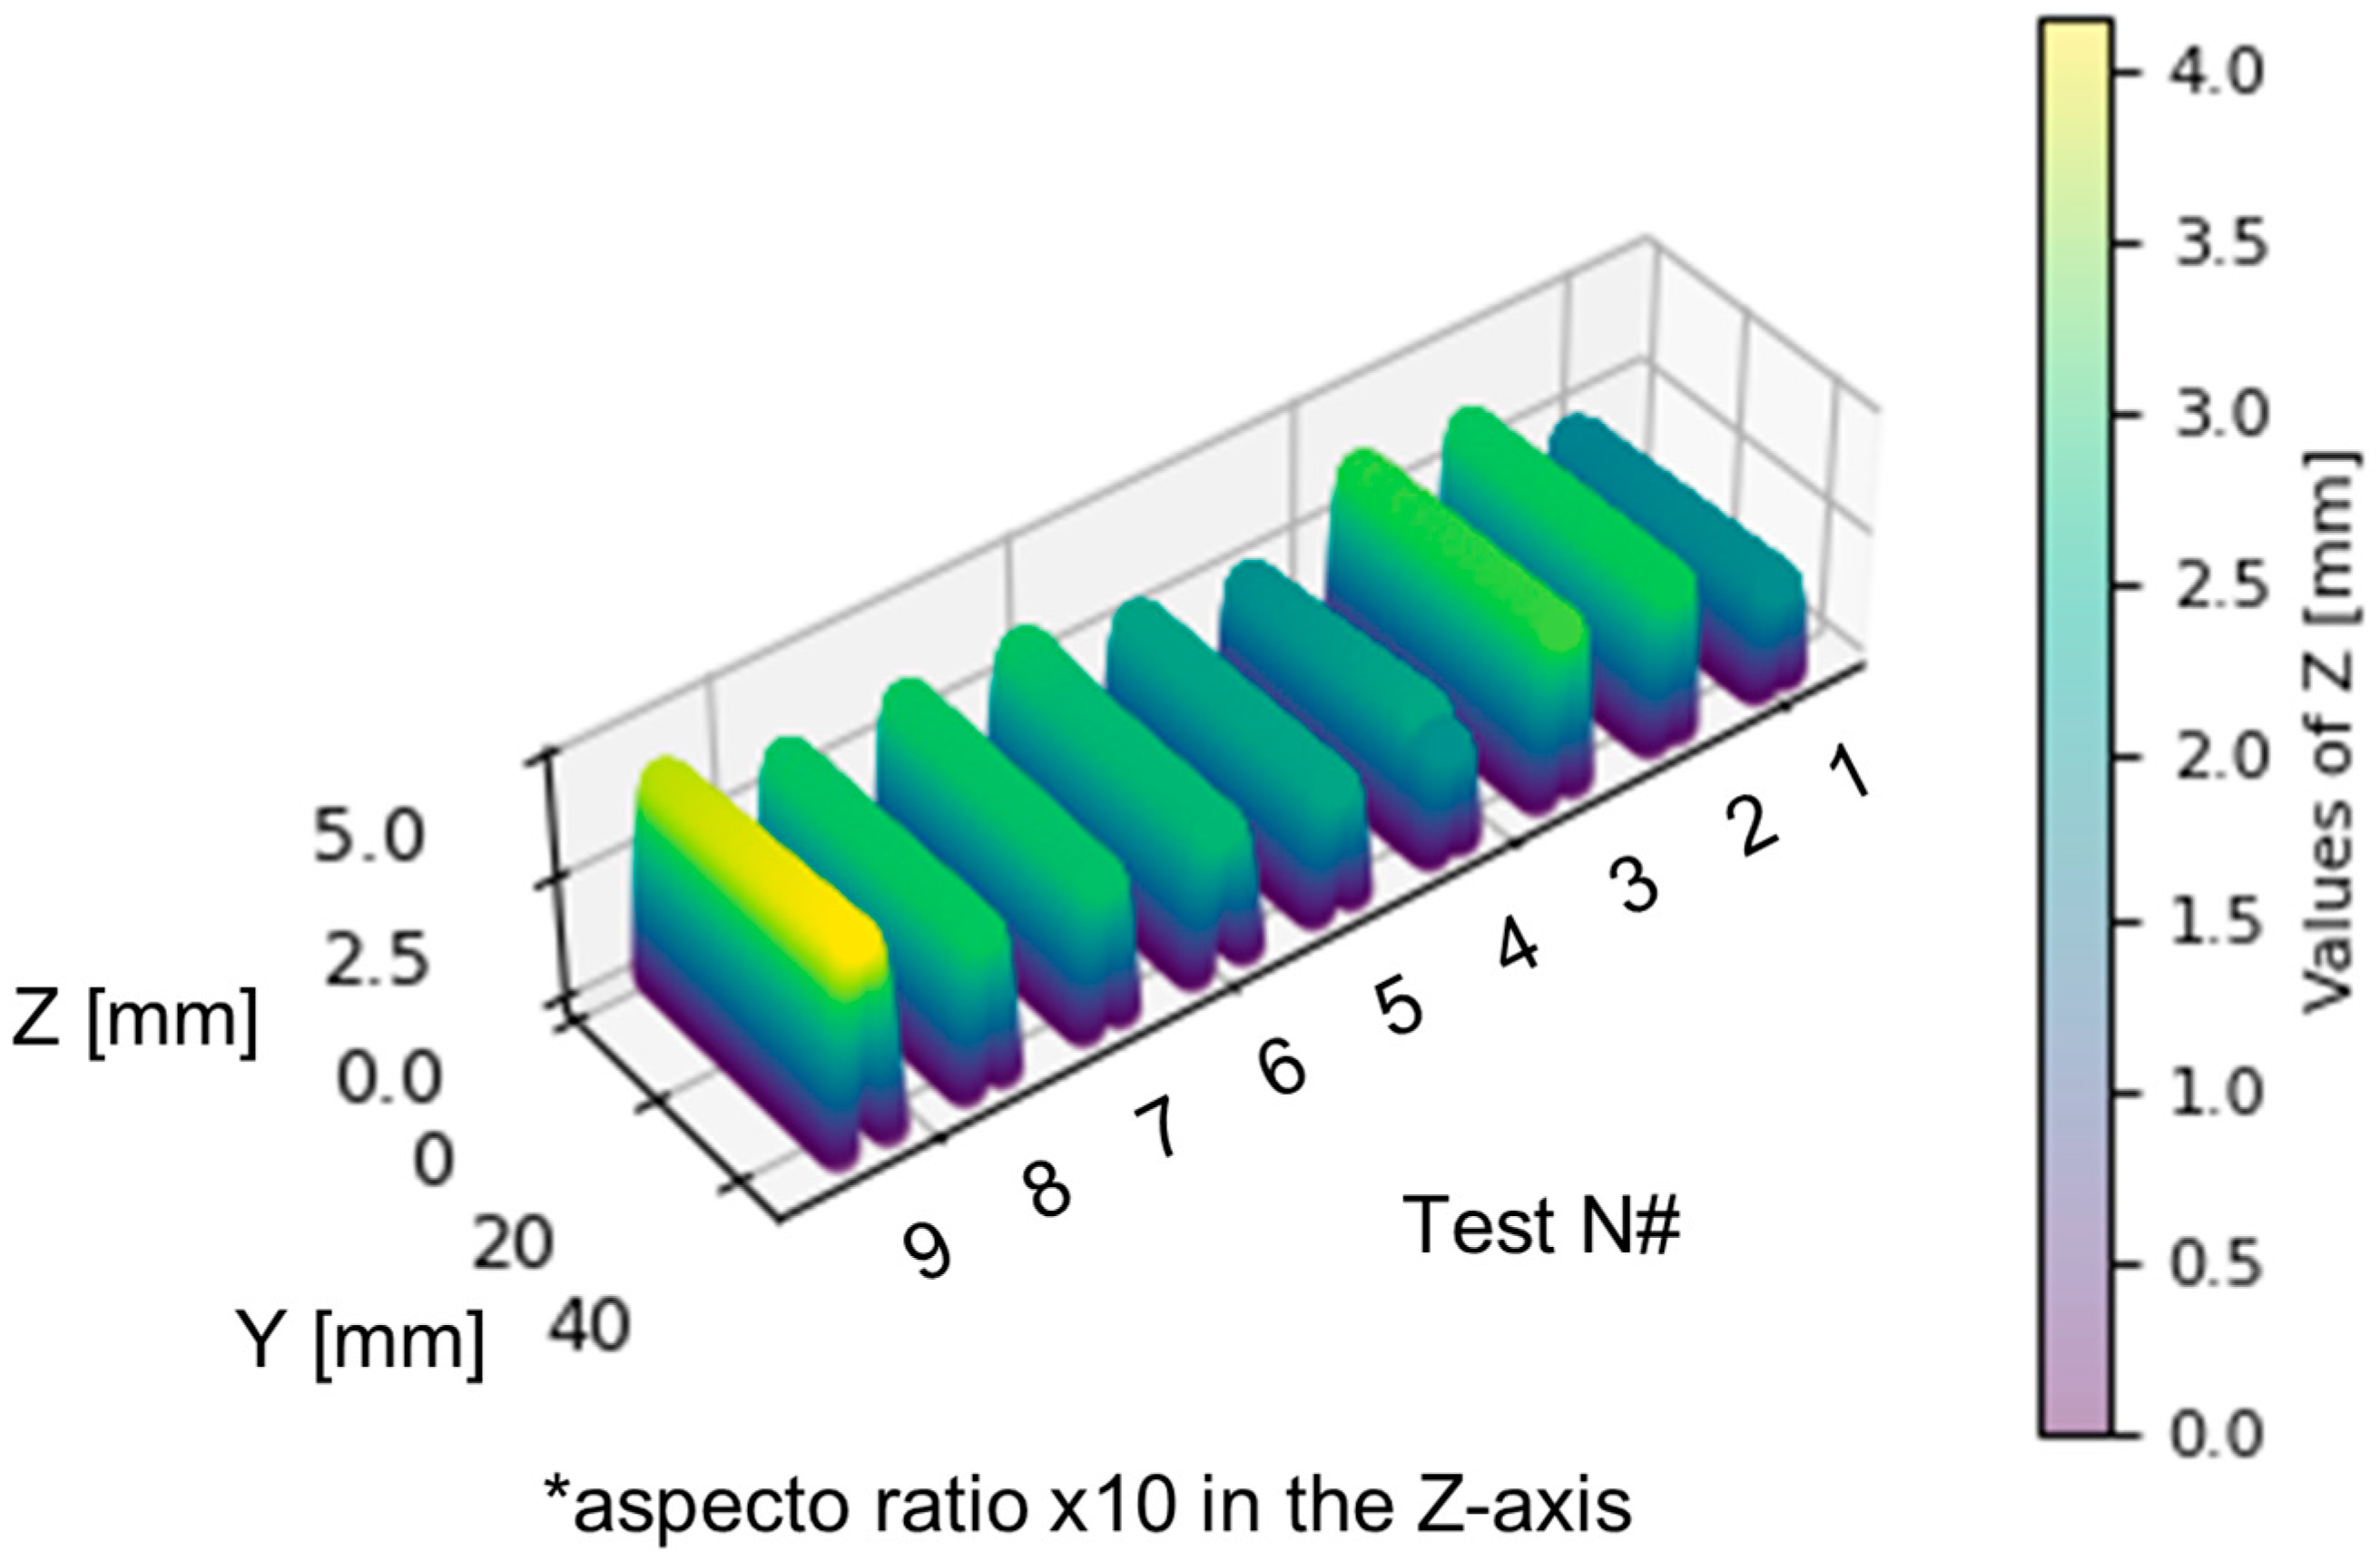
Figure 6 shows the results of the parabola model fitted to the profilometer data at each of the different arc-DED manufacturing conditions. The profilometer is located in the nozzle, and allows the transverse profile to be measured. This process is carried out offline. First, the formation of the bead is completed, allowing it to solidify, and then scanning is carried out using the profilometer to measure the transverse profile. The figure shows that the parabola model fits well to the profilometer data for all arc-DED manufacturing conditions. This suggests that the shape of the bead in the first pass is well described by a parabolic function.
The parabola model can be used to predict the geometry of the bead manufactured using arc-DED. This information can optimize the manufacturing process and produce parts in situ between passes. The implementation of the parabola model focuses on two main objectives. Firstly, it aims to make the geometry of the bead as similar as possible to the desired and preprogrammed parabolic shape. Secondly, the goal is to maintain a consistent geometry to ensure a uniform layer during the layer-by-layer growth phase. Currently, this process is not performed online; however, there is the potential to transform this into an online solution via the implementation of a virtual sensor that deduces the key parameters of the parabola and/or through measurements made using the profilometer linked to the torch, albeit with a slight delay. Optimizing the bead shape involves adjusting the process parameters, such as the wire feed speed, the traverse speed, and the current, to achieve the predefined parabolic shape. These adjustments can be made individually or simultaneously, based on the specific design requirements. Integrating this optimization online during the manufacturing process would allow for greater adaptability and precision, thus enhancing the real-time consistency of the bead.
The parabola model and its relationship to the monitored parameters can be used to feed a neural network to serve as a virtual sensor of the bead geometry, thus replacing the scan times of the profilometer. This information could be used to select the in situ manufacturing conditions to reduce shape distortion effect sources during the build-up process of parts.
3.3. The Data Monitoring of the DED Process on Invar
The data provided from the mold manufacturing process (
Figure 7) proves to be invaluable in enhancing the overall efficiency and quality of the manufacturing process. The chosen geometry is a reference geometry for molds in the aeronautical sector, and has been proposed by companies in the sector. The signals have been acquired at a rate of one hertz, one data per second, as we are not looking for a dynamic reaction to the process, but for a change in the quasi-static state. The signals acquired are the same as in all the tests shown in this work. Through a meticulous analysis of this data, various trends and patterns emerge, shedding light on areas that require attention and improvement. For example, temperature data can identify the regions of the mold that experience higher temperatures, or where the heat concentrates, allowing for corrective actions to be taken in subsequent passes. Such insights may signify issues with the cooling system or point to inadequacies in the mold part design. This design has been used in previous works [
34].
The feed rate data become a crucial metric in determining whether the wire feeder operates at the appropriate speed. This ensures the uniform solidification of the mold part, contributing to higher quality outcomes. The energy data play a pivotal role in assessing the wire feeder’s energy consumption. Optimizing energy usage not only reduces production costs, but also enhances the overall process efficiency.
Mold manufacturing process monitoring, facilitated by comprehensive data analysis, emerges as a powerful tool for refining efficiency, quality, and profitability. The insights gained from these data pave the way for continuous improvement throughout the various phases of the manufacturing process. In a three-dimensional context with Cartesian X, Y and Z axes in millimeters, the visual representation in
Figure 7 is a three-dimensional graph showing the evolution of six key process parameters over time. Each of the collected variables is represented in a subplot, and the color in the graph would represent the value of the property at each three-dimensional point. In
Figure 7, the variables represented are as follows: (a) the voltage which remains constant during most of the process; (b) the energy per unit length, which is higher in the lower layers when encountering the colder substrate, and then decreases in value; (c) the wire feed speed; (d) the transverse feed speed; (e) the current; and (f) the temperature which is raised in the area where it is higher in the straight section. Temperatures were measured using a pyrometer on the torch, capturing the surface temperatures of the bead at a given distance from the molten pool. This temperature data can be used to optimize the welding process in two key respects. First, it allows for the precise control of bead geometry via correlating temperature variations with the desired shape; at lower temperatures, a narrower and taller bead is estimated, while at higher temperatures, a wider and shorter bead is estimated. Secondly, the data help to detect defects by identifying cold areas, which indicated a lack of fusion, and high temperatures, which indicate possible porosity due to gas accumulation. This early detection of defects allows corrective action to be taken in time, thus ensuring the production of high-quality beads. As this is not a direct melt pool measurement, the correlations and measurements are not reliable, but are expected to be effective in combination with the other measured parameters and through artificial intelligence modelling.
Utilizing the data to identify trends and patterns can help predict potential issues. For instance, an increase in mold temperature may signal a cooling system problem, thus prompting timely intervention. Also, adjusting process parameters could be addressed. The data aids in adjusting parameters to enhance efficiency and quality. If the feed rate data reveal uneven solidification, adjustments can be made to ensure uniformity. Also, this could lead to a reduction in costs via a detailed analysis of the energy data, which can potentially uncover opportunities to minimize production costs. Identifying excess energy usage can lead to strategies for energy conservation.
Figure 8 shows the mold produced by arc-DED, which is the subject of this study. Material detachments can be observed in the corners, due to the change of direction in the deposition, which can allow for the detection of which should be studied for later improvements of the manufacturing process.
4. Neural Network Model
In this subsection, a virtual sensor emerges as a data-driven alternative to traditional physical sensors, enabling the continuous monitoring and analysis of weld bead geometry without requiring direct physical contact with the weld zone. This virtual sensor harnesses the power of machine learning algorithms, particularly neural networks, to establish a correlation between the process parameters and weld bead characteristics.
The sensor’s core ability is to extract meaningful insights from process monitoring data, encompassing parameters like wire feed speed, voltage, current, travel speed, energy, and pyrometer temperature, as can be seen in
Figure 9a, following the same procedure as for the mold data. There are forty-six control point in the nine tests performed, as described in
Table 2. These data form the input layer of the neural network model, which serves as the sensor’s analytical engine.
The welding process is closely influenced by several key input parameters for the neural networks model. Firstly, voltage plays a crucial role in controlling arc length and heat input. Energy per unit length, another critical factor resulting from the current, voltage, and traverse speed, directly influences the heat input to the weld, thus affecting the depth of the penetration and the bead shape. In addition, the wire feed speed dictates the deposition rate of the wire. Conversely, the transverse speed, which governs the movement of the torch perpendicular to the welding direction, can alter the shape and width of the bead, depending on the speed employed. Current levels regulate the heat generated in the arc. Finally, the temperature, a product of the welding process, has a profound influence on the material properties and geometry of the bead.
The neural network model, trained on a comprehensive dataset of weld bead measurements which were obtained using physical sensors and profilometers, learns to map the intricate relationships between process parameters and weld bead geometry. This trained model constitutes the virtual sensor’s intelligence, thus enabling it to predict weld bead geometry for new process conditions without any physical interaction.
The neural network model at the heart of the virtual sensor employs a series of interconnected nodes, mimicking the structure of the human brain. These nodes process information, performing complex calculations and passing the processed information to subsequent nodes in a hierarchical manner.
The input layer of the model receives the process monitoring data, represented as vectors of numerical values. These vectors are transformed into features that capture the essence of the process conditions. The transformed features are then fed into the hidden layers of the neural network, where they undergo a series of mathematical operations. The hidden layers, typically comprising multiple layers, introduce non-linearities into the model, enabling it to capture the complex relationships between the features and the weld bead geometry. The output of the hidden layers is then passed through an output layer, which generates the predicted weld bead geometry, represented as a parabola that accurately represents the bead’s shape and dimensions.
The neural network model predicts the height and width of the weld beads based on various input parameters, such as amperage, voltage, speed, gas, energy, wire, and temperature. The code follows the following methodology, using the libraries (sklearn.model_selection and tensorflow). These libraries are used for data manipulation, data splitting, and model training, respectively. The code employs experimental test data with different welding conditions. The data collected are six input variables (wire feed speed, voltage, current, travel speed, energy, and pyrometer temperature) for the forty-six control points of the nine beads defined in
Table 2, as discussed in the results
Section 3.1. The data are split into training and testing sets. The training set is used to train the model (80% of the data), while the testing set (20% of the data) is used to evaluate the model’s performance on unseen data. The model consists of an input layer, two hidden layers with 100 and 50 neurons, respectively, and an output layer with two neurons corresponding to the height and width of the weld beads. The model is compiled using the Adam optimizer, the mean squared error (MSE) loss function, and a precision metric. This model has a test loss of 0.144 and a perfect test accuracy of 1.0, demonstrating its remarkable ability to predict weld bead geometry from process parameters alone. The model’s performance is evaluated on the test set, 0.2 (percentage of the total data set) × 9 (beads with different welding conditions) × 46 (control points), as shown in
Figure 9b. The fact that the points on the validation graph are clustered around the line of perfect prediction indicates that the model is predicting real values with a fair degree of accuracy. However, it would be important to conduct further tests in order to confirm these results. This could be performed via increasing the size of the test dataset or using a different test dataset altogether. It would also be crucial to analyze the model’s errors to identify any trends or patterns that may indicate an issue with the model.
Figure 10 shows the fabricated welding bead from the ninth test, with the direct deposition arc welding (DED) process. The cross-section, considered to be the weld profile shown in the image, is typical of a DED weld. The weld has a parabolic shape, almost perfectly matching the raw data from the profilometer with its regression model, with a wide melt region at the bottom, and a narrow bead region at the top. The virtual sensor correctly defines the shape by fitting closely to both the regressed parabola and the raw points. For its conception, the error is associated with the fact that the center of the parabola is not the physical center, as it has a certain flattening to the right in positive values of the abscissa axis.
The virtual sensor’s ability to predict weld bead geometry in real-time opens up a plethora of applications: (i) Real-time monitoring and defect detection—the virtual sensor can continuously monitor weld bead geometry, alerting operators to potential defects such as undercut, a lack of fusion, or excessive bead height; (ii) Automated process control—the predicted weld bead geometry can guide the automation of the welding process, optimizing parameters like wire feed speed and travel speed in order to achieve the desired weld characteristics; and (iii) Quality assurance—the virtual sensor can evaluate the quality of weld beads by comparing the predicted geometry to the actual geometry measured using a physical sensor. This comparison can identify defects and ensure consistent weld quality.
The virtual sensor, powered by a neural network model, represents a transformative advancement in weld bead monitoring and control, thus paving the way for enhanced weld quality, improved process efficiency, and reduced production costs.


