Abstract
Computed tomography (CT) is a rapid and precise medical imaging modality, but it poses the challenge of high radiation exposure to patients. To control this issue, stringent quality control (QC) evaluations are imperative for CT. One crucial aspect of CT QC involves the evaluation of phantom images, utilizing specifically designed phantoms for accuracy management and subsequent objective evaluation. However, CT QC has qualitative evaluation methods, particularly for evaluating spatial and contrast resolutions. To solve this problem, we propose a quality control method based on deep-learning object detection for quantitatively evaluating spatial and contrast resolutions, CT Attention You Only Look Once v8 (CTA-YOLOv8). First, we utilized the YOLOv8 network as the foundational model, optimizing it for enhanced accuracy. Second, we enhanced the network’s capabilities by integrating the Convolutional Block Attention Module (CBAM) and Swin Transformers, tailored for phantom image evaluations. The CBAM module was employed internally to pinpoint the optimal position for achieving peak performance in CT QC data. Similarly, we fine-tuned the code and patch size of the Swin Transformer module to align it with YOLOv8, culminating in the identification of the optimal configuration. Our proposed CTA-YOLOv8 network showed superior agreement with qualitative evaluation methods, achieving accuracies of 92.03% and 97.56% for spatial and contrast resolution evaluations, respectively. Thus, we suggest that our method offers nearly equivalent performance to qualitative methods. The utilization of the CTA-YOLOv8 network in evaluating CT phantom images holds potential for setting a new standard in quantitative assessment methodologies.
1. Introduction
CT is an important diagnostic modality that utilizes radiation to capture medical images. While CT is highly beneficial for disease diagnosis, it exposes patients to significant levels of radiation [1,2]. Therefore, ensuring the QC of CT is crucial, and regular evaluations are essential for CT users. There are various approaches available for conducting CT QC. Commonly employed methods include phantom image evaluations, radiation dose monitoring, image quality assurance based on actual clinical images, regular equipment calibration to maintain equipment, and radiologist training and certification. These methods work together to ensure the quality and safety of CT imaging.
Specifically, phantom image evaluations employ specially designed phantoms for CT QC management and should be the most recommended objectively through quantitative measures [3]. However, some of the phantom evaluations rely on qualitative methods, where radiology experts subjectively assess detectability through visual inspection. This subjective evaluation (Spatial and Contrast resolution) can lead to inconsistencies among evaluators, resulting in low reproducibility [4].
To address this issue, quantitative evaluation methods based on traditional image-processing techniques have been developed [5,6,7]. These methods utilized formulaic outcomes to facilitate more accurate and rapid decision-making compared to qualitative methods. However, they made them vulnerable to unique pitfalls when optimized for specific conditions. Moreover, comprehensive system modifications were required in case of formula errors.
In early studies, researchers discerned differences in pixel values between the target and surrounding pixels in CT phantom images [5,6,8]. These offered the advantage of being expressible through straightforward formulas and calculations. However, they faced the problem in fully meeting the criteria of visual discernibility to the human eye. For example, some evaluators might consider a circle visually discernible. Subsequent research had aimed to address this issue by utilizing contour extraction algorithms, followed by assessing visual discernibility based on the circularity index and eccentricity of the circle [7,8]. But these methods have struggled to account for variations due to slight changes in shooting conditions or inherent errors in different equipment. To overcome this challenge, researchers attempted to quantify the intuitive quality of an image’s region by incorporating texture analysis [3]. However, these methods also had a problem that was struggled to account for variations due to slight changes in shooting conditions or inherent errors in different equipment. Ultimately, these approaches had proven difficult to replace qualitative assessment, as human judgment considers a variety of factors.
Alternatively, AI has been explored for application in diagnosing diseases based on medical images [9,10,11,12]. Traditionally, the diagnosing diseases was primarily reliant on the medical images and the patient’s condition, relying on the individual medical knowledge and judgment of the medical doctor. The medical doctor’s judgment was hindered by the limitations of the one’s knowledge level and the potential for errors. AI addresses the shortcomings of human judgment errors by providing relatively consistent assessments during diagnosis. Because it learns from vast amounts of data to make diagnoses based on extensive knowledge. As data from medical imaging modalities like CT, magnetic resonance imaging (MRI), and conventional X-ray images continue to accumulate, the value of AI in the medical field continues to rise, with specialized AI systems developed for medical diagnosis. However, unlike medical diagnosis, research on utilizing artificial intelligence for medical equipment management was currently very limited. The utilization of AI in CT QC can mitigate the variability of subjective assessments among individuals, leading the consistent responses.
Therefore, we can explore the potential application of AI in a new domain by applying artificial intelligence to the management of CT equipment specifically in the qualitative assessment method used in CT phantom image evaluation. Furthermore, optimizing it for this dataset and proposing new networks, we can not only develop a network that is actually utilized but also contribute to advancing the field. And AI also overcomes the limitations of traditional qualitative methods using flexible learning. Our approaches hold promise for enhancing the accuracy and reproducibility of results, thereby playing a significant role in improving CT QC and ensuring patient safety.
2. Materials and Methods
2.1. CT Phantom Image Acquisition
Phantom images for CT QC were acquired from those utilized in real tests spanning from 2008 to 2022. CT scans from three hospitals and featuring nine different machines were employed for image acquisition. The machines included the Discovery CT750HD(GE Healthcare, Waukesha, WI, USA), LightSpeed VCT (GE Healthcare, Waukesha, WI, USA), Optima CT660 (GE Healthcare, Waukesha, WI, USA), SOMATOM Definition (Siemens Medical Systems, Forchheim, Germany), SOMATOM Definition AS (Siemens Medical Systems, Forchheim, Germany), SOMATOM Definition AS Plus (Siemens Medical Systems, Forchheim, Germany), Sensation 16 (Siemens Medical Systems, Forchheim, Germany), SOMATOM Definition Flash (Siemens Medical Systems, Forchheim, Germany), and Ingenuity CT (Philips Healthcare, Cleveland, OH, USA). An AAPM Model 76-410 CT Performance Phantom (Fluke Corporation, Everett, WA, USA) was used for image acquisition, as depicted in Figure 1.
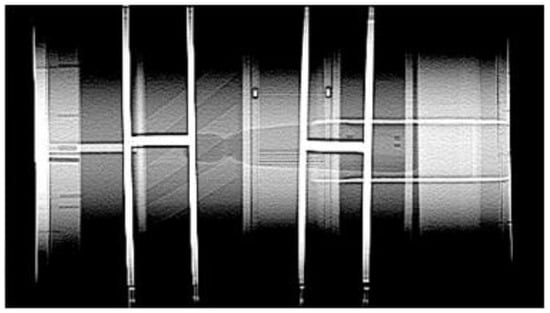
Figure 1.
AAPM Model 76-410 CT Performance Phantom image.
The imaging conditions were standardized to 120 kVp, 250 mAs, with a beam width of 10 mm. The exposure field was set to over 25 cm, with a pre-exposure field of 25 cm. Standard reconstruction algorithms were applied accordingly, as illustrated in Figure 2 [13].
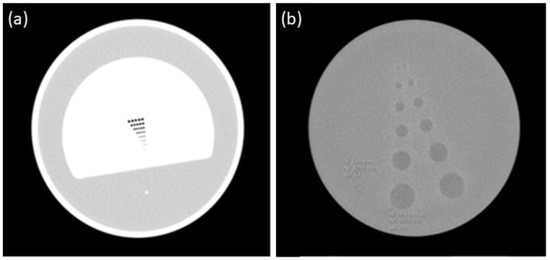
Figure 2.
(a) Spatial resolution area; (b) contrast resolution area.
All images submitted for medical image evaluations had undergone assessment by clinical experts at the respective institutions. The images comprised those from CT equipment that successfully passed QC and those from equipment that failed QC and required repair or disposal. Given the relatively small number of images from failed equipment compared to those from passed equipment, a larger proportion of images were obtained from the latter category. Furthermore, while there was an initial intent to incorporate images deemed as passed by clinical experts but failed by medical image evaluation institutions, there was alignment between the assessments of the experts and the institutions, precluding the acquisition of separate datasets for such instances.
2.2. CT Phantom Image Augmentation
CT phantom images judged to be unqualified were deemed insufficient and promptly excluded from use. Any unqualified CT scans were immediately repaired, and the corresponding images were deleted. These factors constituted the primary limitations of CT QC research. Acquiring datasets was challenging, as there were no existing open-source datasets available, and obtaining data from hospitals was limited due to the aforementioned reasons. Furthermore, valuable data consisted of accumulated data over an extended period, resulting in a scarcity of data after conducting data cleaning to exclude irrelevant data. Thus, we have to augment the datasets for the improvement and reliability of artificial intelligence.
We utilized various image-processing techniques to obtain images expected to appear in CT because AI augmentation methods created images that were not realistically generated using CT. Also, AI-augmented images relied on numerous random elements, resulting in an extremely low probability of being realistically produced. Furthermore, artificially augmented images were inherently uncontrollable. Incorporating these images into training would likely diminish the reliability of the results. The assessment of dataset qualification and disqualification relied on traditional qualitative assessment methods to ensure meaningful learning. Additionally, when there was a significant disparity in the ratio of qualified and unqualified data within the dataset, there was a higher likelihood of bias occurring in the data learning process. Therefore, when augmenting the data, we aimed to evenly select qualified and unqualified data to maintain balance, adjusting them to a 1:1 ratio.
2.2.1. Spatial Resolution Image Augmentation
For spatial resolution, inspired by the need to evaluate the ability of equipment to distinguish small objects at spatial resolution, we initially implemented erosion and dilation techniques. An example of this implementation is illustrated in Figure 3. However, irrespective of the parameter adjustments, the resultant images did not reflect abnormalities in the CT equipment, i.e., they were not clinically obtainable. Subsequently, given the inability to discern the shape of the circle even in the presence of noise, we resorted to noise addition techniques.
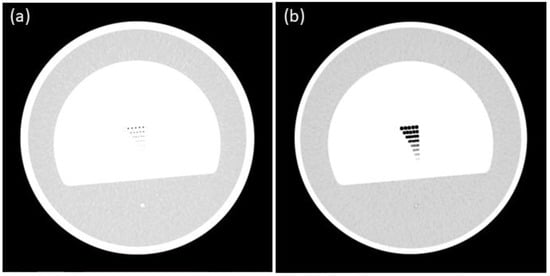
Figure 3.
Spatial resolution erosion (a) techniques; spatial resolution dilation (b) techniques.
Images processed with Gaussian filtering and dynamic histogram equalization were obtained for clinical phantom image tests, serving as benchmark values for pass and fail criteria. Regarding Gaussian filtering, a pixel size set above 1.01 was deemed indistinguishable by experts. Thus, Gaussian filtering was applied with pixel sizes of 1.5, 1.7, and 2.0 to generate failing images, as depicted in Figure 3. In the case of dynamic histogram equalization, images were considered failing if the alpha value, representing the sub-histogram emphasis, was set below −0.5. Accordingly, values of −0.5, −0.7, and −1.0 were applied during dynamic histogram equalization to obtain the failing images in Figure 4.
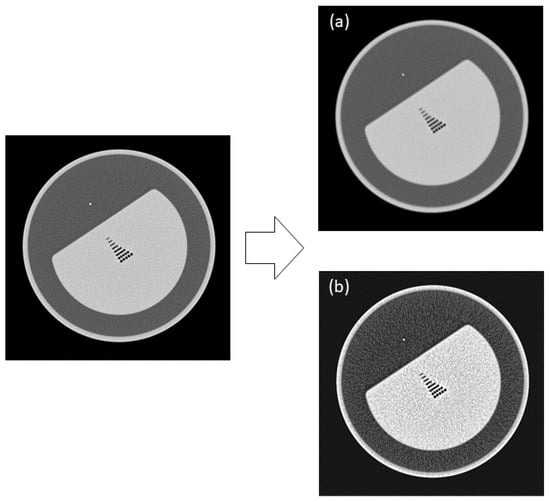
Figure 4.
Augmented spatial images with Gaussian filtering (a) and dynamic histogram equalization (b).
2.2.2. Contrast Resolution Image Augmentation
For contrast resolution, images illustrating the primary causes of failure, specifically the inability to discern the fourth and fifth circles, were obtained through image editing using the Clone Stamp tool in Photoshop, as depicted in Figure 5. The images were segregated into those from equipment that passed and failed the tests to train the object detection network. Separate labeling was performed by specifically annotating the objects in the images for the object detection network training. In spatial resolution, only the regions utilized for determining pass or fail were annotated across the entire image dataset. For contrast resolution, all circles up to the fifth one were annotated.
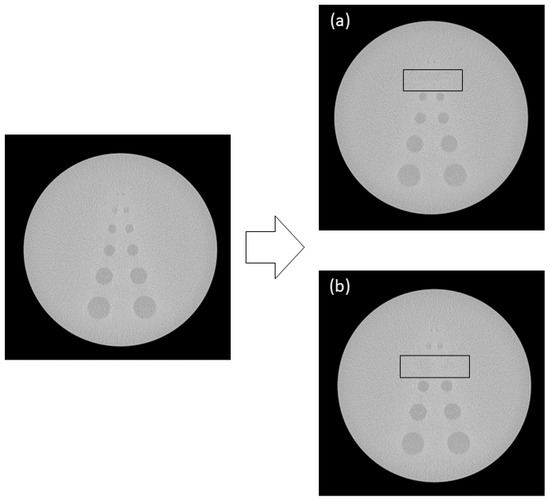
Figure 5.
Augmented contrast images with the 5th (a) and 4th circles (b) erased by image processing.
2.2.3. Dataset
The qualitative evaluation of the spatial and contrast resolution of the images was conducted by one quality control expert from Hospital A, two radiologists from Hospital S, four radiographers with over five years of experience, and a professor of radiology. Table 1 represents the number of image datasets that were deemed clinically impossible to acquire or generated conflicting opinions regarding pass or non-pass criteria and were thus excluded. The training, validation, and test datasets for learning were allocated in a ratio of 6:2:2.

Table 1.
Dataset.
2.3. AI Network
As AI progresses, it increasingly supplants human judgment in various domains. Within computer vision, AI encompasses tasks such as classification, segmentation, and object detection [14]. Classification involves categorizing images based on information from the entire image area [14]. This is particularly useful for classifying images containing features that span the entire image, such as dogs or cats. Segmentation entails accurately dividing areas within an image [15], while object detection identifies specific objects within an image and determines their identity [16,17]. In this study, where specific areas of the image are crucial, it is anticipated that using a classification network would result in lower accuracy. The focus is on determining whether the overall image, including a specific area, passes or fails, rather than extracting the area itself. The overall shape of a circle and its adherence to criteria are deemed more critical than merely capturing the information on the circle’s outline; thus, segmentation is not employed. Therefore, among these three networks, we choose the object detection network for CT QC.
2.3.1. Base Network: YOLOv8
The architecture of the YOLOv8 network is depicted in Figure 6 [18]. Representing the latest advancement in the YOLO network series, YOLOv8 introduces modifications to its detail layer, transitioning from C3 to C2f. This alteration adjusts the convolution size and reduces the number of steps, thereby enhancing speed without compromising accuracy, as validated through experimental verification. Furthermore, YOLOv8 implements anchor-free detection, enabling rapid execution of non-maximum suppression by minimizing the number of bounding box trainings and retaining only the most probable locations. Additionally, it incorporates the closing technique to the mosaic augmentation method of YOLOv5, mitigating performance degradation resulting from extensive augmentation. Recognized for its high accuracy in the state-of-the-art (SOTA) domain of machine learning, YOLOv8 is user-friendly, even for non-experts, owing to its integrated libraries for implementation. This aspect is taken into consideration by medical imaging experts when configuring a network for additional experiments. Also, there have been studies incorporating attention blocks into YOLOv8 to enhance accuracy without significantly increasing the model size. Additionally, studies such as Pediatric Wrist Fracture Detection have demonstrated performance improvements by adding attention blocks to YOLOv8-AM [19]. Based on these findings, we hypothesized that integrating attention blocks into YOLOv8 could enhance performance, thus selecting YOLOv8 as the base network for our study.
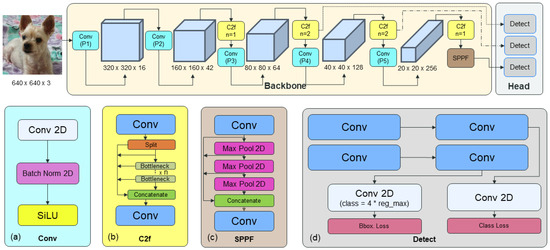
Figure 6.
YOLOv8 network: (a) convolution block; (b) C2f block; (c) Spatial Pyramid Pooling Fast (SPFF) block; (d) detect block.
2.3.2. Proposed Network: CTA-YOLOv8
The proposed CTA-YOLOv8 network architecture is illustrated in Figure 7. Each network underwent five training iterations using the parameters that yielded the highest accuracy. Specifically, the batch size, epochs, learning rate, and weight decay were set to 32, 300, 0.001, and 0.005. Training was halted prematurely if there was no improvement in performance over 10 epochs based on the validation data. Additionally, a hyperparameter evolution technique was employed during each training session to optimize the remaining hyperparameters.
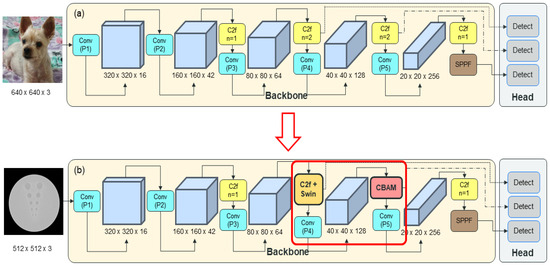
Figure 7.
(a) YOLOv8; (b) CT Attention-YOLOv8 (CTA-YOLOv8).
We designed our CTA-YOLOv8 by integrating an attention block, comprising the CBAM and the Swin Transformer block. CBAM was recognized for its efficacy in enhancing the accuracy of object detection networks and is commonly utilized in YOLOv8 object detection networks. The structure of CBAM is illustrated in Figure 8 [20]. In YOLOv8, The CBAM was integrated into the network by utilizing code already embedded within the YOLOv8 network and was embedded to replace the C2F position. In this study, we prioritized resource efficiency given the challenges associated with acquiring workstations with substantial resources for clinical use. This consideration is in line with our primary goal of clinical application. Thus, we aim to minimize resource overhead by applying the CBAM module while maintaining the basic structure of YOLOv8, specifically the C2f layer. Additionally, we sought to identify the optimal position for the CBAM module that aligns with our dataset. The ideal position for the CBAM was found to be at the end C2f part of the backbone.

Figure 8.
CBAM block.
The Swin Transformer block is known to effectively enhance the accuracy of object detection networks and is commonly used in YOLOv8 object detection networks [21]. The structure is shown in Figure 9.
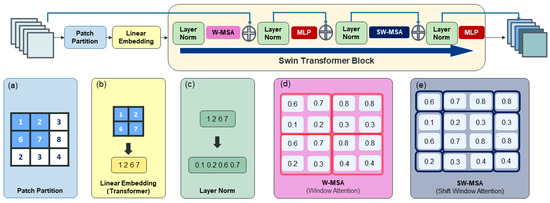
Figure 9.
Swin Transformer: (a) patch partition; (b) linear embedding; (c) layer normalization; (d) Window Multi-head Self-Attention (W-MSA); (e) Shift Window Multi-head Self-Attention (SW-MSA).
Especially in the context of YOLOv8, which was based on CNN for object detection, the integration of a transformer-based attention block like the Swin Transformer block was anticipated to enhance accuracy by leveraging global information. This was particularly pertinent in CT data analysis, where the clear differentiation of objects from their surroundings was crucial for medical image interpretation.
Hence, QC evaluations also emphasized this aspect, recognizing the significance of the relationship between objects and their surroundings. To implement the Swin Transformer block into YOLOv8, we performed the development of a novel module through specialized structural adjustments. Accordingly, we devised the Swin Transformer block like Figure 10 to substitute the circuitry structure of the bottleneck in C2f. Instead of introducing an additional feature extraction process, we replaced the position of the C2f module with the attention block to enhance network performance without compromising computational efficiency. The ideal positioning of attention blocks was determined during training to maximize accuracy. The most effective location was identified as the first C2f position, where initial feature extraction occurs, with a patch size of 6.
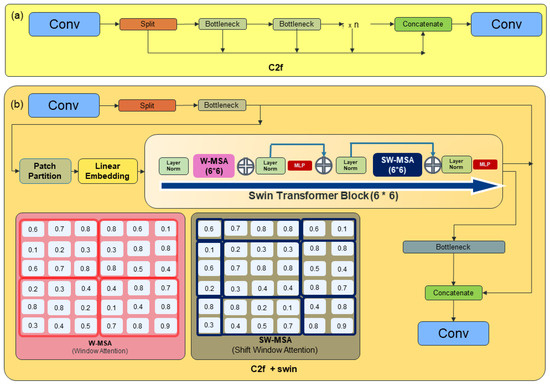
Figure 10.
(a) YOLOv8 C2f structure; (b) the new C2f + Swin Transformer block structure.
In this study, we took a distinctive approach to accommodate the involvement of clinical experts by restructuring the C2f architecture and fine-tuning pixel sizes, instead of integrating the Swin Transformer attention block. This choice was made to enhance both efficiency and accuracy without expanding the model’s capacity, considering the limited availability of high-capacity workstations in clinical environments.
2.4. Phantom Images for Evaluation Criteria
For spatial resolution, the CTA YOLOv8 results are shown Figure 11. The mean average precision (mAP) was used as the performance metric to assess object detection accuracy, as the task was to detect each object as either a pass or non-pass.
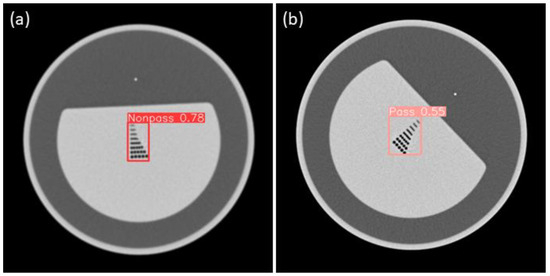
Figure 11.
(a) Sample nonpass images of CTA-YOLOv8 applied for spatial resolution; (b) Sample pass images of CTA-YOLOv8 applied for spatial resolution.
First, to calculate AP, we calculate the number of true positives (TP), false positives (FP), and false negatives (FN). TP is depicting representing the number of positive objects predicted to be positive objects. FP indicates the number of negative objects that are predicted as positive objects. FN represents the number of positive objects that are predicted to be negative objects.
Second, we calculate precision and recall. Recall is the probability value of how true a judgment or prediction is among those that are true. The denominator is the total number of things that are true, and the numerator is the value that was actually predicted to be true. The formula is calculated as follows:
Precision is the probability value that the judgment or prediction is actually true. The denominator is the total number of true predictions, and the numerator is the value that was actually predicted to be true. The formula is calculated as follows:
Finally, we create PR curves that are graphs of the relationship between precision and recall. The graph calculates the precision values of the thresholds for each confidence value when recall is increased by 0.1. Confidence is a score that indicates how reliable the detection is. And if there are multiple objects, mAP, which is the average value for each item of AP, is used. The formula is calculated as follows:
Because the presence or absence of detection was more important than the exact location accuracy in the test images, the Intersection over Union (IoU) threshold was set to 50% instead of the typical threshold of 95%. The formula is calculated as follows:
Further, a confidence threshold of 50% was used considering the importance of accurately detecting objects over the general object detection confidence.
For contrast resolution, the CTA YOLO results are shown in Figure 12. The circles are the objects for detection. The object detection process for the images was conducted in a manner similar to that for the spatial resolution. Phantom evaluation criteria were subsequently applied to the detected images. If any of the circles up to the fifth circle was detected, it was considered a pass. Custom Contrast Resolution Accuracy (CCRA) is expressed as the number of images correctly identified as pass or fail among the images obtained through object detection images (TODI) across the number of total test images. The formula is calculated as follows:
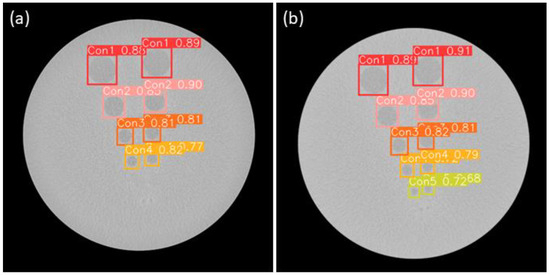
Figure 12.
(a) Sample nonpass images of CTA-YOLOv8 applied for contrast resolution; (b) Sample pass images of CTA-YOLOv8 applied for contrast resolution.
3. Results
The results for the spatial and contrast resolution of images are shown in Table 2 and Table 3. For the test, images were meticulously selected at random from a pool of original, unaugmented images. This process was conducted in advance to ensure the integrity of the testing procedure. The spatial resolution performance of the proposed CTA-YOLOv8 network was the highest at 92.03%. The contrast resolution performance of the CTA-YOLOv8 proposed in this study was the highest at 97.56%. For both the spatial and contrast resolution areas, the CTA-YOLOv8 network proposed in this study exhibited the highest accuracy.

Table 2.
Spatial resolution results.

Table 3.
Contrast resolution results.
4. Discussion
CT has been a commonly used technique since the early days of medical examination. Because of their long-term use, older CT machines are in a state of serious deterioration. Nevertheless, if CTs are verified, aged equipment can continue to be used. However, testing with unverified equipment can lead to low-quality images, causing difficulties in the diagnosis of disease. This not only results in patients being exposed to increased doses of radiation but also leads to higher medical costs, thereby degrading the overall quality of medical services.
To circumvent these issues, all medical equipment is subjected to regular quality checks to assess its condition [22]. In particular, for medical imaging equipment, standard phantoms are used for objective performance evaluation, and hence, most criteria have been quantified to facilitate objective assessment. However, the spatial and contrast resolution aspects of the phantom image tests are qualitative in nature and depend on human visual identification. Therefore, we aimed to apply artificial intelligence to evaluate CT phantom images.
First, CT phantom images were acquired from various hospitals and machines. However, these images had limitations. Initial classification network training using available data achieved over 95% accuracy, indicating the feasibility of applying AI. However, the recall rate was excessively high during training, which was attributed to overfitting as a result of the data imbalance between the pass and non-pass images. To overcome this, non-pass images were created by consulting radiologists, radiology professors, practicing radiographers, and equipment accuracy control experts to establish the criteria for failing images. After applying various image-processing techniques, images that were deemed impossible to acquire clinically and those with conflicting opinions on pass/non-pass were removed.
For the spatial resolution of images, Laplacian filters and dynamic histogram processing were adjusted to create passing images for different equipment. For the contrast resolution of images, failing images were created using image editing software based on the primary reasons for non-pass, including the inability to identify the fourth and fifth circles. Although this process reduced the total amount of data, it balanced the number of passing and failing data points for the re-experimentation.
Assuming that the application of object area networks can enhance performance, we re-conducted labeling and training based on the YOLOv8 network, which is a commonly used object area network model. However, the accuracy was too low to replace qualitative evaluation. Therefore, two suitable attention blocks were selected. The internal C2f algorithms within the YOLOv8 network were modified for the application of these blocks. The accuracy was evaluated by changing the position of each block. Placing the CBAM block at the bottom of the backbone and the Swin block at the beginning yielded the best detection results. We believe that positioning the Swin block at the beginning of C2f emphasizes the features of small objects and that the CBAM structure, located at the end, effectively emphasizes the final extracted features.
The proposed CTA-YOLOv8 network could be used as a basis for standardizing CT phantom image tests, which would quantify the objective performance of equipment, making it clinically valuable. Additionally, it could serve as evidence for assessing the performance of quantitative evaluation methods using AI for other medical equipment such as MRI or mammography devices, which also use phantoms for qualitative evaluation [23,24].
In further research, more passing images are needed, and the one-class network can be applied as a new research direction. Moreover, we plan to develop a system to proactively establish standards for image acquisition in this area and to conduct follow-up research using additional data. After IRB review, further follow-up research will be conducted in the clinical image evaluation area of CT quality control, utilizing the proposed network and results obtained in this study.
5. Conclusions
The CTA-YOLOv8 network proposed in this study provides an accurate qualitative evaluation of spatial and contrast resolution in CT quality control phantoms, which aligns significantly with qualitative assessments. The spatial and contrast resolutions were 92.03% and 97.56%, respectively. Applying the CTA-YOLOv8 network to the qualitative evaluation of phantom images in CT quality control enables quantitative assessment.
Author Contributions
Conceptualization, H.H. and H.K.; resources, H.K.; validation, D.K., data curation, D.K.; writing—original draft preparation, H.H.; writing—review and editing, H.K. All authors have read and agreed to the published version of the manuscript.
Funding
This research received no external funding.
Institutional Review Board Statement
Not applicable.
Informed Consent Statement
Not applicable.
Data Availability Statement
The dataset used in this study is subject to intellectual property rights. It will be made available by the authors on request.
Conflicts of Interest
The authors declare no conflicts of interest.
References
- Kalra, M.K.; Maher, M.M.; Toth, T.L.; Hamberg, L.M.; Blake, M.A.; Shepard, J.-A.; Saini, S. Strategies for CT radiation dose optimization. Radiology 2004, 230, 619–628. [Google Scholar] [CrossRef]
- Brenner, D.J.; Hall, E.J. Computed tomography—An increasing source of radiation exposure. N. Engl. J. Med. 2007, 357, 2277–2284. [Google Scholar] [CrossRef]
- Lee, K.B.; Nam, K.C.; Jang, J.S.; Kim, H.C. Feasibility of the quantitative assessment method for CT quality control in phantom image evaluation. Appl. Sci. 2021, 11, 3570. [Google Scholar] [CrossRef]
- McMullan, E.; Chrisman, J.J.; Vesper, K. Some problems in using subjective measures of effectiveness to evaluate entrepreneurial assistance programs. Entrep. Theory Pract. 2001, 26, 37–54. [Google Scholar] [CrossRef]
- Rong, X.J.; Shaw, C.C.; Liu, X.; Lemacks, M.R.; Thompson, S.K. Comparison of an amorphous silicon/cesium iodide flat-panel digital chest radiography system with screen/film and computed radiography systems—A contrast-detail phantom study. Med. Phys. 2001, 28, 2328–2335. [Google Scholar] [CrossRef] [PubMed]
- Kwan, A.L.; Filipow, L.J.; Le, L.H. Automatic quantitative low contrast analysis of digital chest phantom radiographs. Med. Phys. 2003, 30, 312–320. [Google Scholar] [CrossRef]
- Kim, Y.-S.; Ye, S.-Y.; Kim, D.-H. When Evaluated Using CT Imaging Phantoms AAPM Phantom Studies on the Quantitative Analysis Method. J. Korea Contents Assoc. 2016, 16, 592–600. [Google Scholar] [CrossRef][Green Version]
- Noh, S.S.; Um, H.S.; Kim, H.C. Development of Automatized Quantitative Analysis Method in CT Images Evaluation using AAPM Phantom. J. Inst. Electron. Inf. Eng. 2014, 51, 163–173. [Google Scholar] [CrossRef]
- Tang, X. The role of artificial intelligence in medical imaging research. BJR|Open 2019, 2, 20190031. [Google Scholar] [CrossRef] [PubMed]
- Ranschaert, E.R.; Morozov, S.; Algra, P.R. Artificial Intelligence in Medical Imaging: Opportunities, Applications and Risks; Springer: Berlin/Heidelberg, Germany, 2019. [Google Scholar]
- Suzuki, K. Overview of deep learning in medical imaging. Radiol. Phys. Technol. 2017, 10, 257–273. [Google Scholar] [CrossRef] [PubMed]
- Klang, E. Deep learning and medical imaging. J. Thorac. Dis. 2018, 10, 1325. [Google Scholar] [CrossRef]
- Jang, K.-J.; Kweon, D.-C. Case study of quality assurance for MDCT image quality evaluation using AAPM CT performance phantom. J. Korea Contents Assoc. 2007, 7, 114–123. [Google Scholar] [CrossRef]
- Rawat, W.; Wang, Z. Deep convolutional neural networks for image classification: A comprehensive review. Neural Comput. 2017, 29, 2352–2449. [Google Scholar] [CrossRef]
- Minaee, S.; Boykov, Y.; Porikli, F.; Plaza, A.; Kehtarnavaz, N.; Terzopoulos, D. Image segmentation using deep learning: A survey. IEEE Trans. Pattern Anal. Mach. Intell. 2021, 44, 3523–3542. [Google Scholar] [CrossRef] [PubMed]
- Zhao, Z.-Q.; Zheng, P.; Xu, S.-t.; Wu, X. Object detection with deep learning: A review. IEEE Trans. Neural Netw. Learn. Syst. 2019, 30, 3212–3232. [Google Scholar] [CrossRef]
- Wu, X.; Sahoo, D.; Hoi, S.C. Recent advances in deep learning for object detection. Neurocomputing 2020, 396, 39–64. [Google Scholar] [CrossRef]
- Talaat, F.M.; ZainEldin, H. An improved fire detection approach based on YOLO-v8 for smart cities. Neural Comput. Appl. 2023, 35, 20939–20954. [Google Scholar] [CrossRef]
- Chien, C.-T.; Ju, R.-Y.; Chou, K.-Y.; Lin, C.-S.; Chiang, J.-S. YOLOv8-AM: YOLOv8 with Attention Mechanisms for Pediatric Wrist Fracture Detection. arXiv Preprint 2024, arXiv:2402.09329. [Google Scholar]
- Woo, S.; Park, J.; Lee, J.-Y.; Kweon, I.S. Cbam: Convolutional block attention module. In Proceedings of the European Conference on Computer Vision (ECCV), Munich, Germany, 8–14 September 2018; pp. 3–19. [Google Scholar]
- Liu, Z.; Lin, Y.; Cao, Y.; Hu, H.; Wei, Y.; Zhang, Z.; Lin, S.; Guo, B. Swin transformer: Hierarchical vision transformer using shifted windows. In Proceedings of the IEEE/CVF International Conference on Computer Vision, Montreal, BC, Canada, 11–17 October 2021; pp. 10012–10022. [Google Scholar]
- Bahreini, R.; Doshmangir, L.; Imani, A. Affecting Medical Equipment Maintenance Management: A Systematic Review. J. Clin. Diagn. Res. 2018, 12, IC01–IC07. [Google Scholar] [CrossRef]
- Ihalainen, T.M.; Lönnroth, N.T.; Peltonen, J.I.; Uusi-Simola, J.K.; Timonen, M.H.; Kuusela, L.J.; Savolainen, S.E.; Sipilä, O.E. MRI quality assurance using the ACR phantom in a multi-unit imaging center. Acta Oncol. 2011, 50, 966–972. [Google Scholar] [CrossRef]
- Huda, W.; Sajewicz, A.M.; Ogden, K.M.; Scalzetti, E.M.; Dance, D.R. How good is the ACR accreditation phantom for assessing image quality in digital mammography? Acad. Radiol. 2002, 9, 764–772. [Google Scholar] [CrossRef] [PubMed]
Disclaimer/Publisher’s Note: The statements, opinions and data contained in all publications are solely those of the individual author(s) and contributor(s) and not of MDPI and/or the editor(s). MDPI and/or the editor(s) disclaim responsibility for any injury to people or property resulting from any ideas, methods, instructions or products referred to in the content. |
© 2024 by the authors. Licensee MDPI, Basel, Switzerland. This article is an open access article distributed under the terms and conditions of the Creative Commons Attribution (CC BY) license (https://creativecommons.org/licenses/by/4.0/).