Article

Acoustic Requalification of an Urban Evolving Site and Design of a Noise Barrier: A Case Study at the Bologna Engineering School

Department of Industrial Engineering, University of Bologna, Viale Risorgimento 2, 40136 Bologna, Italy
*
Author to whom correspondence should be addressed.
Appl. Sci. 2024, 14(5), 1837; https://doi.org/10.3390/app14051837
Submission received: 22 December 2023 / Revised: 21 February 2024 / Accepted: 21 February 2024 / Published: 23 February 2024
(This article belongs to the Special Issue Measurement, Simulation and Design of Sound in Urban Spaces)

Abstract

:
The increase in new infrastructure development has raised closer attention to the environmental noise of new expansion areas. This study investigates the urban evolution of Terracini Street’s surrounding area in the Navile district, Bologna, Italy. In the last 20 years, this area has undergone various transformations, from a suburban industrial area to a new university and residential one. First, the morphologic and infrastructural characteristics of the site are established. Then, the existing regulations (acoustic, urban, and infrastructural regulations, whether local or national) are evaluated. Next, the results of environmental noise measurements are presented. Since a heavily trafficked infrastructure is very close to the occupied public area, noise limits are severely exceeded. A noise mitigation design stage follows, focusing on a novel noise barrier design. Specifically, particular attention is paid to the visual and ecological impact of the noise barrier on the area’s landscape, which must be representative of the new location of the School of Engineering. The sonic crystal technique is exploited to implement an effective noise barrier (average insertion loss of 10 dB(A) in the 200 Hz–1 kHz range), allowing air ventilation and visual transparency. This case study could further evolve using other acoustic metamaterial techniques or in different application sites.

1. Introduction

Over the past decades, the rise in the development of new infrastructures has led to an increased concern regarding environmental noise in expanding urban areas [1]. This matter has been investigated using various methodologies across multiple scientific disciplines, including urban engineering, environmental engineering, acoustics, soundscape, landscape architecture, economics, sociology, ecology, and anthropology [2,3,4]. Many of these approaches start by analysing the historical context and the physical and structural characteristics of the area under study. Furthermore, most of these methods incorporate regulatory aspects into evaluating the expanding site, encompassing acoustic, urban, and infrastructural regulations at the local, national, or international levels [5,6]. These studies often comprise a design phase implying the local community’s and stakeholders’ active involvement [5,7]. Participatory tools such as focus groups, questionnaires, and sound walks facilitate this engagement [8,9]. After gathering the environmental condition evolution and the evolving area’s public opinion, several noise-reducing measures can be exploited to solve targeted environmental acoustic problems, like low-noise road pavements, noise barriers, regulatory car speed reduction, and viability modification [3,10,11,12,13,14,15]. Moreover, targeted solutions (like sound-proofing windows or louvres) can be developed for buildings where acoustic comfort is critical for indoor activities, such as schools, hospitals, or offices [16].
Specifically, noise barriers can be helpful when the infrastructure is very close to the occupied public area [10]. They are one of the most effective means of noise reduction and, in fact, are frequently used for road traffic and train noise. Noise barriers can be made of sustainable materials [17] and characterised in situ [18]. Moreover, nowadays, there are new assessment methods to validate innovative noise barrier solutions [18,19]. However, noise barriers can be visually impacting and ecologically disruptive, so new design concepts should be outlined using, for example, metamaterials [3]. Metamaterials are a versatile solution to acoustic and multidomain problems. They can be tuned to several frequency ranges for sound absorption and insulation, and in some contexts, they can simultaneously allow air passage and noise attenuation [3,4].
This study aims to (i) assess the environmental acoustic conditions of Terracini Street due to the increasing traffic within a multipurpose area and (ii) define an innovative solution for screening the university campus area, which is particularly sensitive to noise pollution. Therefore, first, Terracini Street’s urban evolution within the Navile district was investigated by considering the morphological characteristics, urban function, and noise limits. Secondly, environmental acoustic measurements were performed to assess the actual condition of the area under investigation, and it was found that the noise limits were exceeded. Finally, sonic crystal noise barriers were designed to screen the public university area from traffic noise while trying not to significantly modify the pedestrian viability, architectural barriers to road traffic, and emergency exits. Since the site has a social meaning for the students, particular attention was paid to the visual and ecological impacts of the noise barrier. The sonic crystal technique was exploited for an effective noise barrier on a broad frequency range, simultaneously allowing air ventilation and visual transparency. This case study could further evolve using other acoustic metamaterial techniques or in different application sites.

2. Methods

2.1. Urban Development of the Navile District

The Navile district is located on the outskirts of the city of Bologna. It is an example of a broader number of areas that have undergone various transformations in the last twenty years, from a suburban industrial and agricultural area to a new university and residential one. Due to increased economic activity and population, many suburban areas, such as the Navile District, have been transformed and expanded, changing their functions and implementing new or renewed infrastructures. As depicted in Figure 1, the infrastructure enhancement combined with fast gentrification is causing an increase in noise pollution levels, mainly due to traffic noise. The impact is evident in the acoustic environment in the Navile District, including the buildings of the School of Engineering of the University of Bologna on Terracini Street. This is a busy road near the university campus buildings (10 to 20 m of distance among them), with many vehicles circulating daily (on average, 38,000 vehicles/day). Consequently, an exceedance of the noise limits, both outdoors and indoors, is expected in the university centre, affecting the working and studying conditions of researchers and students. This present work is focused on quantifying the sound level exceedance above the noise limits and designing a noise mitigation measure to lower the noise impact on the university premises, taking into account the visual appearance of the proposed noise barrier.

2.2. Noise Regulation Regarding the Studied Area

The Italian environmental noise assessment and control regulation system has been reviewed significantly since 1995. The urban developing area conditions and the new multifunctionality of the central and suburban areas lead to the institution of a new law on noise pollution, n. 447 of 26 October 1995 [20]. This new noise policy (consisting of 17 articles) defined the responsibilities of governmental institutions that perform regulatory actions, planning and control, and public and/or private entities that may directly or indirectly cause noise pollution. Most importantly, this law introduced the professional figure of a competent technician for assessing the environmental noise conditions and led to a further number of implementing decrees in the proceeding years. In fact, the implementing decrees and regional laws are the instruments completing the application of this framework law. Among them, it is important to cite the Decree of the President of the Council of Ministers (D.P.C.M.) on 14 November 1997 (the determination of the limit values of the noise sources according to different urban areas), the Ministry of Environment Decree (D.M.) of 18 November 1998, n. 459 (regulations for the implementation of Article 11 of Law 26 October 1995, n. 447, regarding noise pollution due to rail traffic), the D.M. of 29 November 2000 (the criteria for the preparation by companies and bodies managing public transport services or related infrastructures of noise containment and abatement intervention plans), the Presidential Decree of 30 March 2004, n. 142 (provisions for prevention of noise pollution caused by road traffic), and the Legislative Decree of 19 August 2005, n. 194 (the implementation of Directive 2002/49/EC, relating to the assessment and management of environmental noise). Table 1 shows the most relevant ones to this study.
The acoustic descriptor used in Italian regulations [21], and consequently taken as a reference in this study, is the equivalent sound pressure level (LAeq), which is the constant sound pressure level containing the same energy as the variable noise signal produced in the same time interval by the source under consideration. LAeq is expressed in dB(A), i.e., applying the A-weighting. Over the years, the Navile district has significantly expanded with new buildings, new infrastructure, and the growth of existing activities. This has contributed to a substantial increase in road traffic, especially on Terracini Street, one of the busiest streets in the area [22]. An essential factor to be considered in this analysis is the locations of classrooms, laboratories, and offices of the “Alma Mater Studiorum—University of Bologna”, which mostly overlook Terracini Street and whose activities are disturbed by the high and continuous noise produced by road traffic. According to the acoustic zoning of Bologna, the site falls into class III according to the national decree [21] and the municipal classification [22] (see Table 2).
Class III includes mixed-use areas and determines, for the Italian law, an LAeq threshold of 60 dB(A) during the “day” time (6:00–22:00) and 50 dB(A) during the “night” time (22:00–6:00). The acoustic classification from the city council, following the national decree [21], specifies for the university areas (literal translation) the following [22]:
For buildings intended for university use, in consideration of the specific nature of university activities and facilities, the simultaneous presence of school functions and related service activities, as well as the induced activity and the significant presence of technological installations, while in continuity with the previous acoustic classifications, the absolute limits of Class III must be respected, relatively to the period in which the effective use of the building occurs, considering all the sound sources present and therefore including the infrastructural ones. Thus, the limits specific to the relevance strips of the infrastructures should not be considered.
Compliance with the Class III immission values, as specified above, must be verified in the building facades and the usable external appurtenances if equipped for the permanence of persons.
According to Italian legislation, the “relevance strips” are portions of territory adjacent on both sides to the road infrastructure and 500 m wide; within these strips, specific limit values for road traffic generally apply regardless of the limit values of the acoustic class of the territory crossed by the infrastructure. However, for educational buildings, the relevance strips shall not be considered.

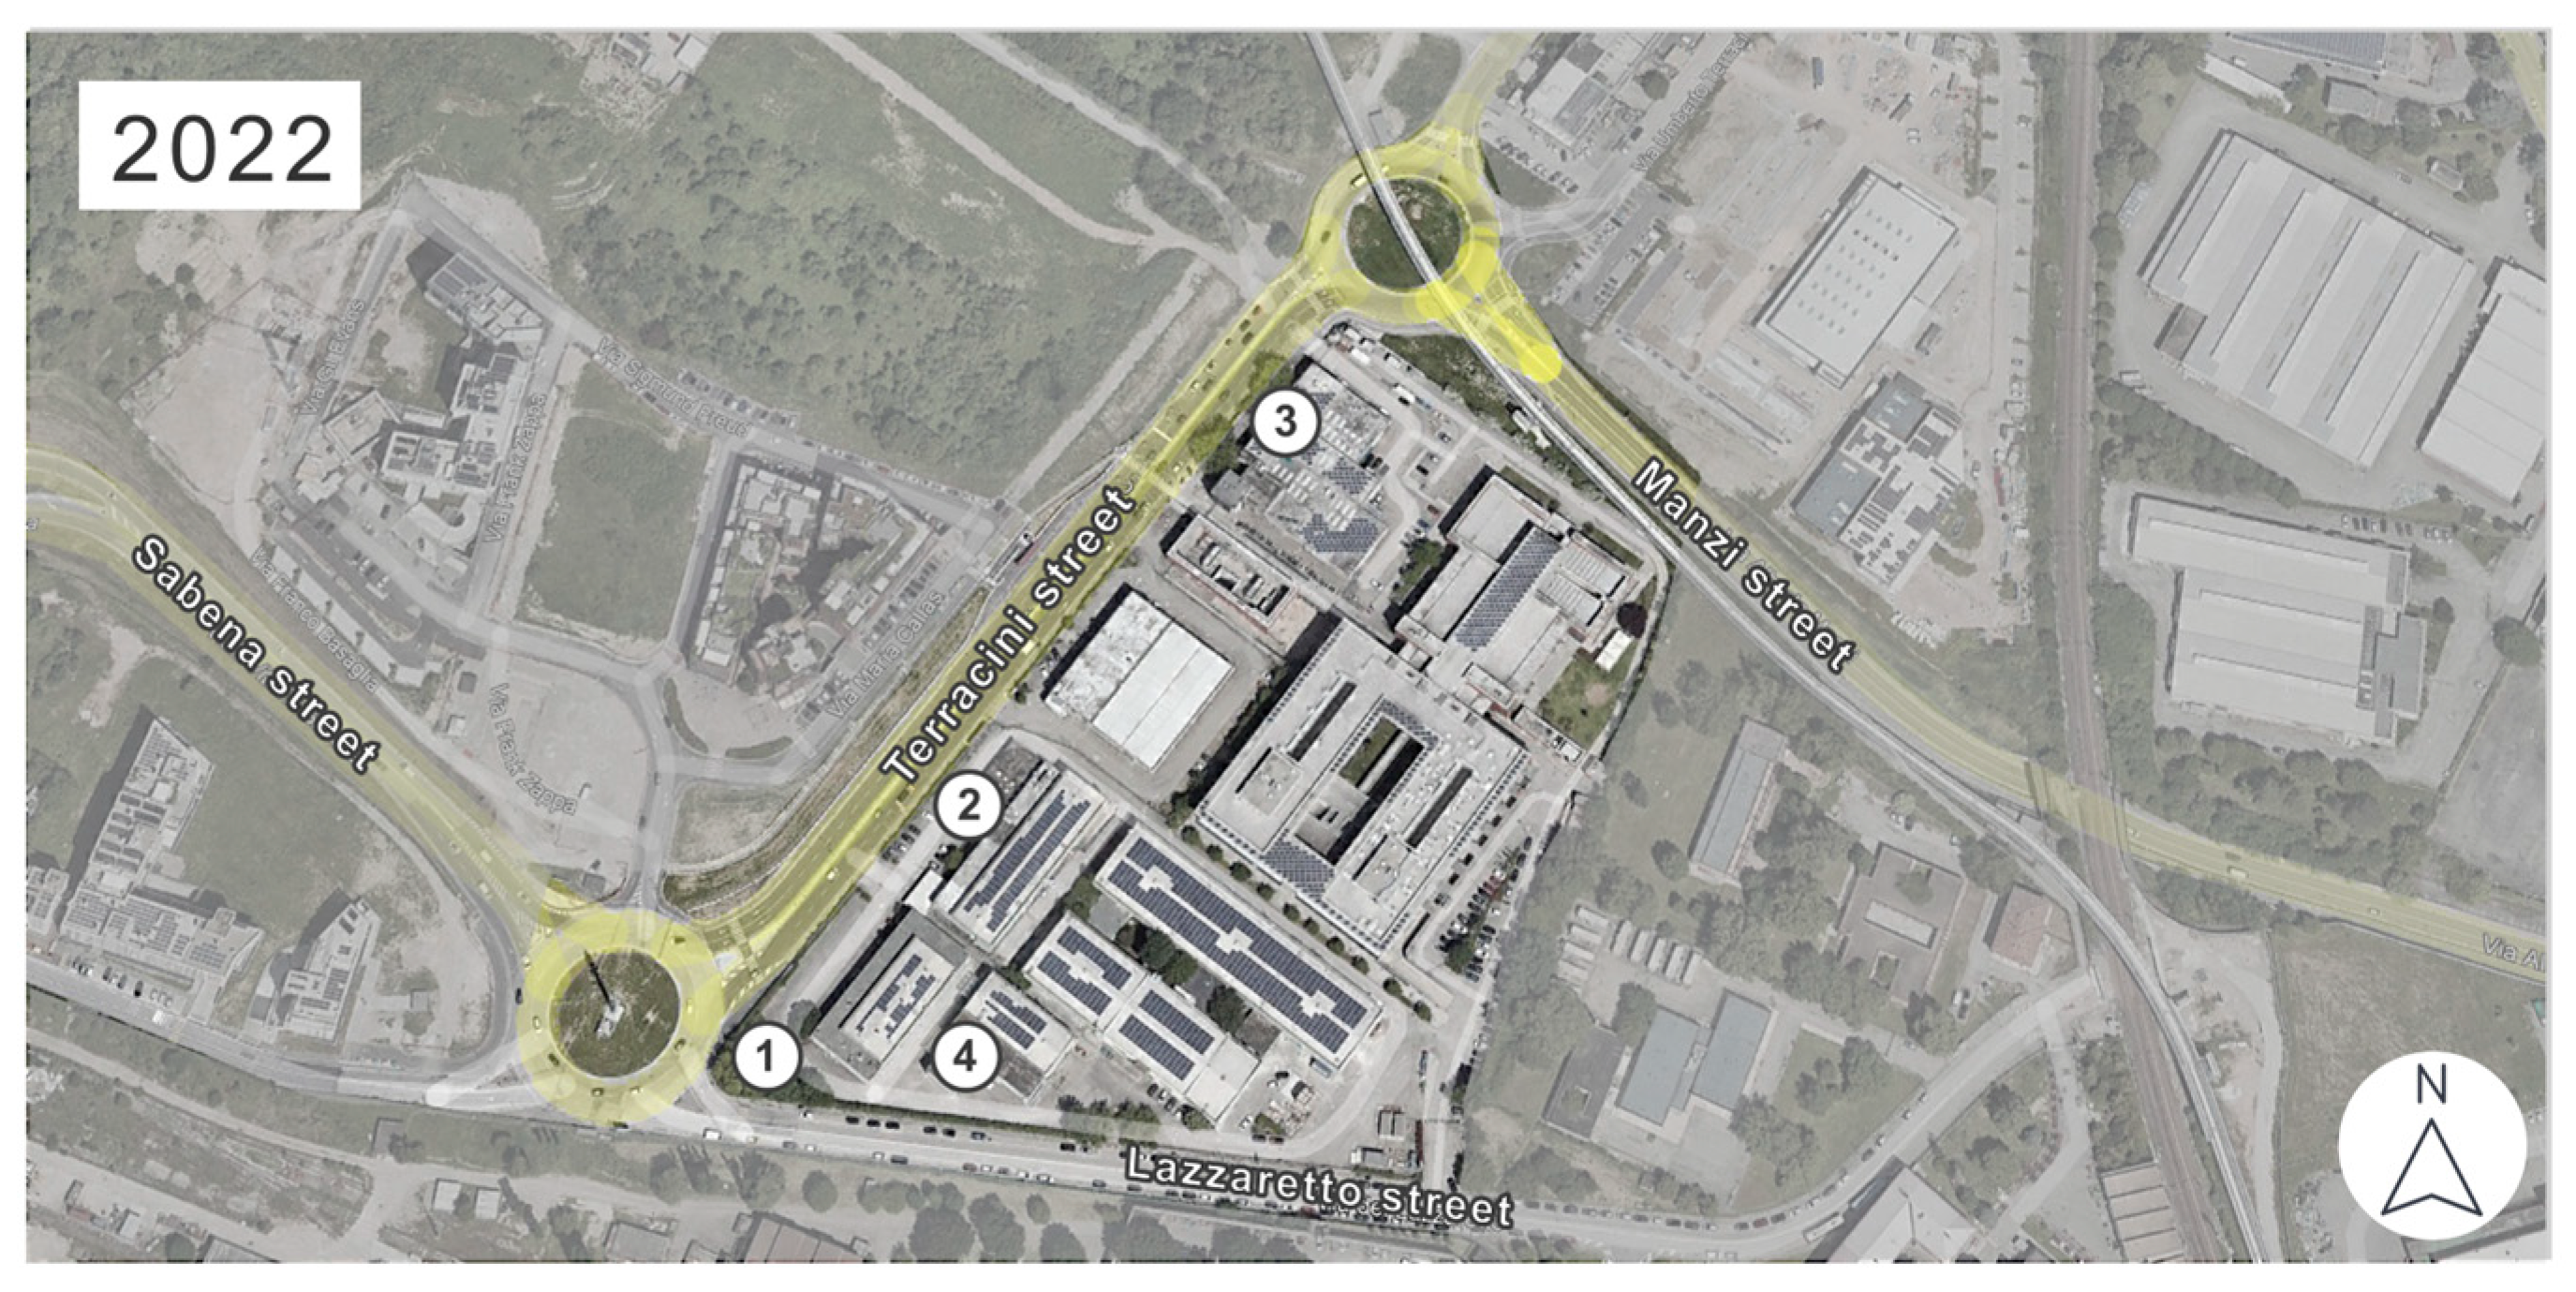
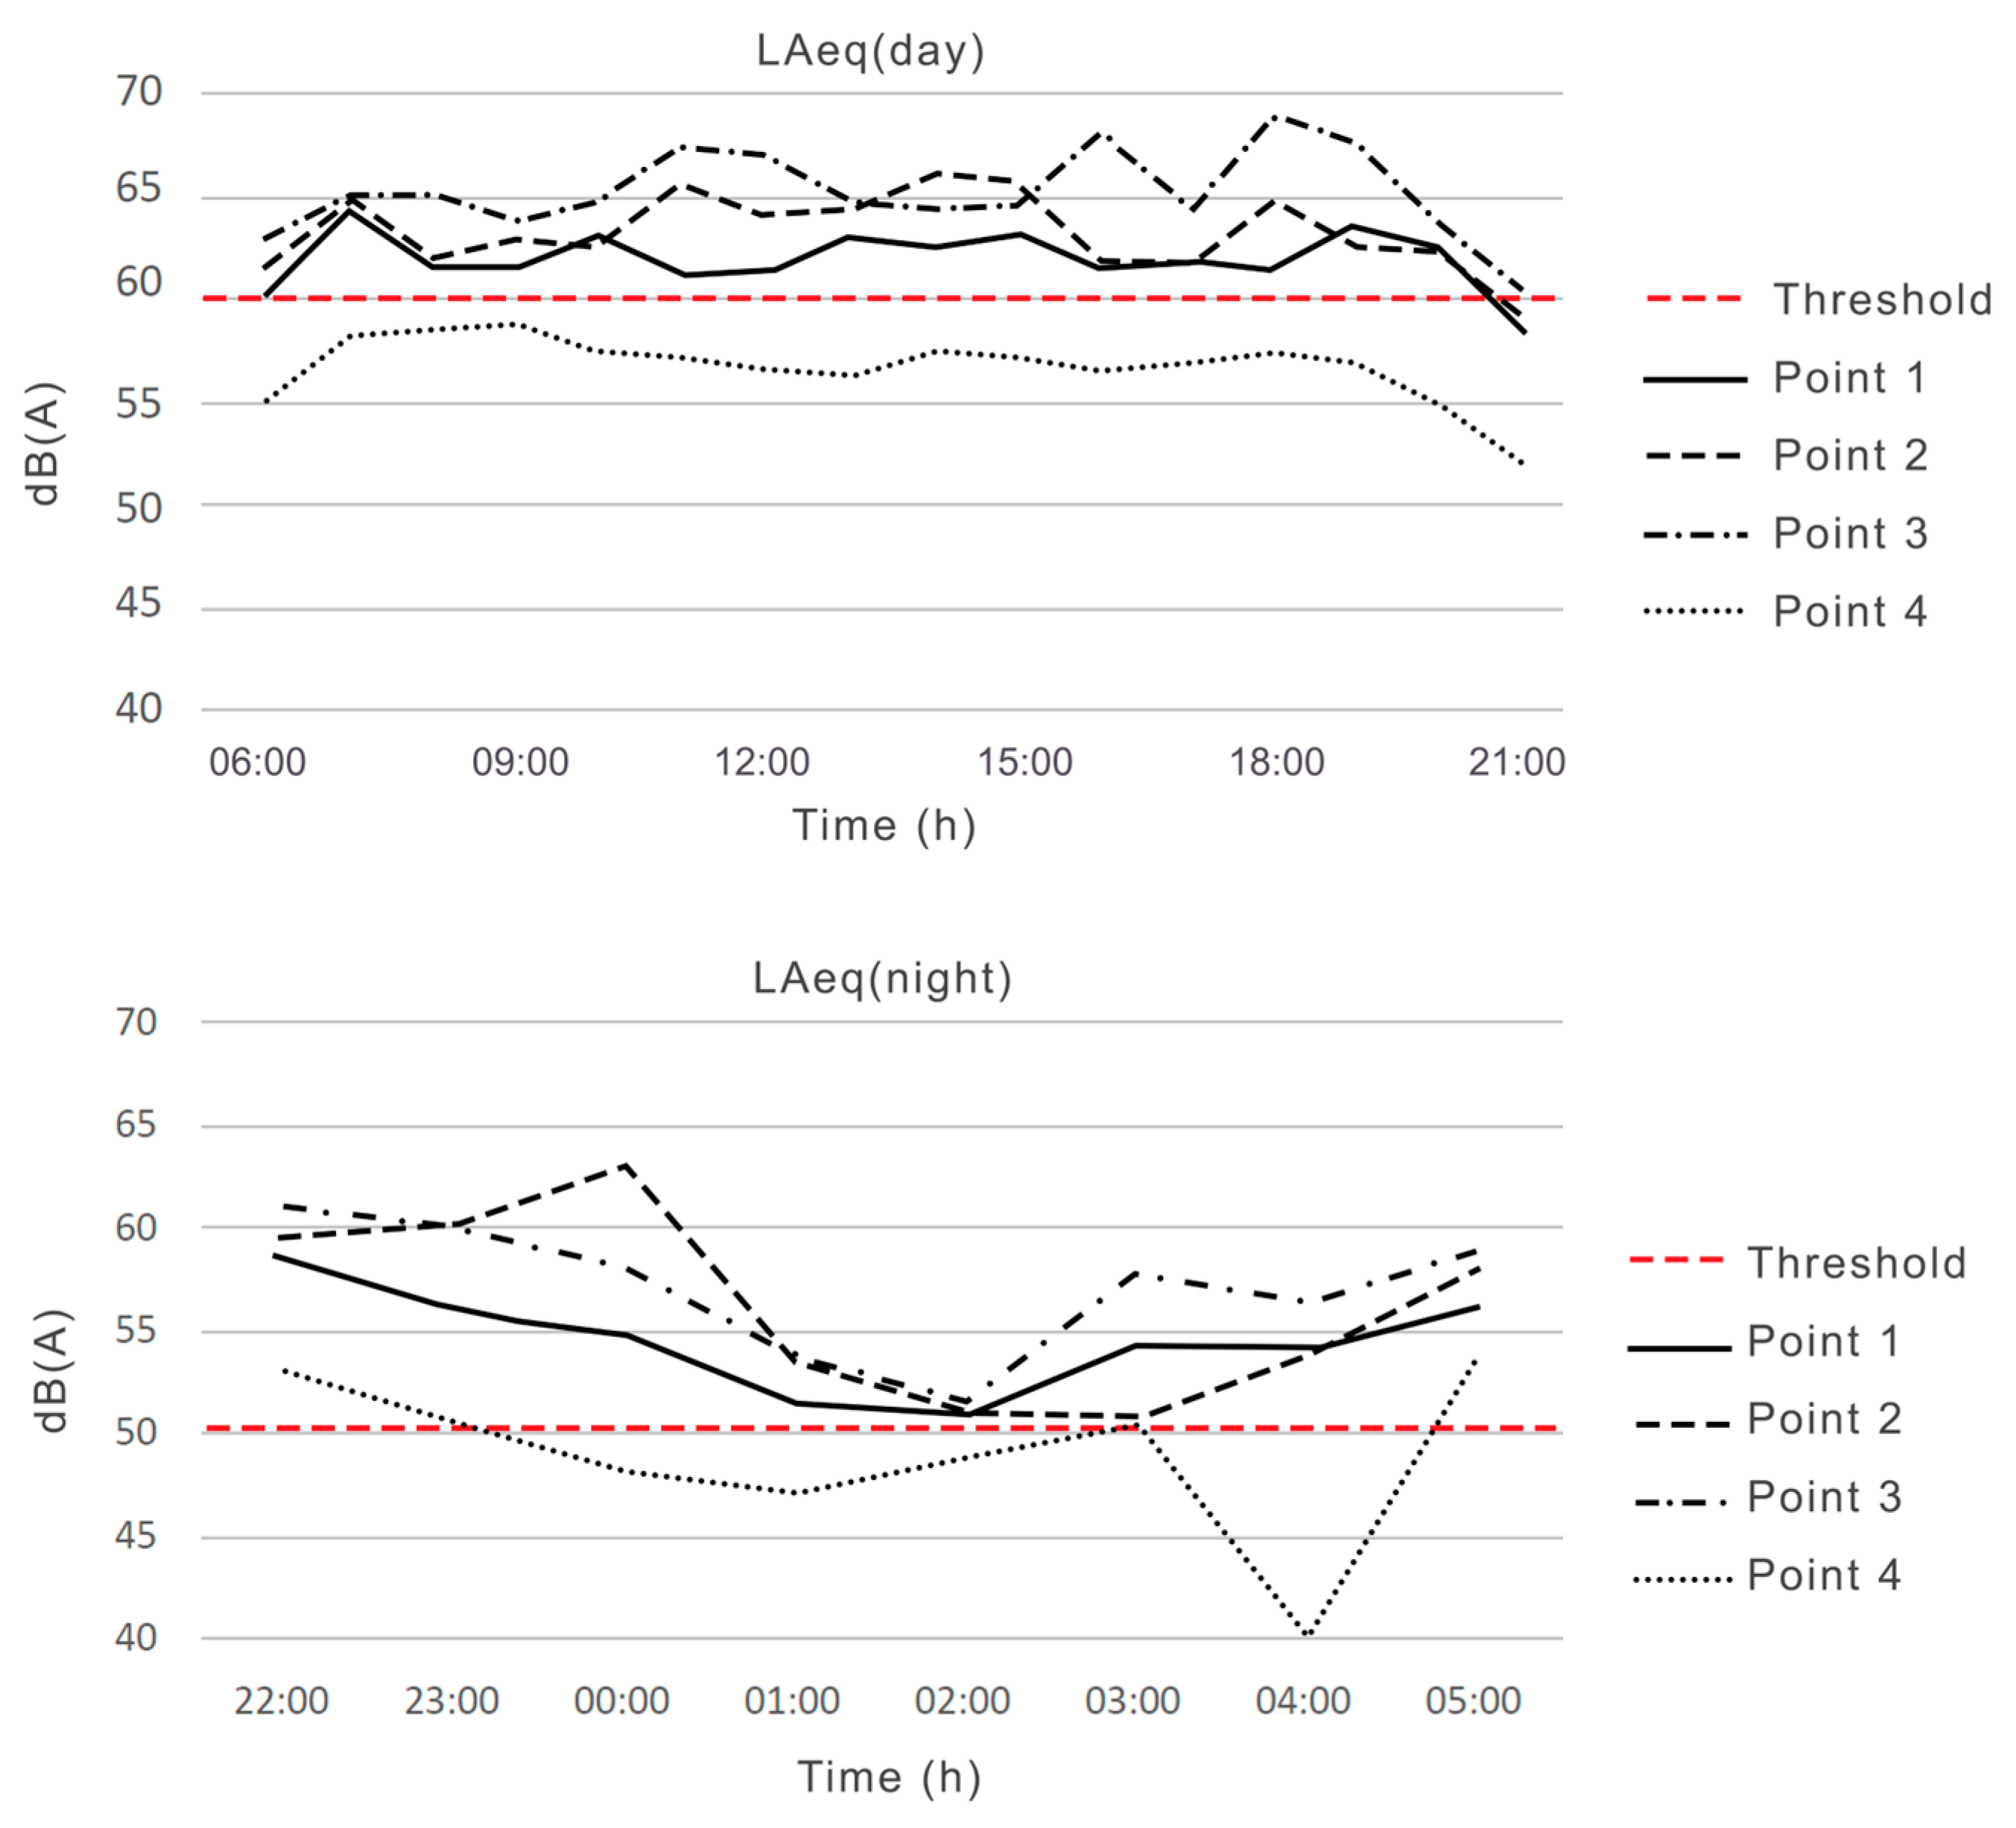
2.3. Preliminary Assessment of Terracini Street’s Environmental Acoustics

Since the university hub is a public building that hosts its main activities during the daytime, the expected mitigation design should be focused on the daytime LAeq data, i.e., in the 06:00–22:00 time frame. At first, control environmental noise measurements were carried out at the most rushed hours of road traffic: measurement A 8:30–9:00 a.m., measurement B 10:00–10:30 a.m., and measurement C 3:20–3:50 p.m. The measurements of the preliminary assessment of Terracini Street have been carried out in Point 2 of the plan representation of Figure 2. The sound pressure level was recorded for half an hour each in these time slots while simultaneously recording the number and type of vehicles. On average, 821 vehicles were registered in the first rush hour, 637 in the second one, and 367 in the third one, which, combined with the environmental sound recording, made it possible to highlight the prominent impact of the vehicle noise and demonstrate the importance of shielding the university site from such a source of noise. Table 3 shows that the higher number of mechanical sound sources monitored is related to time frame A, followed by B and C; however, the LAeq measured in these time frames is nearly the same. The reason could be the speed and the breaks of the vehicles in line in the street. Since the time frame is always the same (30 min), the speed at which the vehicles run during measurement B was significantly increased, enhancing the noise level.
Moreover, to assess whether the noise limits for acoustic class III of the area under study are exceeded according to Italian law, it was necessary to carry out sound level measurements for a duration of 24 h, placing the sound level meter at the height of 4 m above street level, at least 1 m away from the buildings, in the absence of atmospheric precipitations and with a wind speed less than 5 m/s, as per the regulatory requirements [23]. The measurement points were chosen to monitor the entire length of Terracini Street facing the university buildings, from one roundabout to the other (see Figure 2). Two sound level meters (DUO 01dB Metravib) were used, conforming to IEC 61672-1 class 1. The post-processing of the time history acquired was performed thanks to the commercial software dBTrait (https://www.acoem.com/en/products/noise-vibration-softwares/dbtrait-software/).
Measurements were taken on different days of the week and at different times to obtain a complete picture of the actual site conditions. Point 1, at the intersection of Terracini Street and Lazzaretto Street, was chosen to study the traffic noise level near the braking and acceleration spaces of the roundabout (see Figure 2). Point 2 was located about halfway along Terracini Street on the Technical Physics building rooftop, allowing us to monitor the traffic noise at a nearly constant speed. Point 3 was placed on the roof of the Mechanical Engineering building (Figure 2); with the addition of the data processed from this point, it was possible to monitor the road noise emitted along the entire road and the sound level in proximity to the second roundabout connected to Terracini Street. Point 4 was set on the roof of the Geotechnics laboratory to monitor Lazzaretto Street, a secondary neighbourhood street, and compare it to the sound level from Terracini Street. Lazzaretto Street and Terracini Street have two different functions. The first is the only connection with a public train company deposit (with low traffic intensity), while the second one is the central infrastructure connecting the industrial area (where a highway is also placed) with the main hospital and city centre, which is a high-traffic street.
Figure 3 shows an example of the output environmental noise data expressed in the frequency domain related to Point 2 (which here serves as an example for the other point analyses). The overall levels overcome the equivalent sound pressure level threshold—set at 60 dB(A) (day) and 50 dB(A) (night) [21]—with significant trespassing around 63 Hz and 1 kHz. The first could be related to the car engine noise, while the second could be related to the background noise (human activities, electronic signal transmittance, and so on). Since this study addresses the Italian Regulation [21], which requires only the global values of the LAeq, higher attention is paid to these values, as shown in Figure 4. From the overall results summarised in Figure 4, it is clear that the equivalent sound pressure level threshold was exceeded significantly (from 2 to 13 dB(A) overall). This condition was found for all three measurement points close to Terracini Street. The daytime LAeq exceeded the threshold, reaching 9 dB(A) above the limit, while the nighttime LAeq exceeded the threshold with 13 dB(A).
The survey showed the persistence of a sound level significantly higher than the limit prescribed by the regulations for several hours of the day and night. The daytime levels recorded at the first three points show higher values than those measured at the fourth point, which concerns Lazzaretto Street. The difference—between 5 and 13 dB(A)—can be attributed to the lower traffic load on Lazzaretto Street, confirming that its dead-end street characterisation leads to considerably lower vehicle circulation (therefore less noise recorded). Then, it could be argued that by acting only through a high reduction in vehicular flow, a perceivable improvement in LAeq could be obtained. However, as Desarnaulds et al. [24] support in their research, a 50% reduction of the current road traffic on streets like Terracini Street (for example, allowing only one direction of circulation) will lead to 1–2 dB(A) noise reduction and would help only in part to becoming closer to the threshold value of LAeq. Moreover, since this would entail a total redistribution of vehicular traffic in a larger area already heavily loaded by vehicle traffic, it appears unfeasible to adopt traffic noise reduction to achieve vehicular flows comparable to those of Lazzaretto Street. Given the complexity of such an approach and the risk of not solving the problem totally, it is clear that the policy of containing noise pollution from road traffic cannot be pursued through a reduction in vehicular flows alone; it must instead be the result of a combination of several factors, such as speed regulation through speed bump, radar gun, and passive protection systems. The last combines low-noise asphalt for the road surface and an acoustic barrier to protect the university buildings. Low-noise asphalt can perform a significant noise attenuation (around 3 dB(A) when new). According to Lou et al. [25], sound-absorbing asphalt can be engineered to reach a sound absorption coefficient of α = 0.40–0.82 in a frequency range of 200–2 kHz. Values of α = 0.80 are also proved in the work of Vaitkus et al. [14] while using inert selection to allow higher porosity. Furthermore, Yu et al. [13] showed the porous asphalt (PA) pavement performance reaching 1.5 dB to 4 dB of noise level reduction compared with the stone mastic asphalt (SMA) and dense-graded asphalt concrete (DGAC) pavements. However, an improving action on the road set up from the acoustic point of view, involving a sound-absorbing pavement, must pay particular attention to its maintenance since the low-noise asphalts on the market can deteriorate within 5–10 years [25], dropping from 5 dB to 1 dB after six years and leading to higher maintenance costs [26]. For the sake of this project, a PA with an expected sound attenuation of 4 dB has been selected as an average of the previously cited references; it has been placed in the numerical FEM model of the foreseen noise mitigation plan together with the acoustic barriers. In fact, the idea is that a PA can be combined with acoustic barriers to effectively improve the overall environmental acoustics of the university establishments on Terracini Street [3].

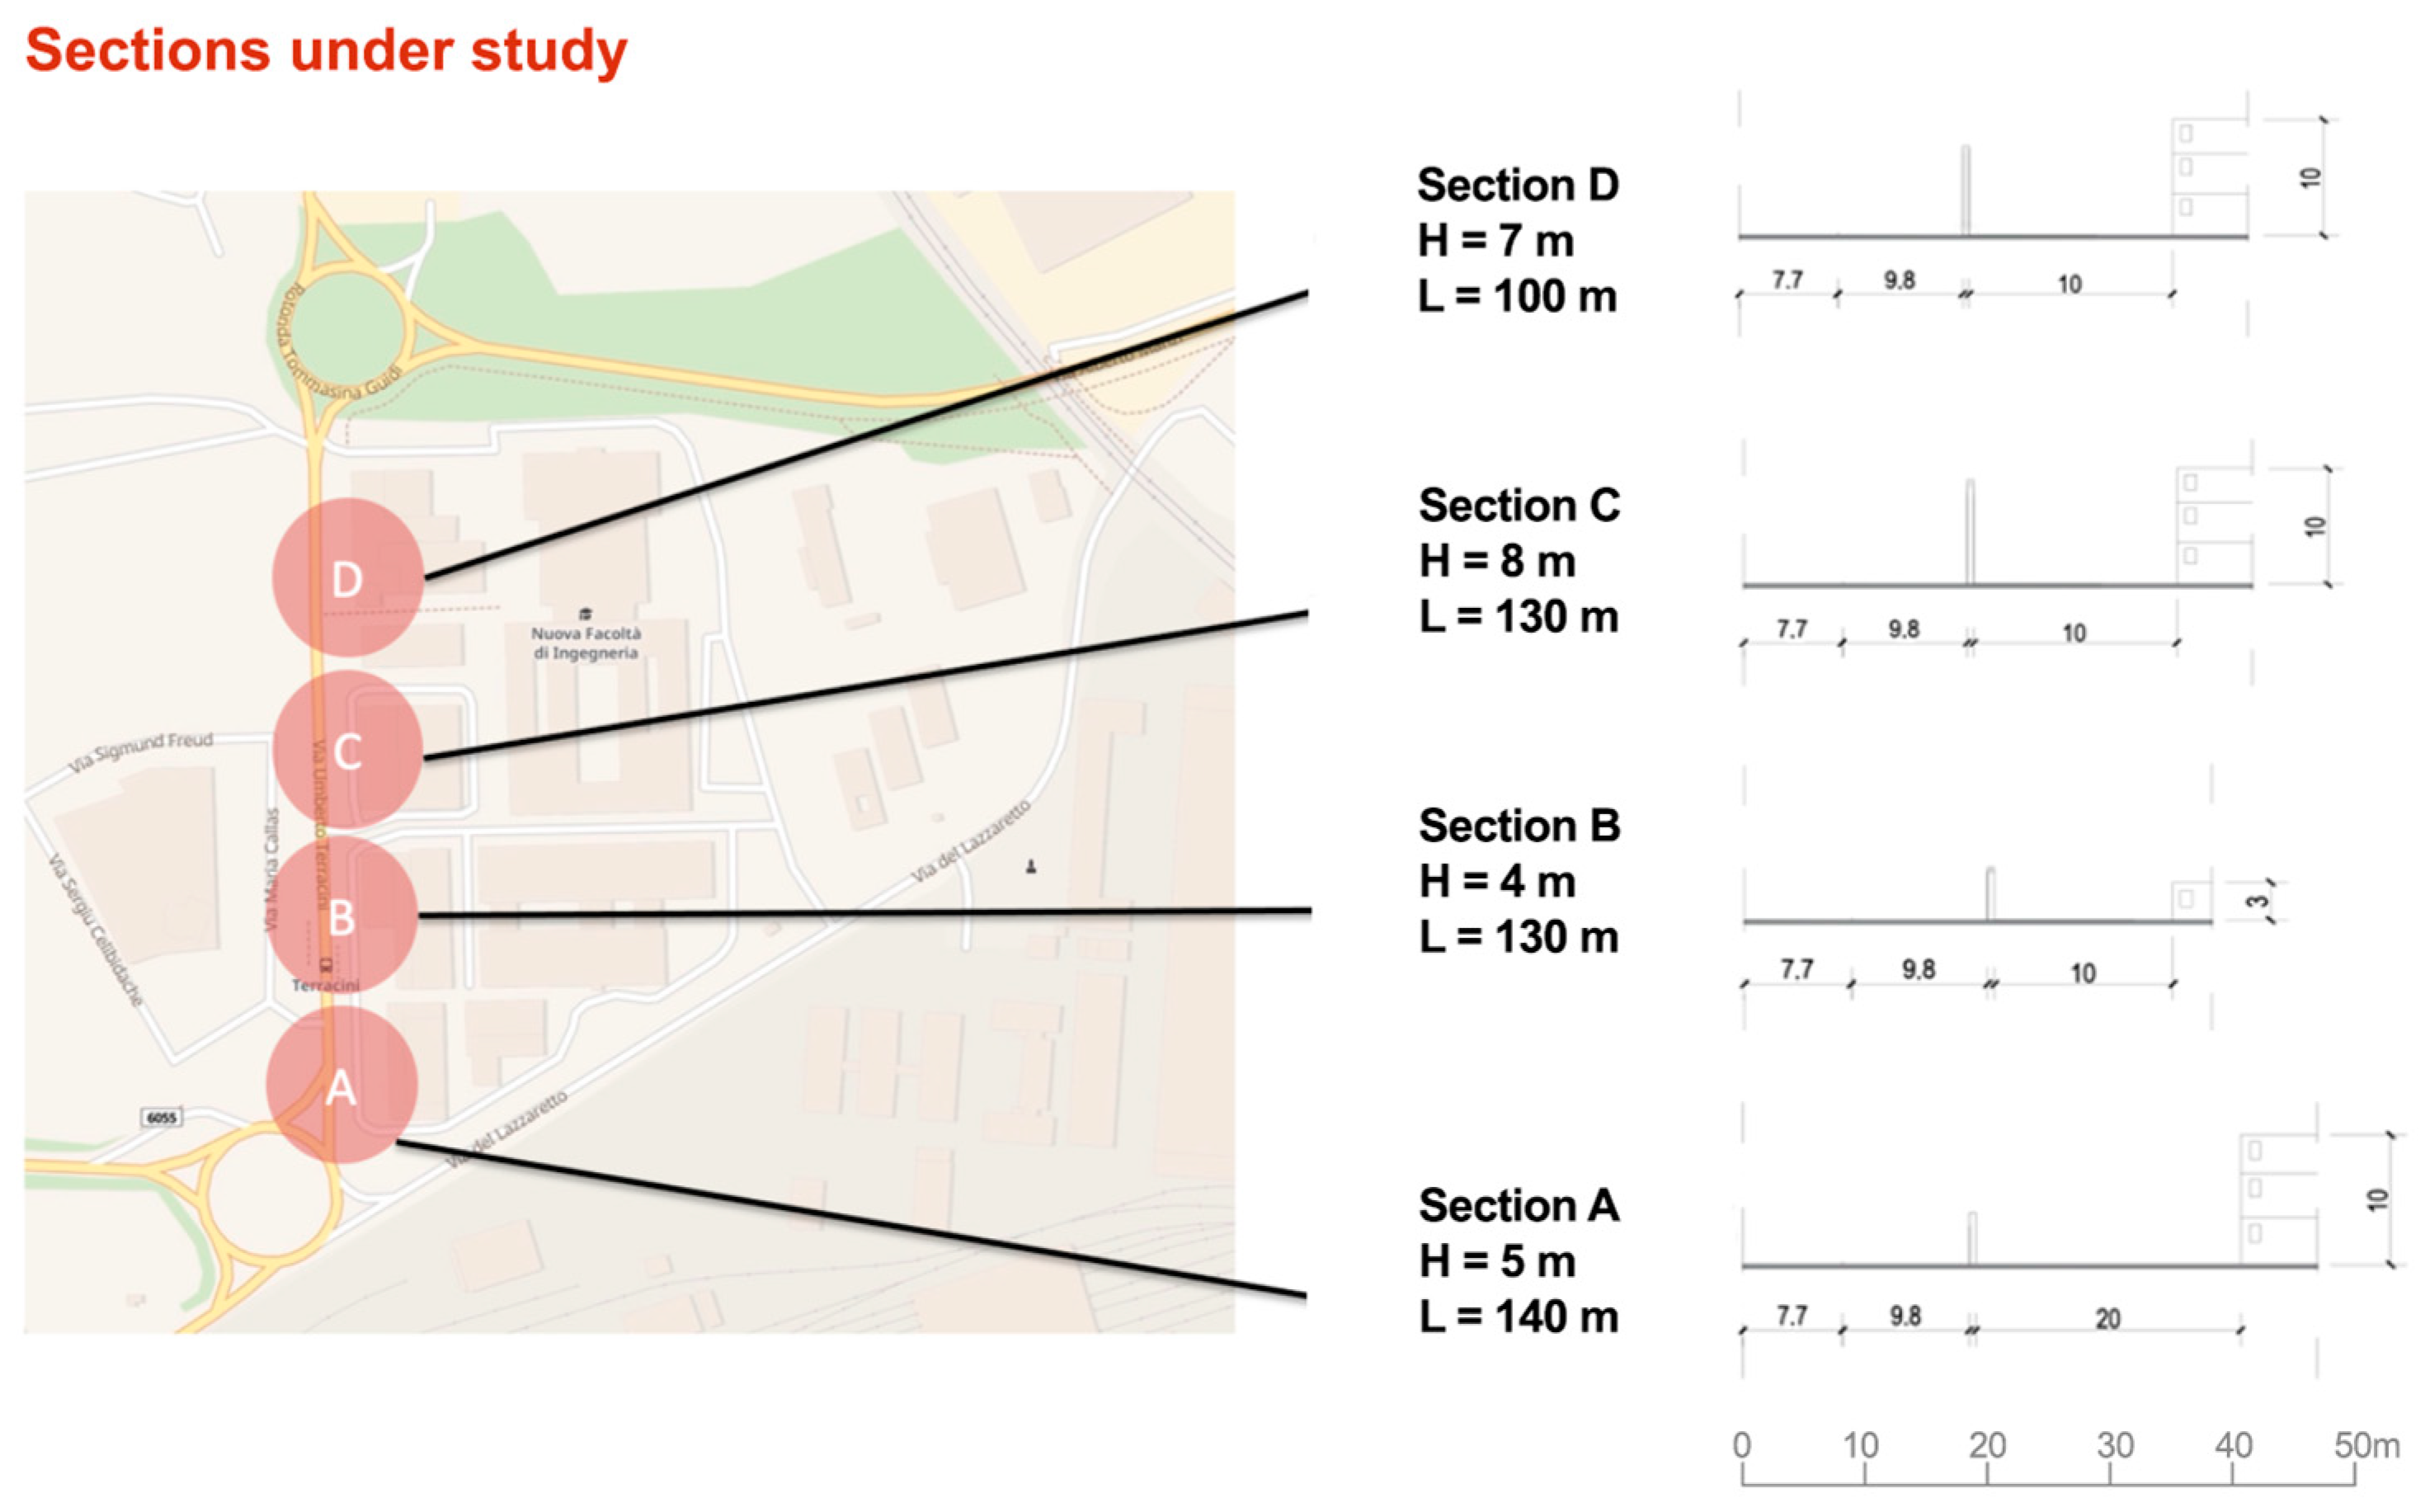
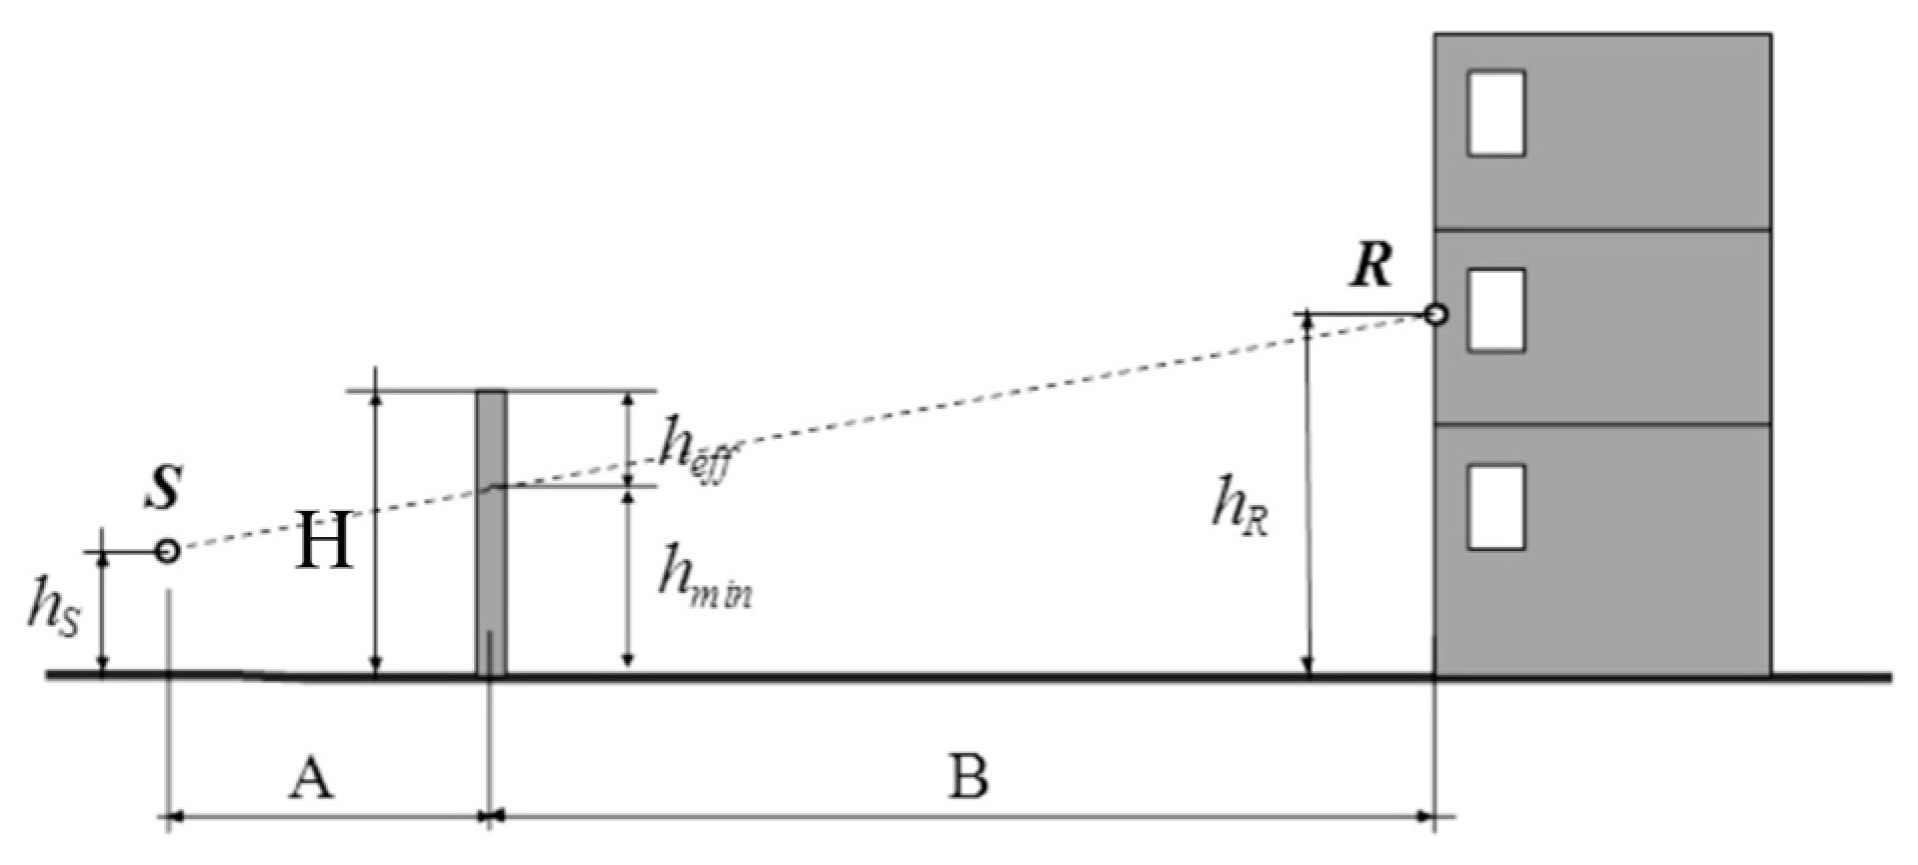
2.4. Analytical and Numerical Design of a Novel Noise Barrier

After comparing different types of noise barriers, one made of sonic crystal was selected [27,28]. Sonic crystals are structures designed to control, direct, and manipulate sound waves; their effectiveness depends not on constituent materials but on the geometric characteristics of their conformation [4]. The use of sonic crystals to make an acoustic barrier—from now on called sonic crystal acoustic barrier (SCAB)—provides an innovative solution that is still uncommon in commercial applications but effective in preventing noise traffic while allowing a breathable surface that can control solar radiation, and is achievable with materials having a low environmental impact, i.e., recycled and recyclable [3,29]. The main factors influencing the properties of sonic crystals are the geometry of the unit cell, the filling fraction, and the size of the scatterers. They control the formation of the targeted frequency bands and their width, and thus the sound-insulating capacity of the sonic crystal [3,30,31]. In the preliminary design stage, the sound absorption and sound insulation curves were taken from the literature [3,29], while the barrier height, given the target insertion loss (IL), was pre-dimensioned through Maekawa’s method [32,33]. An acoustic dimensioning of a barrier consists of determining its position concerning the source and the receiver(s), its height, H, and its length, L, to achieve the target insertion loss, ILTarget, to lower the noise level at the receiver(s) below the regulatory noise limits [34]. Thanks to meticulous experimental work with impulsive signals, Maekawa has built a noteworthy chart that shows the absolute values of the attenuation, ∆L in dB, produced by the edge of a thin noise barrier as a function of the Fresnel number N = 2δ/λ, where δ is the geometric difference between the direct propagation path in the absence of the barrier and the minimum path of the diffracted waves above the upper edge of the barrier, and λ is the wavelength [33].
δ can be calculated from the distance between the barrier and the source, A, the distance between the barrier and the receiver, B, the height of the source,   h s , the height of the receiver, h r , and the assumed height of the noise barrier, H (see Figure 5). For a point source and a long noise barrier, Kurze and Anderson [35] derived an analytical formula for the attenuation that can conveniently substitute Maekawa’s chart:
L = 5 + 10 · l o g 2 π N t a n h ( 2 π N )   [ dB ]
For a linear sound source, like a road, the angular dependence of δ must be considered, subdividing the line source into elemental sections [35]. It is worth noting that the Fresnel number and, thus, the attenuation are a function of the wavelength, i.e., of the frequency; therefore, the calculation must be repeated for each frequency band of interest. Next, the height of the barrier, H, can be determined as the sum of the minimum height, hmin, and the effective height, heff. The minimum height represents the barrier’s height to obstruct the direct view between the source and the receiver (see Figure 5). The effective height is the added height to achieve the desired insertion loss, ILDesign.
This can be done by iteration, gradually increasing the effective height in steps, applying the Kurze–Anderson formula in each frequency band for each step to calculate the ΔL in dB [35], and finally, combining energetically the sound pressure levels without the barrier, the design insertion loss, and the A-weighting correction to obtain the A-weighted overall sound pressure level with the barrier. Subtracting this value from the overall A-weighted SPL without the barrier gives the overall design insertion loss in dB(A):
I L D e s i g n = S P L w i t h o u t 10 · l o g i = 1 n 10 S P L w i t h o u t , i L i + C i d B ( A )
where S P L w i t h o u t , i     is the measured sound pressure level in the i-th frequency band, and Ci is the A-weighting correction in the i-th frequency band.
To consistently apply this pre-dimensioning, Terracini Street was divided into four sections where the noise barrier was expected to have a constant height based on the buildings’ height and distance from the road (see Figure 6). In each section, the target insertion loss (ILTarget) is the maximum level difference between the measured values (over the whole time frame and at points 1–3 in Figure 4) and the noise level limit imposed by the Italian Regulation [21]. Therefore,
I L T a r g e t = S P L w i t h o u t     S P L l i m i t     d B ( A )
where S P L w i t h o u t     is the measured sound pressure level (see Figure 3), and S P L l i m i t     is the maximum allowed sound pressure level according to the Italian Regulation. I L T a r g e t       assumes the following values as follows:
  • In section A (ref. measurement point 1), ILTarget = 10 dB(A);
  • In section B (ref. measurement point 2), ILTarget = 13 dB(A);
  • In section C (ref. measurement point 2), ILTarget = 13 dB(A);
  • In section D (ref. measurement point 3), ILTarget = 11 dB(A).
Figure 6. Schematic showing the four sections along Terracini Street used to design the noise barrier.
Applsci 14 01837 g006
Then, the above-described iterative procedure was applied for each section, and the effective height heff was determined in each case. Next, the factor K to be multiplied by the distance B between the barrier and the receiver to obtain the barrier half-length W = K · B is red, from the work of Kurze and Anderson [35]. Finally, the length of the barrier was determined as L = 2 · W . See Table 4.
The result of this analytical pre-dimensioning study was implemented by a FEM (finite element method) model in the specific context using the Comsol Multiphysics software (v.6.1) in order to quantitatively appreciate the effect of the combination of noise barriers and low-noise asphalt. The FEM method determines an approximation of the solution of a system of partial differential equations in a region of space with well-defined boundary conditions [36]. The stationary numerical model was designed to include four linear sources (one for each street lane) for each road section (A–D) and a receiver (labelled R in Figure 7) positioned according to the requirements of ISO 1996-2-2017 for all four sections (at the height of 4 m from the ground and a distance of at least 1 m from the façade of the nearest buildings) [23,37]. For each section and a hemispherical domain that best approximates the free-field propagation conditions, see Figure 7. In this case, there are four circular sources (r = 0.5 m), labelled with S (S1–S4), emitting an omnidirectional sound pressure wave of 1 Pa (equivalent to 93 dB), representing each street lane’s vehicle noise with distance d = 4.5 m between each other. They have been positioned with the centre at 0.5 m from the ground, a calculated average between the height of the wheel–pavement interaction and the height of the engines of light and heavy vehicles or buses, to simulate their noise emission. The red line in Figure 7 represents the free-field sound propagation conditions simulated by a hemispherical domain, while the blue line highlights the rigid body boundary condition on the building’s external surfaces. These surfaces are considered perfectly rigid walls, and the sound transmission is not considered at this study stage. As the noise pollution directly affects the nearest area (10 to 30 m from the road), the numerical analysis considered a radial distance of 50 m from the foot of the noise barrier for each road section as enough to represent the barrier effect (see the geometric reference in Figure 7).
The space between the hemisphere and the ground line is characterised as air, i.e., a fluid with a density ρb = 1.22 kg/m3 and sound transmission characteristics typical of air under normal atmospheric pressure and ambient temperature conditions (air temperature 20 °C, atmospheric pressure 1 atm). The domain was discretised into mesh elements with a minimum dimension between consecutive nodes of 343/4/1000 = 0.08 m, i.e., reliable in the frequency range from 100 Hz to 1000 Hz, which results in a convergence of the results and efficiency in the processing time and computing resources [36]. The sonic crystal barriers have been positioned within the 2D FEM study according to the analytical pre-dimensioning (see Figure 6) and were defined in the acoustic domain as an internal rigid boundary. For characterising the 2D FEM study with (i) the sonic crystal and (ii) the asphalt boundary, two previous studies concerning these elements have been used as references. Indeed, since this study is more focused on the applications of such systems rather than on developing or discussing their geometrical characterisations, an impedance model reproducing the same sound absorption coefficient of (i) and (ii) was applied to the layers representing these two elements in the FEM model. Specifically, the numerical method was used to reproduce:
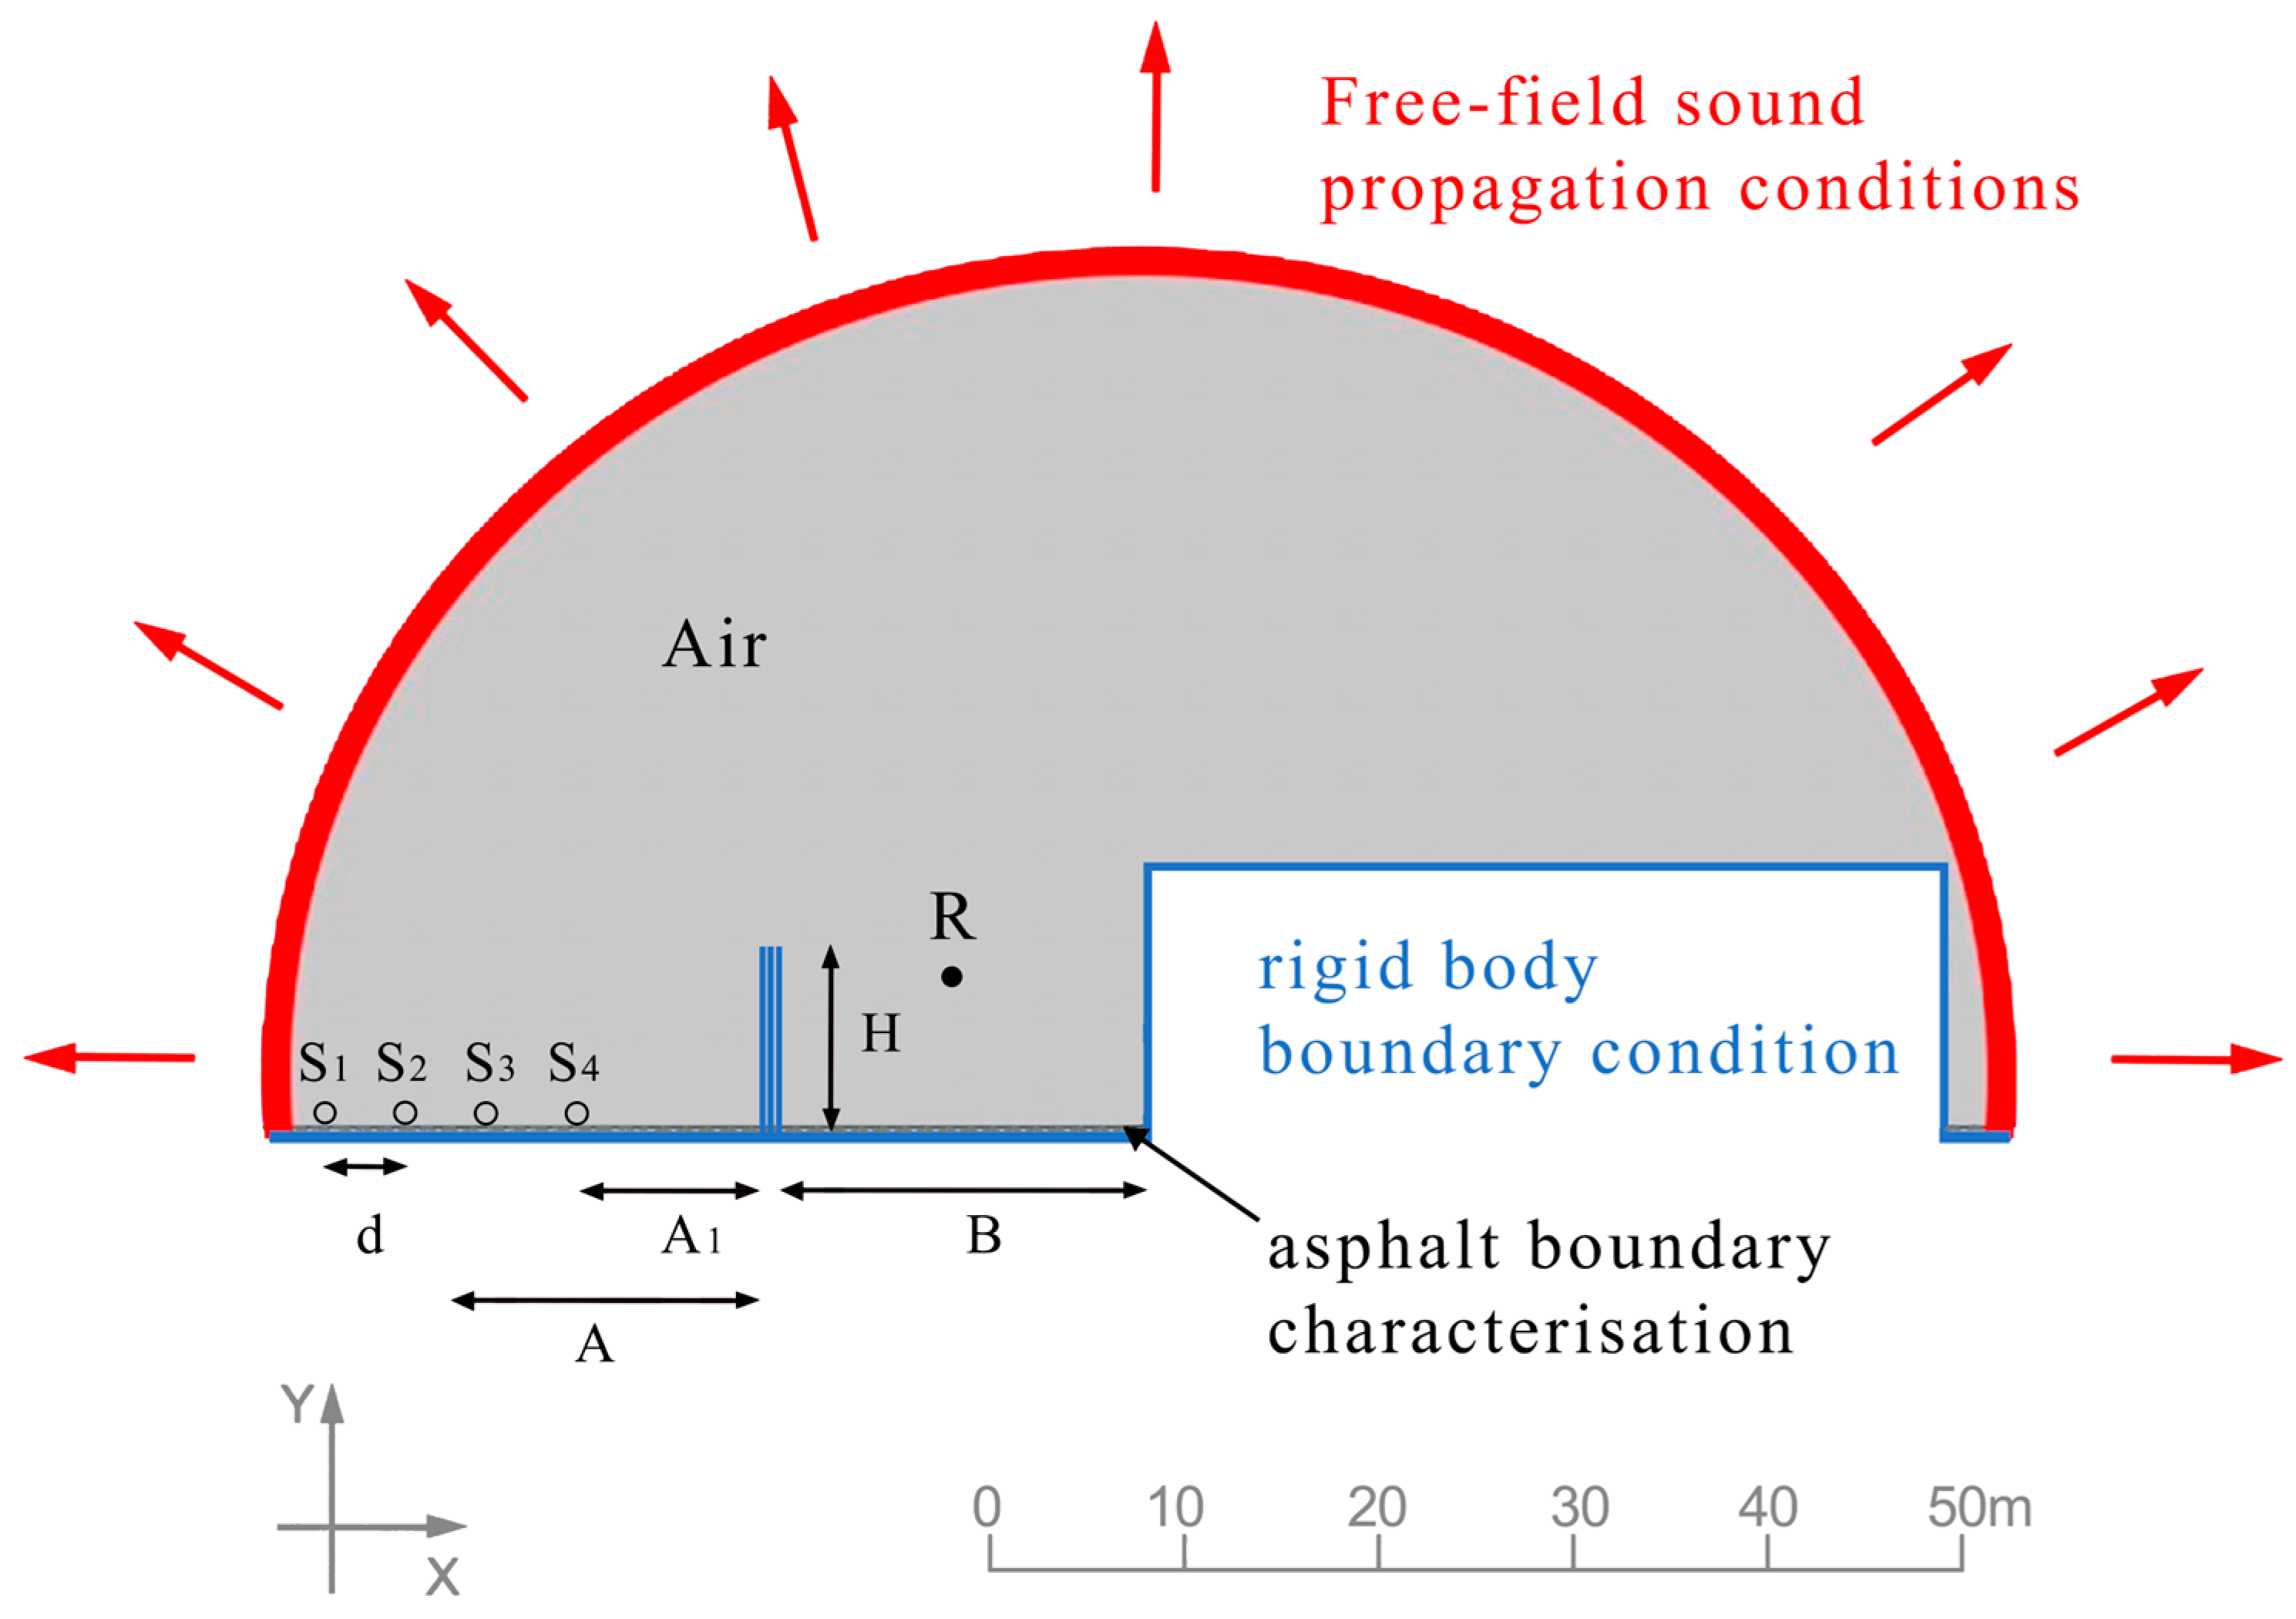
  • The current state-of-the-art, including a standard sound absorption coefficient for the road pavement, taken from model 1 in the work of Lou et al. [25] (pre-intervention);
  • The post-intervention state by adding elements such as the low-noise asphalt (according to the sound absorption coefficient of models 2–5 shown in Lou et al. [25]) and the previously pre-dimensioned acoustic barrier made of sonic crystals, whose stopbands were characterised as in Morandi et al. [3] (i.e., adopting the same scatterers spacing and filling fraction). The resulting sound insulation index (SI) is depicted in Figure 7 of ref. [3].
Therefore, the absorption coefficients from references [3,25] were applied to the geometrical outlines defining the road pavement and the SCAB. Figure 8 shows a schematic of the sonic crystals: the scatterers are distributed as in Morandi et al. A three-row SCAB is considered with a cylinder radius of r = 0.08 m, cylinder thickness t = 3.2 mm, scatterer spacing s = 0.4 m, both in the horizontal and vertical direction, and a filling fraction ff = 50% [3].
In the FEM model, the effectiveness of the noise barrier as a noise mitigation measure has been assessed with the insertion loss (IL) at each receiver, comparing the noise levels with and without the acoustic project design. In this simulation, the design ILDesign is determined in the 200–1000 Hz range as the difference between the sound pressure level in the pre-intervention configuration ( S P L w i t h o u t )   and that of the post-intervention configuration ( S P L w i t h ) , calculated at the same receiver and A-weighted. The overall values have been reconstructed from the values in the one-third octave bands in the 200–1000 Hz range. The formula is the following, to be compared with Formula (2):
I L D e s i g n = S P L w i t h o u t S P L w i t h   d B ( A )

3. Results

Figure 9 and Figure 10 show a colour map of the spatial distribution of the SPL at 1 kHz based on the FEM 2D analysis of sections A–D. It is evident from the figures that before the planned intervention, the sound pressure level was high at most points in the sections, while after the noise mitigation, there was a remarkable reduction in the sound pressure levels. The chosen solutions significantly reduced the sound pressure level; on average, an IL of 10 dB (A) is obtained in the frequency range of interest (200–1000 Hz). This result is particularly significant when considering section C (Figure 10), corresponding to the road section where the measurements with the highest sound pressure levels were taken.
In the preliminary measurements, the receivers were positioned according to the specific regulations [21,23,37]. Correspondingly, Figure 11 presents the IL from the A-weighted SPL spectrum in the frequency range of 200 Hz to 1 kHz in 5 Hz steps at the receiver point R of section A (see Figure 7). Positive values of the insertion loss correspond to a reduction in the noise disturbance at each frequency. The IL plot confirms an average IL of 10 dB (A), with a maximum sound level reduction of up to 25 dB (A) at some frequencies above 600 Hz. Moreover, the IL trend is further explained in Figure 11 through an exponential smoothing function (with a damping factor of 0.9), which highlights IL’s significant increase (>10 dB(A)) from 500 Hz above. On the lower frequencies (between 200 and 500 Hz), the SCAB FEM analysis reports an IL ranging from 5 dB above.
The numerical analysis results confirmed the analytical pre-dimensioning of the noise barrier (the Maekawa method with the Kurze–Anderson formulation) and the effectiveness of the selected low-noise road pavement in combination with sonic crystal noise barriers (SCAB), which would result in the view in Figure 12. Here, each SCAB colour represents a different height as follows: A (green) height is 5 m, B (purple) is 4 m, C (blue) is 8 m, and D (red) is 7 m.

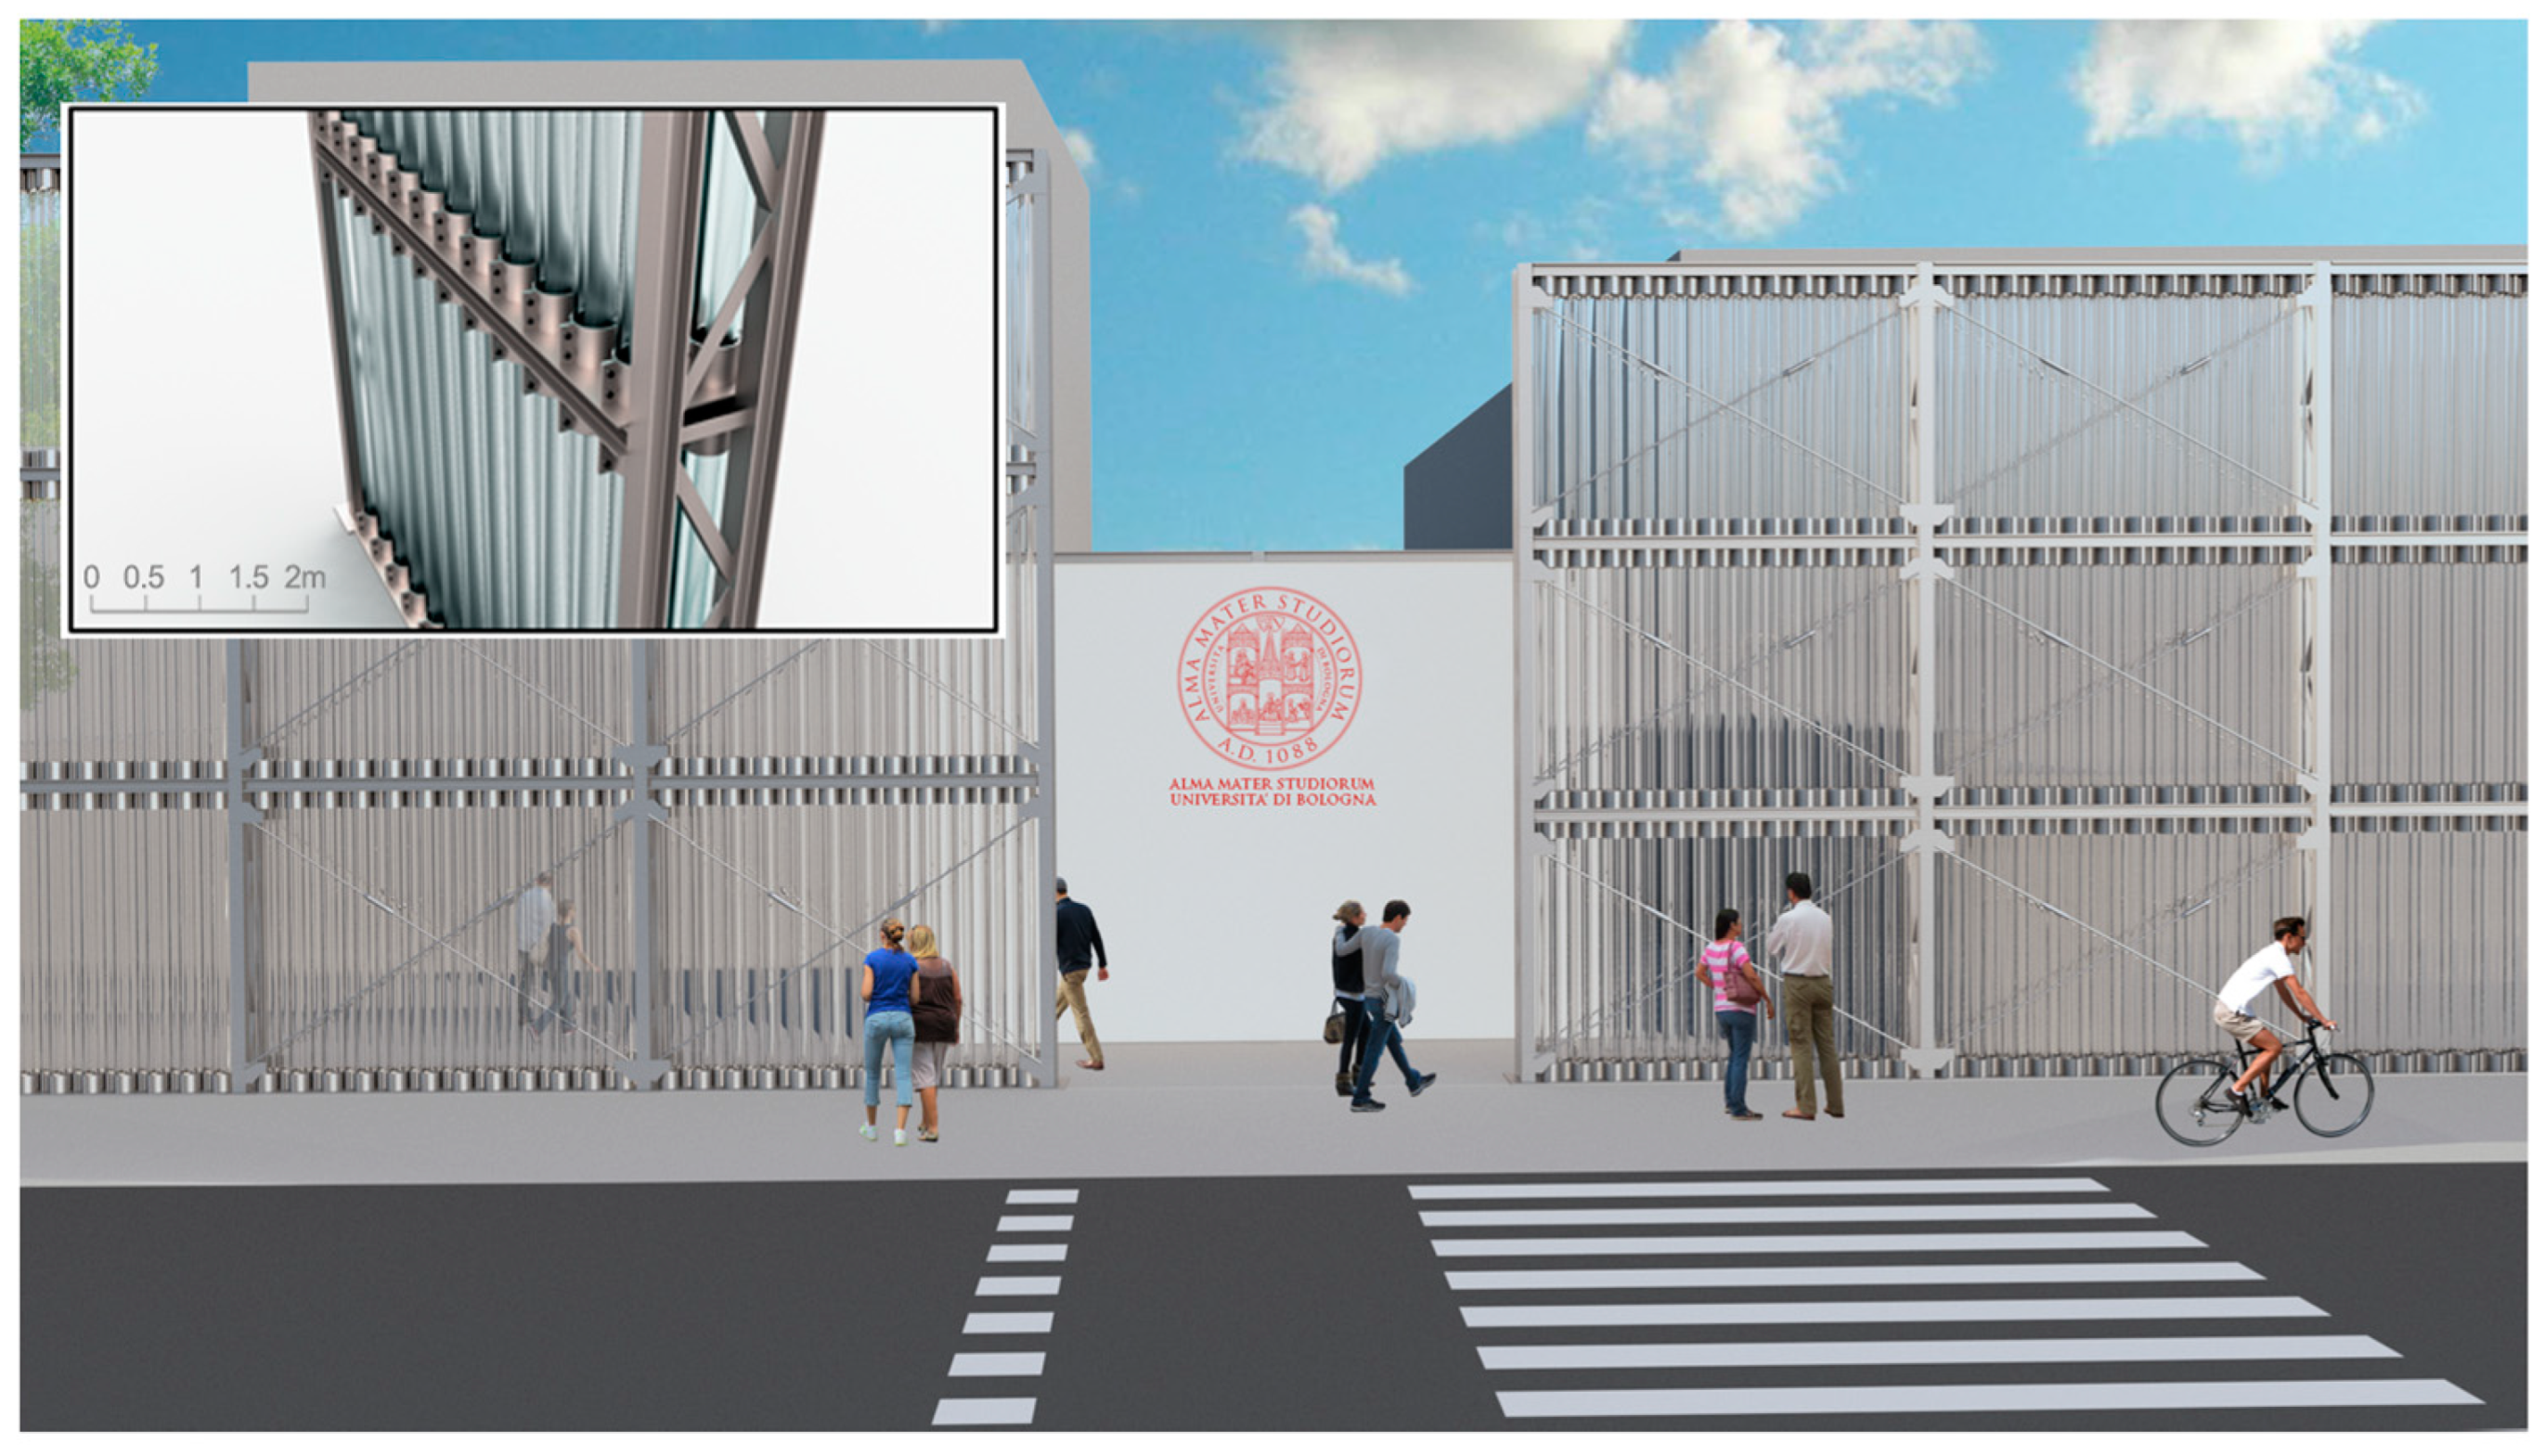
4. Structural Supporting System

The technological solution of sonic crystals, an ensemble of vertical cylinders permeable to the airflow, oriented the study toward a structural supporting system applicable even for barriers of considerable height (since the wind load can then be significantly reduced). The solution proposed in this present work is the adoption of metal frames, which in the hollow fields accommodate polymethylmethacrylate (PMMA) tubes arranged according to the geometries cited in the Morandi et al. experimental study [3]. The designed frames consist of reticular pillars, arranged with a step of 3.5 m in length, and beams made of coupled profiles placed at different heights with a variable step from 2.5 m to 3.5 m (depending on the height of the barrier). Reticular pillars create the necessary depth to accommodate the sonic crystal infills and provide adequate transverse rigidity to the entire system. The PMMA tubes are placed in special housings made from a fixed part, welded to the plates below and above the beams, and a removable part, welded to the fixed part. This solution allows for easy replacement of the elements in the event of damage and facilitates routine maintenance operations.
The system described was studied from a structural point of view too (see Figure 13), and its elements were dimensionalised and verified against both static actions, induced by self-weight, load-bearing, and wind pressure, as well as seismic actions, i.e., the inertial forces produced by the seismic acceleration of the masses. This study was conducted by reproducing the structural system with a finite element model within the PRO_SAP calculation software (https://www.2si.it/en/pro_sap-professional-sap/) and conducting static and seismic analyses to derive the relative stress characteristics. A more detailed description of the structural design is outside the scope of this present article and will be presented in future work.

5. Conclusions

This study investigated the acoustic analysis of the Engineering School of Bologna site in Terracini Street and the design of a combined solution to mitigate the noise pollution in this area. The acoustic measurements along Terracini Street have pointed out that the LAeq values exceed the daytime (6:00 to 22:00) regulation limits by 9 dB(A). Additional control acoustic measurements performed in the noisiest hours (in terms of LAeq) highlighted the importance of the number of vehicles on the measured noise levels (1216 vehicles/hour with an LAeq of 62–67 dB(A) and LAmax of 80–82 dB(A)), thus proving the importance of shielding the university site from such a noise hazard. Terracini Street is part of the crucial infrastructure of this area and cannot be subjected to traffic limitations (the urban fabric has been developed constantly in the last ten years). For this reason, this present study proposed a combination of passive acoustic techniques, such as a low-noise road pavement and a sonic crystal-based noise barrier (SCAB). Specifically, for the noise barrier, Maekawa’s method helped define each SCAB section’s height (variable from 4 to 8 m according to the specific traffic noise in the analysed sections). Due to the environmental impact of the noise barrier, attention was paid to the combined acoustic, lighting, shading, and ventilating effects, which a standard barrier could have rarely resolved. For this reason, SCABs were designed, reproducing an effective solution already reported in [3]. Finally, the insertion loss spectrum was calculated for the various sections. The project also assessed the dimensioning and verification of the static actions (loads and wind action) and the seismic action of the barrier’s structural system numerically, which is to be detailed in further work.
Overall, constructing a noise barrier with sonic crystals and adding a low-noise road pavement may reduce traffic noise by 10 dB(A) on average (with a maximum of up to 25 dB(A) from 600 Hz onwards), allowing compliance with the noise pollution limits from national regulations. Moreover, the semitransparent PMMA sonic crystals have a less visually impactful appearance and are more permeable to airflow, leading to better structure permeability in terms of light and ventilation and reducing the wind load considerably [3]. The rendering of the SCAB placed on the site shown in Figure 13 represents how much visual, ventilation, and acoustic permeability allow the university site to (i) be immediately recognisable from the outside and (ii) the students inside to feel properly oriented, although the input from the outdoor environment is filtered [10,38]. This ergonomic feature can be crucial for increasing students’ comfort from a more complex sensory sphere and contributes to the overall well-being of those inside the classrooms [39].
Terracini Street is a multifunctional site that has overcome several urban modifications over the last 50 years. In this study, it has been proved that a metamaterial-based noise barrier solution could significantly improve noise mitigation while not degrading the urban quality of the site (provided by the ergonomic design through shading, ventilation, and transparency effects). The method and the results shown could set a new starting point for environmental acoustic studies in multifunctional sites, and further studies could verify the broader applicability of such a method.

Author Contributions

Conceptualization, G.F. and M.G.; methodology, G.F. and M.G.; software, G.F.; validation, G.F. and M.G.; formal analysis, G.F.; investigation, G.F. and M.G.; resources, M.G.; data curation, G.F. and M.G.; writing—original draft preparation, G.F. and M.G.; writing—review and editing, G.F. and M.G.; visualization, G.F.; supervision, M.G.; project administration, G.F.; funding acquisition, M.G. All authors have read and agreed to the published version of the manuscript.

Funding

This research was funded by the Ministero dell’Istruzione dell’Università della Ricerca (Italy) in the frame of the project PRIN 2017, Grant No. 2017T8SBH9: “Theoretical modelling and experimental characterisation of sustainable porous materials and acoustic metamaterials for noise control”.

Institutional Review Board Statement

Not applicable.

Informed Consent Statement

Not applicable.

Data Availability Statement

Data is contained within the article.

Conflicts of Interest

The authors declare no conflict of interest.

References

  1. Szopińska, K.; Balawejder, M.; Warchoł, A. National legal regulations and location of noise barriers along the Polish highway. Transp. Res. Part D Transp. Environ. 2022, 109, 103359. [Google Scholar] [CrossRef]
  2. Torresin, S.; Albatici, R.; Aletta, F.; Babich, F.; Oberman, T.; Kang, J. Acoustic design criteria in naturally ventilated residential buildings: New research perspectives by applying the indoor soundscape approach. Appl. Sci. 2019, 9, 5401. [Google Scholar] [CrossRef]
  3. Morandi, F.; Miniaci, M.; Marzani, A.; Barbaresi, L.; Garai, M. Standardised acoustic characterisation of sonic crystals noise barriers: Sound insulation and reflection properties. Appl. Acoust. 2016, 114, 294–306. [Google Scholar] [CrossRef]
  4. Fusaro, G.; Yu, X.; Cui, F.; Kang, J. Development of a metamaterial for acoustic and architectonical improvement of window design. In Proceedings of the Proceedings of the 23rd International Congress on Acoustics: Integrating 4th EAA Euroregio 2019, Aachen, Germany, 9–13 September 2019; pp. 1977–1983. [Google Scholar] [CrossRef]
  5. Bull, J.; Watts, G.; Pearse, J. The use of in-situ test method EN 1793-6 for measuring the airborne sound insulation of noise barriers. Appl. Acoust. 2017, 116, 82–86. [Google Scholar] [CrossRef]
  6. Ministry of the Environment. Criteri Ambientali Minimi per l’Affidamento del Servizio di Progettazione di Interventi Edilizi, per l’Affidamento dei Lavori per Interventi Edilizi e per l’Affidamento Congiunto di Progettazione e Lavori per Interventi Edilizi, (Ministry of the Environment Decree 23 November 2022, Minimum Environmental Criteria for the Assignment of the Design Service for Building Interventions, for the Assignment of Works for Building Interventions and for the Joint Assignment of Design and Works for Building Interventions; G.U. n. 83 del 06/08/2022; GU: Naples, Italy, 2022.
  7. Alves, S.; Altreuther, B.; Scheuren, J.; Kropp, W.; Forssén, J. Urban Sound Planning—The SONORUS Project; Chalmers University of Technology: Göteborg, Sweden, 2016; ISBN 9789163918599. [Google Scholar]
  8. Kang, J.; Aletta, F.; Gjestland, T.T.; Brown, L.A.; Botteldooren, D.; Schulte-Fortkamp, B.; Lercher, P.; van Kamp, I.; Genuit, K.; Fiebig, A.; et al. Ten questions on the soundscapes of the built environment. Build. Environ. 2016, 108, 284–294. [Google Scholar] [CrossRef]
  9. Aguilar, R.; Flacke, J.; Simon, D.; Pfeffer, K. Stakeholders Engagement in Noise Action Planning Mediated by OGITO: An Open Geo-Spatial Interactive Tool. J. Urban Technol. 2023, 30, 23–46. [Google Scholar] [CrossRef]
  10. Fredianelli, L.; Del Pizzo, A.; Licitra, G. Recent developments in sonic crystals as barriers for road traffic noise mitigation. Environments 2019, 6, 14. [Google Scholar] [CrossRef]
  11. Dimitrijević, S.M.; García-Chocano, V.M.; Cervera, F.; Roth, E.; Sánchez-Dehesa, J. Sound insulation and reflection properties of sonic crystal barrier based on micro-perforated cylinders. Materials 2019, 12, 2806. [Google Scholar] [CrossRef]
  12. Moheit, L.; Anthis, S.; Heinz, J.; Kronowetter, F.; Marburg, S. Analysis of scattering by finite sonic crystals in free field with infinite elements and normal modes. J. Sound Vib. 2020, 476, 115291. [Google Scholar] [CrossRef]
  13. Yu, B.; Jiao, L.; Ni, F.; Yang, J. Long-term field performance of porous asphalt pavement in China. Road Mater. Pavement Des. 2015, 16, 214–226. [Google Scholar] [CrossRef]
  14. Vaitkus, A.; Andriejauskas, T.; Vorobjovas, V.; Jagniatinskis, A.; Fiks, B. Asphalt wearing course optimization for road traffic noise reduction. Constr. Build. Mater. 2017, 152, 345–356. [Google Scholar] [CrossRef]
  15. Behzad, M.; Hodaei, M.; Alimohammadi, I. Experimental and numerical investigation of the effect of a speed bump on car noise emission level. Appl. Acoust. 2007, 68, 1346–1356. [Google Scholar] [CrossRef]
  16. De Salvio, D.; D’Orazio, D. Effectiveness of acoustic treatments and PA redesign by means of student activity and speech levels. Appl. Acoust. 2022, 194, 108783. [Google Scholar] [CrossRef]
  17. Bellucci, P.; Ciarallo, F.; Garai, M.; Masoero, M.; Peruzzi, L.; Praticò, F. On the sustainability of noise mitigation measures. In Proceedings of the 10th Convention of the European Acoustics Association, Torino, Italy, 11–15 September 2023. [Google Scholar]
  18. Guidorzi, P.; Garai, M. A Low-Cost System for Quick Measurements on Noise Barriers in Situ. IEEE Trans. Instrum. Meas. 2022, 71, 1–14. [Google Scholar] [CrossRef]
  19. Guidorzi, P.; Garai, M. Repeatability of the European Standardized Method for Measuring Sound Reflection and Sound Insulation of Noise Barriers. Environments 2023, 10, 139. [Google Scholar] [CrossRef]
  20. La Gazzetta Ufficiale. Legge 26 Ottobre 1995; n. 447; GU: Naples, Italy, 1995; pp. 1–12.
  21. Ministry of the Environment. Determinazione dei Valori Limite delle Sorgenti Sonore, G.U. n. 280 del 1/12/1997 (Prime Ministerial Decree 14 November 1997, Determination of Limit Values of Sound Sources; Official Gazette n. 280 of 1/12/1997; GU: Naples, Italy, 1997.
  22. Gabellini, P.; Uguccioni, L.; Diolaiti, R. Classificazione Acustica del Territorio Comunale. Norme Tecniche di Attuazione (Acoustic Classification of the Municipal Territory. Technical Implementation Standards); Studio Alfa Srl: Reggio Emilia, Italy, 2015; pp. 1–18. [Google Scholar]
  23. Ministry of the Environment. Tecniche di Rilevamento e di Misurazione dell’Inquinamento Acustico (Ministry of the Environment Decree 16 March 1998, Techniques for Detection and Measurement of Noise Pollution); Official Gazette n.76 of 04/0; GU: Naples, Italy, 1998.
  24. Desarnaulds, V.; Monay, G.; Carvalho, A. Noise reduction by urban traffic management. In Proceedings of the ICA 2004: 18th International Congress on Acoustics, Kyoto, Japan, 4–9 April 2004; pp. 2–5. [Google Scholar]
  25. Lou, K.; Xiao, P.; Kang, A.; Wu, Z.; Dong, X. Effects of asphalt pavement characteristics on traffic noise reduction in different frequencies. Transp. Res. Part D Transp. Environ. 2022, 106, 103259. [Google Scholar] [CrossRef]
  26. Takahashi, S. Comprehensive study on the porous asphalt effects on expressways in Japan: Based on field data analysis in the last decade. Road Mater. Pavement Des. 2013, 14, 239–255. [Google Scholar] [CrossRef]
  27. European Commission. Guidebook to Noise Reducing Devices Optimisation Theme 7: Transport; European Commission: Brussels, Belgium, 2011. [Google Scholar]
  28. Iannace, G.; Ciaburro, G.; Trematerra, A. Metamaterials acoustic barrier. Appl. Acoust. 2021, 181, 108172. [Google Scholar] [CrossRef]
  29. Sánchez-Dehesa, J.; Garcia-Chocano, V.M.; Torrent, D.; Cervera, F.; Cabrera, S.; Simon, F. Noise control by sonic crystal barriers made of recycled materials. J. Acoust. Soc. Am. 2011, 129, 1173–1183. [Google Scholar] [CrossRef]
  30. Romero-García, V.; Krynkin, A.; Garcia-Raffi, L.M.; Umnova, O.; Sánchez-Pérez, J.V. Multi-resonant scatterers in sonic crystals: Locally multi-resonant acoustic metamaterial. J. Sound Vib. 2013, 332, 184–198. [Google Scholar] [CrossRef]
  31. Redondo, J.; Ramírez-Solana, D.; Picó, R. Increasing the Insertion Loss of Sonic Crystal Noise Barriers with Helmholtz Resonators. Appl. Sci. 2023, 13, 3662. [Google Scholar] [CrossRef]
  32. Qin, X.; Ni, A.; Chen, Z.; Fang, M.; Li, Y. Numerical modeling and field test of sonic crystal acoustic barriers. Environ. Sci. Pollut. Res. 2023, 30, 16289–16304. [Google Scholar] [CrossRef] [PubMed]
  33. Maekawa, Z. Noise reduction by screens. Appl. Acoust. 1968, 1, 157–173. [Google Scholar] [CrossRef]
  34. Fujiwara, K.; Ando, Y.; Maekawa, Z. Noise control by barriers-Part 1: Noise reduction by a thick barrier. Appl. Acoust. 1977, 10, 147–159. [Google Scholar] [CrossRef]
  35. Kurze, U.J.; Anderson, G.S. Sound attenuation by barriers. Appl. Acoust. 1971, 4, 35–53. [Google Scholar] [CrossRef]
  36. Marburg, S.; Nolte, B. Computational Acoustics of Noise Propagation in Fluids: Finite and Boundary Element Methods; Springer: New York, NY, USA, 2008. [Google Scholar]
  37. ISO 1996-2-2017; Acoustics-Description, Measurement And Assessment Of Environmental Noise-Part 2: Determination of Sound Pressure Levels. ISO: Geneva, Switzerland, 2017.
  38. Fusaro, G.; D’Auria, S.; D’Orazio, D. Multiphysical numerical analysis for acoustic metamaterials in ventilated ducts. In Proceedings of the Internoise 2023, Chiba, Japan, 20–23 August 2023; pp. 7–8. [Google Scholar]
  39. Liu, C.; Zang, Q.; Li, J.; Pan, X.; Dai, H.; Gao, W. The effect of the acoustic environment of learning spaces on students’ learning efficiency: A review. J. Build. Eng. 2023, 79, 107911. [Google Scholar] [CrossRef]
Figure 1. Historical evolution of the area near Terracini Street in the Navile District. The yellow areas represent the actual road infrastructures, including Terracini Street. The red line outlines the boundary of the parcel of land related to the university facilities where the measurements took place.
Applsci 14 01837 g001
Figure 2. Measurement points in the studied area near Terracini Street in Bologna. The area of study (university area and nearby streets) is highlighted in yellow.
Applsci 14 01837 g002
Figure 3. Measured noise levels at measurement Point 2. They are distinct for daytime (06:00–22:00) and nighttime (22:00–06:00).
Applsci 14 01837 g003
Figure 4. Measured noise levels on a representative full day. They are distinct for daytime (06:00–22:00) and nighttime (22:00–06:00) and for the four measurement points (1 to 4). The red dashed lines represent the noise limits imposed by the Italian Regulation.
Applsci 14 01837 g004
Figure 5. Schematic for the noise barrier’s pre-dimensioning using the Kurze–Anderson formula to determine the effective height, heff, given the target insertion loss [35].
Applsci 14 01837 g005
Figure 7. Schematic of the 2D numerical setup and the boundary conditions of section A (representative for all the sections analysed) with H = 5 m, A = 13.1 m, A1 = 7 m, and B = 22 m. The red line represents the free-field sound propagation conditions simulated by a hemispherical domain, while the blue line highlights the rigid body boundary condition on the building’s external surfaces. The circles, namely S1, S2, S3, and S4, are the four sources reproducing the four street lanes within the section and distant d = 3.5 m from each other. R is the receiving point.
Applsci 14 01837 g007
Figure 8. Schematic of the sonic crystal layout as in Morandi et al. A three-row SCAB is considered with cylinder radius r = 0.08 m, cylinder wall thickness t = 3.2 mm, scatterer spacing s = 0.4 m, both in the horizontal and vertical direction, and filling fraction ff = 50% [3].
Applsci 14 01837 g008
Figure 9. Spatial distribution of SPL based on the FEM 2D analysis of sections A (first row) and B (second row) at 1 kHz; left column: without the noise barrier; right column: with the noise barrier.
Applsci 14 01837 g009
Figure 10. Spatial distribution of SPL based on the FEM 2D analysis of sections C (first row) and D (second row) at 1 kHz; left column: without the noise barrier; right column: with the noise barrier.
Applsci 14 01837 g010
Figure 11. A-weighted IL spectrum between 200 Hz and 1 kHz in section A, as calculated in the FEM 2D analysis, considering the A-weighted SPL with and without the placement of the noise mitigation measures (noise barrier from ref. [3] and low-noise asphalt from model 2–5 in ref. [25]).
Applsci 14 01837 g011
Figure 12. Schematic representation of the noise barrier project within the area under study.
Applsci 14 01837 g012
Figure 13. Rendering of the SCAB applied at the entrance of the University of Bologna, School of Engineering, from Terracini Street. The inset shows the metallic structure designed to hold the PMMA cylinders in place.
Applsci 14 01837 g013
Table 1. Evolution of the Italian regulations on environmental noise (including noise barriers): Framework Law 26 October 1995, n. 447 and its implementing decrees. D.M stands for Ministry of Environment Decree, D.P.C.M. stands for Decree of the President of the Council of Ministers, D.P.R stands for Decree of the President of the Republic, and D. Lgs. stands for Legislative Decree.
Decrees Implementing the Framework Law on Noise Pollution 26 October 1995, n. 447
D.M. 11 December 1996Application of the differential criteria for continuous productive cycle plants
D.P.C.M. 14 November 1997Determination of the limit values of the noise sources according to different urban areas
D.P.C.M. 5 December 1997Determination of passive acoustic requirements of buildings (sound insulation of internal partitions and façades, impact noise on floors, and service equipment noise)
D.M. 31 October 1997Methodology for measuring airport noise
D.P.R. 11 December 1997, n. 496Rules for a reduction in noise pollution produced by civil aircraft
D.M. 16 March 1998Techniques for detecting and measuring noise pollution (measuring equipment, reference times, correction for impulsive or tonal noise, rules for road traffic and rail traffic noise, etc.)
D.P.C.M. 31 March 1998Act of direction and coordination containing general criteria for the exercise of the activity of the technician competent in acoustics
D.P.R. 18 November 1998, n. 459Noise pollution due to rail traffic
D.M. 3 December 1999Anti-noise procedures and buffer zones at airports
D.P.C.M. 16 April 1999, n. 215Requirements for determining the acoustic requirements of sound sources in places of dancing and public entertainment and in public establishments
D.M. 20 May 1999Criteria for the design of monitoring systems for the control of noise pollution levels near airports, as well as criteria for the classification of airports in relation to the level of noise pollution
D.M. 29 November 2000Criteria for the preparation, by companies and bodies managing public transport services or related infrastructures, of noise containment and abatement intervention plans
D.P.R. 3 April 2001, n. 304Regulation of noise emissions produced during motorsport activities
D.M. 23 November 2001Introduction of systems for the photovoltaic conversion of solar energy on noise barriers
D.P.C.M. 30 March 2004, n. 142Provisions for the prevention of noise pollution caused by road traffic
D. Lgs. 19 August 2005, n. 194Implementation of Directive 2002/49/EC relating to the assessment and management of environmental noise (noise mapping and action plans)
D. Lgs. 17 February 2017, n. 41Provisions for the harmonisation of national legislation on noise pollution with Directive 2000/14/EC and with Regulation (EC) no. 765/2008
D. Lgs. 17 February 2017, n. 42Provisions regarding the harmonisation of national legislation on noise pollution
D.M. 1 June 2022Determination of the criteria for measuring the noise emitted by wind farms and for the containment of related noise pollution
Table 2. Table extracted from the Technical standards of implementation on the acoustic classification of the city of Bologna focusing on university areas [21] (literal translation).
Classes of UseUpper Limit Values
LAeq,dayLAeq,night
Class I (highly protected areas)5040
Class II (predominantly residential areas)5545
Class III (mixed areas)6050
Class IV (areas of intense human activity)6555
Class V (predominantly industrial areas)7060
Class VI (exclusively industrial areas)7070
Table 3. Noise monitoring results. From top to bottom: time frame of the measurements, LAeq, and number of light vehicles, motorcycles, heavy vehicles (weight over 3.5 tons), buses, and airplanes.
ABC
Time frame8:30–9:00 a.m.10:00–10:30 a.m.3:20–3:50 p.m.
LAeq, dB(A)67.367.461.8
Light vehicles821637367
Motorcycles 1287637
Heavy vehicles816343
Buses533
Airplanes211
Total amount of mechanical sound sources monitored1037780451
Table 4. Significant parameters and related values used for dimensioning the noise barriers under study in each section.
SectionILTarget [dB(A)]A [m]B [m]Khmin [m]heff [m]H [m]L [m]
A813.3121.933.53.961.15.06140
B1310.0010.206.51.992.24.19130
C1311.4911.666.55.452.27.65130
D1112.0412.215.05.451.67.05100
Disclaimer/Publisher’s Note: The statements, opinions and data contained in all publications are solely those of the individual author(s) and contributor(s) and not of MDPI and/or the editor(s). MDPI and/or the editor(s) disclaim responsibility for any injury to people or property resulting from any ideas, methods, instructions or products referred to in the content.

