
Analysis of the Impacts of Students Back to School on the Volatility and Reliability of Travel Speed on Urban Road

Abstract
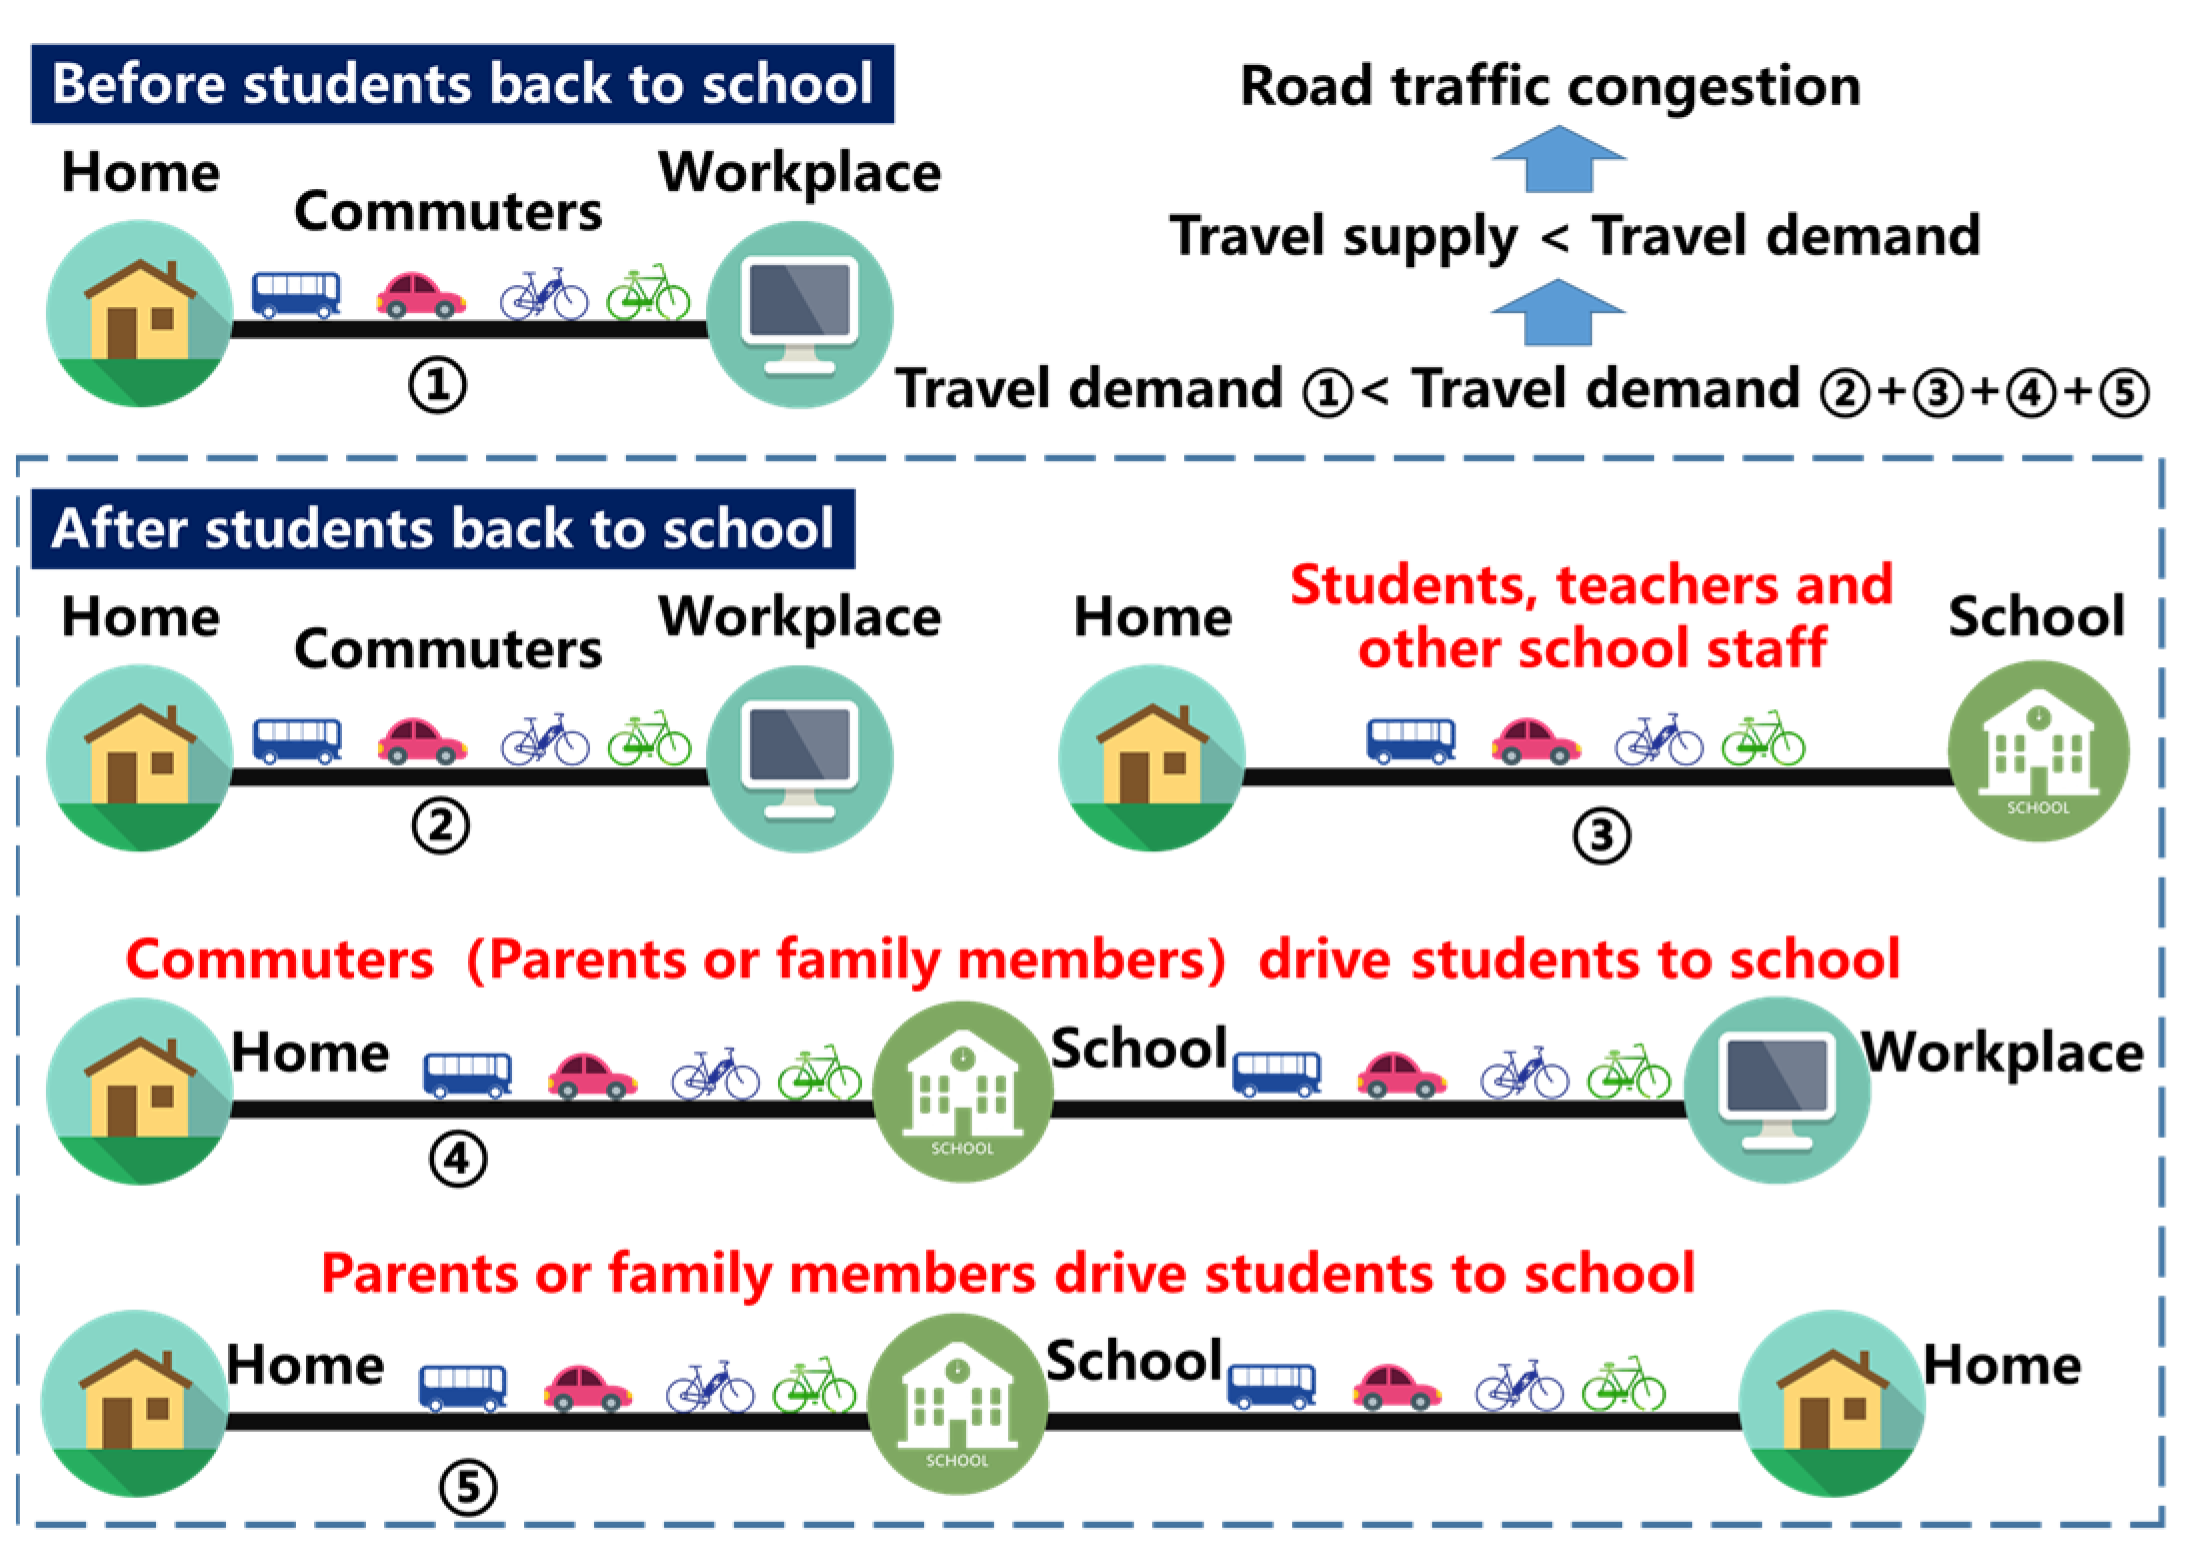
1. Introduction
2. Data Processing
2.1. Data Introduction
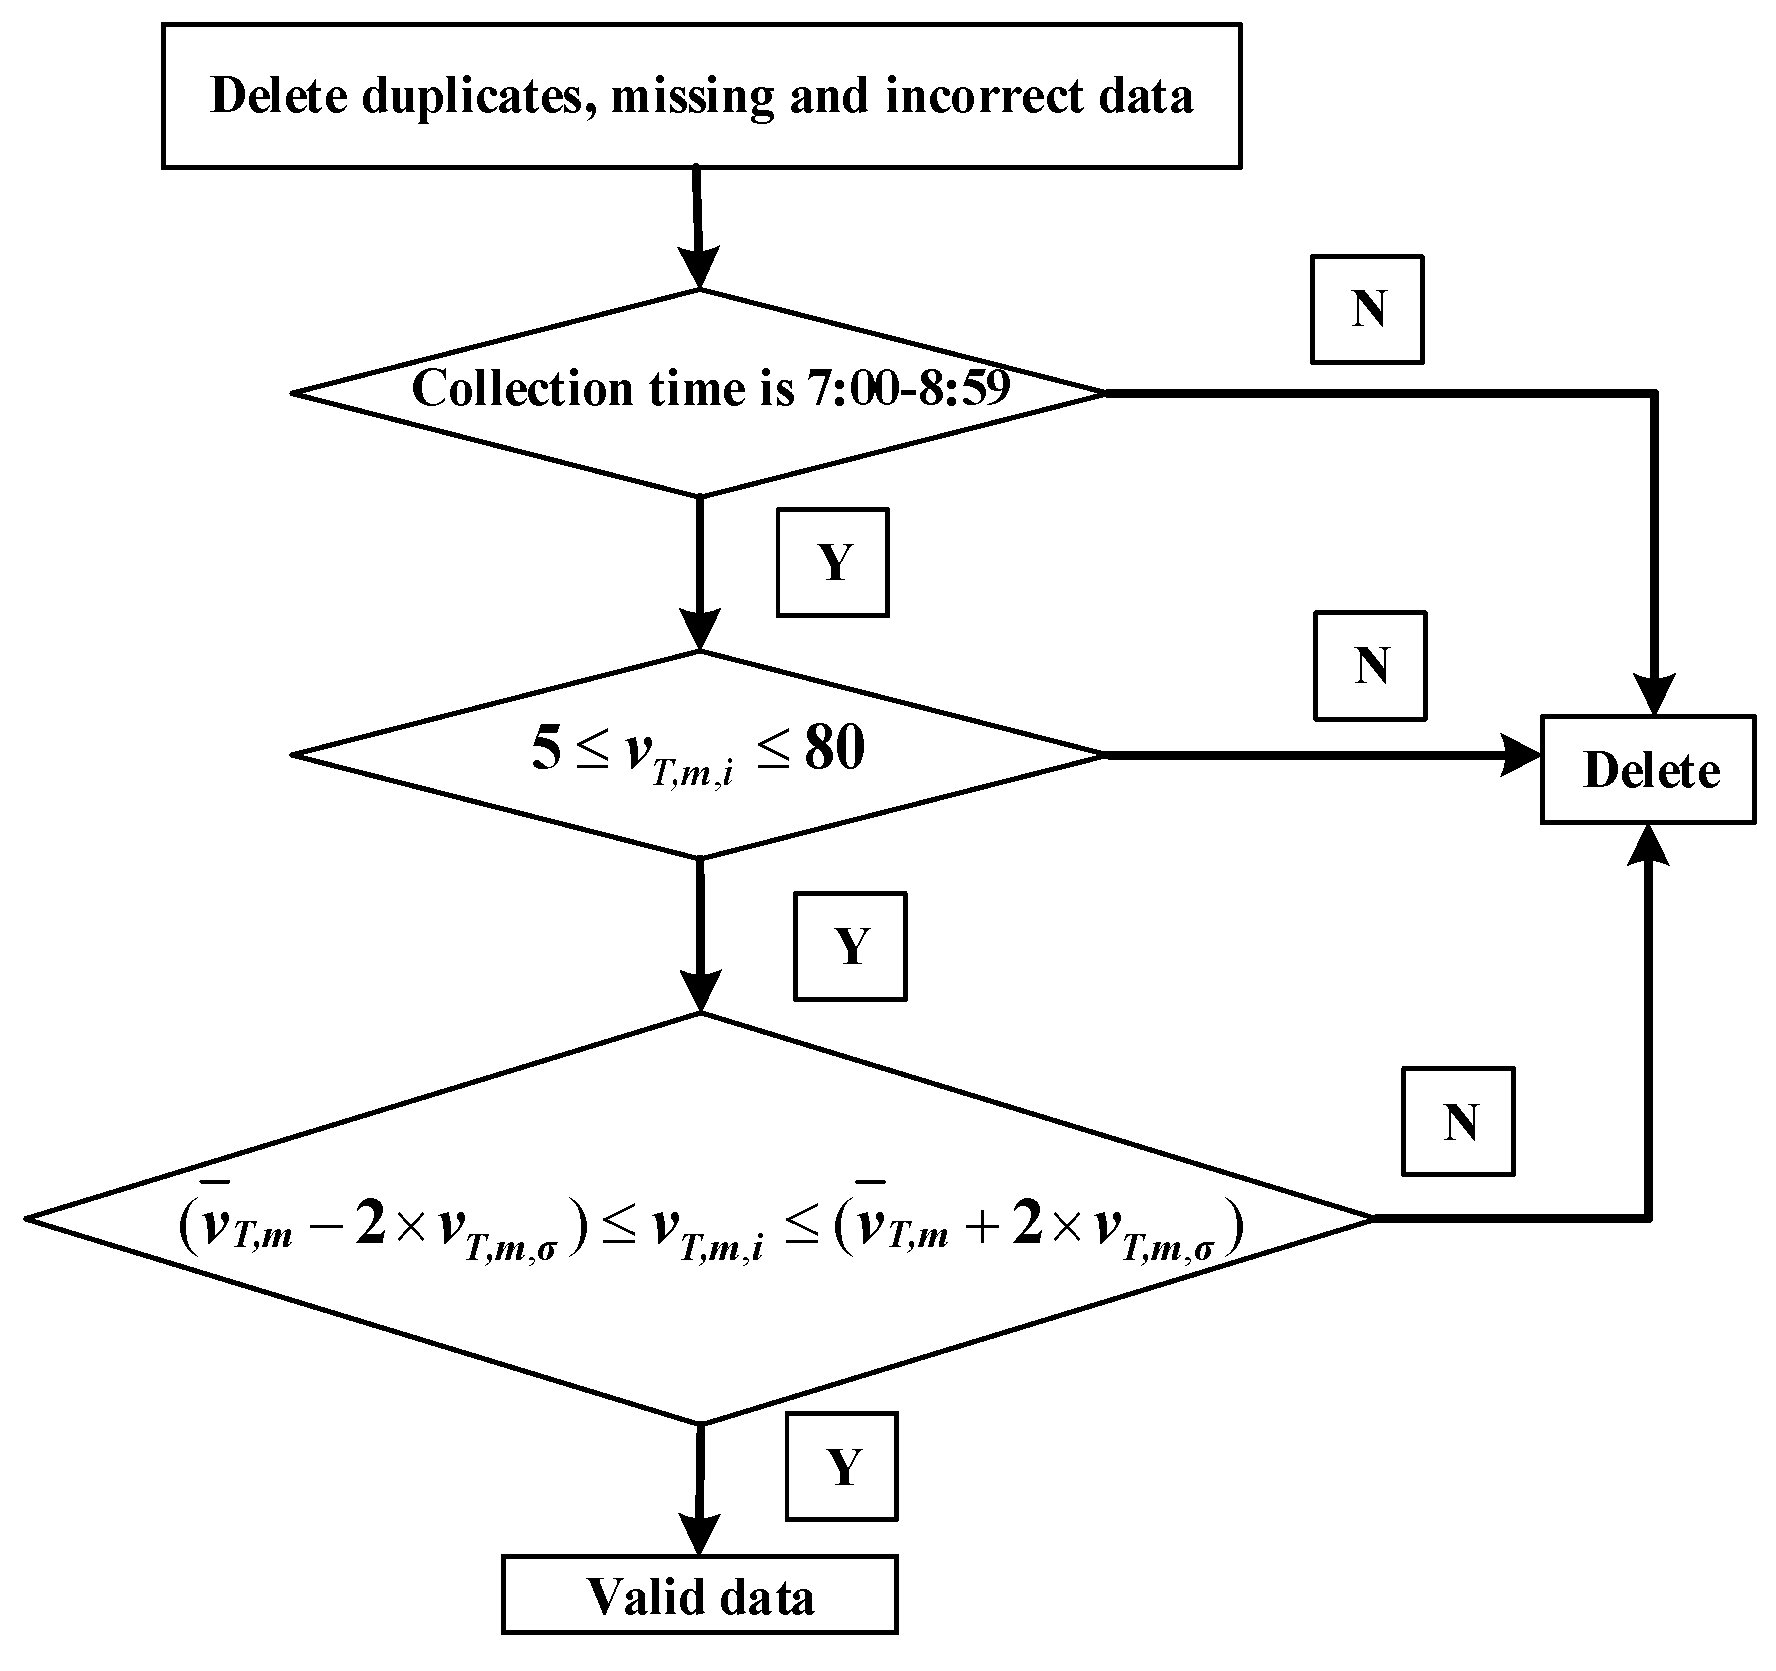
2.2. Data Filtering and Processing
3. Travel Speed Volatility
3.1. Travel Speed Volatility Evaluation Model
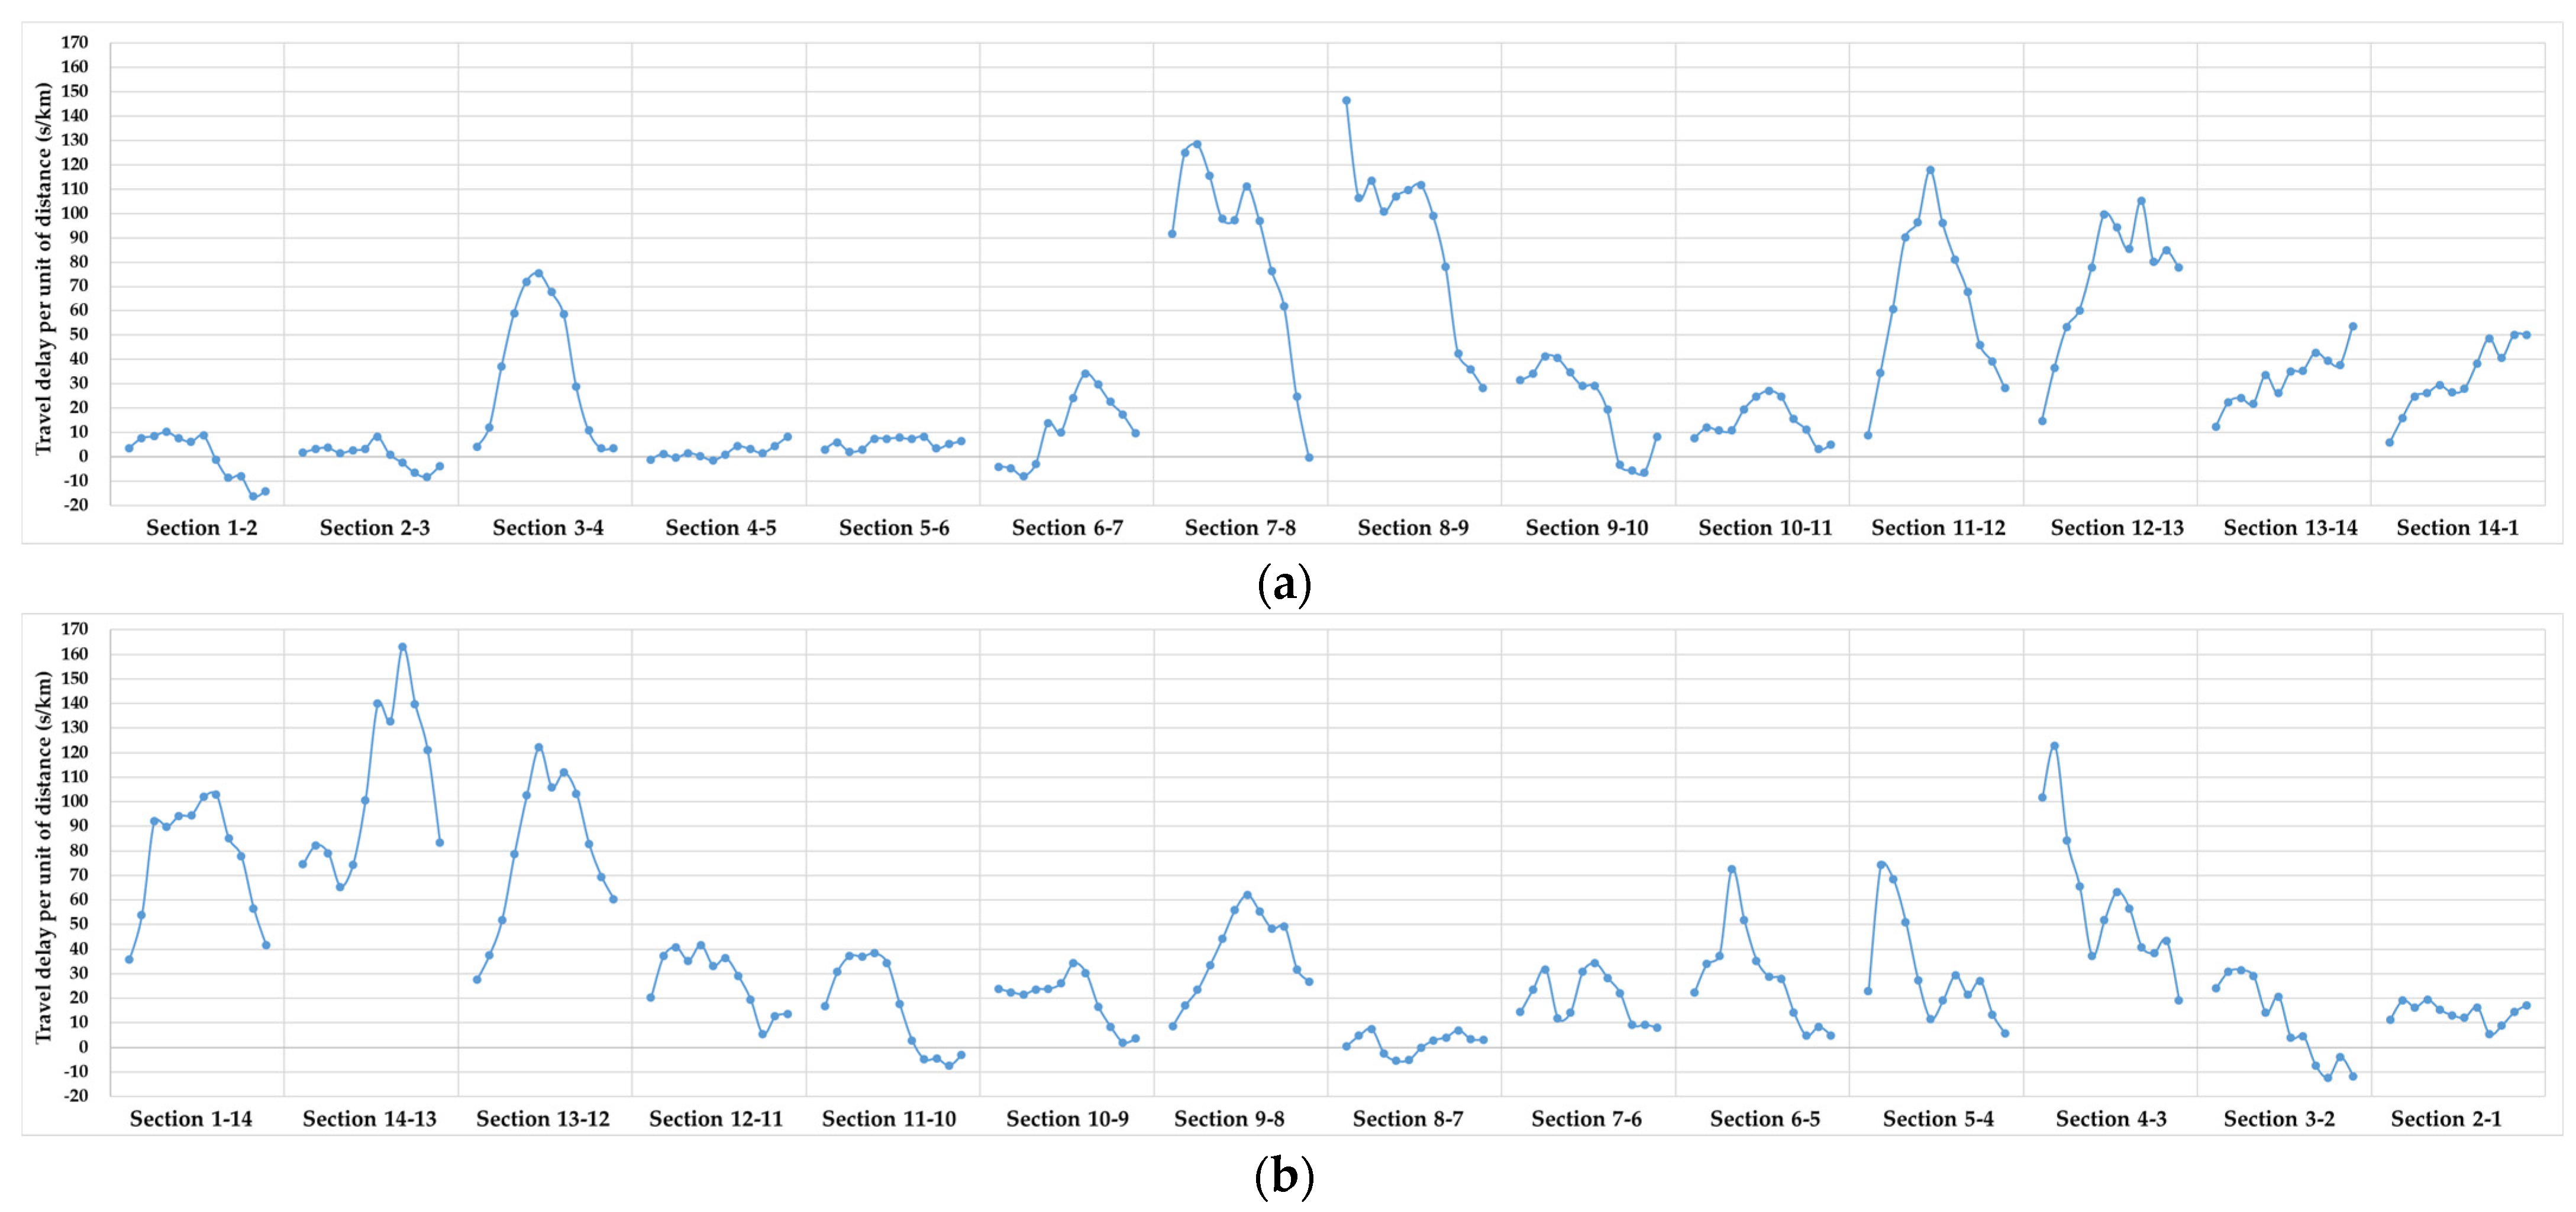
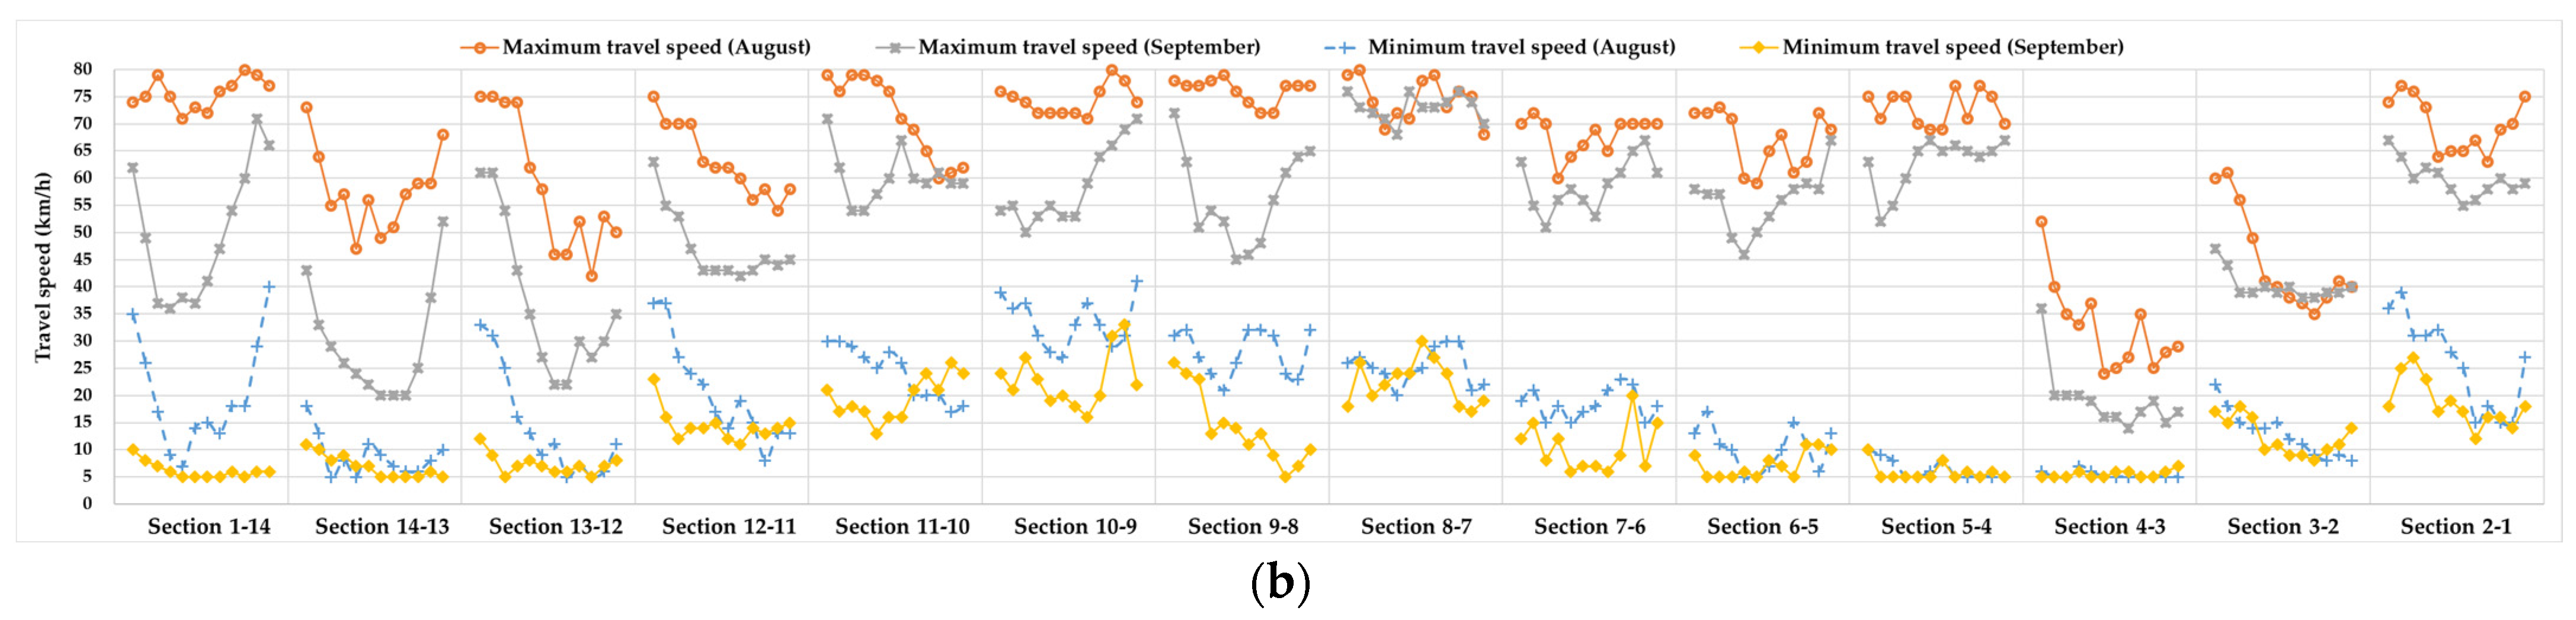
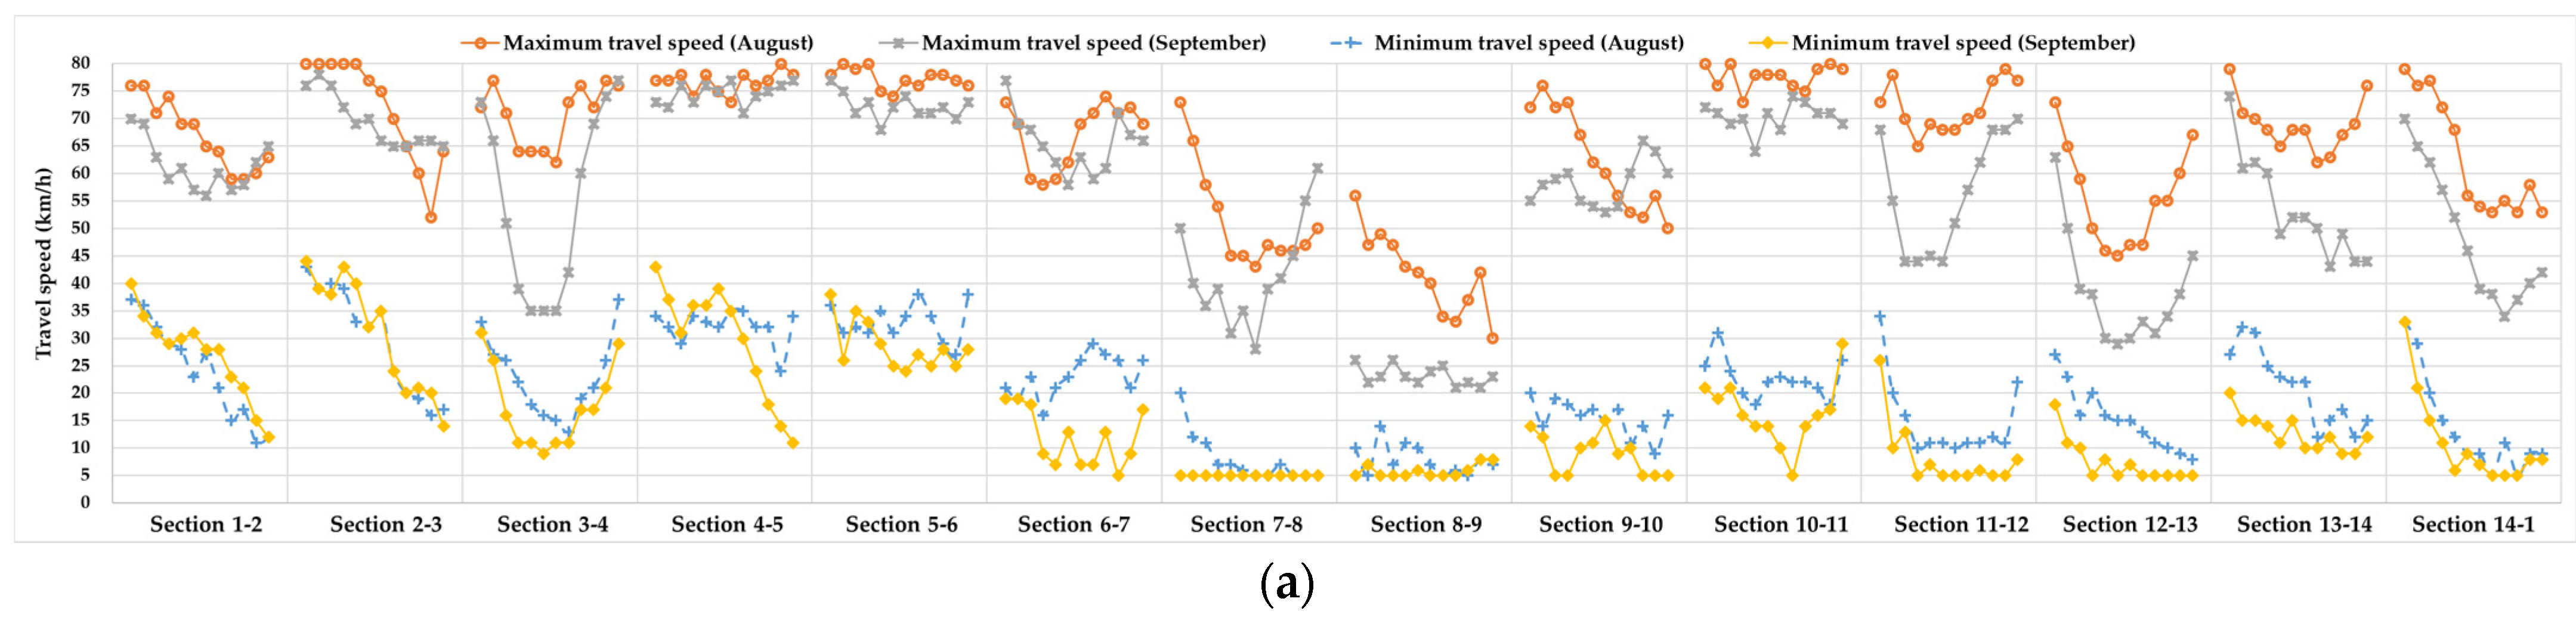
3.2. Analysis of Travel Speed Volatility
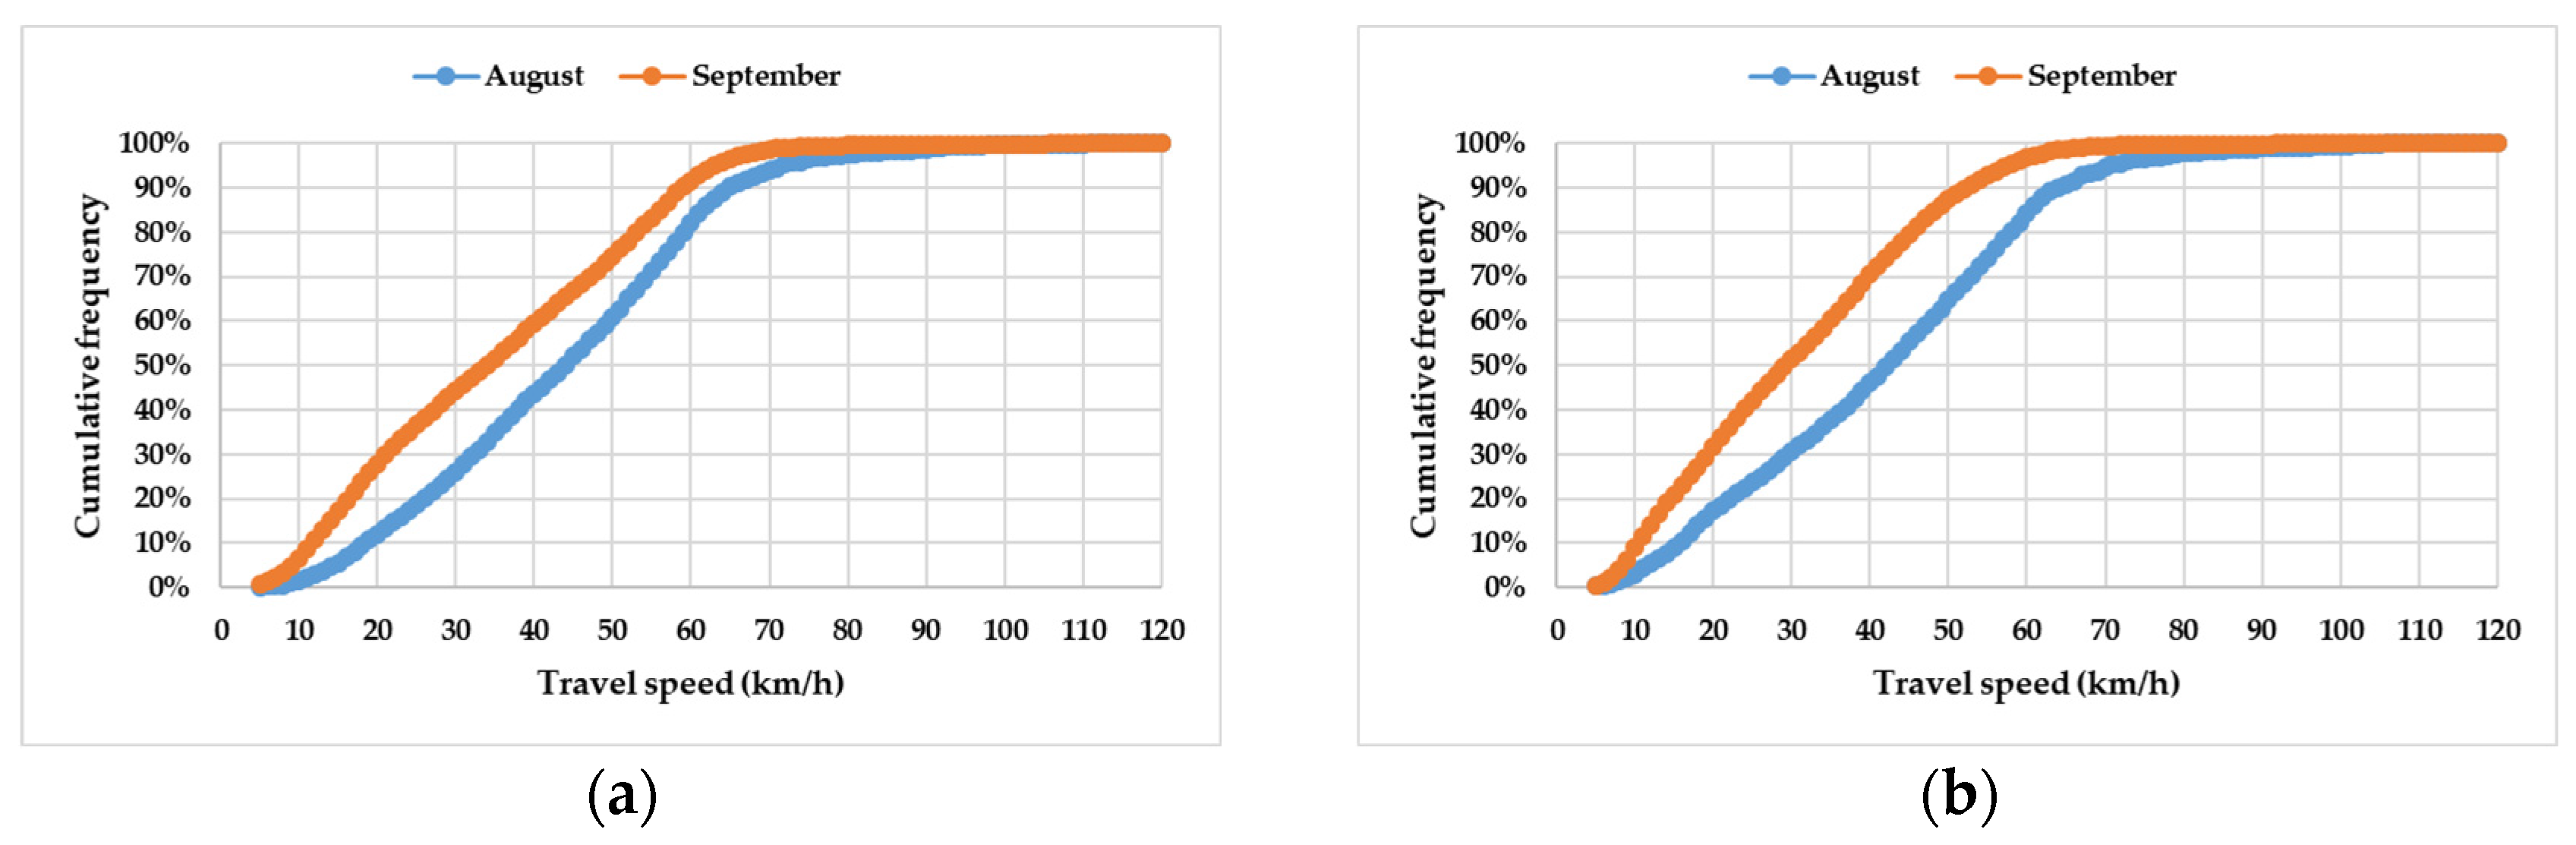
3.2.1. Travel Speed Volatility at Morning Peak
3.2.2. Travel Speed Volatility at 10 min Intervals of Morning Peak
4. Travel Speed Reliability
4.1. Travel Speed Reliability Evaluation Model
- (1)
- Fixed speed value as the travel speed reliability evaluation threshold
- (2)
- Variable speed value (a multiple of the average travel speed of the road segment) as the travel speed reliability evaluation threshold
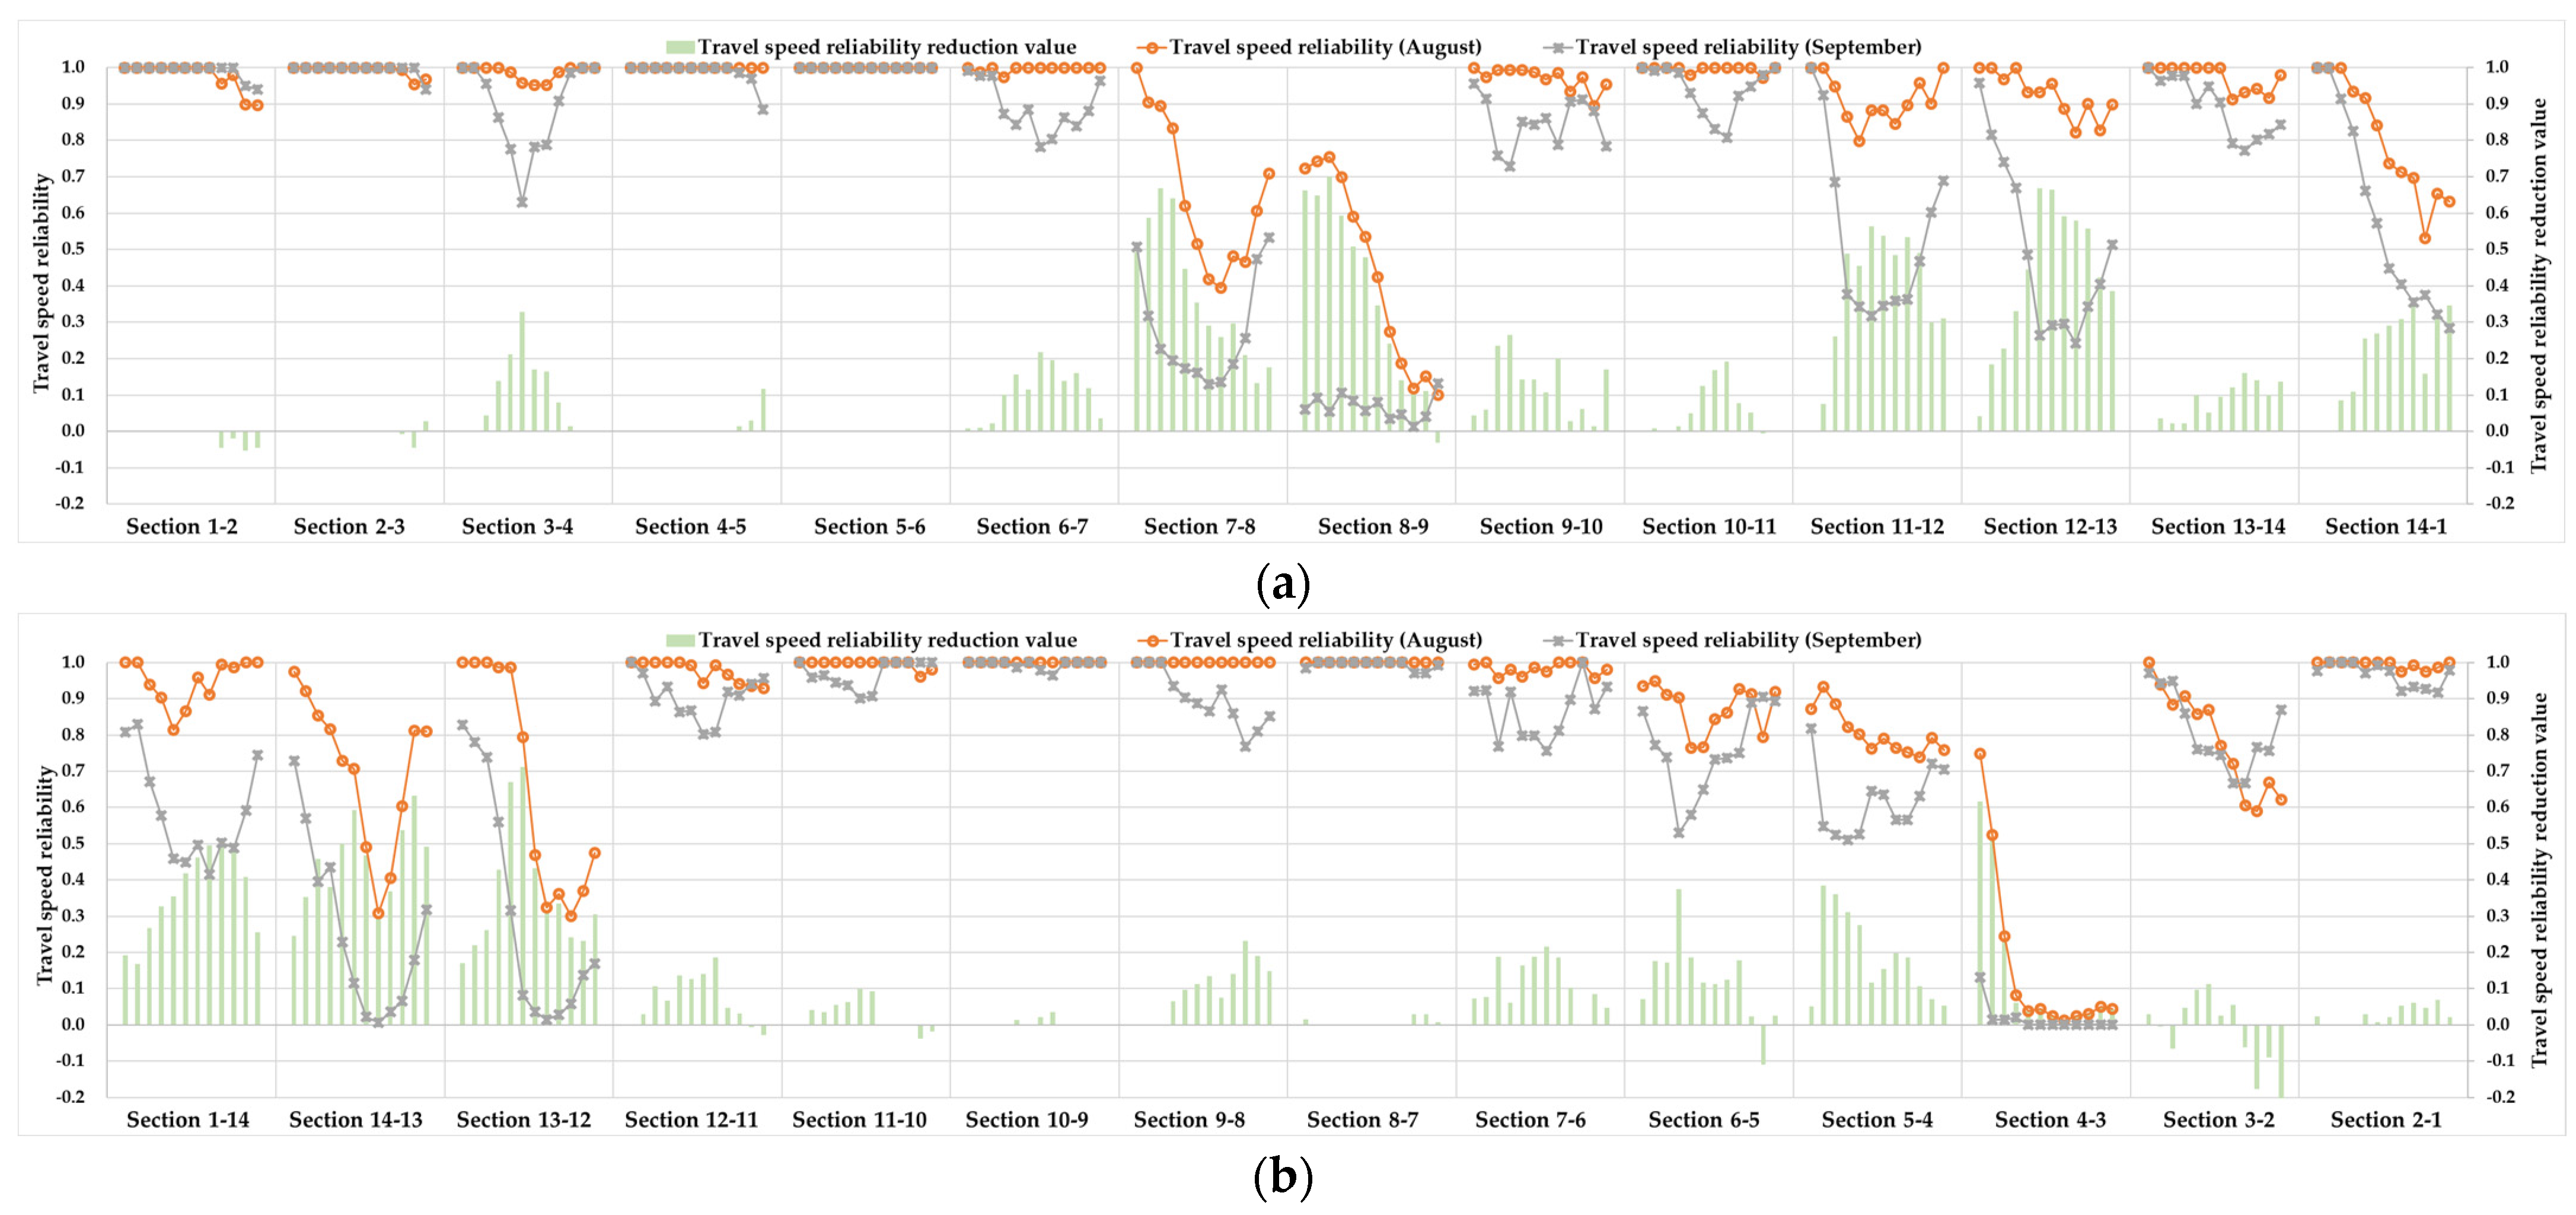
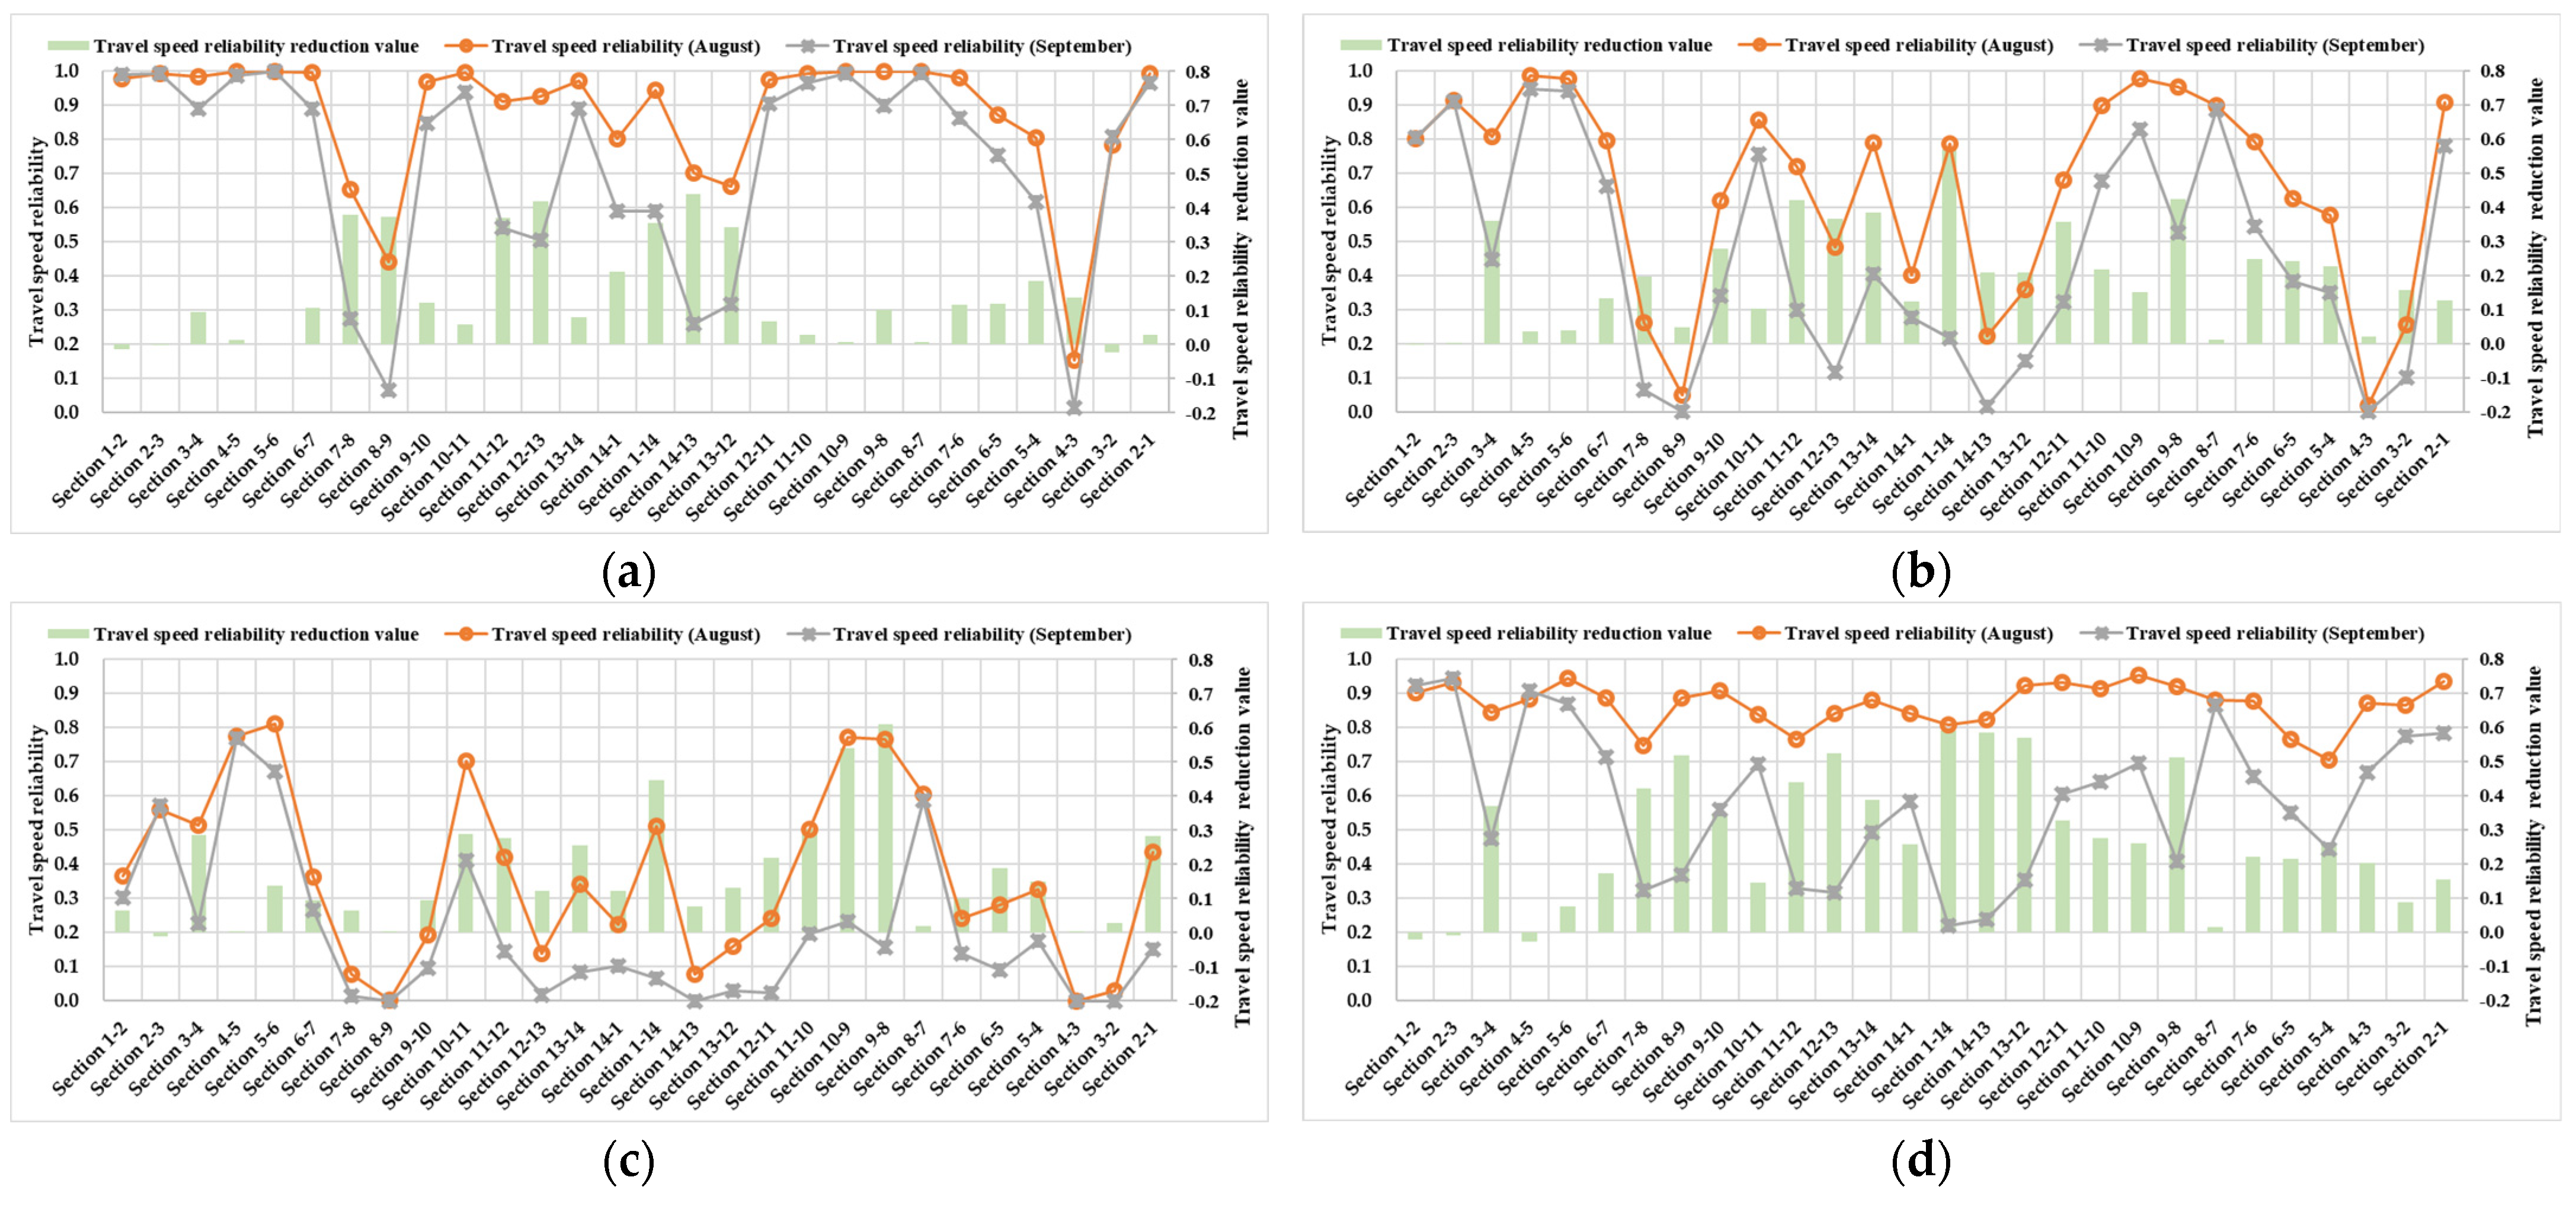
4.2. Analysis of Travel Speed Reliability
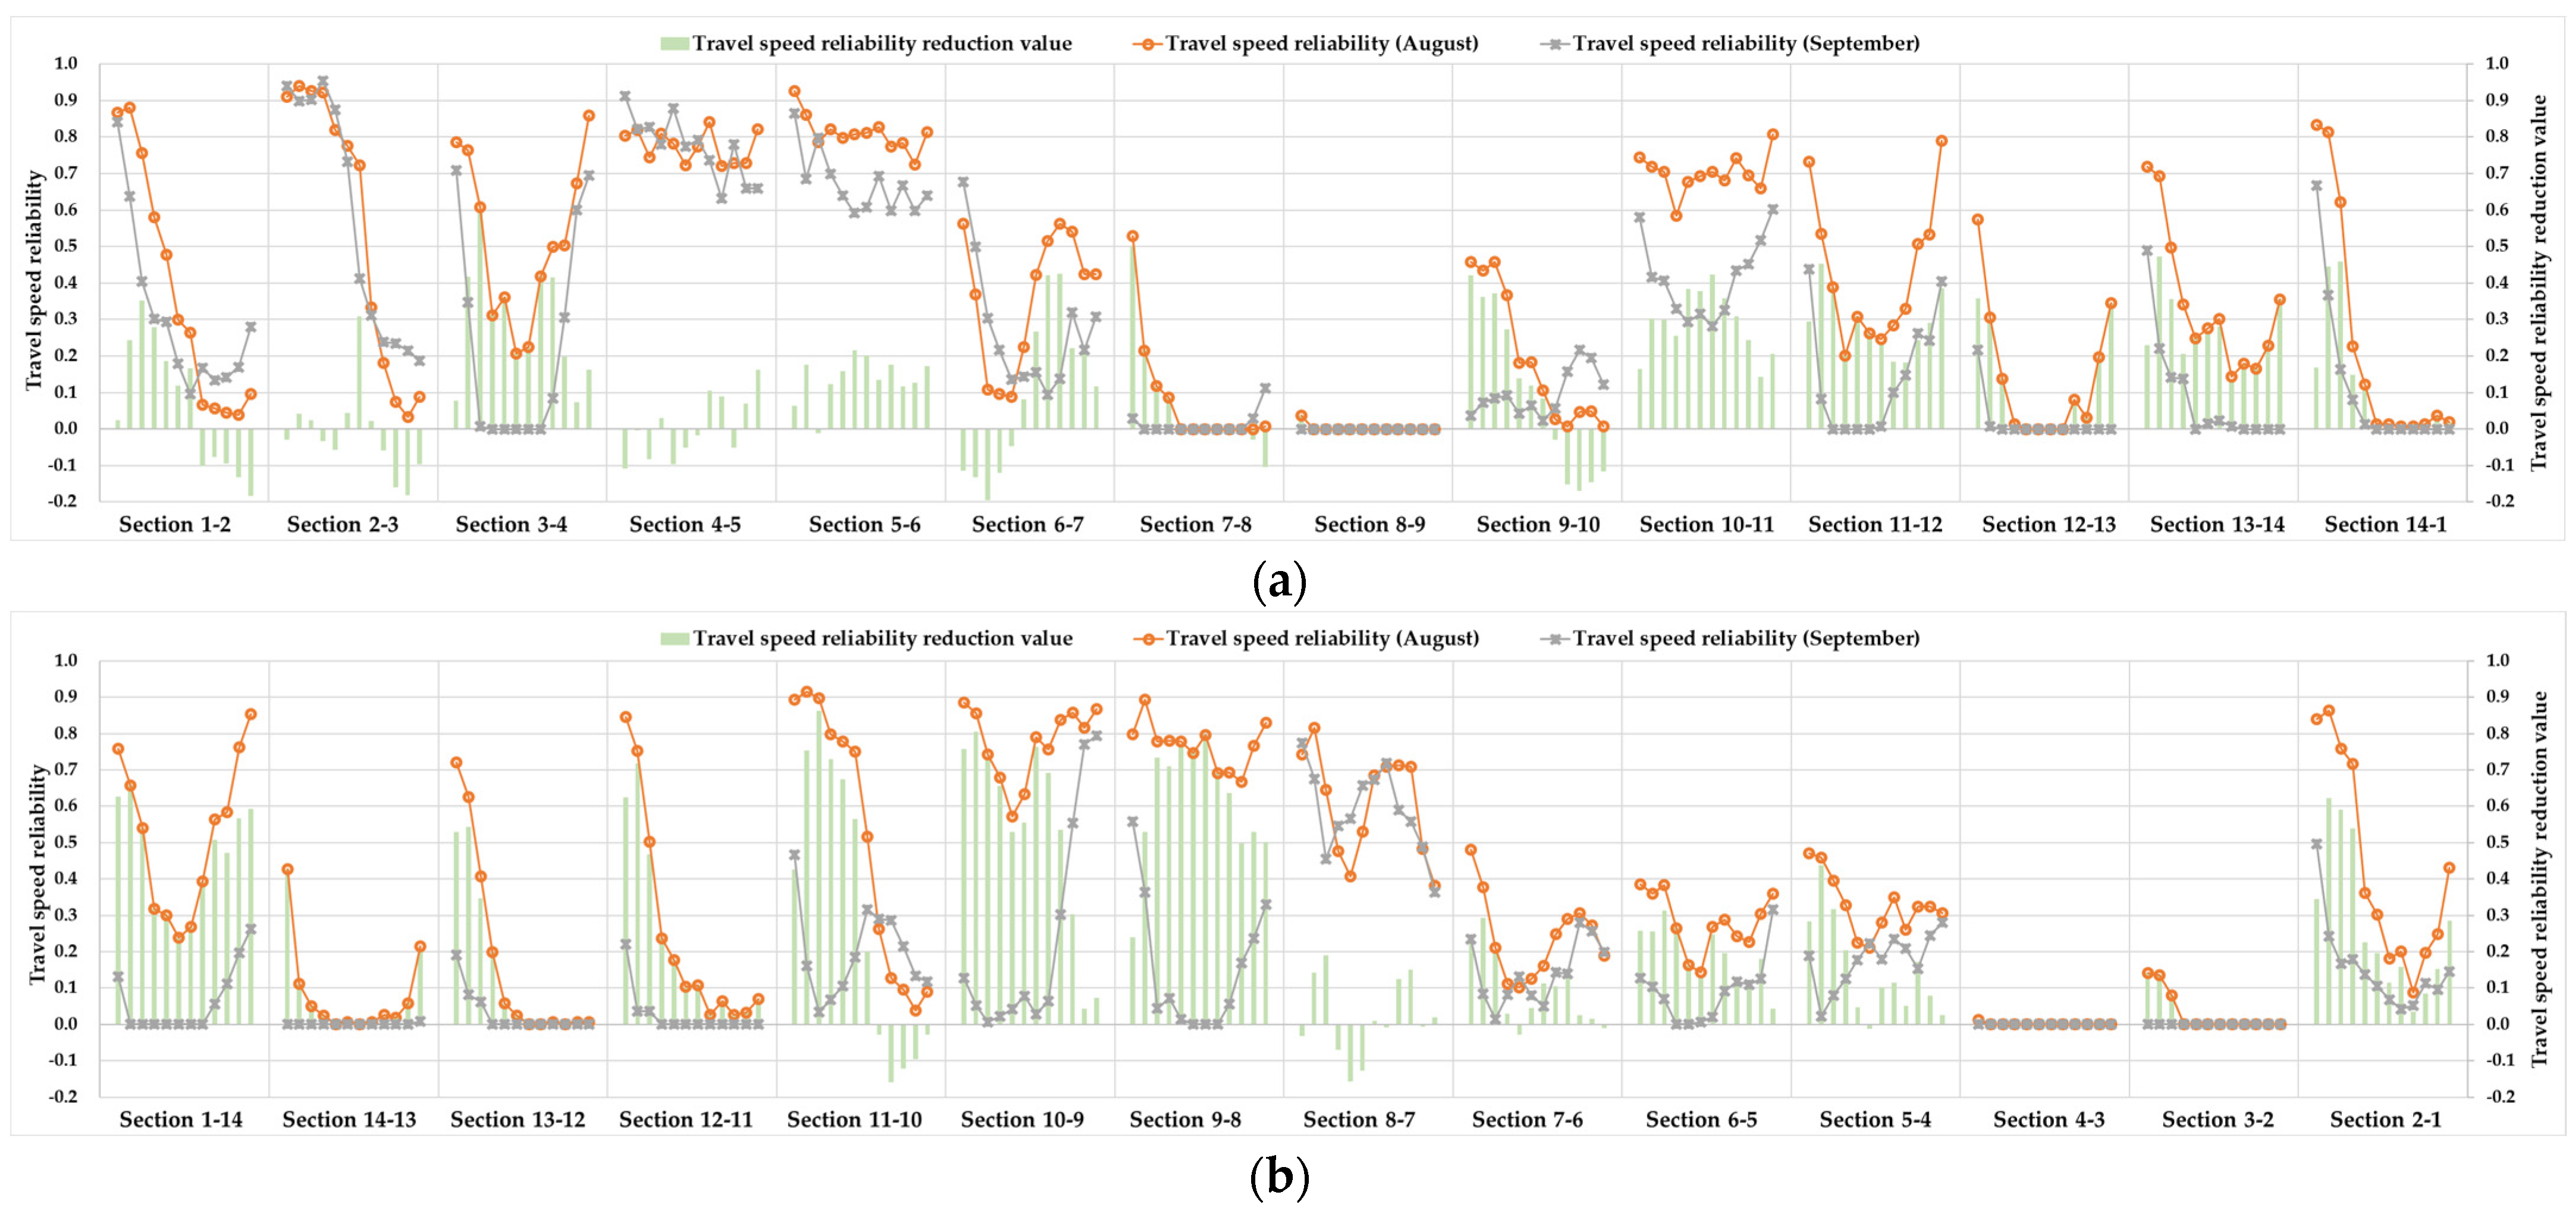
4.2.1. Travel Speed Reliability at Morning Peak
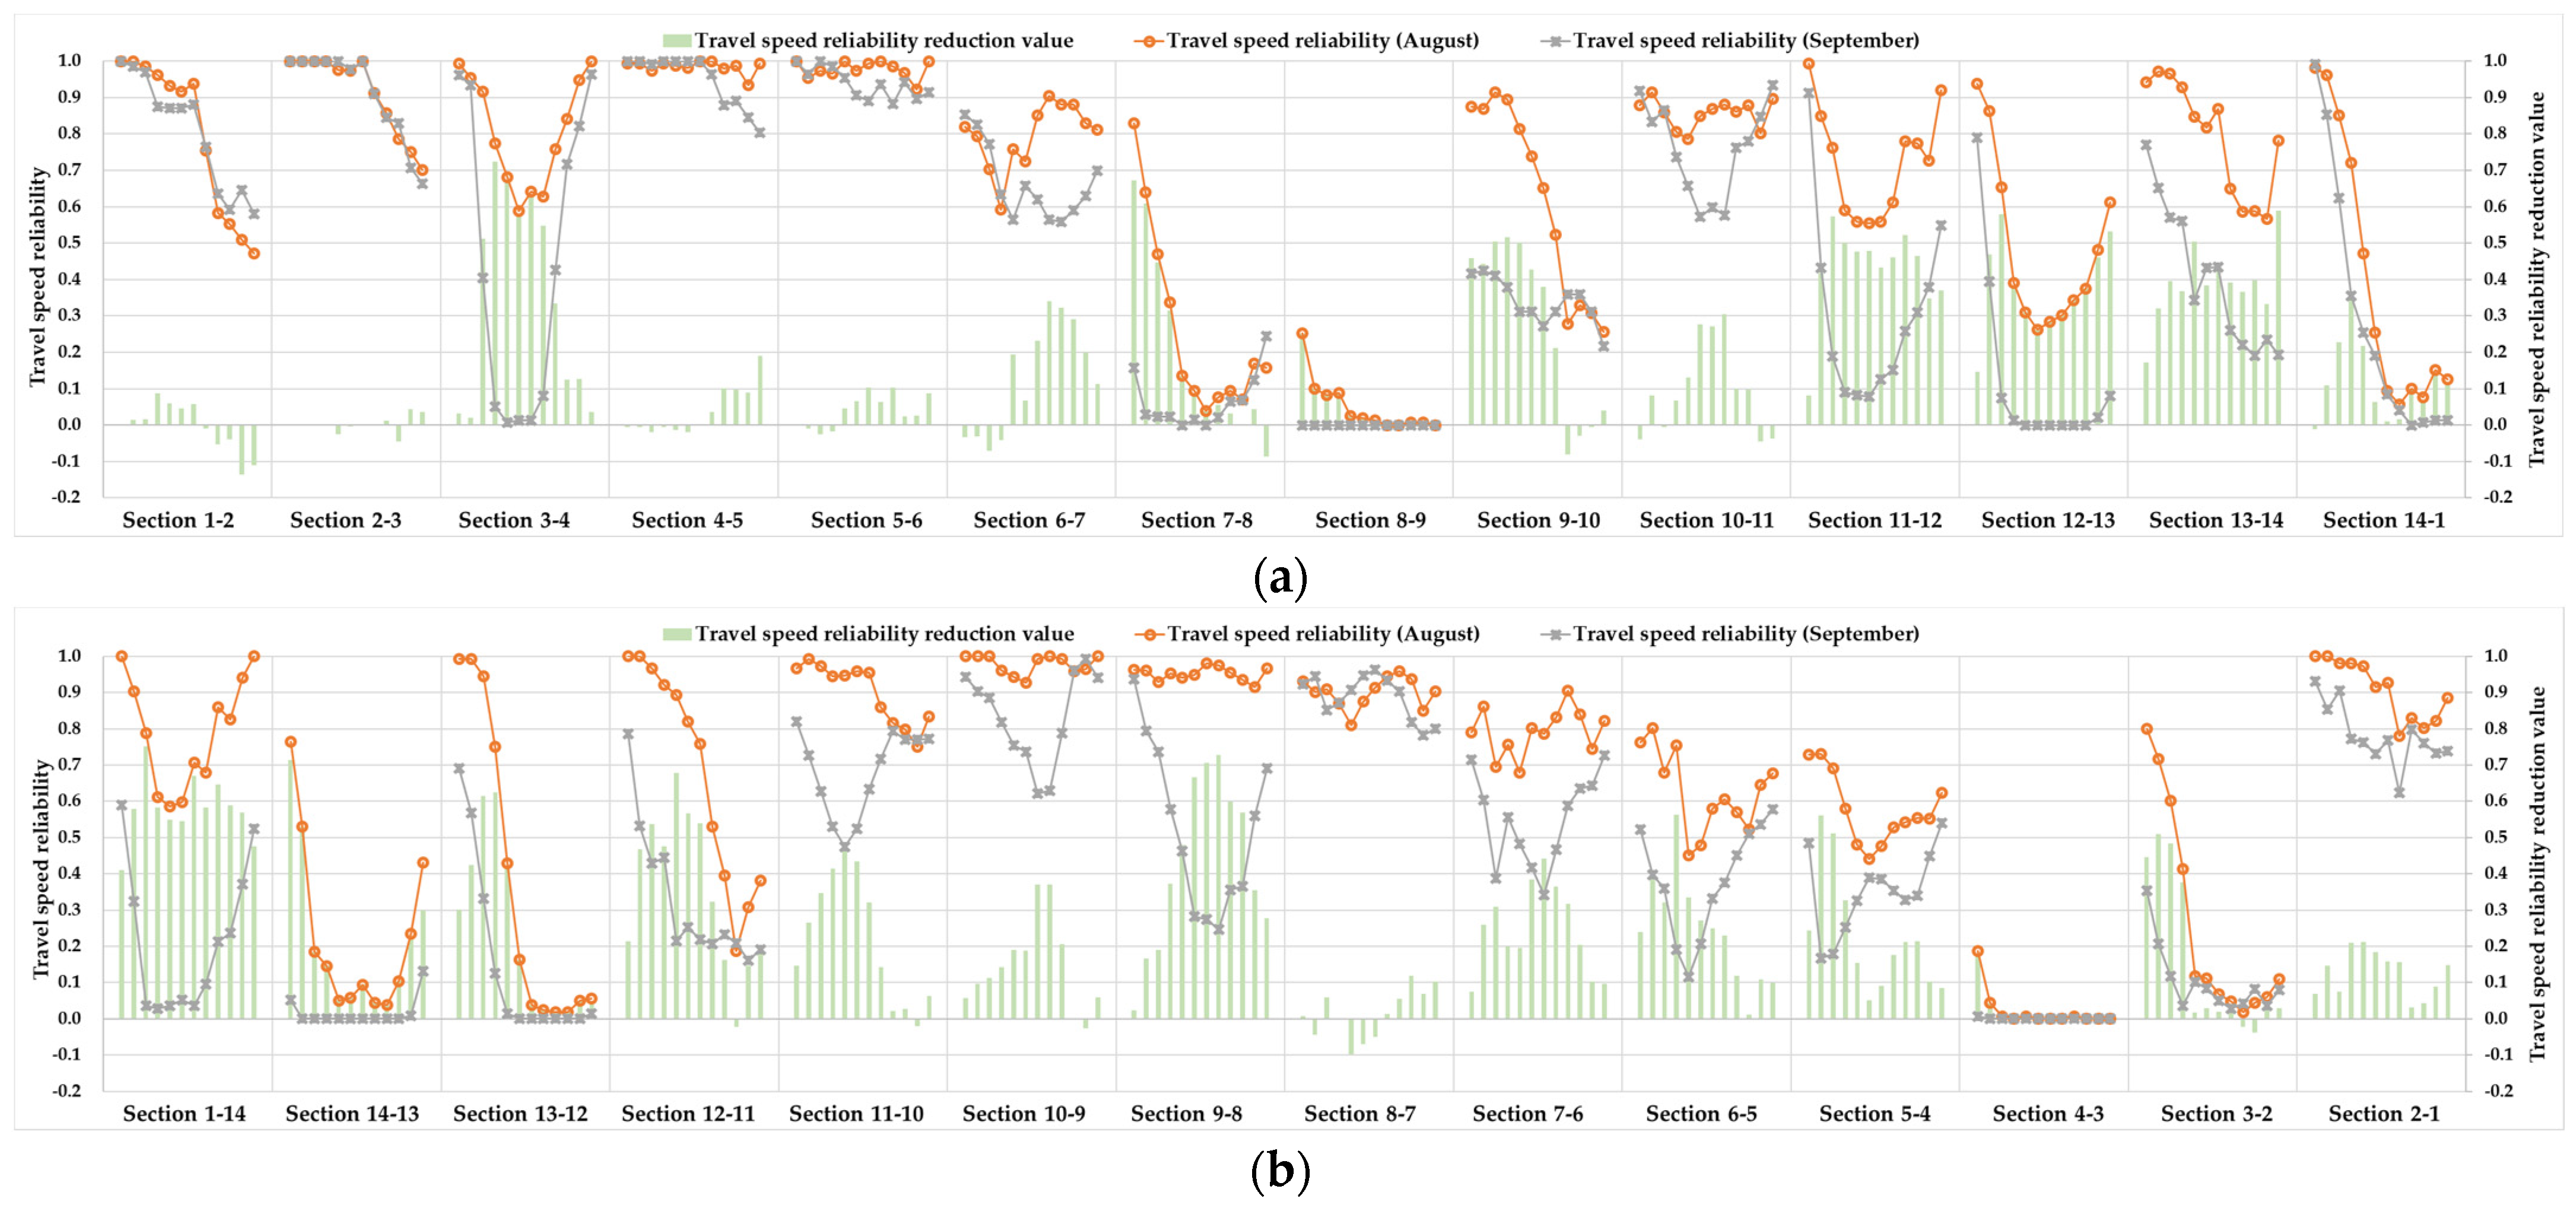
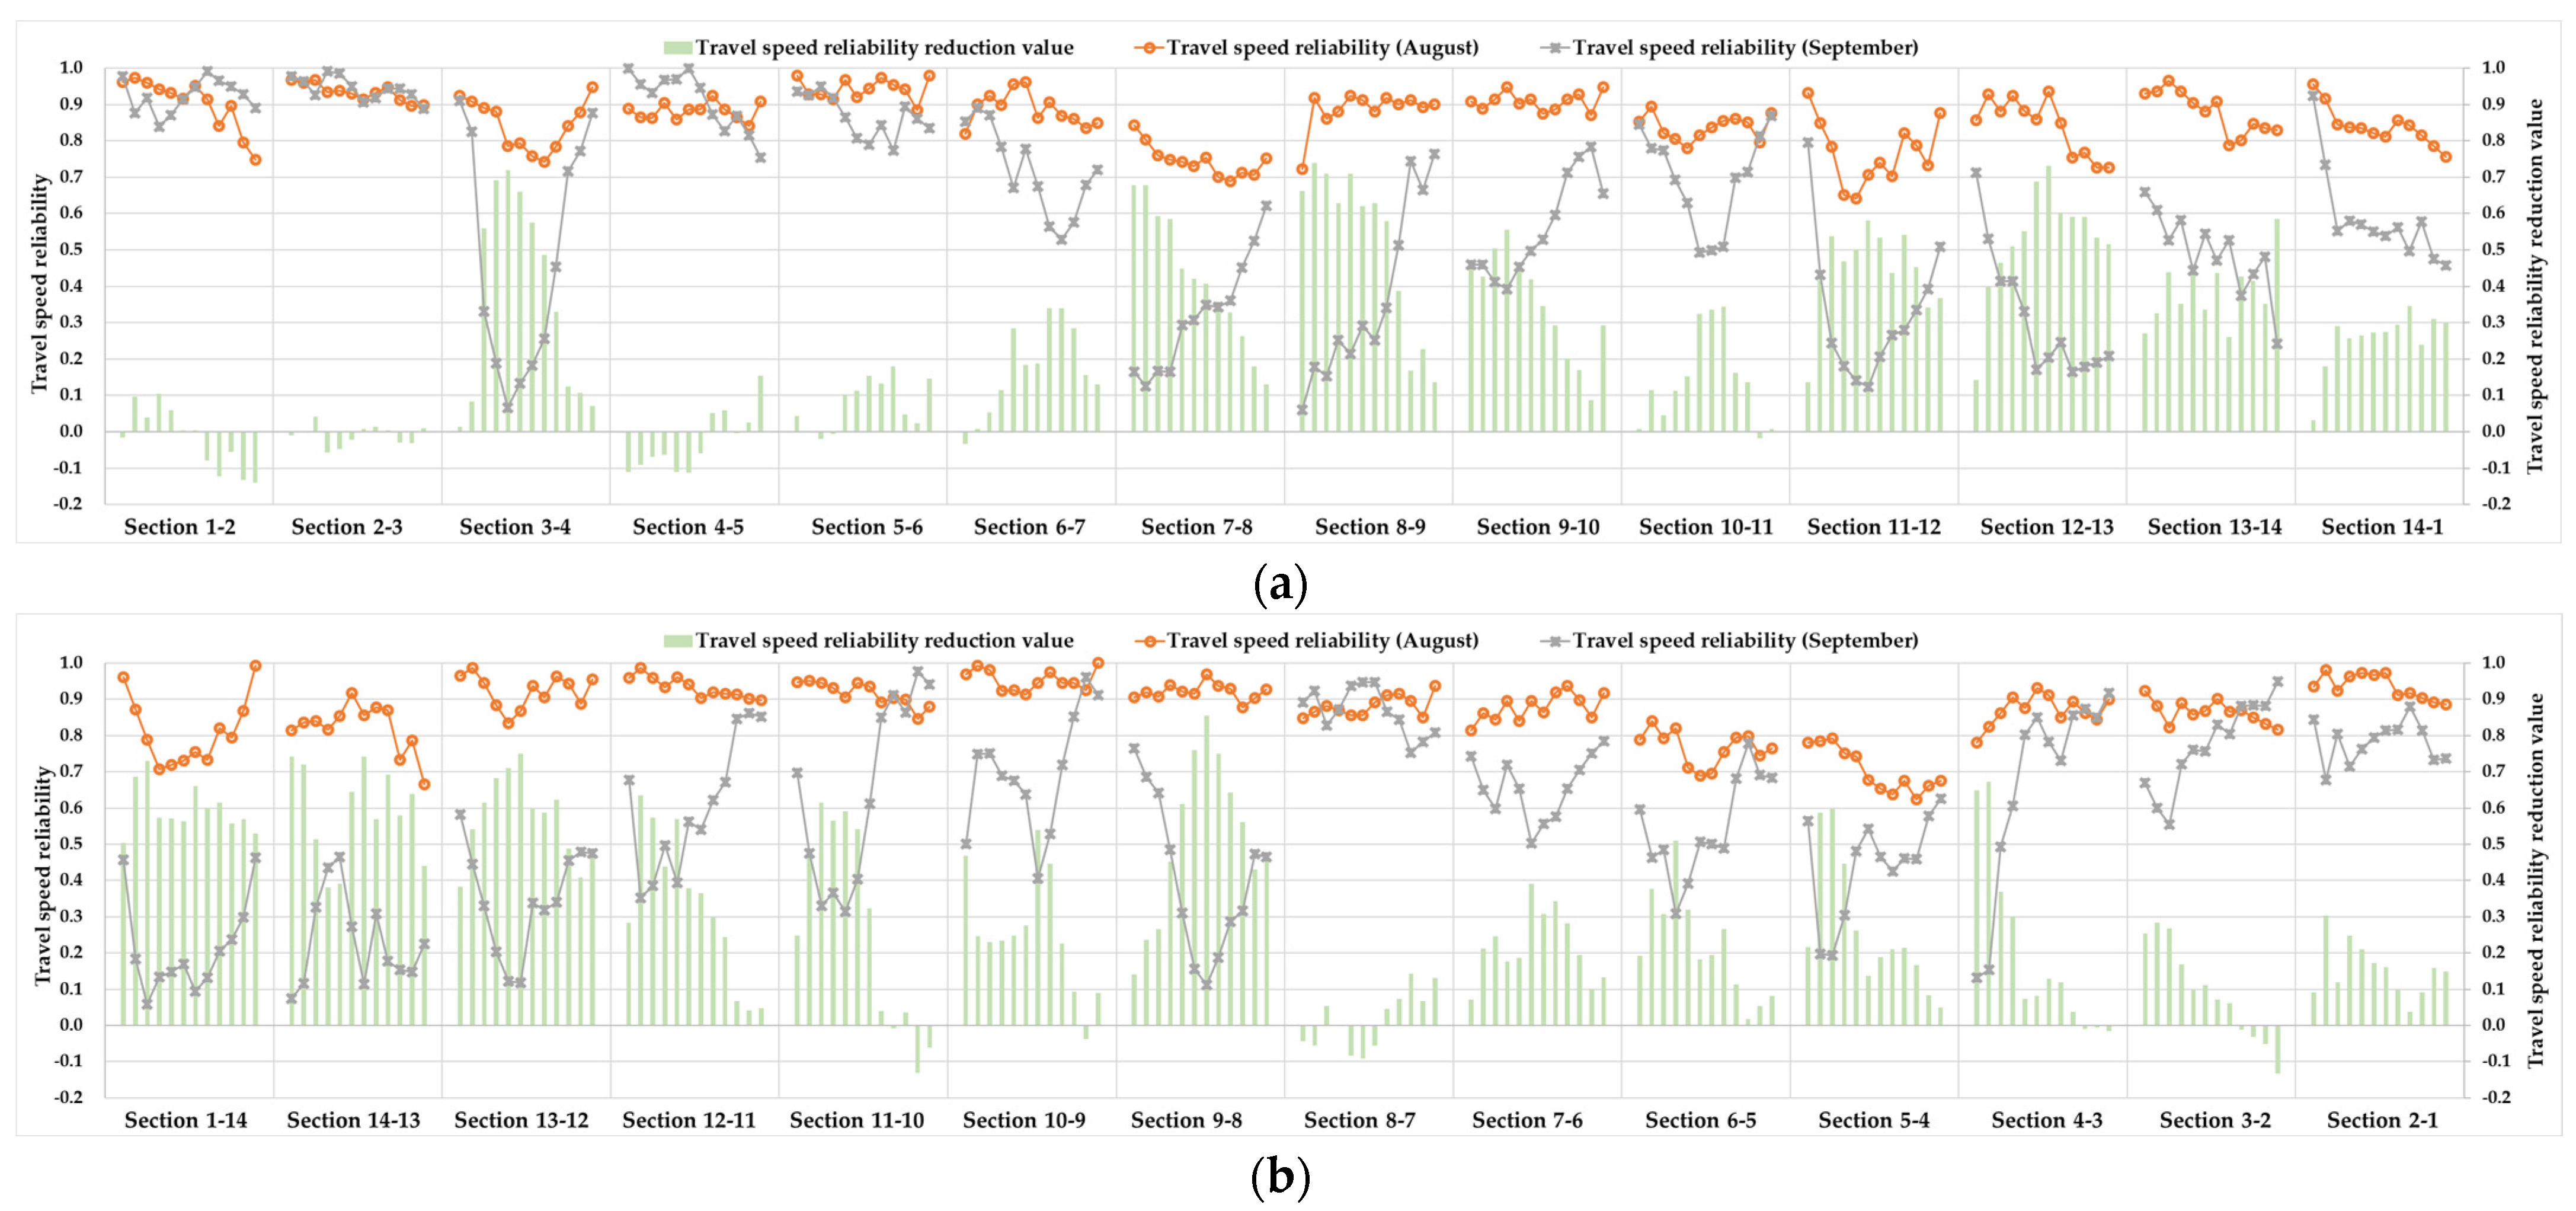
4.2.2. Travel Speed Reliability at 10 min Intervals of Morning Peak
5. Conclusions
- (1)
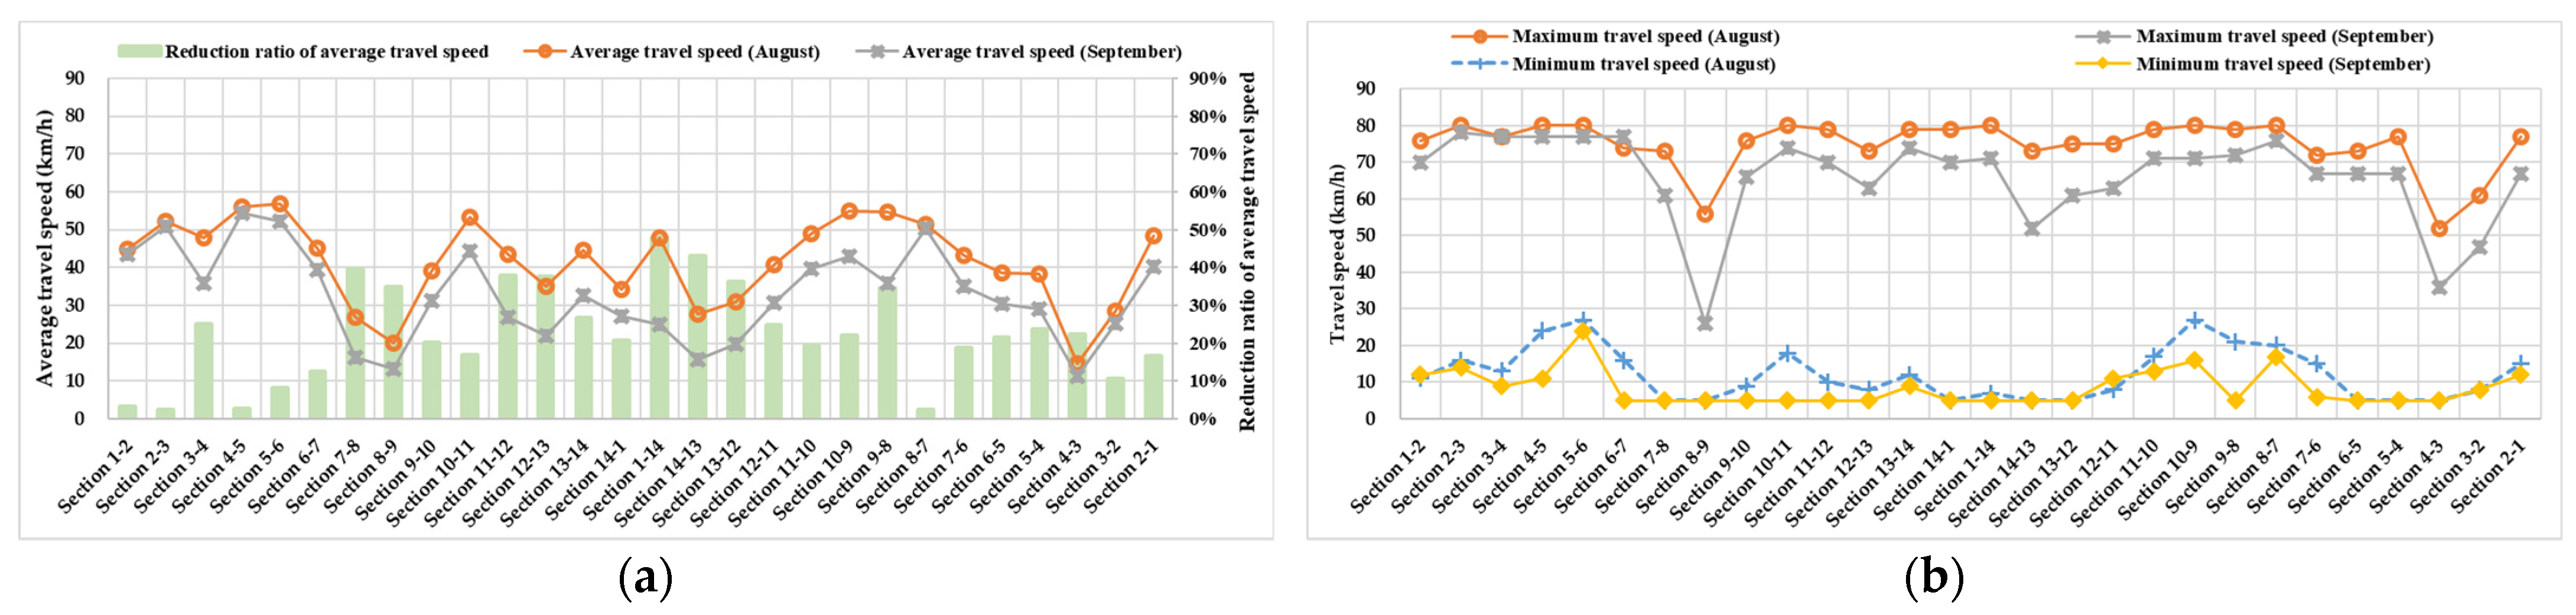
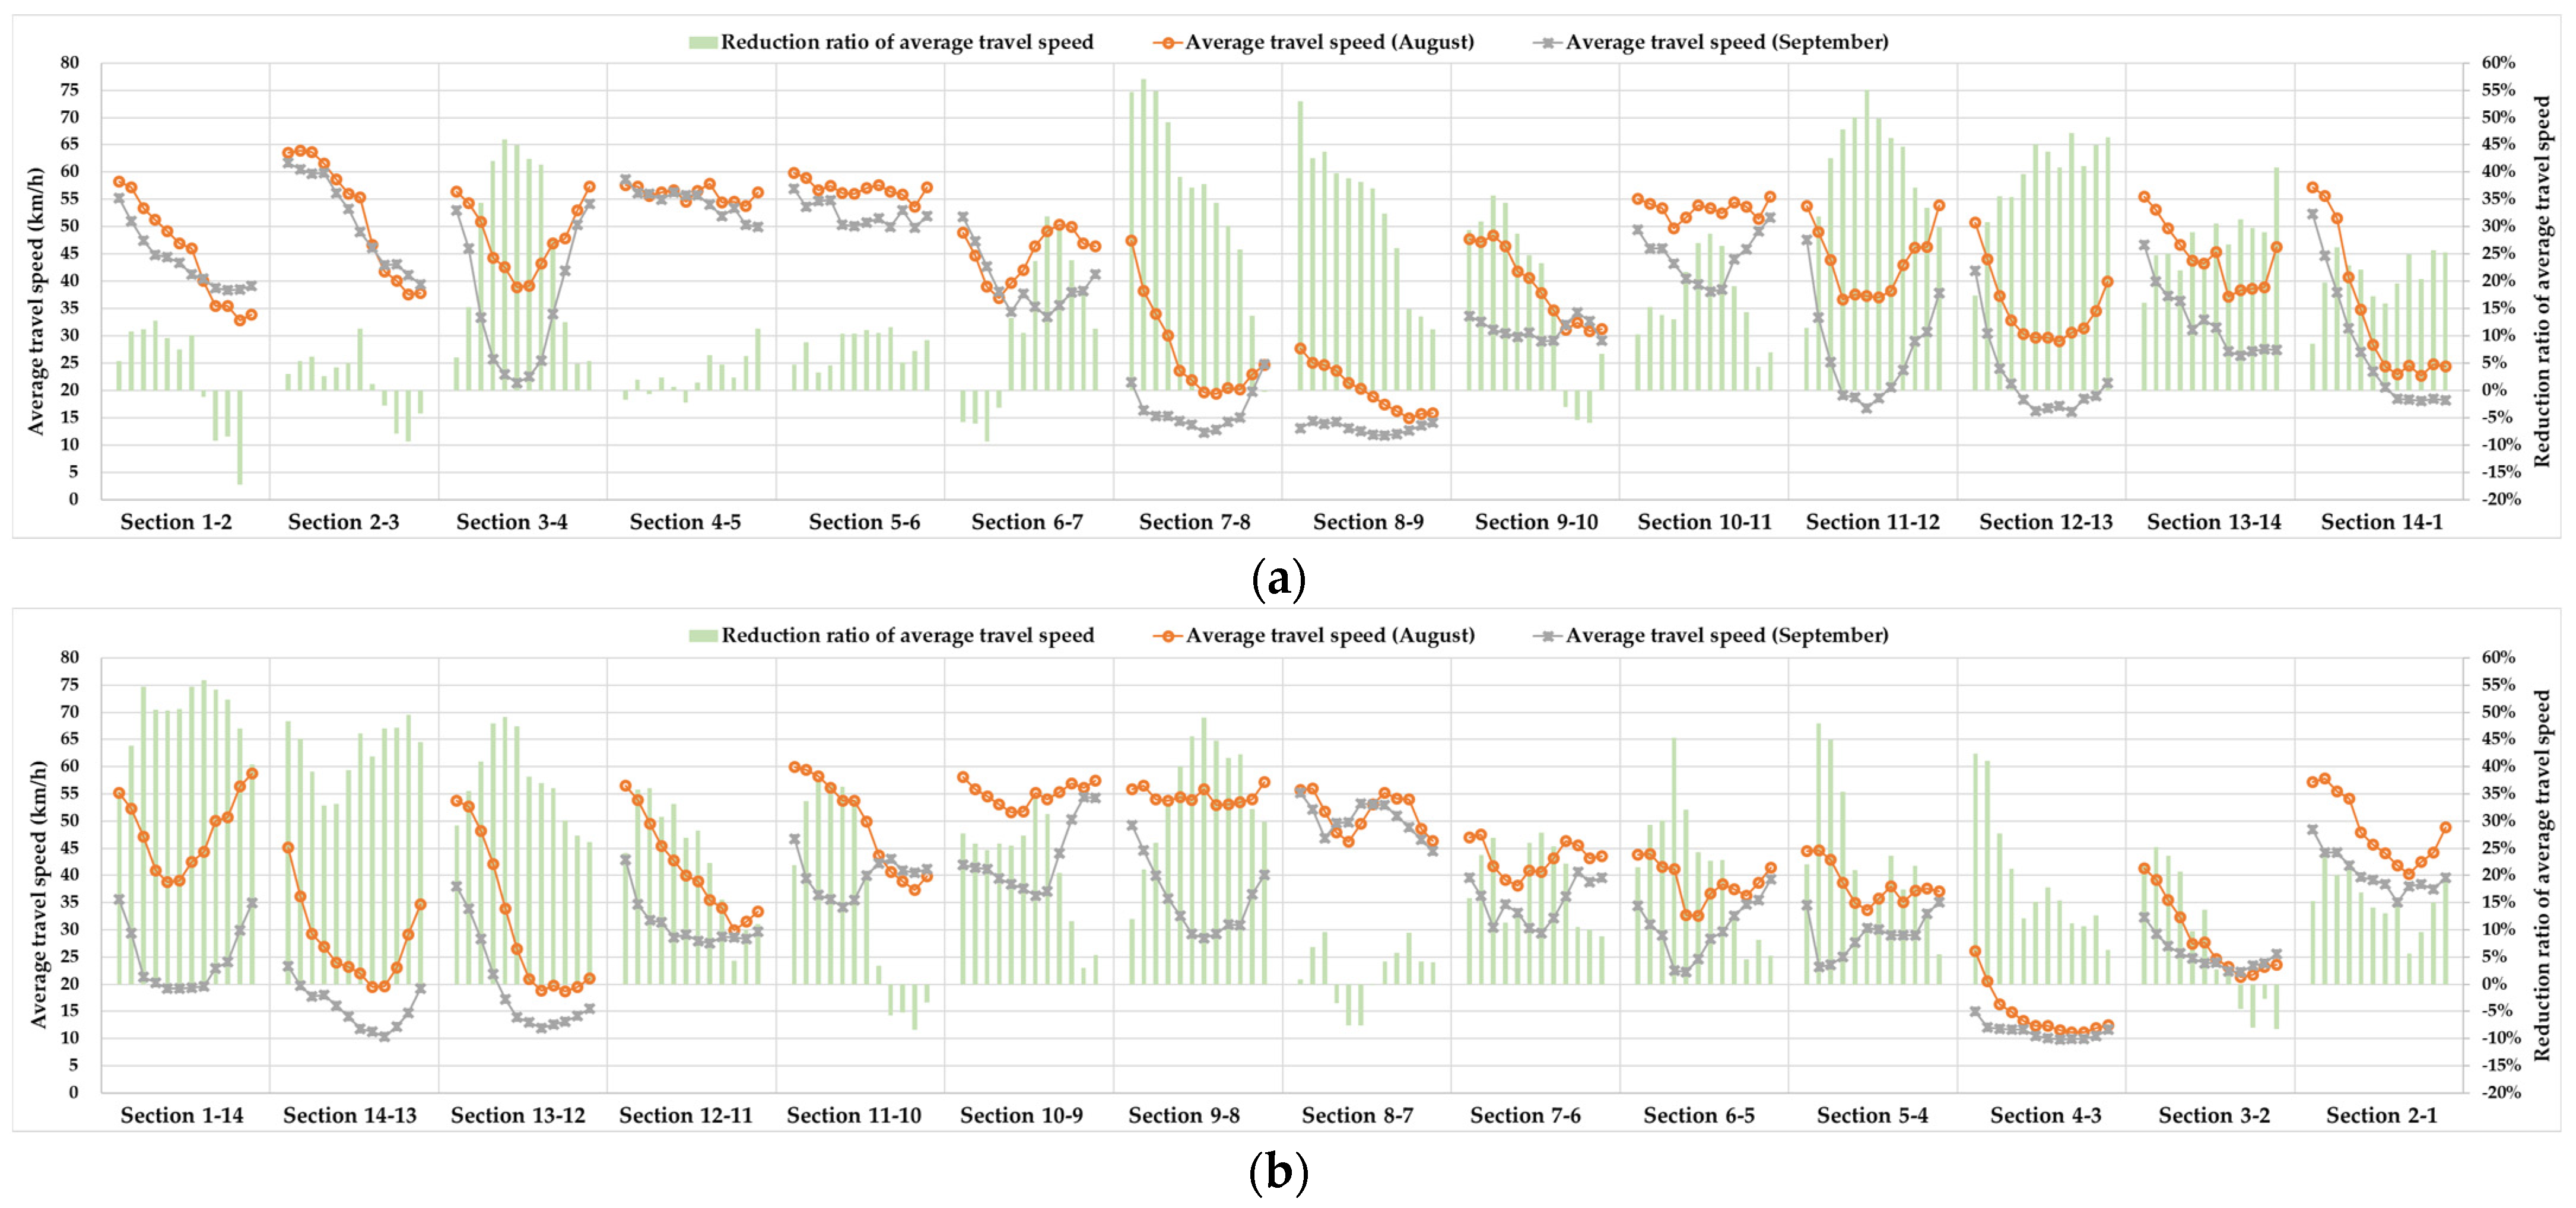
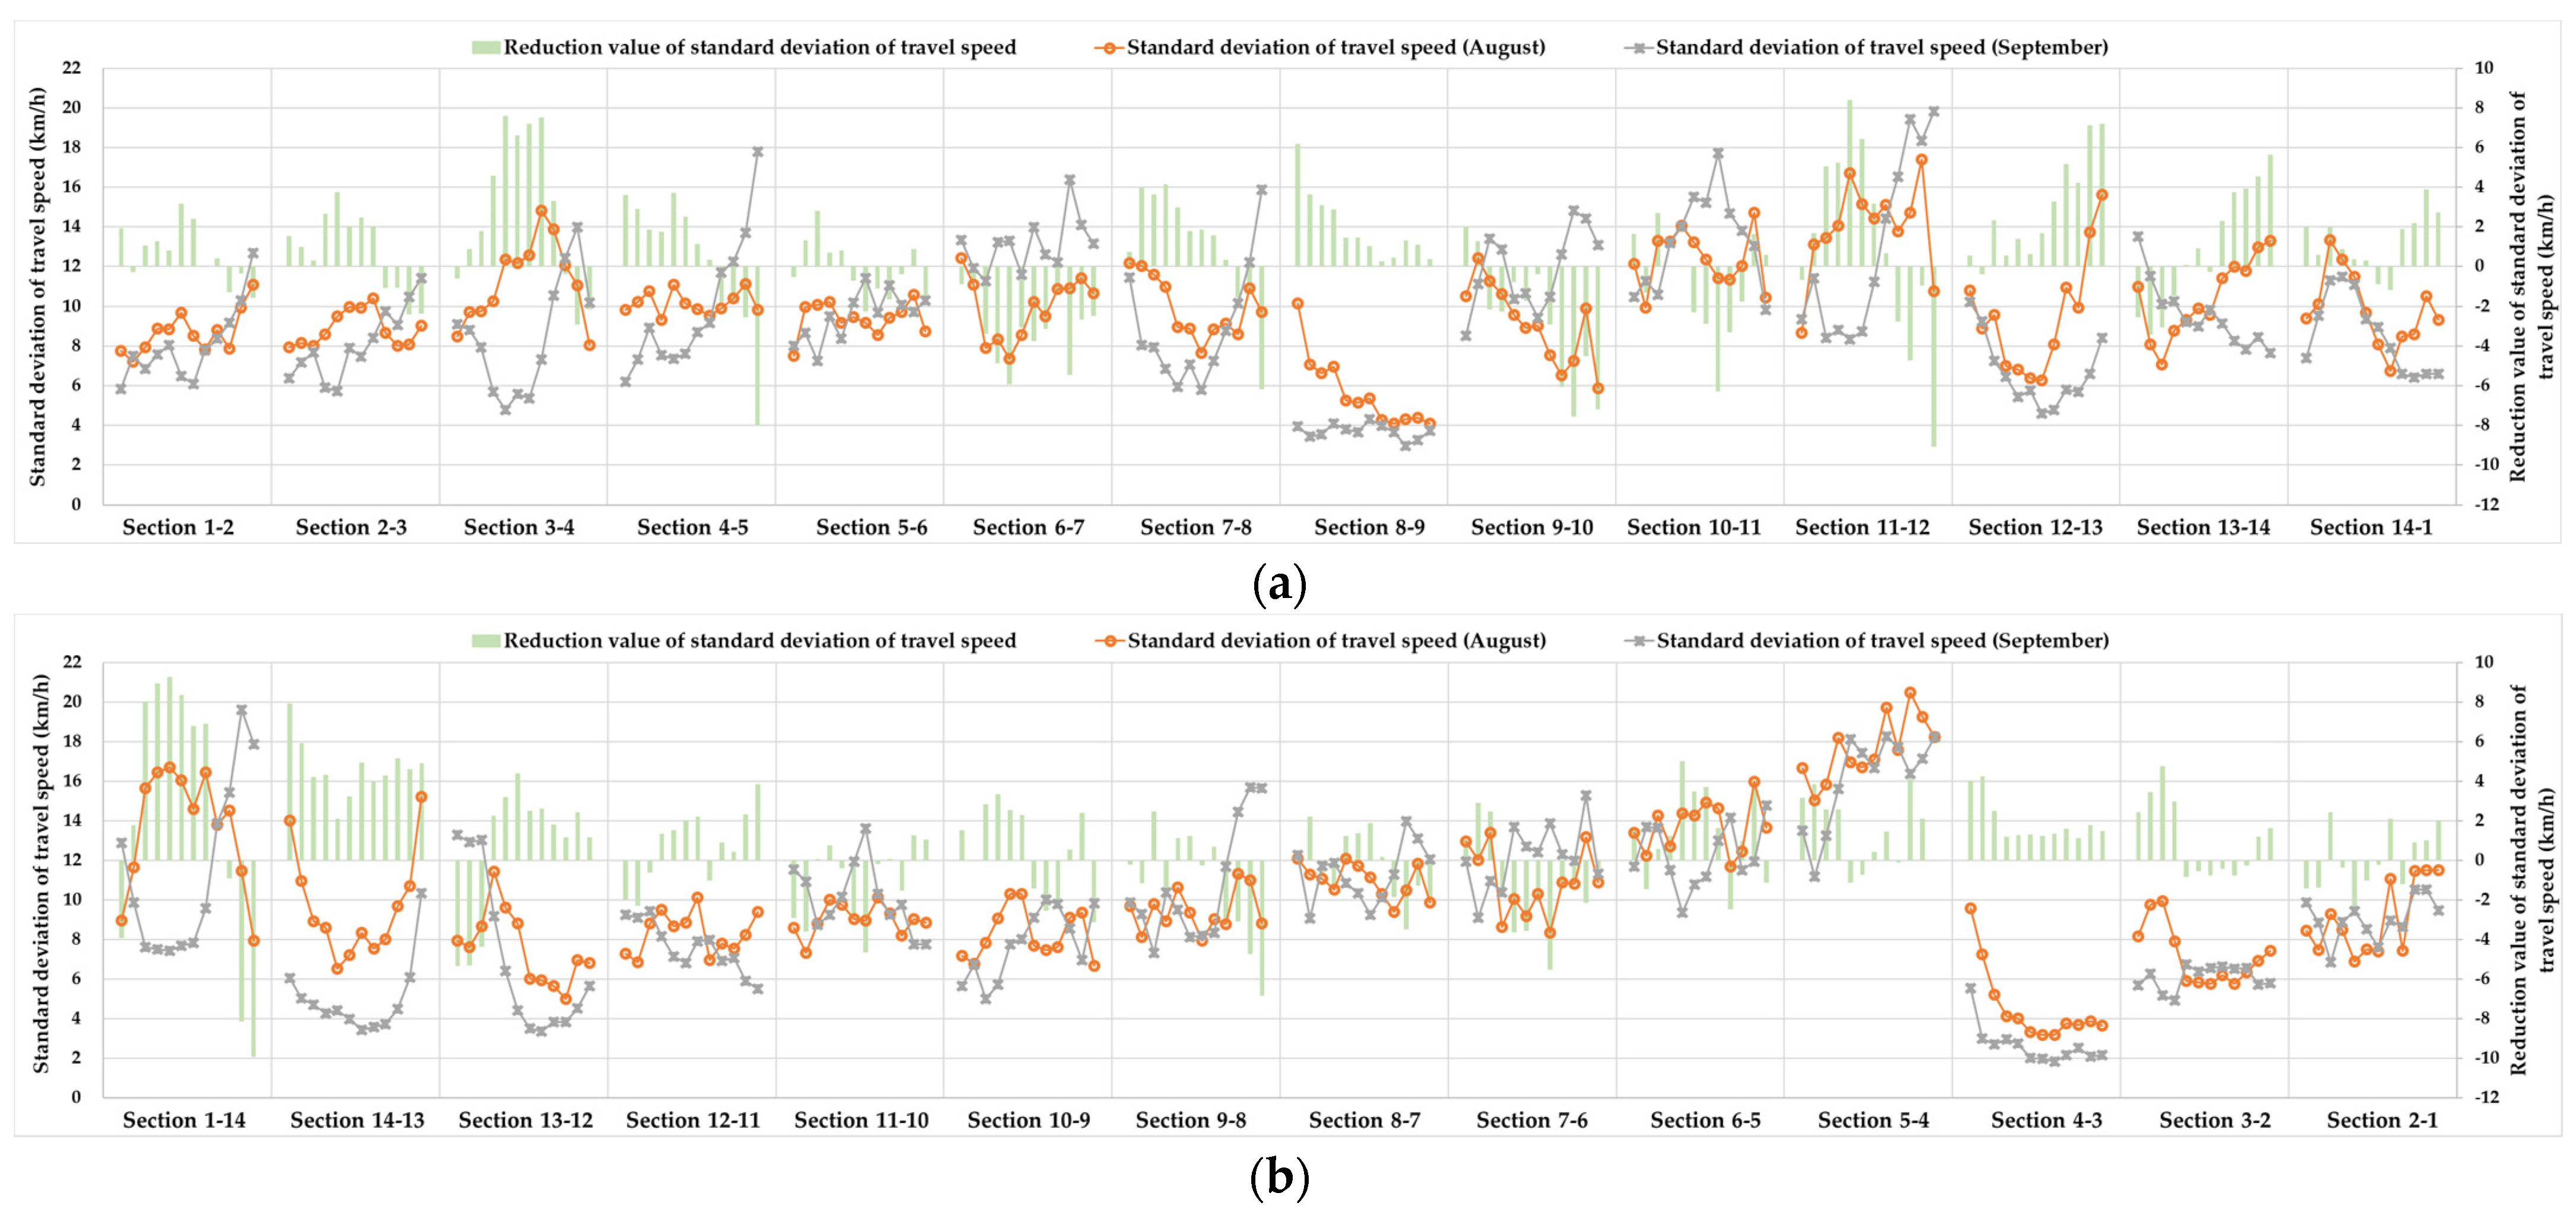
- The travel speed of the Beijing 3rd Ring Road had cyclicity (average travel speed of road sections significantly decreased after the students back to school), time variability (average travel speed first decreased and then increased with time), large-scale volatility (the travel speed range of more than 92% of road sections was larger than 50 km/h), and light congestion (average travel speed of more than 75% of road sections was lower than 50 km/h) during the weekday morning peak.
- (2)
- The travel speed reliability of more than 82% of the road sections of the Beijing 3rd Ring Road significantly decreased after the students back to school. The travel speed reliability of 96% of the road sections was lower than 0.8 based on the Threshold-3 during the weekday morning peak. The travel speed reliability of the Beijing 3rd Ring Road was larger than 0.7 based on the Threshold-4 in the morning peak in August. However, the road service level reliability of road sections with smooth conditions was less than 0.8 if the road sections were in a steady state of congestion for long periods and the travel speed reliability of car commuters for these road sections was larger than 0.7 in the morning peak in August, indicating that these road sections were congested and a reliable type of road section.
Author Contributions
Funding
Institutional Review Board Statement
Informed Consent Statement
Data Availability Statement
Acknowledgments
Conflicts of Interest
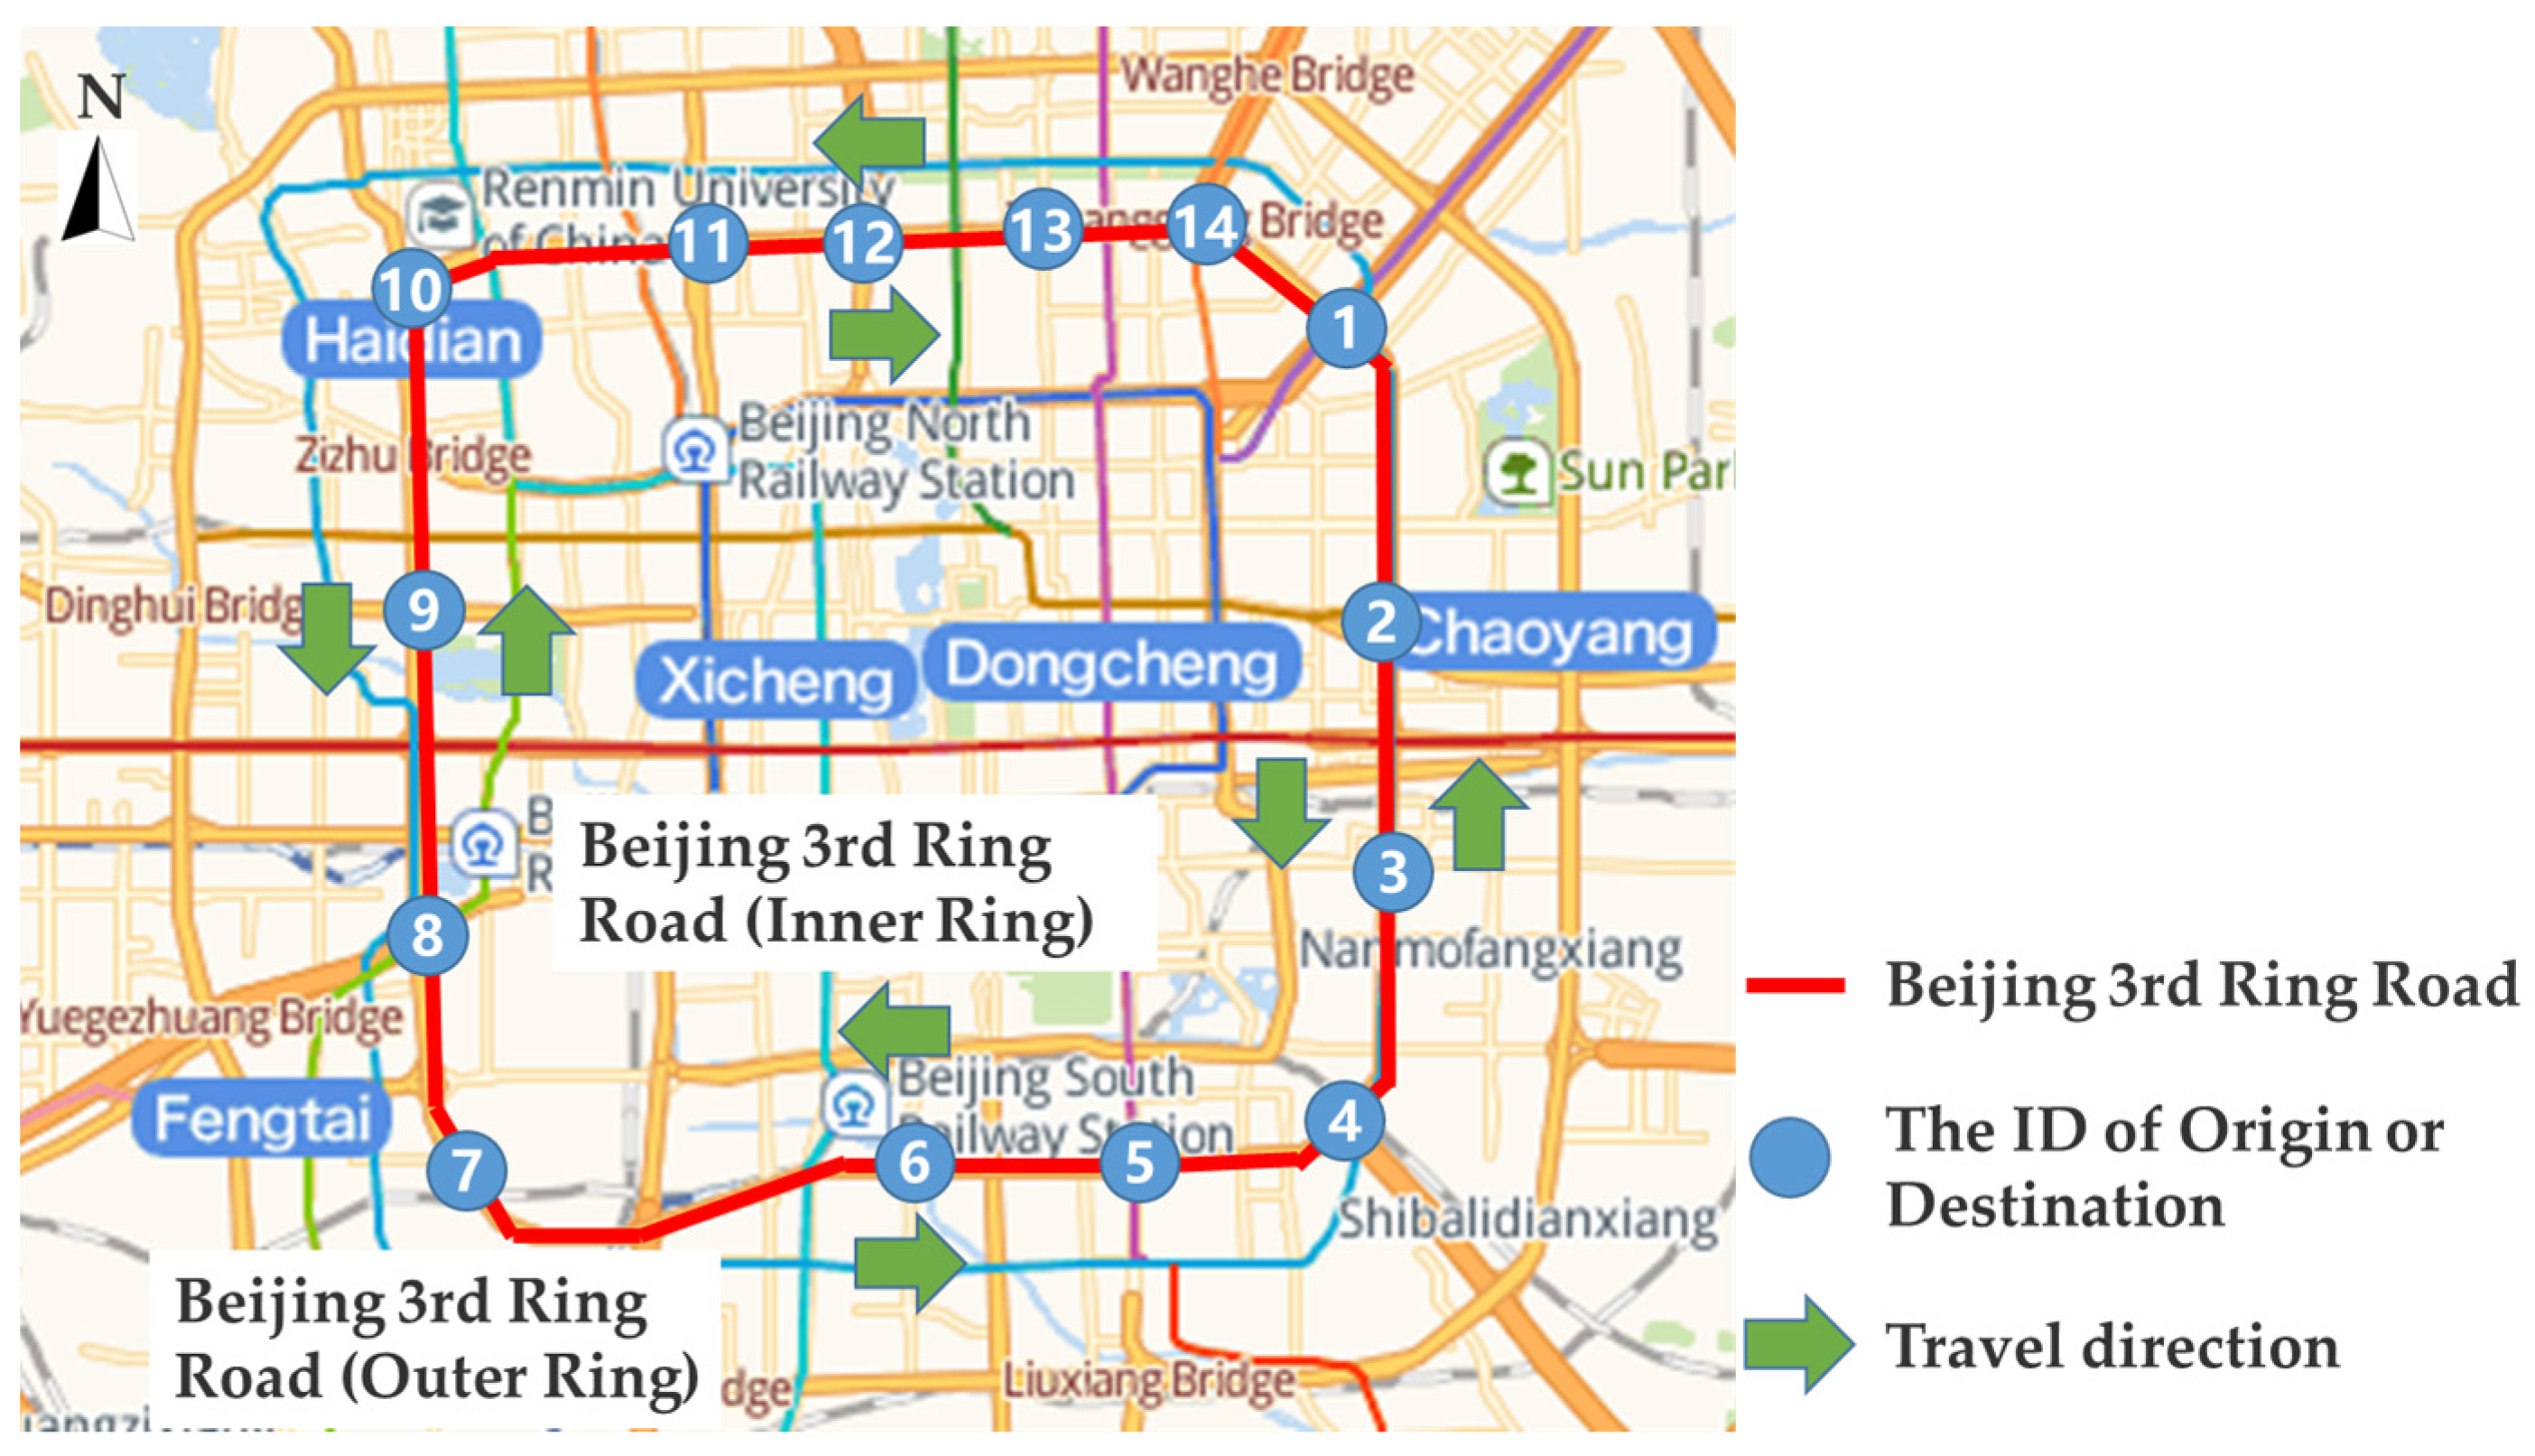
Appendix A. Beijing 3rd Ring Road Section Information
| Section ID | Road Name | Road Trend | Origin ID | Origin Name | Destination ID | Destination Name | Section Length |
| 1-2 | Eastern 3rd Ring Road (Inner Ring) | N-S | 1 | Sanyuan Bridge | 2 | Jingguang Bridge | 3625 m |
| 2-3 | Eastern 3rd Ring Road (Inner Ring) | N-S | 2 | Jingguang Bridge | 3 | Shuangjing Bridge | 4077 m |
| 3-4 | Eastern 3rd Ring Road (Inner Ring) | N-S | 3 | Shuangjing Bridge | 4 | Minminji Bridge | 3323 m |
| 4-5 | Southern 3rd Ring Road (Inner Ring) | E-W | 4 | Minminji Bridge | 5 | Liujiayao Bridge | 3136 m |
| 5-6 | Southern 3rd Ring Road (Inner Ring) | E-W | 5 | Liujiayao Bridge | 6 | Yangqiao Bridge | 2936 m |
| 6-7 | Southern 3rd Ring Road (Inner Ring) | E-W | 6 | Yangqiao Bridge | 7 | Fengyi Bridge | 5443 m |
| 7-8 | Western 3rd Ring Road (Inner Ring) | S-N | 7 | Fengyi Bridge | 8 | Liuli Bridge | 3730 m |
| 8-9 | Western 3rd Ring Road (Inner Ring) | S-N | 8 | Liuli Bridge | 9 | Aerospace Bridge | 4744 m |
| 9-10 | Western 3rd Ring Road (Inner Ring) | S-N | 9 | Aerospace Bridge | 10 | Suzhou Bridge | 3534 m |
| 10-11 | Northern 3rd Ring Road (Inner Ring) | W-E | 10 | Suzhou Bridge | 11 | Jimen Bridge | 4047 m |
| 11-12 | Northern 3rd Ring Road (Inner Ring) | W-E | 11 | Jimen Bridge | 12 | Madian Bridge | 2502 m |
| 12-13 | Northern 3rd Ring Road (Inner Ring) | W-E | 12 | Madian Bridge | 13 | Anzhen Bridge | 2606 m |
| 13-14 | Northern 3rd Ring Road (Inner Ring) | W-E | 13 | Anzhen Bridge | 14 | Sun Palace Bridge | 1672 m |
| 14-1 | Northern 3rd Ring Road (Inner Ring) | W-E | 14 | Sun Palace Bridge | 1 | Sanyuan Bridge | 2673 m |
| 1-14 | Northern 3rd Ring Road (Outer Ring) | E-W | 1 | Sanyuan Bridge | 14 | Sun Palace Bridge | 2530 m |
| 14-13 | Northern 3rd Ring Road (Outer Ring) | E-W | 14 | Sun Palace Bridge | 13 | Anzhen Bridge | 1529 m |
| 13-12 | Northern 3rd Ring Road (Outer Ring) | E-W | 13 | Anzhen Bridge | 12 | Madian Bridge | 2684 m |
| 12-11 | Northern 3rd Ring Road (Outer Ring) | E-W | 12 | Madian Bridge | 11 | Jimen Bridge | 1607 m |
| 11-10 | Northern 3rd Ring Road (Outer Ring) | E-W | 11 | Jimen Bridge | 10 | Suzhou Bridge | 4070 m |
| 10-9 | Western 3rd Ring Road (Outer Ring) | N-S | 10 | Suzhou Bridge | 9 | Aerospace Bridge | 4359 m |
| 9-8 | Western 3rd Ring Road (Outer Ring) | N-S | 9 | Aerospace Bridge | 8 | Liuli Bridge | 4829 m |
| 8-7 | Western 3rd Ring Road (Outer Ring) | N-S | 8 | Liuli Bridge | 7 | Fengyi Bridge | 3909 m |
| 7-6 | Southern 3rd Ring Road (Outer Ring) | W-E | 7 | Fengyi Bridge | 6 | Yangqiao Bridge | 6026 m |
| 6-5 | Southern 3rd Ring Road (Outer Ring) | W-E | 6 | Yangqiao Bridge | 5 | Liujiayao Bridge | 2918 m |
| 5-4 | Southern 3rd Ring Road (Outer Ring) | W-E | 5 | Liujiayao Bridge | 4 | Minminji Bridge | 2402 m |
| 4-3 | Eastern 3rd Ring Road (Outer Ring) | S-N | 4 | Minminji Bridge | 3 | Shuangjing Bridge | 3513 m |
| 3-2 | Eastern 3rd Ring Road (Outer Ring) | S-N | 3 | Shuangjing Bridge | 2 | Jingguang Bridge | 3988 m |
| 2-1 | Eastern 3rd Ring Road (Outer Ring) | S-N | 2 | Jingguang Bridge | 1 | Sanyuan Bridge | 3916 m |
References
- Shi, J.; Kan, M.Y.; Zhang, W.Y. Study on the Influence of Student Shuttle Vehicle on Beijing Road Traffic. J. Wuhan Univ. Technol. Transp. Sci. Eng. 2014, 38, 960–964. [Google Scholar] [CrossRef]
- Beijing Transport Institute. 2017 Annual Report on Transportation Development in Beijing. Available online: https://www.bjtrc.org.cn/List/index/cid/7.html (accessed on 1 August 2023).
- Carrion, C.; Levinson, D. Value of travel time reliability: A review of current evidence. Transp. Res. Part A Policy Pract. 2012, 46, 720–741. [Google Scholar] [CrossRef]
- Zhao, P.J.; Hu, H.Y. Geographical patterns of traffic congestion in growing megacities: Big data analytics from Beijing. Cities 2019, 92, 164–174. [Google Scholar] [CrossRef]
- Cvetek, D.; Mutra, M.; Jelui, N.; Tiljari, L. A Survey of Methods and Technologies for Congestion Estimation Based on Multisource Data Fusion. Appl. Sci. 2021, 11, 2306. [Google Scholar] [CrossRef]
- Central Committee of the Communist Party of China, State Council, Outline of Building a Powerful Transportation Country. Available online: https://baike.baidu.com/item/%E4%BA%A4%E9%80%9A%E5%BC%BA%E5%9B%BD%E5%BB%BA%E8%AE%BE%E7%BA%B2%E8%A6%81/23762572?fr=aladdin (accessed on 13 February 2024).
- Fei, C.; Jiang, Y.; Zhao, X.; Zhan, Y. Traffic Environment Improvement Around Primary and Middle Schools: A Case Study of Two Schools in Beijing Sub-Center. Urban Transp. China 2020, 18, 37–45+14. [Google Scholar] [CrossRef]
- Zhang, R.; Xu, Y.; Tang, Y.; Liu, Y.; Hao, J. Children’s School-Bound Traveling Behaviors and Strategies Under the Two-Child Policy. Urban Transp. China 2020, 18, 30–36. [Google Scholar] [CrossRef]
- Yu, L.; Liu, Y. Traffic Characteristics Analysis and Suggestions on School Bus Operation for Primary School Students in Beijing. J. Transp. Syst. Eng. Inf. Technol. 2011, 11, 193–199. [Google Scholar] [CrossRef]
- Yan, G.-F.; Huo, L.-M.; Wang, H.-Z.; Li, B.-Z. Optimizing School Bus Operations Based on School Student Travel Characteristics in Beijing. J. Transp. Eng. 2014, 14, 10–13. [Google Scholar] [CrossRef]
- Tang, Y.; Zhang, R.; Yang, J.; Liu, K. A Study of Travel Patterns of the School-age Children in Beijing. J. Transp. Eng. 2017, 17, 53–57+64. [Google Scholar] [CrossRef]
- Li, X. Exploration and Practice of Traffic Congestion Management around Schools in Urban Built-up Areas. Beijing Plan. Rev. 2020, 06, 126–129. [Google Scholar]
- Hao, J.-J.; Zhang, L.; Wu, X.-L.; Yang, X.-Q.; Liu, L. Children’s School Travel Mode Choice Considering Customized Travel. J. Transp. Syst. Eng. Inf. Technol. 2020, 20, 111–116. [Google Scholar] [CrossRef]
- Mcmillan, T.E. The relative influence of urban form on a child’s travel mode to school. Transp. Res. Part A Policy Pract. 2007, 41, 69–79. [Google Scholar] [CrossRef]
- Mcdonald, N.C.; Aalborg, A.E. Why Parents Drive Children to School: Implications for Safe Routes to School Programs. J. Am. Plan. Assoc. 2009, 75, 331–342. [Google Scholar] [CrossRef]
- Lang, D.; Collins, D.; Kearns, R. Understanding modal choice for the trip to school. J. Transp. Geogr. 2011, 19, 509–514. [Google Scholar] [CrossRef]
- DB11/T 785—2011; Urban Road Traffic Performance Index. The Beijing Municipal Bureau of Quality and Technical Supervision: Beijing, China, 2011.
- GA/T 115—2020; Evaluation Methods for Road Traffic Congestion Levels. The Ministry of Public Security of the People’s Republic of China: Beijing, China, 2020.
- Gore, N.; Pulugurtha, S.S.; Arkatkar, S.; Joshi, G. Congestion Index and Reliability-Based Freeway Level of Service. J. Transp. Eng. Part A-Syst. 2021, 147, 1–16. [Google Scholar] [CrossRef]
- He, F.; Yan, X.; Liu, Y.; Ma, L. A Traffic Congestion Assessment Method for Urban Road Networks Based on Speed Performance Index. In Proceedings of the 6th International Conference on Green Intelligent Transportation System and Safety, GITSS 2015, Beijing, China, 2–6 July 2015; Elsevier: Amsterdam, The Netherlands, 2016; Volume 137, pp. 425–433. [Google Scholar] [CrossRef]
- Chen, Y.; Chen, C.; Wu, Q.; Ma, J.; Zhang, G.; Milton, J. Spatial-temporal traffic congestion identification and correlation extraction using floating car data. J. Intell. Transp. Syst. 2021, 25, 263–280. [Google Scholar] [CrossRef]
- Wang, C.; Chen, Y.; Wang, J.; Qian, J. An Improved CrowdDet Algorithm for Traffic Congestion Detection in Expressway Scenarios. Appl. Sci. 2023, 13, 7174. [Google Scholar] [CrossRef]
- Li, J.; Yang, X.; Chen, Y. Research on Travel Speed Reliability Based on Congestion Tolerance Perception of Car Commuters. In Proceedings of the 6th International Conference on Transportation Information and Safety: New Infrastructure Construction for Better Transportation, ICTIS 2021, Wuhan, China, 22–24 October 2021; Institute of Electrical and Electronics Engineers Inc.: Wuhan, China, 2021. [Google Scholar] [CrossRef]
- Chen, Y.; Gao, A.; Tang, X. Highly Reliable Urban Road Network Security Technology; China Architecture & Building Press: Beijing, China, 2012. [Google Scholar]
- Deng, X.; Song, R.; Zheng, L.; Sun, Y. Reliability of Urban Expressway in Beijing. J. Transp. Inf. Saf. 2011, 29, 124–129. [Google Scholar] [CrossRef]


| Characteristics | Characterization of Travel Speed Fluctuations |
|---|---|
| Similarity |
|
| Specificity |
|
| Traffic Status | Smooth | Light Congestion | Medium Congestion | Severe Congestion |
|---|---|---|---|---|
| Average travel speed * (km/h) |
| Threshold | Threshold-1 | Threshold-2 | Threshold-3 | Threshold-4 |
|---|---|---|---|---|
| The values of (km/h) | 20 | 35 | 50 |
Disclaimer/Publisher’s Note: The statements, opinions and data contained in all publications are solely those of the individual author(s) and contributor(s) and not of MDPI and/or the editor(s). MDPI and/or the editor(s) disclaim responsibility for any injury to people or property resulting from any ideas, methods, instructions or products referred to in the content. |
© 2024 by the authors. Licensee MDPI, Basel, Switzerland. This article is an open access article distributed under the terms and conditions of the Creative Commons Attribution (CC BY) license (https://creativecommons.org/licenses/by/4.0/).
Share and Cite
Li, J.; Chen, Y.; Yang, X.; Yuan, Y. Analysis of the Impacts of Students Back to School on the Volatility and Reliability of Travel Speed on Urban Road. Appl. Sci. 2024, 14, 1780. https://doi.org/10.3390/app14051780
Li J, Chen Y, Yang X, Yuan Y. Analysis of the Impacts of Students Back to School on the Volatility and Reliability of Travel Speed on Urban Road. Applied Sciences. 2024; 14(5):1780. https://doi.org/10.3390/app14051780
Chicago/Turabian StyleLi, Jiaxian, Yanyan Chen, Xiaoguang Yang, and Ye Yuan. 2024. "Analysis of the Impacts of Students Back to School on the Volatility and Reliability of Travel Speed on Urban Road" Applied Sciences 14, no. 5: 1780. https://doi.org/10.3390/app14051780
APA StyleLi, J., Chen, Y., Yang, X., & Yuan, Y. (2024). Analysis of the Impacts of Students Back to School on the Volatility and Reliability of Travel Speed on Urban Road. Applied Sciences, 14(5), 1780. https://doi.org/10.3390/app14051780