
Enhancing Crypto Success via Heatmap Visualization of Big Data Analytics for Numerous Variable Moving Average Strategies


Abstract
:1. Introduction
2. Literature Review
2.1. Technical Trading Literature of MA and VMA Trading Regulations
2.2. Technical Analysis Studies of Cryptocurrency Markets
2.3. Heatmap Visualization
3. Design of This Study
3.1. Introduction to MA and VMA Trading Rules
3.2. Research Design
3.3. Measuring the Rate of Return Following the VMA Trading Rule
4. Empirical Results and Analyses
4.1. Descriptive Statistics
4.2. Empirical Results for Traditional Research Design
4.3. Empirical Results for Numerous Outcomes with Heatmap Visualization
5. Discussion
6. Concluding Remarks
6.1. Conclusions and Discussion
6.2. Research Implications
6.3. Limitations and Further Research
Author Contributions
Funding
Data Availability Statement
Conflicts of Interest
References
- Fama, E.F. Efficient capital markets: A review of theory and empirical work. J. Financ. 1970, 25, 383–417. [Google Scholar] [CrossRef]
- Fama, E.F. Efficient capital markets: II. J. Financ. 1991, 46, 1575–1617. [Google Scholar] [CrossRef]
- Borges, M.R. Efficient market hypothesis in European stock markets. Eur. J. Financ. 2010, 16, 711–726. [Google Scholar] [CrossRef]
- Kahneman, D.; Tversky, A. Prospect theory: An analysis of decision under risk. Econometrica 1979, 47, 263–292. [Google Scholar] [CrossRef]
- Cao, R.; Horváth, L.; Liu, Z.; Zhao, Y. A study of data-driven momentum and disposition effects in the Chinese stock market by functional data analysis. Rev. Quant. Financ. Acc. 2020, 54, 335–358. [Google Scholar] [CrossRef]
- De Bondt, W.F.; Thaler, R. Does the stock market overreact? J. Financ. 1985, 40, 793–805. [Google Scholar] [CrossRef]
- Piccoli, P.; Chaudhury, M.; Souza, A.; da Silva, W.V. Stock overreaction to extreme market events. N. Am. J. Econ. Financ. 2017, 41, 97–111. [Google Scholar] [CrossRef]
- King, T.; Koutmos, D. Herding and feedback trading in cryptocurrency markets. Ann. Oper. Res. 2021, 300, 79–96. [Google Scholar] [CrossRef] [PubMed]
- Yousaf, I.; Ali, S.; Shah, S.Z.A. Herding behavior in Ramadan and financial crises: The case of the Pakistani stock market. Financ. Innov. 2018, 4, 16. [Google Scholar] [CrossRef]
- Antoniou, A.; Galariotis, E.C.; Spyrou, S.I. Contrarian profits and the overreaction hypothesis: The case of the Athens stock ex-change. Eur. Financ. Manag. 2005, 11, 71–98. [Google Scholar] [CrossRef]
- Garvanova, M.; Garvanov, I.; Jotsov, V.; Razaque, A.; Alotaibi, B.; Alotaibi, M.; Borissova, D.A. Data-Science Approach for Creation of a Comprehensive Model to Assess the Impact of Mobile Technologies on Humans. Appl. Sci. 2023, 13, 3600. [Google Scholar] [CrossRef]
- Bouchaud, J.P.; Kruger, P.; Landier, A.; Thesmar, D. Sticky Expectations and the Profitability Anomaly. J. Financ. 2019, 74, 639–674. [Google Scholar] [CrossRef]
- Kräussl, R.; Mirgorodskaya, E. Media, sentiment and market performance in the long run. Eur. J. Financ. 2017, 23, 1059–1082. [Google Scholar] [CrossRef]
- Farag, H.; Mallin, C. The influence of CEO demographic characteristics on corporate risk-taking: Evidence from Chinese IPOs. Eur. J. Financ. 2018, 24, 1528–1551. [Google Scholar] [CrossRef]
- Gaganis, C.; Molnár, P. Economic policies and their effects on financial market. Eur. J. Financ. 2021, 27, 929–931. [Google Scholar] [CrossRef]
- Lin, H.M.; Lin, C.Y.; Wang, C.H.; Tsai, M.J. A Novel Mechanical Fault Diagnosis Based on Transfer Learning with Probability Confidence Convolutional Neural Network Model. Appl. Sci. 2022, 12, 9670. [Google Scholar] [CrossRef]
- Ni, Y.; Liao, Y.C.; Huang, P.M. A trading rule, herding behaviors, and stock market overreaction. Int. Rev. Econ. Financ. 2015, 39, 253–265. [Google Scholar] [CrossRef]
- Nasir, A.; Shaukat, K.; Iqbal Khan, K.A.; Hameed, I.; Alam, T.M.; Luo, S. Trends and directions of financial technology (Fintech) in society and environment: A bibliometric study. Appl. Sci. 2021, 11, 10353. [Google Scholar] [CrossRef]
- Masciandaro, D. Central Bank Digital Cash and Cryptocurrencies: Insights from a New Baumol–Friedman Demand for Money. Aust. Econ. Rev. 2018, 51, 540–550. [Google Scholar] [CrossRef]
- Ji, Q.; Bouri, E.; Kristoufek, L.; Lucey, B. Realized volatility connectedness among Bitcoin exchange markets. Financ. Res. Lett. 2019, 38, 101391. [Google Scholar] [CrossRef]
- Al Guindy, M. Cryptocurrency price volatility and investor attention. Int. Rev. Econ. Financ. 2021, 76, 556–570. [Google Scholar] [CrossRef]
- Borges, T.A.; Neves, R.F. Ensemble of machine learning algorithms for cryptocurrency investment with different data resampling methods. Appl. Soft Comput. 2020, 90, 106187. [Google Scholar] [CrossRef]
- Corbet, S.; Meegan, A.; Larkin, C.; Lucey, B.; Yarovaya, L. Exploring the dynamic relationships between cryptocurrencies and other financial assets. Econ. Lett. 2018, 165, 28–34. [Google Scholar] [CrossRef]
- Gajardo, G.; Kristjanpoller, W.D.; Minutolo, M. Does Bitcoin exhibit the same asymmetric multifractal cross-correlations with crude oil, gold and DJIA as the Euro, Great British Pound and Yen? Chaos Solitons Fractals 2018, 109, 195–205. [Google Scholar] [CrossRef]
- Kakinaka, S.; Umeno, K. Exploring asymmetric multifractal cross-correlations of price–volatility and asymmetric volatility dynamics in cryptocurrency markets. Phys. A Stat. Mech. Appl. 2021, 581, 126237. [Google Scholar] [CrossRef]
- Mensi, W.; Al-Yahyaee, K.H.; Kang, S.H. Structural breaks and double long memory of cryptocurrency prices: A comparative analysis from Bitcoin and Ethereum. Financ. Res. Lett. 2019, 29, 222–230. [Google Scholar] [CrossRef]
- Naeem, M.A.; Bouri, E.; Peng, Z.; Shahzad, S.J.H.; Vo, X.V. Asymmetric efficiency of cryptocurrencies during COVID-19. Phys. A Stat. Mech. Appl. 2021, 565, 125562. [Google Scholar] [CrossRef]
- Katsiampa, P. Volatility estimation for Bitcoin: A comparison of GARCH models. Econ. Lett. 2017, 158, 3–6. [Google Scholar] [CrossRef]
- Aleti, S.; Mizrach, B. Bitcoin spot and futures market microstructure. J. Futures Mark. 2021, 41, 194–225. [Google Scholar] [CrossRef]
- Baur, D.G.; Dimpfl, T. Price discovery in Bitcoin spot or futures? J. Futures Mark. 2019, 39, 803–817. [Google Scholar] [CrossRef]
- Corbet, S.; Larkin, C.; Lucey, B.M.; Meegan, A.; Yarovaya, L. The impact of macroeconomic news on Bitcoin returns. Eur. J. Financ. 2020, 26, 1396–1416. [Google Scholar] [CrossRef]
- Dwyer, G.P. The economics of Bitcoin and similar private digital currencies. J. Financ. Stab. 2015, 17, 81–91. [Google Scholar] [CrossRef]
- Hoang, L.T.; Baur, D.G. Forecasting Bitcoin volatility: Evidence from the options market. J. Futures Mark. 2020, 40, 1584–1602. [Google Scholar] [CrossRef]
- Jo, H.; Park, H.; Shefrin, H. Bitcoin and sentiment. J. Futures Mark. 2020, 40, 1861–1879. [Google Scholar] [CrossRef]
- Shynkevich, A. Impact of Bitcoin futures on the informational efficiency of Bitcoin spot market. J. Futures Mark. 2021, 41, 115–134. [Google Scholar] [CrossRef]
- Zhang, H.W.; Wang, P.J. Does Bitcoin or gold react to financial stress alike? Evidence from the US and China. Int. Rev. Econ. Financ. 2021, 71, 629–648. [Google Scholar] [CrossRef]
- López-Martín, C.; Benito Muela, S.; Arguedas, R. Efficiency in cryptocurrency markets: New evidence. Eurasian Econ. Rev. 2021, 11, 403–431. [Google Scholar] [CrossRef]
- Lento, C.; Gradojevic, N. The profitability of technical analysis during the COVID-19 market meltdown. J. Risk Financ. Manag. 2022, 15, 192. [Google Scholar] [CrossRef]
- Grobys, K.; Ahmed, S.; Sapkota, N. Technical trading rule in the cryptocurrency market. Financ. Res. Lett. 2020, 32, 101396. [Google Scholar] [CrossRef]
- Corbet, S.; Larkin, C.; Lucey, B. The contagion effects of the COVID-19 pandemic: Evidence from gold and cryptocurrencies. Financ. Res. Lett. 2020, 35, 101554. [Google Scholar] [CrossRef]
- Brock, W.; Lakonishok, J.; LeBaron, B. Simple technical trading rule and the stochastic properties of stock returns. J. Financ. 1992, 47, 1731–1764. [Google Scholar] [CrossRef]
- Bessembinder, H.; Chan, K. The profitability of technical trading rule in the Asian stock markets. Pac.-Basin Financ. J. 1995, 3, 257–284. [Google Scholar] [CrossRef]
- Kwon, K.Y.; Kish, R.J. Technical trading strategies and return predictability: NYSE. Appl. Financ. Econ. 2002, 12, 639–653. [Google Scholar] [CrossRef]
- Chang, Y.H.; Metghalchi, M.; Chan, C.C. Technical trading strategies and cross-national information linkage: The case of Taiwan stock market. Appl. Financ. Econ. 2006, 16, 731–743. [Google Scholar] [CrossRef]
- Loh, E.Y. An alternative test for weak form efficiency based on technical analysis. Appl. Financ. Econ. 2007, 17, 1003–1012. [Google Scholar] [CrossRef]
- Chang, C.L.; Ilomäki, J.; Laurila, H.; McAleer, M. Long run returns predictability and volatility with moving averages. Risks 2018, 6, 105. [Google Scholar] [CrossRef]
- Papailias, F.; Thomakos, D.D. An improved moving average technical trading rule. Phys. A Stat. Mech. Appl. 2015, 428, 458–469. [Google Scholar] [CrossRef]
- Ha, H.; Han, H.; Mun, S.; Bae, S.; Lee, J.; Lee, K. An improved study of multilevel semantic network visualization for analyzing sentiment word of movie review data. Appl. Sci. 2019, 9, 2419. [Google Scholar] [CrossRef]
- Ugwitz, P.; Kvarda, O.; Juříková, Z.; Šašinka, Č.; Tamm, S. Eye-tracking in interactive virtual environments: Implementation and evaluation. Appl. Sci. 2022, 12, 1027. [Google Scholar] [CrossRef]
- Corbet, S.; Eraslan, V.; Lucey, B.; Sensoy, A. The effectiveness of technical trading rule in cryptocurrency markets. Financ. Res. Lett. 2019, 31, 32–37. [Google Scholar] [CrossRef]
- Lai, M.M.; Lau, S.H. The profitability of the simple moving averages and trading range breakout in the Asian stock markets. J. Asian Econ. 2006, 17, 144–170. [Google Scholar]
- Marshall, B.R.; Nguyen, N.H.; Visaltanachoti, N. Time series momentum and moving average trading rule. Quant. Financ. 2017, 17, 405–421. [Google Scholar] [CrossRef]
- Chang, E.J.; Lima, E.J.A.; Tabak, B.M. Testing for predictability in emerging equity markets. Emerg. Mark. Rev. 2004, 5, 295–316. [Google Scholar] [CrossRef]
- Ratner, M.; Leal, R.P. Tests of technical trading strategies in the emerging equity markets of Latin America and Asia. J. Bank. Financ. 1999, 23, 1887–1905. [Google Scholar] [CrossRef]
- Ni, Y.S.; Lee, J.T.; Liao, Y.C. Do variable length moving average trading rules matter during a financial crisis period? Appl. Econ. Lett. 2013, 20, 135–141. [Google Scholar] [CrossRef]
- Day, T.E.; Wang, P. Dividends, nonsynchronous prices, and the returns from trading the Dow Jones Industrial Average. J. Empir. Financ. 2002, 9, 431–454. [Google Scholar] [CrossRef]
- Heng, F.; Azizan, N.; Yeap, L. Technical trading systems as crystal balls in reducing risk: The Malaysian stock market. Int. Bus. Manag. 2012, 6, 140–146. [Google Scholar] [CrossRef]
- Resta, M.; Pagnottoni, P.; De Giuli, M.E. Technical analysis on the bitcoin market: Trading opportunities or investors’ pitfall? Risks 2020, 8, 44. [Google Scholar] [CrossRef]
- Gerritsen, D.F.; Bouri, E.; Ramezanifar, E.; Roubaud, D. The profitability of technical trading rule in the Bitcoin market. Financ. Res. Lett. 2020, 34, 101263. [Google Scholar] [CrossRef]
- Vijh, M.; Chandola, D.; Tikkiwal, V.A.; Kumar, A. Stock closing price prediction using machine learning techniques. Procedia Comp. Sci. 2020, 167, 599–606. [Google Scholar] [CrossRef]
- Hudson, R.; Urquhart, A. Technical trading and cryptocurrencies. Ann. Oper. Res. 2021, 297, 191–220. [Google Scholar] [CrossRef]
- Bouri, E.; Lau, C.K.M.; Saeed, T.; Wang, S.; Zhao, Y. On the intraday return curves of Bitcoin: Predictability and trading opportunities. Int. Rev. Financ. Anal. 2021, 76, 101784. [Google Scholar] [CrossRef]
- Chen, L.; Liu, Z.; Ma, M. Interactive visualization of geographic vector big data based on viewport generalization model. Appl. Sci. 2022, 12, 7710. [Google Scholar] [CrossRef]
- Fernandez, N.F.; Gundersen, G.W.; Rahman, A.; Grimes, M.L.; Rikova, K.; Hornbeck, P.; Ma’ayan, A. Clustergrammer, a web-based heatmap visualization and analysis tool for high-dimensional biological data. Sci. Data 2017, 4, 170151. [Google Scholar] [CrossRef] [PubMed]
- Gu, Z.; Eils, R.; Schlesner, M.; Ishaque, N. Enriched heatmap: An R/Bioconductor package for comprehensive visualization of genomic signal associations. BMC Genom. 2018, 19, 234. [Google Scholar] [CrossRef]
- Kane, G.C.; Young, A.G.; Majchrzak, A.; Ransbotham, S. Avoiding an oppressive future of machine learning: A design theory for emancipatory assistants. MIS Q. 2021, 45, 371–396. [Google Scholar] [CrossRef]
- Mehdizadeh, S.; Fathian, F.; Adamowski, J.F. Hybrid artificial intelligence-time series models for monthly stream-flow modeling. Appl. Soft Comput. 2019, 80, 873–887. [Google Scholar] [CrossRef]
- Wang, W.; Lu, C. Visualization analysis of big data research based on Citespace. Soft Comput. 2020, 24, 8173–8186. [Google Scholar] [CrossRef]
- Chen, Y.; Yang, J. Historic neighborhood design based on facility heatmap and pedestrian simulation: Case study in China. J. Urban Plann. Dev. 2020, 146, 04020001. [Google Scholar] [CrossRef]
- Hong, I.; Jung, J.K. What is so “hot” in heatmap? Qualitative code cluster analysis with foursquare venue. Cartographica 2017, 52, 332–348. [Google Scholar] [CrossRef]
- Khomtchouk, B.B.; Hennessy, J.R.; Wahlestedt, C. Shinyheatmap: Ultra fast low memory heatmap web interface for big data genomics. PLoS ONE 2017, 12, e0176334. [Google Scholar] [CrossRef]
- Van Craenendonck, T.; Elen, B.; Gerrits, N.; De Boever, P. Systematic comparison of heatmapping techniques in deep learning in the context of diabetic retinopathy lesion detection. Transl. Vis. Sci. Technol. 2020, 9, 64. [Google Scholar] [CrossRef] [PubMed]
- Venturini, T.; Jacomy, M.; Jensen, P. What do we see when we look at networks: Visual network analysis, relational ambiguity, and force-directed layouts. Big Data Soc. 2021, 8, 20539517211018488. [Google Scholar] [CrossRef]
- Fearne, R. An analysis of the distribution and price determinants of Airbnb rentals in Malta. Int. J. Hous. Markets Anal. 2022, in press. [CrossRef]
- Day, M.Y.; Huang, P.; Cheng, Y.; Lin, Y.T.; Ni, Y. Profitable day trading Bitcoin futures following continuous bullish (bearish) candle-sticks. Appl. Econ. Lett. 2022, 29, 947–954. [Google Scholar] [CrossRef]
- Day, M.Y.; Cheng, Y.; Huang, P.; Ni, Y. The profitability of trading US stocks in Quarter 4—Evidence from trading signals emitted by SOI and RSI. Appl. Econ. Lett. 2023, 30, 1173–1178. [Google Scholar] [CrossRef]
- Ni, Y.; Day, M.Y.; Huang, P.; Yu, S.R. The profitability of Bollinger Bands: Evidence from the constituent stocks of Taiwan 50. Phys. A Stat. Mech. Appl. 2020, 551, 124144. [Google Scholar] [CrossRef]
- Wu, M.; Huang, P.; Ni, Y. Investing strategies as continuous rising (falling) share prices released. J. Econ. Financ. 2017, 41, 763–773. [Google Scholar] [CrossRef]
- Liao, Y.; Day, M.Y.; Cheng, Y.; Huang, P.; Ni, Y. The Profitability of Technical Trading for Hotel Stocks Under COVID-19 Pandemic. J. Comput. 2021, 32, 44–54. [Google Scholar] [CrossRef]
- Gregoriou, A. Cryptocurrencies and asset pricing. Appl. Econ. Lett. 2019, 26, 995–998. [Google Scholar] [CrossRef]
- Yang, J.; Cao, Z.; Han, Q.; Wang, Q. Tactical asset allocation on technical trading rule and data snooping. Pac. Basin Financ. J. 2019, 57, 101049. [Google Scholar] [CrossRef]
- Barter, R.L.; Yu, B. Superheat: An R package for creating beautiful and extendable heatmaps for visualizing complex data. J. Comput. Graph. Stat. 2018, 27, 910–922. [Google Scholar] [CrossRef]
- Shavazipour, B.; López-Ibáñez, M.; Miettinen, K. Visualizations for Decision Support in Scenario-Based Multiobjective Optimization. Inf. Sci. 2021, 578, 1–21. [Google Scholar] [CrossRef]
- Sung, S.H.; Li, C.; Huang, X.; Xie, C. Enhancing distance learning of science—Impacts of remote labs 2.0 on students’ behavioral and cognitive engagement. J. Comput. Assist. Learn. 2021, 37, 1606–1621. [Google Scholar] [CrossRef]


| Authors | Conclusions |
|---|---|
| Gerritsen et al. (2020) [59] | Showed the significant predictive power of trend-following trading rules, particularly the MA trading rule, for trading Bitcoin. |
| Resta et al. (2020) [58] | Revealed that simple moving averages yield the best performance in Bitcoin markets when dealing with daily data. |
| Corbet et al. (2020) [31] | Provided support for Bitcoin trading via MA and VMA strategies as well as demonstrated that adopting buy signals in these trading rules generates superior returns compared to sell signals. |
| Hudson and Urquhart (2021) [61] | Provided evidence that technical trading rules offer substantially higher risk-adjusted returns for trading Bitcoin. |
| Bouri et al. (2021) [62] | Uncovered profitable possibilities for Bitcoin that challenge the market efficiency hypothesis. |
| Corbet et al. (2019) [50] | Highlighted the superiority of VMA trading regulations in cryptocurrency markets. |
| Lento and Gradojevic (2022) [38] | Revealed that Bollinger Bands and trading range breakout rules became profitable after transaction costs during the market crash resulting from COVID-19. |
| Cryptocurrency | Sample | Mean | Standard Deviation | Coeff. of Variance | Median | Minimum | Maximum | Skewness | Kurtosis |
|---|---|---|---|---|---|---|---|---|---|
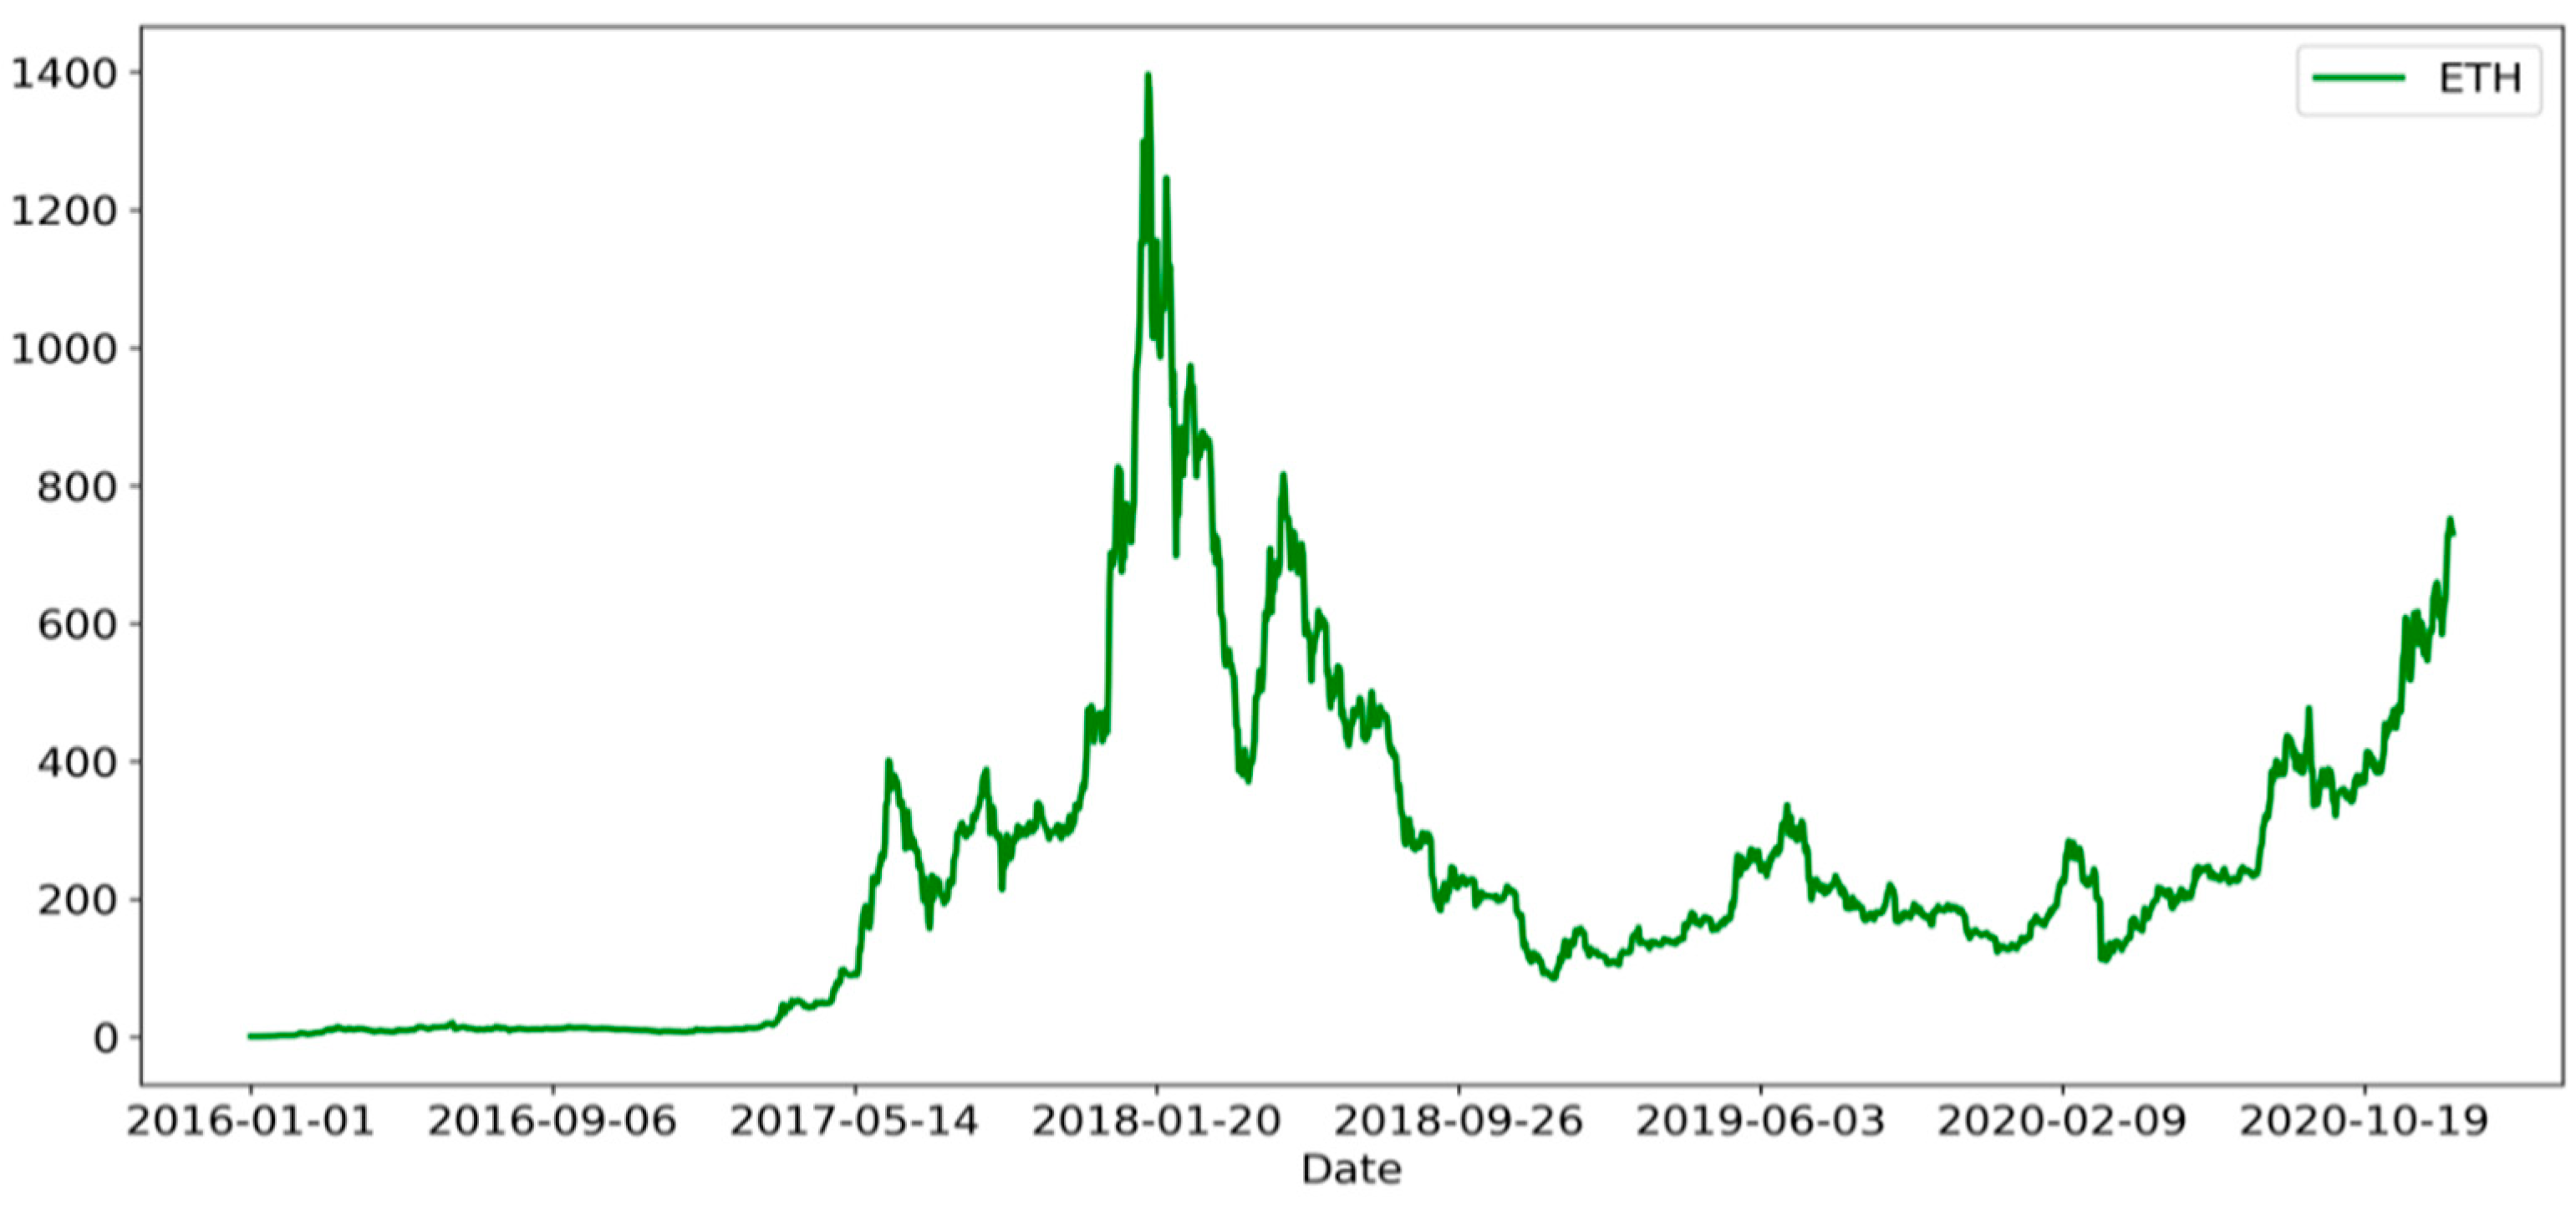
| ETH | 1824 | 241.29 | 232.05 | 96.17% | 194.79 | 0.94 | 1396.42 | 1.62 | 3.36 |
| (1) | (2) | (3) | (4) | (5) | (6) | (7) |
|---|---|---|---|---|---|---|
| VMA Trading Rules | No. of Trades | CR (%) | GAR (%) | CV | Avg. Duration Day | Max. Duration Day |
| (5, 20) | 90 | 76,491.51 | 7.66 | 9.880 | 20 | 94 |
| (5, 40) | 48 | 78,318.44 | 14.89 | 31.574 | 37 | 181 |
| (5, 60) | 42 | 24,24.45 | 7.99 | 34.317 | 42 | 186 |
| (5, 80) | 40 | 202.58 | 2.81 | 104.214 | 43 | 209 |
| (5, 100) | 30 | 3283.26 | 12.46 | 29.391 | 57 | 271 |
| (5, 120) | 22 | 8439.74 | 22.40 | 21.583 | 75 | 287 |
| (5, 140) | 24 | 10,418.40 | 21.41 | 59.823 | 69 | 415 |
| (5, 160) | 16 | 16,134.81 | 37.45 | 37.204 | 101 | 417 |
| (5, 180) | 18 | 9862.88 | 29.13 | 40.544 | 90 | 409 |
| 180 | 29.1 | 38.3 | 32.5 | 60.3 | 47.8 | ─ | ─ | ─ | ─ | ─ | 35.1 | 38.9 |
| 175 | 34.7 | 34.5 | 42.1 | 60.7 | 52.8 | ─ | ─ | ─ | ─ | ─ | ─ | 37.0 |
| 170 | 35.0 | 36.0 | 55.2 | 64.4 | 51.9 | 47.3 | ─ | ─ | 37.7 | ─ | ─ | ─ |
| 165 | 29.8 | 47.5 | 56.2 | 62.4 | 61.4 | 50.7 | ─ | ─ | ─ | ─ | ─ | ─ |
| 160 | 37.5 | 69.2 | 61.0 | 66.5 | 61.2 | 48.0 | 43.8 | ─ | ─ | 35.9 | ─ | ─ |
| 155 | 30.3 | 74.0 | 63.1 | 66.3 | 60.6 | 48.8 | 46.3 | ─ | ─ | ─ | 45.8 | ─ |
| 150 | 21.2 | 45.9 | 45.5 | 70.6 | 56.4 | 56.7 | 35.9 | 52.8 | ─ | ─ | ─ | 40.7 |
| 145 | 18.9 | 54.1 | 38.9 | 44.5 | 57.9 | 57.0 | 46.4 | 53.9 | ─ | ─ | ─ | ─ |
| 140 | 21.4 | 35.6 | 41.2 | 42.7 | 61.2 | 56.9 | 49.4 | 56.7 | 50.9 | 46.7 | ─ | ─ |
| 135 | 19.5 | 35.5 | 40.8 | 48.3 | 63.5 | 60.0 | 53.1 | 57.2 | 48.8 | 49.7 | 40.4 | ─ |
| 130 | 20.0 | 26.1 | 35.0 | 40.6 | 48.8 | 46.4 | 52.6 | 54.5 | 63.7 | 50.6 | 42.1 | ─ |
| 125 | 17.7 | 26.3 | 32.1 | 33.5 | 50.8 | 47.2 | 48.3 | 43.2 | 46.8 | 32.0 | 34.1 | 28.5 |
| 120 | 22.4 | 21.0 | 16.7 | 30.2 | 40.2 | 40.2 | 51.5 | 38.7 | 47.2 | 45.3 | 33.8 | 30.3 |
| 115 | 18.0 | 13.1 | 13.7 | 31.2 | 41.3 | 46.9 | 48.0 | 44.2 | 47.7 | 39.1 | 32.6 | 37.4 |
| 110 | 13.2 | 25.3 | 20.4 | 35.2 | 35.0 | 54.3 | 38.6 | 46.9 | 45.0 | 42.3 | 31.2 | 29.3 |
| 105 | 20.6 | 23.2 | 20.7 | 29.3 | 28.8 | 56.7 | 45.8 | 38.1 | 27.6 | 29.3 | 22.5 | 16.4 |
| 100 | 12.5 | 10.6 | 10.1 | 17.3 | 17.3 | 33.6 | 34.2 | 26.8 | 22.2 | 19.1 | 13.6 | 11.1 |
| 95 | 4.9 | 5.7 | 6.3 | 13.1 | 10.0 | 15.8 | 20.8 | 19.0 | 18.2 | 25.3 | 18.8 | 10.3 |
| 90 | 4.2 | 6.4 | 3.3 | 15.3 | 11.4 | 14.4 | 20.3 | 14.8 | 19.8 | 17.4 | 21.7 | 17.2 |
| 85 | 3.9 | 3.5 | 4.2 | 5.2 | 2.5 | 8.6 | 14.3 | 13.6 | 18.5 | 11.6 | 19.2 | 13.6 |
| 80 | 2.8 | −3.2 | 4.3 | −5.6 | 0.1 | 2.1 | 4.5 | 12.6 | 14.4 | 16.1 | 14.7 | 15.5 |
| 75 | 2.7 | 4.2 | 9.8 | −4.6 | 0.1 | 5.7 | 9.6 | 7.5 | 12.4 | 14.9 | 18.1 | 15.6 |
| 70 | 5.3 | 6.9 | 1.2 | −4.0 | −2.1 | 10.4 | 8.7 | 10.1 | 9.5 | 12.8 | 12.5 | 7.1 |
| 65 | 3.4 | 8.2 | 5.3 | 6.2 | 1.1 | 5.9 | 0.1 | 0.1 | 2.7 | 11.3 | 9.5 | 10.3 |
| 60 | 8.0 | 7.8 | 11.5 | −0.7 | 5.6 | 2.6 | 6.7 | 7.8 | 5.7 | 10.4 | 7.5 | |
| 55 | 12.0 | 9.8 | 14.2 | 7.6 | 0.1 | 6.0 | 3.6 | 8.9 | 4.7 | 0.0 | ||
| 50 | 14.6 | 11.1 | 11.6 | 12.0 | 2.7 | −1.8 | 7.8 | 3.9 | 3.7 | |||
| 45 | 14.5 | 19.1 | 13.0 | 8.7 | 6.8 | 1.5 | 2.7 | 2.7 | ||||
| 40 | 14.9 | 17.1 | 14.0 | 9.2 | 3.4 | 2.3 | −1.1 | |||||
| 35 | 16.3 | 18.3 | 13.0 | 7.0 | 5.5 | 1.1 | ||||||
| 30 | 12.7 | 16.6 | 11.1 | 9.0 | 6.3 | |||||||
| 25 | 8.4 | 14.7 | 12.2 | 8.2 | ||||||||
| 20 | 7.7 | 8.7 | 10.3 | |||||||||
| 15 | 4.2 | 1.1 | ||||||||||
| 10 | 2.5 | |||||||||||
| n2/n1 | 5 | 10 | 15 | 20 | 25 | 30 | 35 | 40 | 45 | 50 | 55 | 60 |
| 180 | 0.25 | 0.28 | 0.28 | 0.34 | 0.33 | ─ | ─ | ─ | ─ | ─ | 0.29 | 0.27 |
| 175 | 0.26 | 0.28 | 0.30 | 0.34 | 0.34 | ─ | ─ | ─ | ─ | ─ | ─ | 0.26 |
| 170 | 0.26 | 0.28 | 0.33 | 0.34 | 0.33 | 0.33 | ─ | ─ | 0.33 | ─ | ─ | ─ |
| 165 | 0.25 | 0.31 | 0.34 | 0.34 | 0.34 | 0.34 | ─ | ─ | ─ | ─ | ─ | ─ |
| 160 | 0.27 | 0.34 | 0.34 | 0.34 | 0.34 | 0.33 | ─ | ─ | ─ | 0.28 | ─ | ─ |
| 155 | 0.25 | 0.34 | 0.34 | 0.34 | 0.34 | 0.33 | 0.34 | ─ | ─ | ─ | 0.34 | ─ |
| 150 | 0.22 | 0.30 | 0.31 | 0.34 | 0.34 | 0.34 | 0.30 | 0.34 | ─ | ─ | ─ | 0.33 |
| 145 | 0.20 | 0.31 | 0.30 | 0.30 | 0.34 | 0.34 | 0.33 | 0.34 | ─ | ─ | ─ | ─ |
| 140 | 0.21 | 0.26 | 0.30 | 0.28 | 0.34 | 0.33 | 0.33 | 0.34 | 0.31 | 0.34 | ─ | ─ |
| 135 | 0.24 | 0.28 | 0.30 | 0.31 | 0.34 | 0.33 | 0.33 | 0.34 | 0.31 | 0.33 | 0.33 | ─ |
| 130 | 0.24 | 0.26 | 0.31 | 0.31 | 0.33 | 0.33 | 0.33 | 0.33 | 0.34 | 0.33 | 0.33 | ─ |
| 125 | 0.23 | 0.29 | 0.31 | 0.30 | 0.33 | 0.33 | 0.31 | 0.30 | 0.30 | 0.27 | 0.28 | 0.28 |
| 120 | 0.25 | 0.27 | 0.28 | 0.28 | 0.31 | 0.30 | 0.31 | 0.30 | 0.30 | 0.31 | 0.25 | 0.27 |
| 115 | 0.25 | 0.25 | 0.26 | 0.29 | 0.31 | 0.30 | 0.30 | 0.30 | 0.31 | 0.30 | 0.26 | 0.26 |
| 110 | 0.23 | 0.27 | 0.28 | 0.29 | 0.29 | 0.31 | 0.30 | 0.30 | 0.30 | 0.31 | 0.29 | 0.27 |
| 105 | 0.26 | 0.28 | 0.28 | 0.28 | 0.26 | 0.30 | 0.30 | 0.27 | 0.27 | 0.27 | 0.26 | 0.24 |
| 100 | 0.21 | 0.22 | 0.24 | 0.25 | 0.27 | 0.29 | 0.28 | 0.27 | 0.26 | 0.24 | 0.23 | 0.22 |
| 95 | 0.18 | 0.21 | 0.23 | 0.22 | 0.23 | 0.25 | 0.25 | 0.25 | 0.24 | 0.25 | 0.23 | 0.22 |
| 90 | 0.19 | 0.19 | 0.20 | 0.24 | 0.23 | 0.25 | 0.26 | 0.23 | 0.24 | 0.23 | 0.23 | 0.22 |
| 85 | 0.17 | 0.18 | 0.22 | 0.22 | 0.22 | 0.22 | 0.24 | 0.25 | 0.23 | 0.22 | 0.22 | 0.20 |
| 80 | 0.16 | 0.18 | 0.22 | 0.21 | 0.00 | 0.20 | 0.23 | 0.23 | 0.24 | 0.22 | 0.21 | 0.21 |
| 75 | 0.16 | 0.19 | 0.22 | 0.20 | 0.00 | 0.22 | 0.24 | 0.24 | 0.22 | 0.22 | 0.21 | 0.20 |
| 70 | 0.17 | 0.19 | 0.19 | 0.20 | 0.21 | 0.23 | 0.22 | 0.23 | 0.22 | 0.22 | 0.20 | 0.18 |
| 65 | 0.16 | 0.19 | 0.21 | 0.22 | 0.22 | 0.21 | 0.16 | 0.15 | 0.22 | 0.21 | 0.19 | 0.18 |
| 60 | 0.17 | 0.19 | 0.22 | 0.20 | 0.21 | 0.21 | 0.20 | 0.21 | 0.20 | 0.20 | 0.18 | |
| 55 | 0.18 | 0.20 | 0.22 | 0.20 | 0.18 | 0.19 | 0.19 | 0.19 | 0.18 | 0.00 | ||
| 50 | 0.18 | 0.19 | 0.20 | 0.20 | 0.18 | 0.17 | 0.19 | 0.17 | 0.16 | |||
| 45 | 0.18 | 0.21 | 0.20 | 0.19 | 0.18 | 0.17 | 0.16 | 0.14 | ||||
| 40 | 0.17 | 0.19 | 0.18 | 0.26 | 0.20 | 0.15 | 0.13 | |||||
| 35 | 0.17 | 0.18 | 0.31 | 0.24 | 0.22 | 0.16 | ||||||
| 30 | 0.28 | 0.33 | 0.28 | 0.27 | 0.23 | |||||||
| 25 | 0.24 | 0.31 | 0.30 | 0.24 | ||||||||
| 20 | 0.22 | 0.25 | 0.26 | |||||||||
| 15 | 0.21 | 0.13 | ||||||||||
| 10 | 0.17 | |||||||||||
| n2/n1 | 5 | 10 | 15 | 20 | 25 | 30 | 35 | 40 | 45 | 50 | 55 | 60 |
Disclaimer/Publisher’s Note: The statements, opinions and data contained in all publications are solely those of the individual author(s) and contributor(s) and not of MDPI and/or the editor(s). MDPI and/or the editor(s) disclaim responsibility for any injury to people or property resulting from any ideas, methods, instructions or products referred to in the content. |
© 2023 by the authors. Licensee MDPI, Basel, Switzerland. This article is an open access article distributed under the terms and conditions of the Creative Commons Attribution (CC BY) license (https://creativecommons.org/licenses/by/4.0/).
Share and Cite
Chiu, C.-L.; Ni, Y.; Hu, H.-C.; Day, M.-Y.; Chen, Y. Enhancing Crypto Success via Heatmap Visualization of Big Data Analytics for Numerous Variable Moving Average Strategies. Appl. Sci. 2023, 13, 12805. https://doi.org/10.3390/app132312805
Chiu C-L, Ni Y, Hu H-C, Day M-Y, Chen Y. Enhancing Crypto Success via Heatmap Visualization of Big Data Analytics for Numerous Variable Moving Average Strategies. Applied Sciences. 2023; 13(23):12805. https://doi.org/10.3390/app132312805
Chicago/Turabian StyleChiu, Chien-Liang, Yensen Ni, Hung-Ching Hu, Min-Yuh Day, and Yuhsin Chen. 2023. "Enhancing Crypto Success via Heatmap Visualization of Big Data Analytics for Numerous Variable Moving Average Strategies" Applied Sciences 13, no. 23: 12805. https://doi.org/10.3390/app132312805
APA StyleChiu, C.-L., Ni, Y., Hu, H.-C., Day, M.-Y., & Chen, Y. (2023). Enhancing Crypto Success via Heatmap Visualization of Big Data Analytics for Numerous Variable Moving Average Strategies. Applied Sciences, 13(23), 12805. https://doi.org/10.3390/app132312805