1. Introduction
Railroads have consistently been identified as crucial components of the transportation infrastructure underpinning the Korean national economy. Over the preceding decade (2010–2019, excluding the period of 2020~2022 due to the impact of COVID) in Korea, an examination of travel patterns reveals an average daily volume of approximately 21 million regional trips [
1]. Notably, the share of rail transport escalated to 20% in 2019, marking a discernible increase from the 16.3% recorded in 2010. Concurrently, the share of road transport experienced a decline, decreasing to 80% in 2019 from 83.7% in 2010. This pronounced shift in modal distribution is a direct outcome of the sustained governmental commitment to the railway sector, evident through investments in both novel infrastructural undertakings and the modernization of existing systems. A pivotal development occurred in 2020 when, for the first time, the cumulative government investment in the railroad sector surpassed that allocated to the roadway sector. This milestone underscores a strategic reconfiguration in the prioritization and reinforcement of the railroad infrastructure within the transportation investment.
While society reaps considerable benefits from railroad transportation, persisting safety concerns necessitate concerted efforts to mitigate the frequency and impact of railroad accidents. In the context of rail transportation, incidents bear the potential for producing adverse outcomes, including casualties, infrastructural and rolling stock impairment, service interruptions, and environmental damage. The Railroad Safety Act in Korea defines “Railroad safety” as the ongoing process wherein railroad operators and managers of railroad facilities consistently identify and mitigate risk factors associated with the operation of railroads or the management of railroad facilities, which could lead to casualties or property damage. It signifies a condition where the level of risk remains within an acceptable range. Therefore, railroad safety involves safeguarding both lives and property by overseeing, administering, and advancing technological innovations across all modes of rail transport. Particularly significant are accidents with multiple fatalities, prompting profound inquiries into railroad safety within the realms of media and public discourse. These accidents not only bring pertinent issues to the forefront and initiate discussions, but also catalyze actionable measures, serving as pivotal junctures for the enhancement of railroad safety. Within the regulatory framework of the Railroad Safety Act, the Ministry of Land, Infrastructure and Transport (MOLIT) in Korea periodically releases a structured Railroad Safety Master Plan (RSMP) at five-year intervals. This comprehensive strategy encompasses quantifiable safety objectives, encompassing accident rates and associated fatality figures. As a result, the precise forecasting of railroad accident frequencies and their consequential implications for stakeholders emerges as an essential prerequisite for advancing railroad safety. Such foresight significantly contributes to the overarching goal of advancing safety standards within the domain of railroad transportation.
Understanding the key factors influencing the occurrence and consequences of railroad accidents is crucial for developing effective strategies to mitigate casualties, infrastructure and rolling stock damage, service disruptions, and environmental harm. However, numerous researchers have dedicated their efforts to examining the frequency and severity of railroad accidents, with a particular emphasis on fatal train incidents and railroad grade crossing accidents. Most of the research has concentrated on analyzing the frequency and impact of fatal train accidents, primarily in terms of casualties. Notably, there is a dearth of studies focused on accurately predicting the duration of time delays resulting from railroad accidents, particularly utilizing comprehensive historical data on railroad incidents in Korea, as far as the author is aware.
This study aims to identify the key factors influencing the likelihood and duration of time delays in railroad events, encompassing incidents and accidents by utilizing a comprehensive set of factors, such as event type, season, train type, location, operator size, person type involved, facility type, causes and so on. Also, in predicting time delays, comparing model performance by employing conventional statistical models and artificial neural network (ANN) models is another purpose of this study.
The paper commences with a literature review encompassing prior research endeavors related to modeling accident severities (including time delay related), subsequently introducing the dataset employed. The ensuing sections expound upon the methodological framework employed for model estimation and furnish insights into the outcomes of the estimation process. Lastly, a summative discussion is presented, along with recommendations for further research.
2. Literature Review
Railroad safety studies have seen the emergence of numerous predictive models designed to evaluate both the frequency and severity of accidents. A predominant approach in these models involves the analysis of mean count response data, establishing relationships between independent and dependent variables under specific statistical distribution assumptions. Notably, Evans [
2,
3,
4] conducted an in-depth examination of fatal train accidents on Britain’s mainline railways, leveraging 31 years of historical data. His analysis encompassed the study of trends in accident frequencies and fatalities arising from 75 fatal collisions, derailments, and buffer stop overruns, totaling 273 fatalities among passengers, employees, and the public. In addressing annual accident frequencies, Evans employed a Poisson distribution model to account for and estimate the mean number of accidents per billion train kilometers. Similarly, Miwa et al. [
5] investigated train accidents within the Japanese railroad system. They adopted an exponential regression model to scrutinize 71 serious train accidents occurring between 1987 and 2003, employing the time interval between consecutive accidents as a predictor variable. Their findings indicated that the exponential distribution aptly characterized the number of days between successive accidents, the log-normal distribution fitted the train suspension time (using the factors of accident types, causes and years), and a Poisson distribution aligned with the number of casualties. When estimating the total annual accident count, the exponential function emerged as the preferred model for representing the relationship between annual accident frequency and the time period. In terms of predicting train delay time, Park et al. [
6] revealed that the length of duration of delayed time due to railway accidents is dependent on the factors such as train types (express train vs. metro), causes (human-related vs. non-human-related), and magnitude of occurrence (i.e., number of casualties, number of derailed trains).
In the realm of railway accident severity assessment, Liu et al. [
7] investigated cargo-train derailments, scrutinizing the relationship between the number of derailed cabins and severity. They employed a zero-truncated negative binomial (ZTNB) regression model along with a quantile regression model. Their analysis was grounded in a dataset comprising 458 cargo-train derailments attributed to brake-rail causes in the United States spanning the years 2001 to 2010. Lim [
8], in a distinct context, applied modeling techniques, including zero-truncated negative binomial (ZTNB) regression and Artificial Neural Networks (ANNs), to predict railway accidents on South Korea’s National Railroad. This inquiry leveraged historical accident data to assess the effectiveness of the models in accurately forecasting accidents, thereby offering valuable insights for accident prevention.
In the domain of train accident rate calculation, Evans [
9] determined the fatal train accident rate per billion train kilometers for Europe’s mainline railways spanning the years 1990 to 2019. This estimation relied on the assumption of accidents following a Poisson distribution within specified time periods and train kilometers per year. Employing a similar methodology, Zhang et al. [
10] analyzed the frequency of derailments and collisions in freight train accidents in the United States, attributed to human factors. Their model incorporated yearly train miles and the occurrence of train accidents as explanatory variables, deploying a Negative Binomial (NB) model.
Numerous prior studies in the field of highway-rail crossing analysis have employed the Generalized Linear Model (GLM) approach and its extensions, which make assumptions about specific statistical distributions, as mentioned earlier. For instance, Austin and Carson [
11] delved into the analysis of accident frequency data related to highway-rail crossings, highlighting the superior performance of the negative binomial distribution model over the Poisson model and conventional multiple linear regression techniques. Concurrently, several scholars have explored the realm of collision severity analysis, spanning from fatal to non-injury outcomes. Notable researchers such as Lu and Tolliver [
12], Hu et al. [
13], Oh et al. [
14], Raub [
15], Ma et al. [
16], Kang and Khattak [
17], Ghomi et al. [
18], Hao and Daniel [
19,
20,
21], Haleem and Gan [
22], Fan et al. [
23], Eluru et al. [
24], and Savolainen et al. [
25] have employed various GLM models to investigate these aspects.
In response to the prevalence of zero values in railroad accident data, where instances of zero-time delays are observed, several studies have advocated for the application of models such as the zero-inflated negative binomial and zero-inflated Poisson models [
26,
27,
28]. For instance, Lambert [
29] employed the zero-inflated Poisson (ZIP) model to predict manufacturing defects. Ridout et al. [
30] conducted an extensive review of contemporary statistical models tailored for count data characterized by an overabundance of zero values. Joe and Zhu [
31] conducted a comparative analysis between generalized Poisson models and zero-inflated negative binomial (ZINB) models. In the domain of caries research, Mwalili et al. [
32] made substantial contributions by utilizing the zero-inflated negative binomial model to rectify misclassifications. Neelon et al. [
33] proposed a Bayesian model specifically designed for zero-inflated count data, focusing on the analysis of psychiatric outpatient service utilization.
In addition to the conventional approaches, Artificial Neural Network (ANN) models have garnered popularity in both practical applications and research, offering enhanced predictive accuracy and surmounting limitations associated with statistical prediction models in transportation studies, particularly within the domain of vehicle accidents. Notably, Zeng and Huang [
34] employed an ANN model for predicting the severity of highway collisions, surpassing the performance of a statistical ordered logit model. Abdelwahab and Abdel-Aty [
35] determined that multilayer neural networks provided more accurate classifications of severity outcomes compared to ordered logit models. Codur and Tortum [
36] demonstrated the applicability of ANN models in the analysis of traffic accident frequency. While there is a considerable focus on the implementation of ANN models in roadway accident prediction studies, a limited number of researchers have leveraged ANNs to forecast accident frequency and severity within the railway sector. Zheng et al. [
37] explored the likelihood of train–vehicle crashes at highway-rail grade crossings (HRGC) and illustrated the superior performance of ANN models compared to the decision tree approach in predictive and descriptive capabilities using public HRGC case studies in North Dakota spanning the years 1996 to 2014. Gao et al. [
38] investigated the utility of a convolutional neural network (CNN), a deep learning-based approach, on the same dataset employed by Zheng et al. [
37], conducting a comparative analysis of various machine learning and deep learning methods. For the Canadian HRGC database spanning from 2004 to 2013, Yang et al. [
39] proposed a machine learning-based methodology, utilizing the RandomForest algorithm to effectively examine the relationships between accident rates and contributing factors.
3. Data Descriptions
3.1. Overview of Railroad Accidents in Korea
This section commences with a concise overview of railroad accident statistics. The investigation employed a dataset encompassing 22 years of railway accident data, culled from the Railroad Safety Information System (RSIS) spanning the timeframe of 2001 to 2022. The RSIS database features comprehensive historical records of accidents, including temporal specifics, causative factors, duration of train suspensions, fatalities, injuries, geographic coordinates, meteorological conditions, and other pertinent details. The dataset is classified into two distinct categories. The first category pertains to accidents primarily characterized by their detrimental impact on either human life or property and encompasses occurrences such as fatal train accidents (involving train-to-train collisions, derailments, or fires on trains), ground-level crossing accidents (involving train-to-human or train-to-vehicle collisions at ground-level crossings), and human-involved accidents (involving deaths or injuries resulting from train operations or other factors). The second category encompasses incidents that gave rise to perilous situations, exemplified by near misses, as well as events leading to time delays, such as those caused by train malfunctions or facility failures.
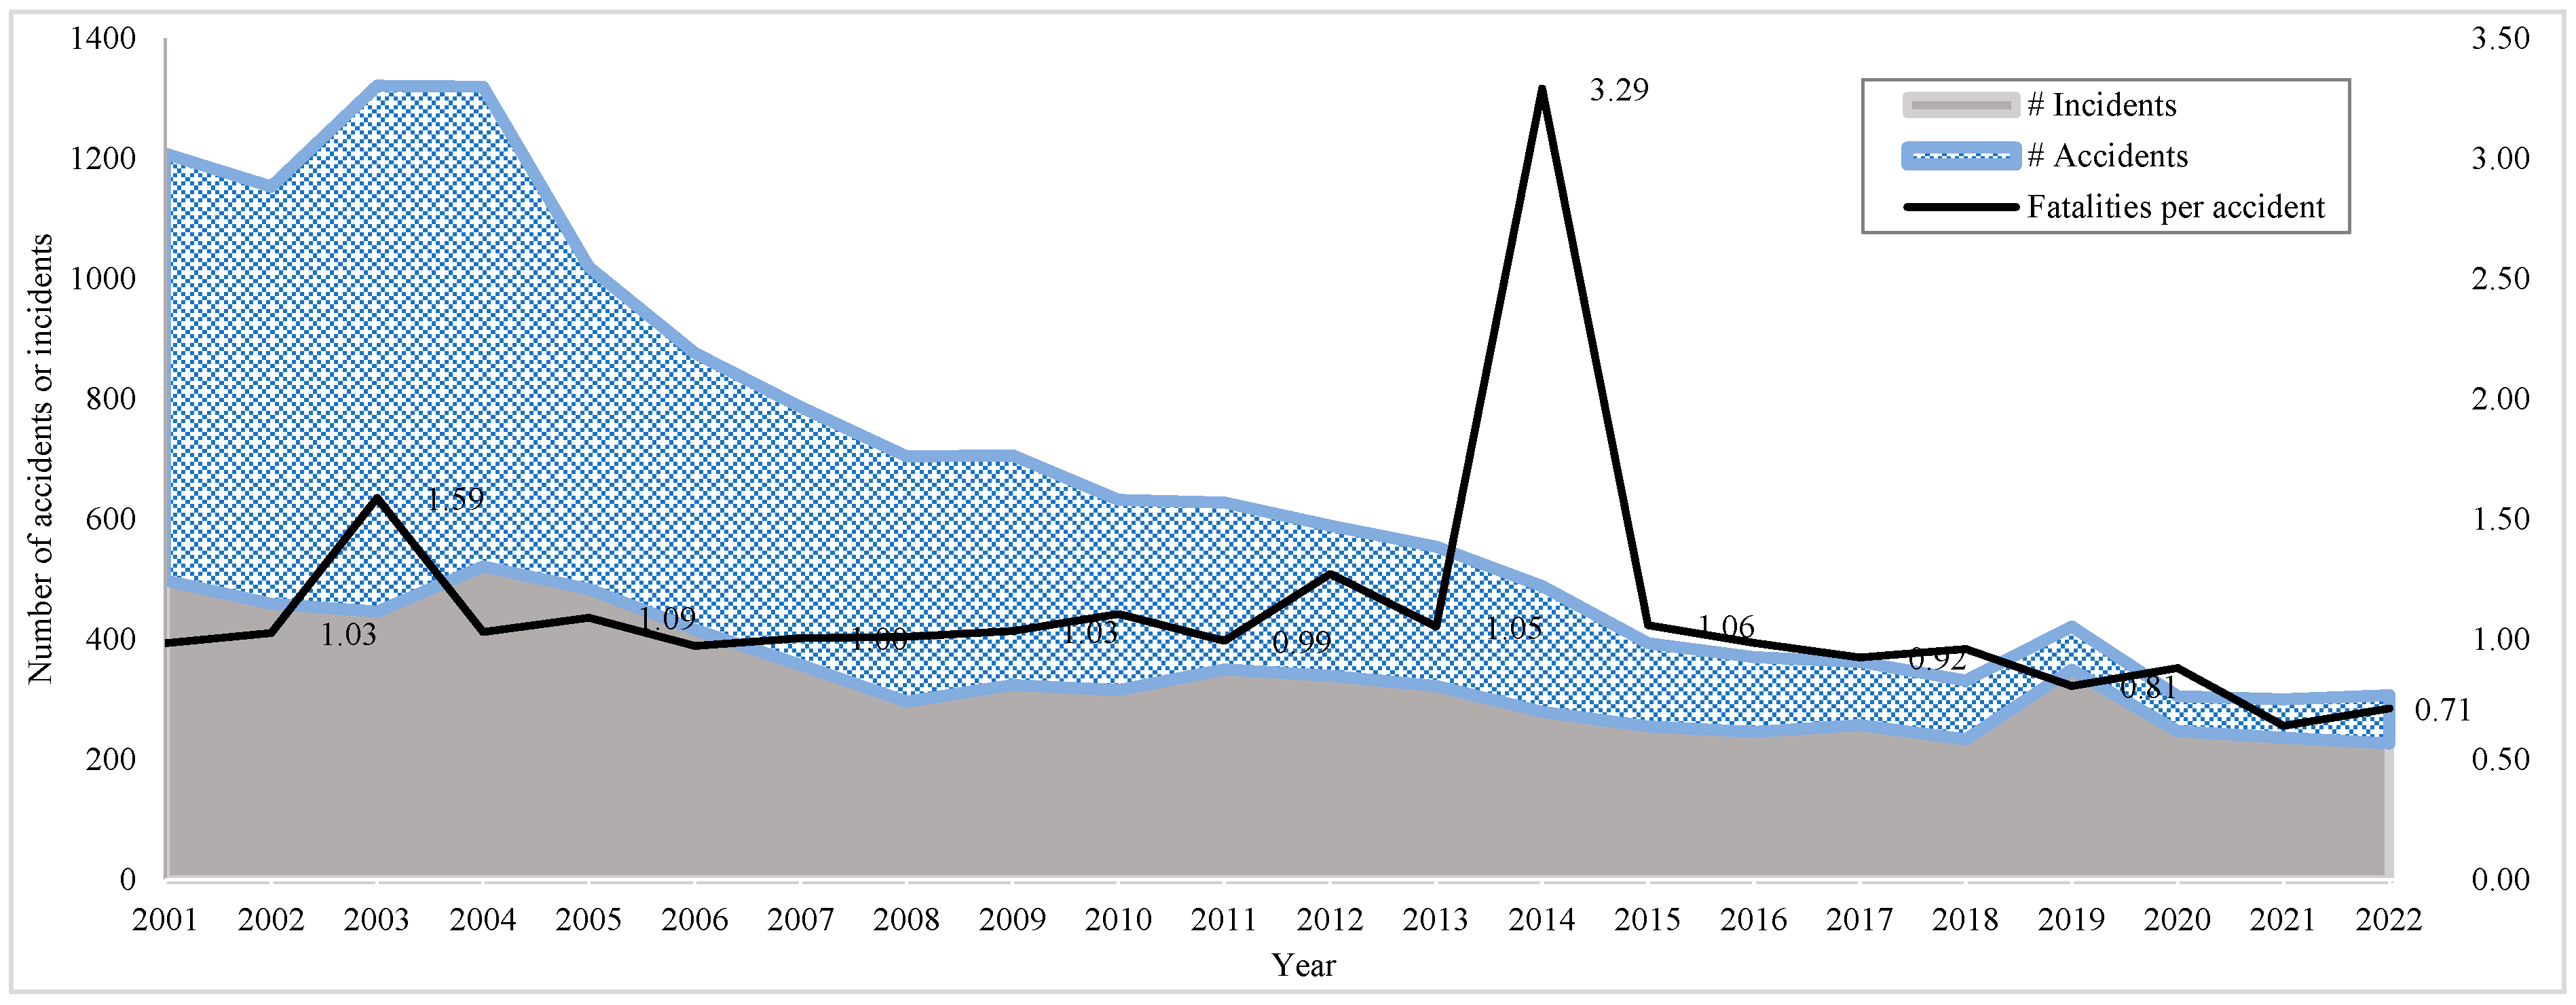
Figure 1 presents the RSIS dataset, offering a comparative analysis of “Incidents” and “Accidents” during the years 2001 and 2022. Herein, “Fatality” encompasses the total number of deaths and/or injuries resulting from any railway accident. In 2001, the dataset records 498 “Incidents”, a number that exhibited a noteworthy reduction to 227 in 2022. This reduction in “Incidents” is reflected in an annual growth rate (AGR) of −3.7%. Similarly, the data indicates a decline in “Accidents” from 710 instances in 2001 to a mere 80 occurrences in 2022. This remarkable decrease in “Accidents” corresponds to an AGR of approximately −9.9%. The negative AGR values underscore a substantial decline in both “Incidents” and “Accidents”, with “Accidents” displaying a more pronounced reduction over the specified period. It is worth noting that, aside from an anomaly in the year 2014, where a train collision resulted in 477 injuries (based on the statement of accident overview in the data field of RSIS dataset, following a rear-end collision of a departing train from Sangwangsimni station with an incoming train on 2 May 2014), the number of fatalities per accident has remained relatively stable. The rationale for this development lies in the widespread adoption of state-of-the-art technological innovations, including advanced safety systems such as automatic train control, train radio communications, various grade level crossing solutions, and passenger safety doors. Notably, this period has witnessed the extensive implementation of these technologies by numerous railroad operators, coupled with the strategic repositioning of level-crossings to subterranean or elevated positions [
8].
This study seeks to measure time delays caused by various accidents or incidents by analyzing the impact between time delays and factors such as season, size of train operators, type of railroad, accident cause, accident location, etc.
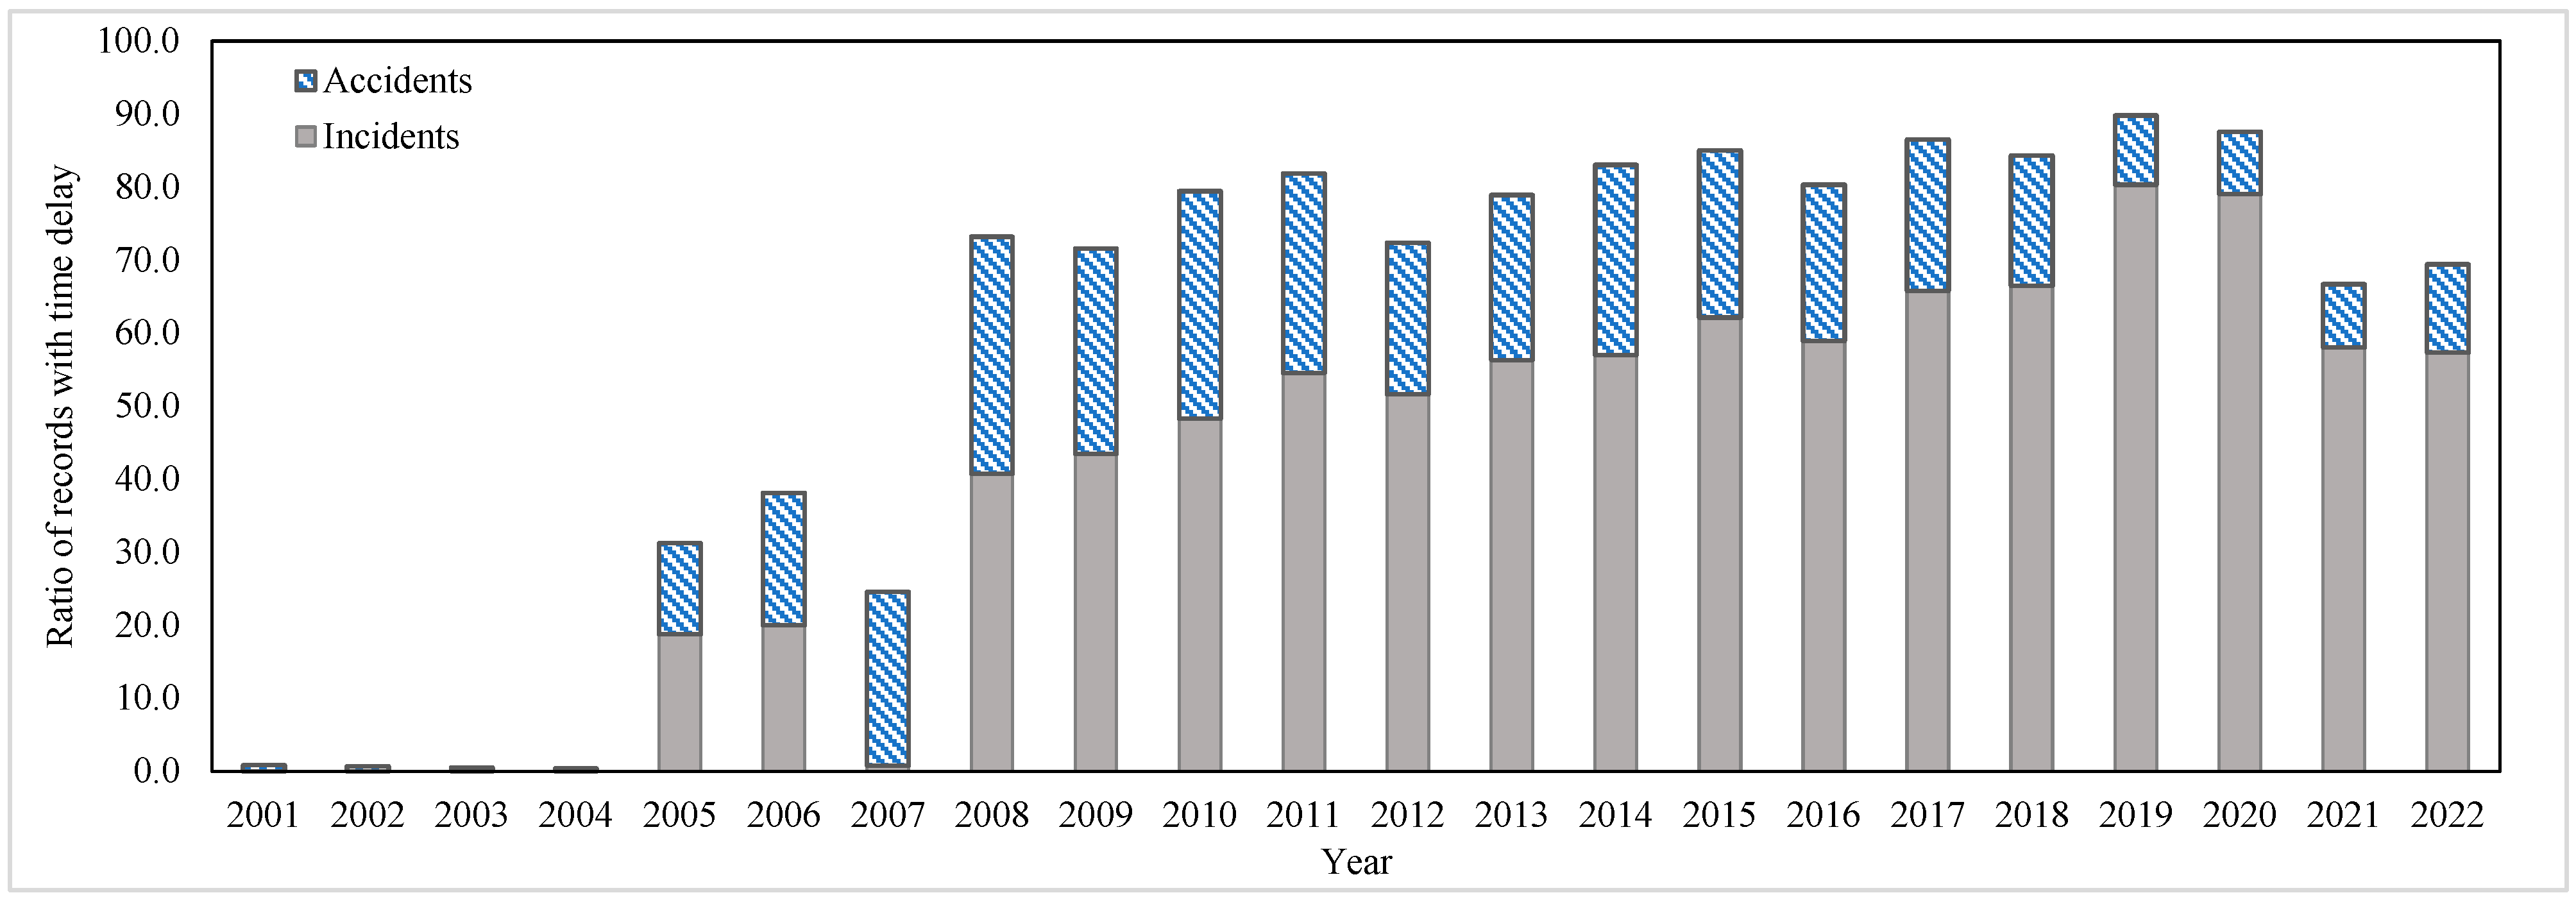
Figure 2 represents the ratio of the number of accidents and incidents with time delay records. A total of 14,771 accidents and incidents occurred, and only 38.3% of them had a time delay record of 22 years on average. In detail, the proportion was only a small portion of 0.9% in 2001 and 2007, but increased noticeably to an average of 78.8% in the remaining years. In general, reporting of train accidents and incidents follows the guidelines on railway accident and investigation reporting. This guideline was established under the Railway Safety Act in November 2007, and serves to define the specific procedures and methods for reporting railway accidents. It aims to ensure the timely and accurate reporting of such incidents. Therefore, this study used the data for the analysis starting from 2008. This is because it was recorded in accordance with appropriate methods and procedures of subsequent guidelines.
Table 1 is a brief summary of railroad accident statistics divided into before and after periods since 2008, when the guidelines were implemented. Although the period since 2008 has more than doubled compared to the previous period, the total number of accidents has decreased significantly compared to before. Specifically, train-related passenger accidents decreased significantly by 54%, and ground crossing (GC) accidents also decreased by about 38%. This is because many of the existing GCs were demolished, as they were relocated up or down the road and, as a result, the number decreased by more than half from 1744 in 2001 to 808 in 2021 [
1]. The delayed operation means that high-speed trains and metro trains are delayed by 10 min, conventional passenger trains are delayed by 20 min, and freight trains and other trains are delayed by more than 40 min. Railroad events tended to decrease on a yearly basis since 2008. However, no decreasing trend was found in the number of fatal train accidents (train fires, collisions, derailments).
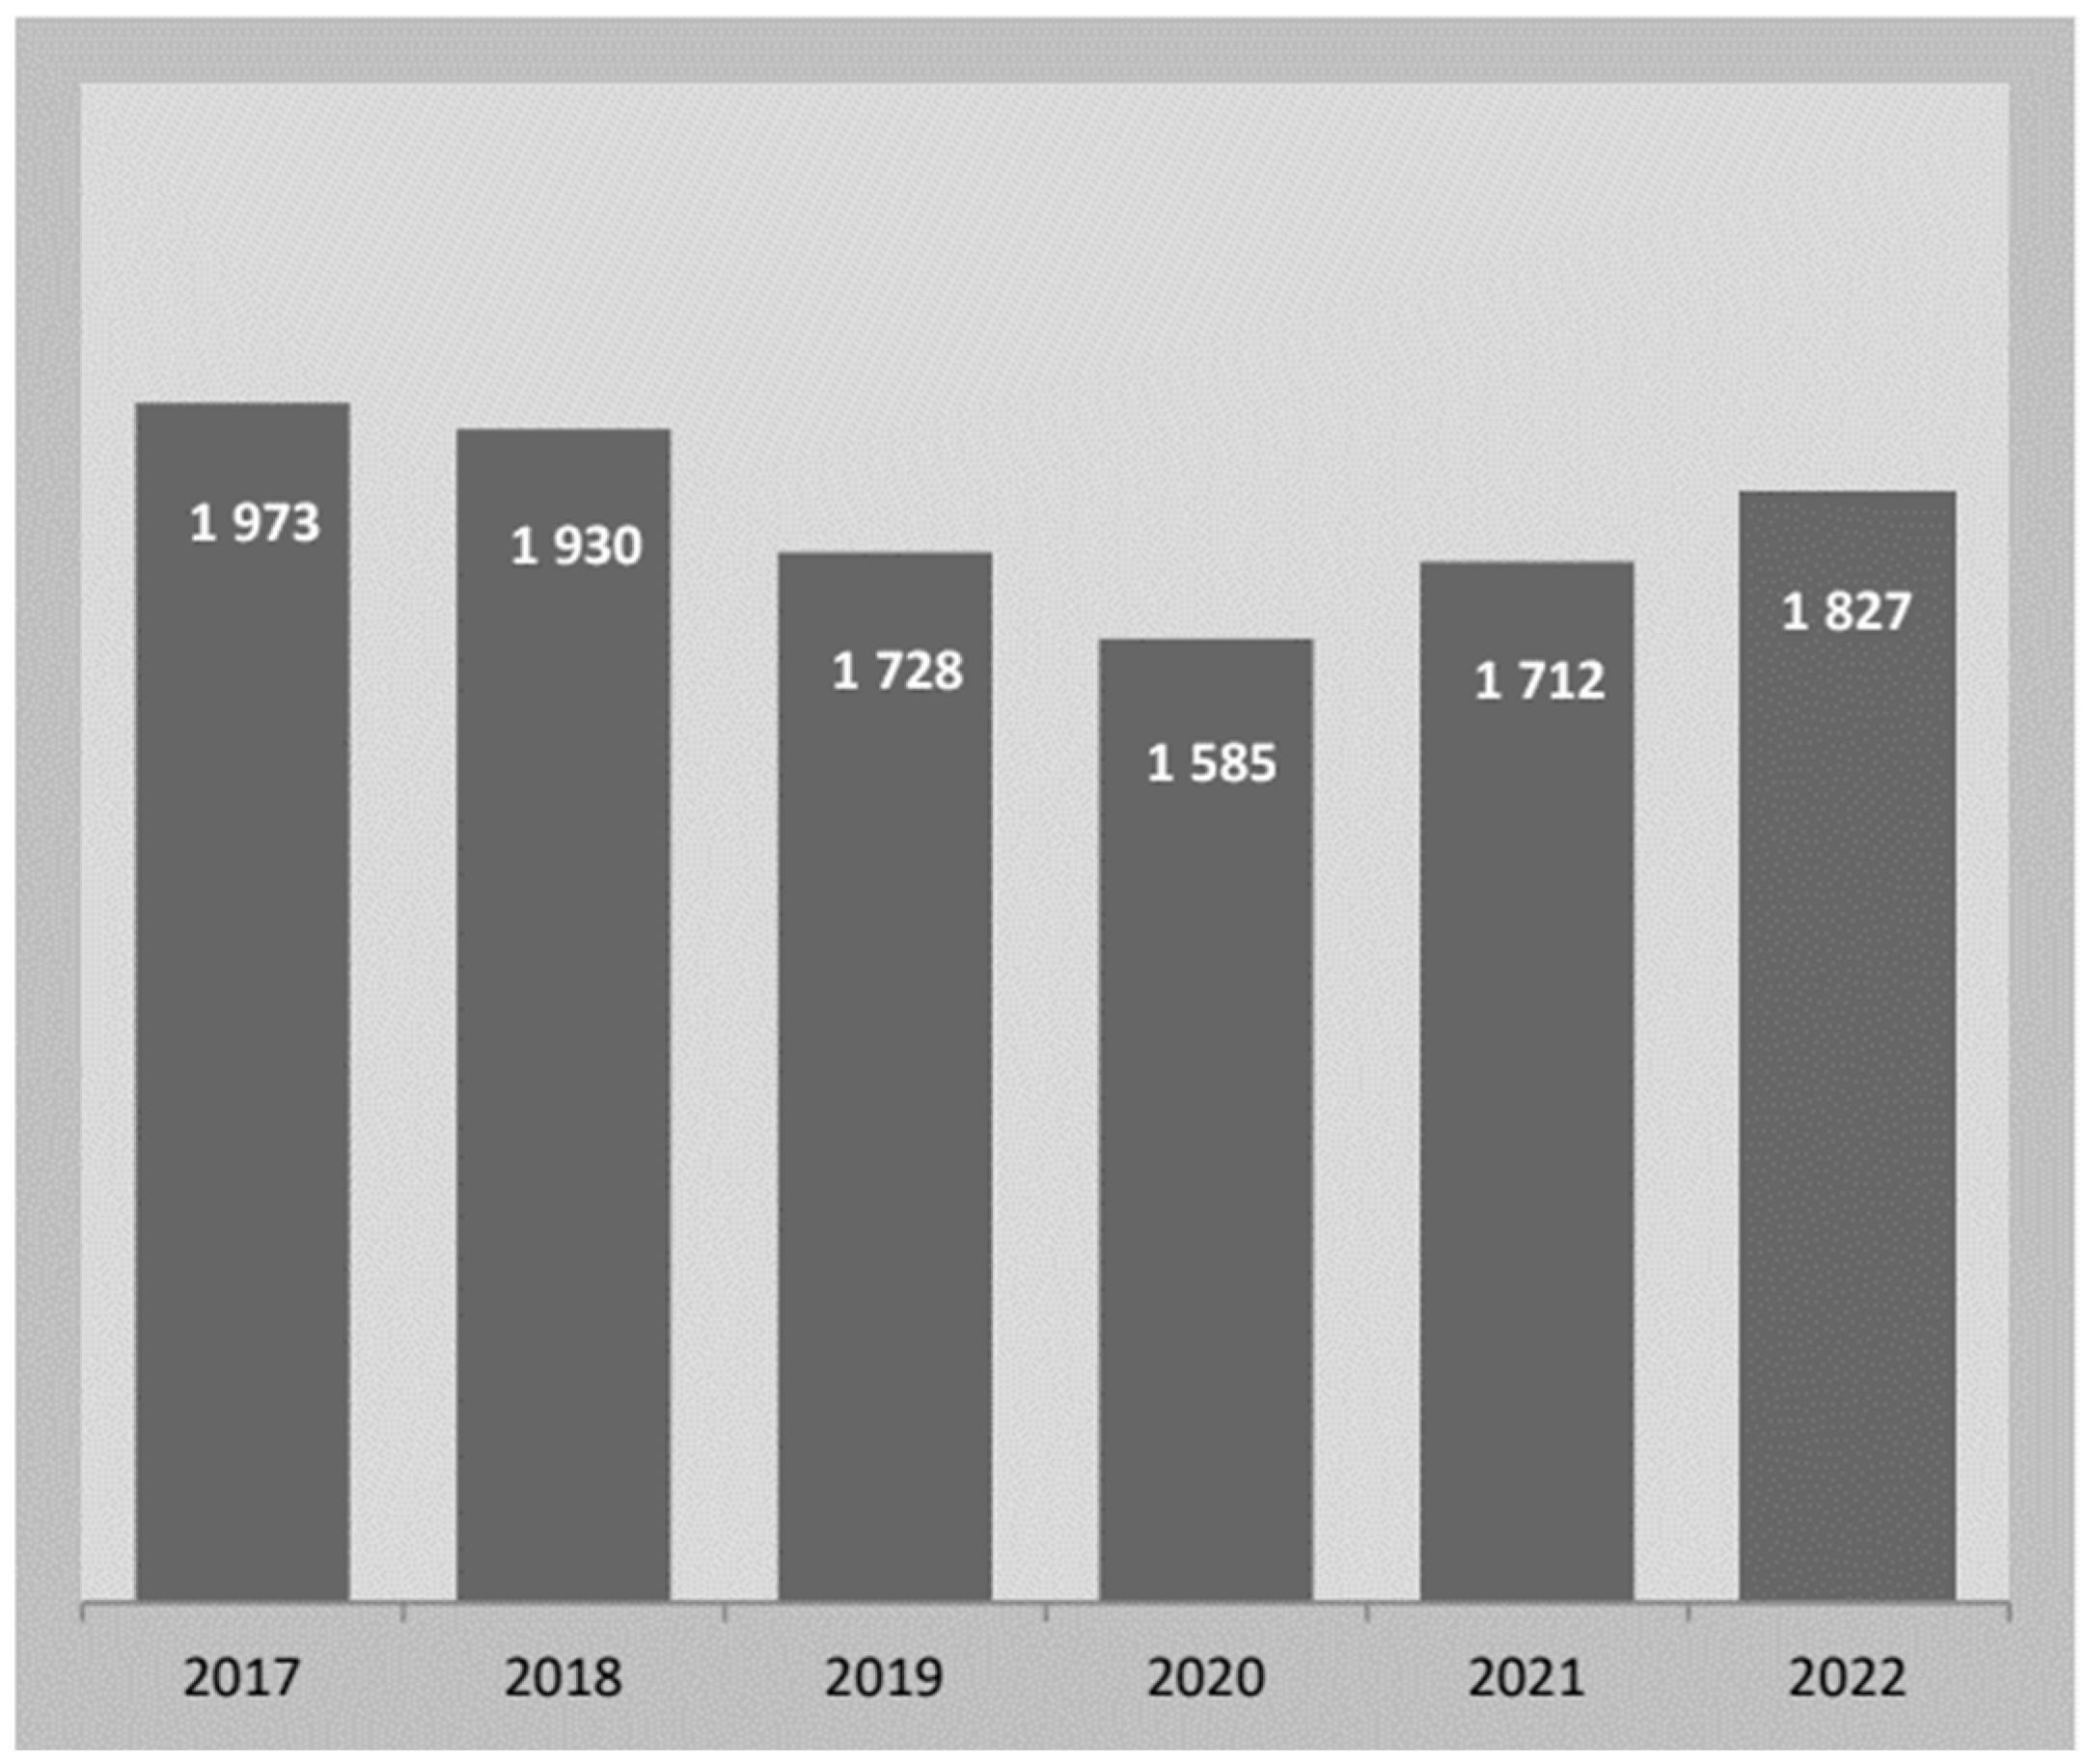
Table 2 shows the number of railroad accidents categorized by their causes and the average train delay time attributed to since 2008. Human factors include people such as field workers, staffs, route controllers, train drivers, crew, and passengers. Technical factors are mainly related to malfunctions, failures, and incorrect installation of equipment, devices, and interfaces between systems. Lastly, external factors are completely influenced by environmental conditions such as bad weather. The numbers of occurrences in human and technical factors both tended to decrease over the past 15 years and, further, both factors are main causes. For a comparison of accident occurrences to other countries, International Union of Railways (UIC) Safety Report has been referred to. The UIC publishes safety report every year by collecting and analyzing significant accident data from 32 different countries (see the list of countries on pg. 5 of the UIC Safety Report 2023 [
40]). According to the UIC report, the annual count of significant accidents decreased by approximately 25% in 2014 compared to 2006. The period of 2017–2020 sees a slow decrease in significant accidents, with its lowest level in 2020. 2020 was an exceptional year due to COVID-19 restrictions, and significant accidents slowly increased in 2021 with 1712 records, which is comparable to the pre-COVID-19 year 2019 (−1%). An increase in significant accidents for the established members in 2022 can be explained by a significant rise in traffic (see
Figure 3).
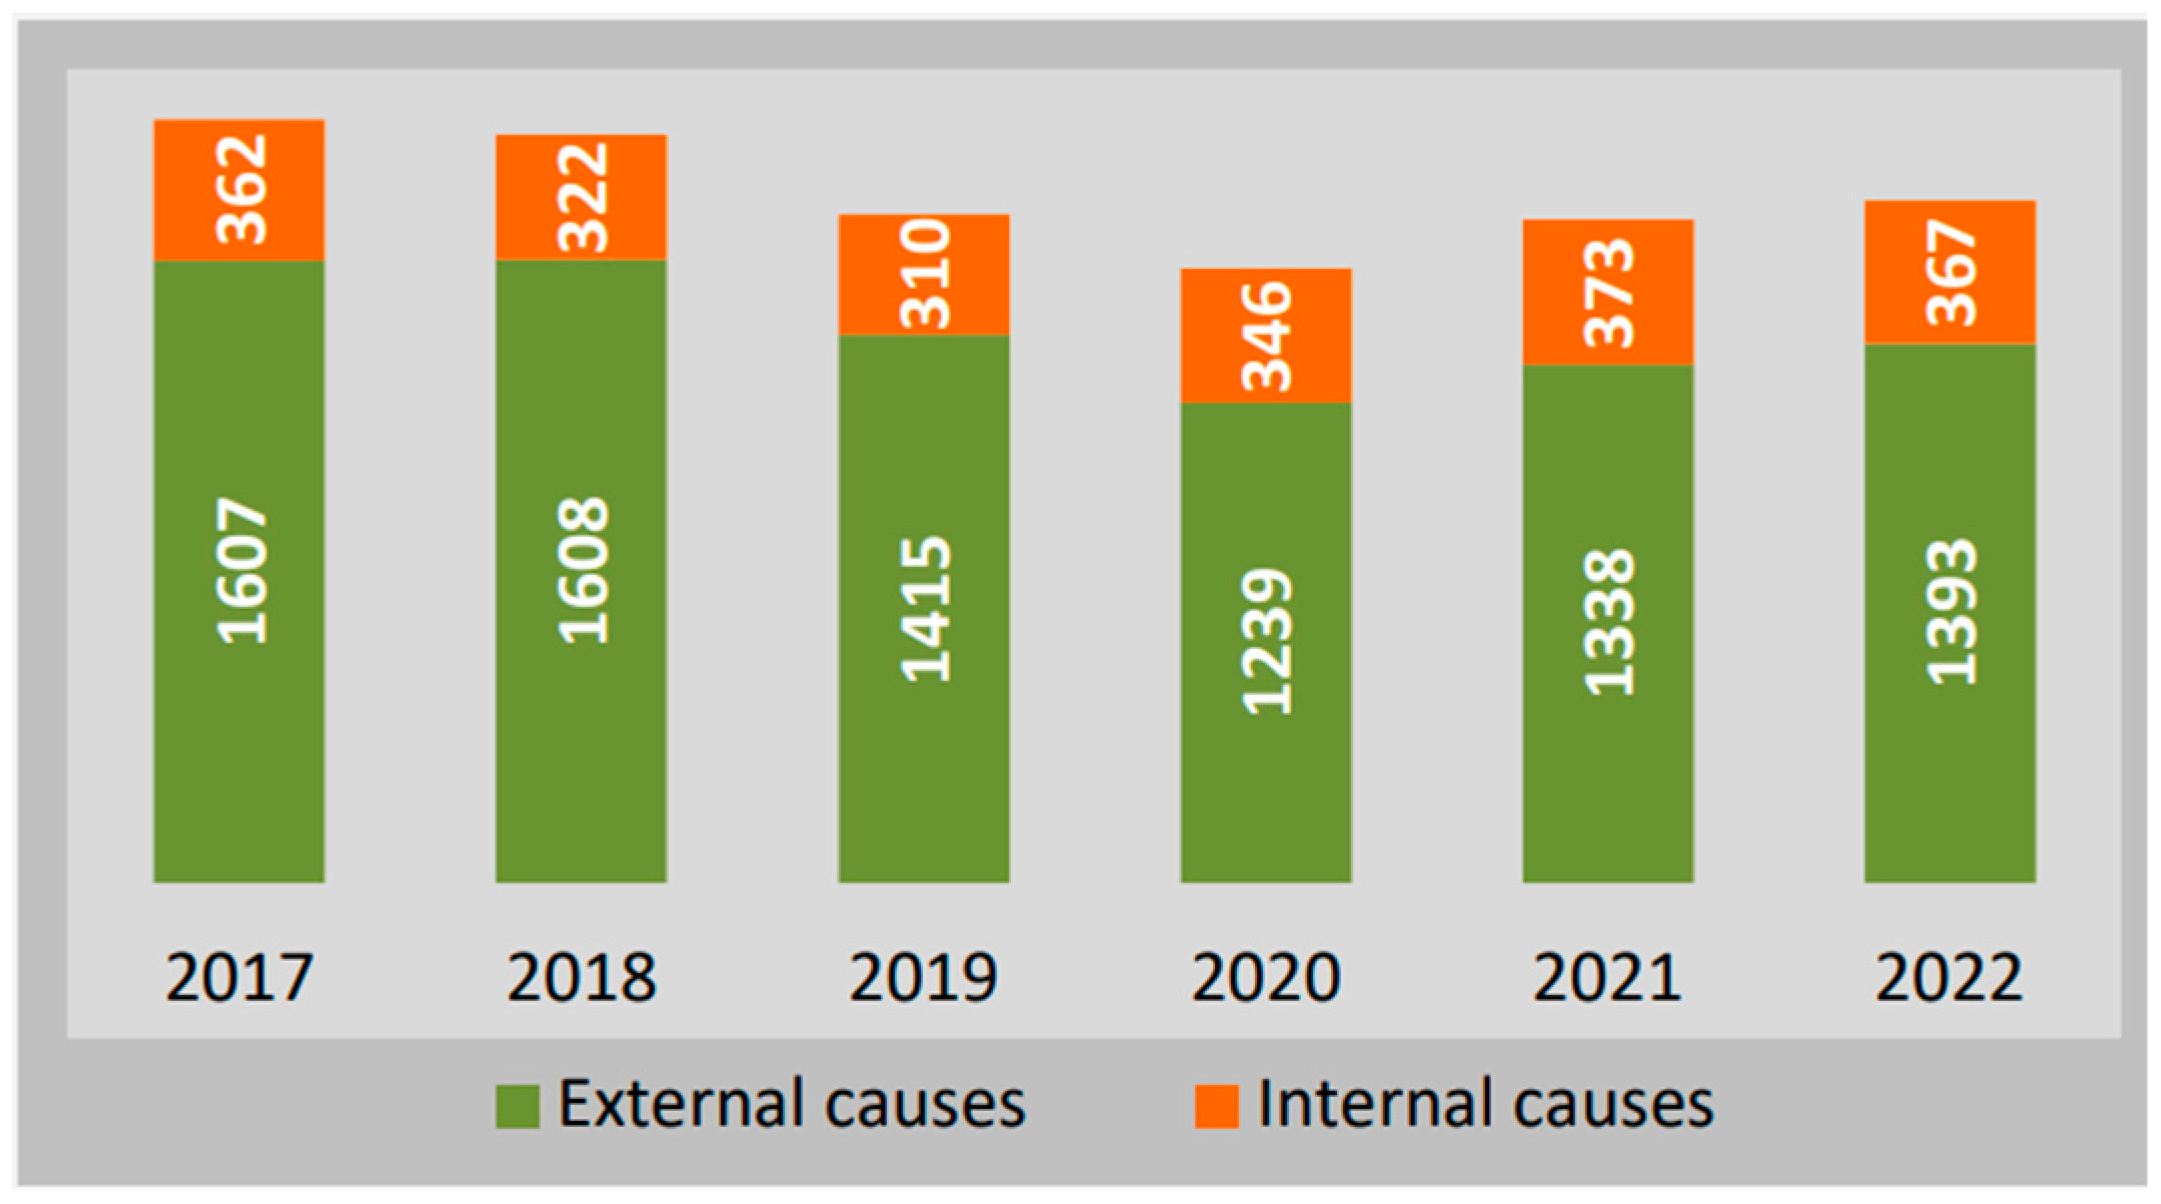
Further, the report presented the distribution by accident causes as shown in
Figure 4. The number of accidents with external causes decreased by 12% between 2018 and 2019, and again by 12% between 2019 and 2020, but increased 8% in 2021 and 6% in 2022. Overall, a consistent decreasing trend is observed in many countries, regardless of the steepness of the trend.
The second part of
Table 2 shows the average time delayed by three factors. The length of delay time appears in the following order: human factors, technical factors, and external factors. In the case of a fatal accident, the possibility of recovering from a breakdown or damage to facilities or equipment is relatively low compared to an accident caused by technical factors, so the time it takes for the train to operate normally is inevitably relatively small. However, in the case of accidents caused by environmental factors, it causes breakdown and damage to railway facilities such as tracks, structures, and vehicles. Therefore, it is estimated that accidents caused by environmental factors require more time to recover from, compared to accidents caused by technical factors, resulting in relatively longer train operation delays. Interestingly, average latency has not shown any significant decrease in length over the past 15 years. This means that, regardless of the development of railway technology, an almost certain amount of delay time will inevitably occur.
3.2. Details of Human- and Technical-Involved Events
As mentioned above, because there is sufficient amount of data on human and technical factors since 2008, this study limited these two factors for the time delay estimation.
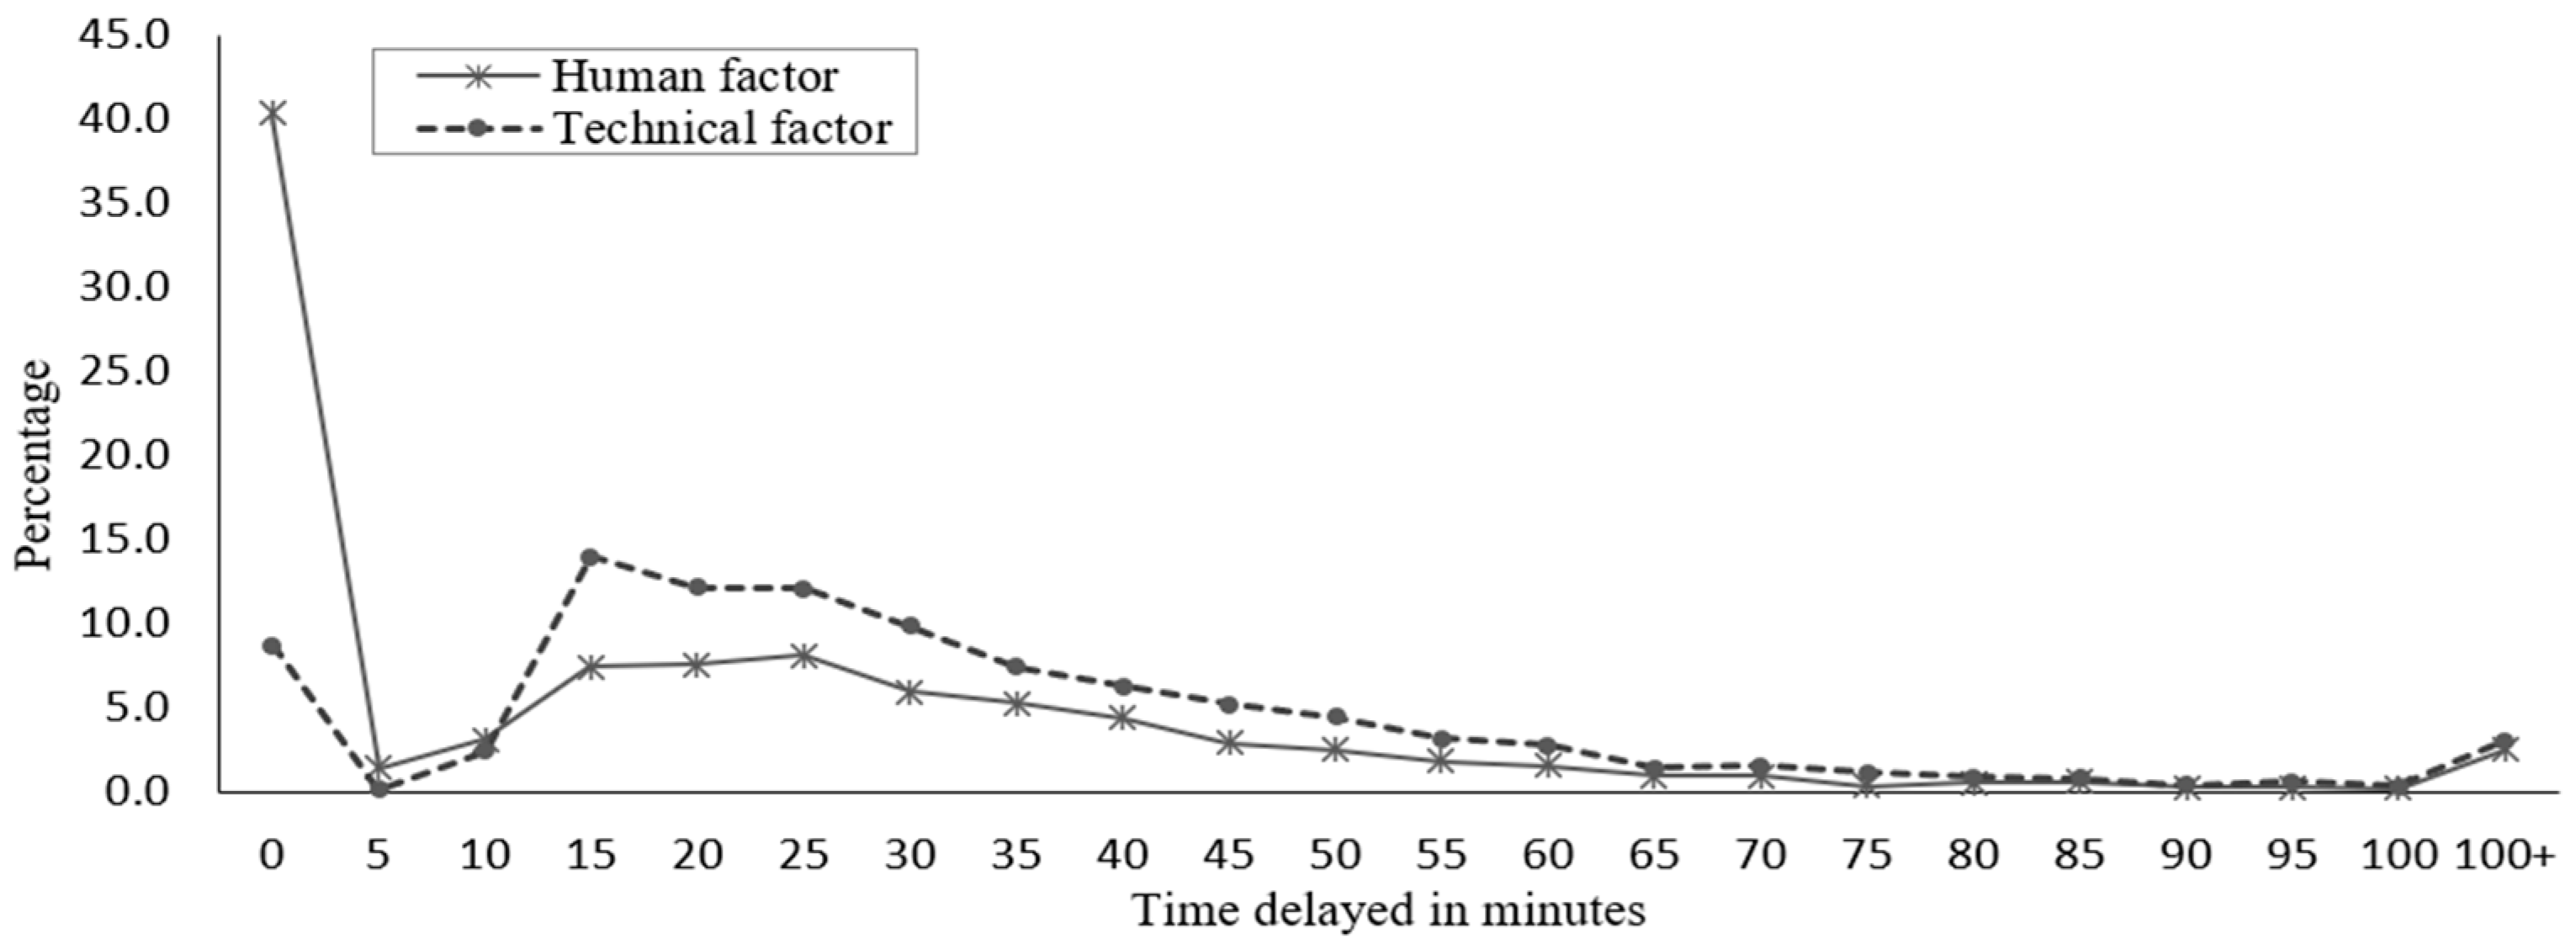
Figure 5 presents the distribution of accident delay times by human and technical factors.
The percentage of accident delays recorded as zeros was 41.4% for human factors and 9.1% for technical factors, showing a very large difference. This is the reason why the average delay time due to human factors is lower than that due to technical factors, as shown in
Table 2 above. In other words, this means that in the case of an accident caused by human factors, it is much more likely that a delay time of zero will be recorded than an accident caused by technical factors. Then, records with excessively large delay times were defined as outliers and excluded from the analysis. The cutoff for outliers was defined as twice the interval between the 1st and 3rd quartiles, added to the 2nd quartile. As a result, the baseline for outliers for human factors was calculated to be 93 min, and for technical factors to be 96 min. However, in this study, the baseline for all outliers was set at 100 min. Outliers exceeding 100 min were 83 cases for the human factors and 104 cases for the technical factors, respectively. After excluding these outliers, the final data to be used for analysis was 3161 cases for the human factors and 3246 cases for the technical factors. The mean and variance of cases where time delay occurred (excluding cases without time delay) were 30.6 and 347.4 for human factors and 31.9 and 347.9 for technical factors, respectively.
Table 3 identifies the explanatory variables used in modeling and presents the descriptive statistics for the human and technical factors.
The statistics reveal that approximately 75% of accidents can be attributed to factors associated with human involvement, within the category of human factors, while roughly 96.5% of incidents are linked to delays in operations, categorized under technical factors. This observation shows the higher likelihood of events arising from human factors evolving into accidents, whereas those originating from technical factors are more inclined to manifest as incidents. In terms of seasonal distribution, the number of occurrences related to human factors does not exhibit clear patterns. From the technical factors, however, there is a noticeable decrease in occurrences during the spring and fall seasons compared to other periods. This phenomenon can be attributed to the climatic conditions in Korea, with hot and humid summers featuring numerous rainy days, and cold, dry winters. Consequently, technical factors are more likely to result in accidents and incidents during these weather seasons.
Concerning the type of railways, conventional trains play a predominant role in the occurrence of both accidents and incidents. Express trains, characterized by their relatively modern design and the presence of safety fences along their tracks, maintain a higher level of safety. Furthermore, most metro routes are situated underground, offering protection against adverse weather conditions and public intrusion. In contrast, conventional trains, employing relatively older vehicles and operating on ground sections without safety fences, are inherently more prone to experiencing a higher accident rate than the other train types. In the classification of train operators based on the number of routes they manage, operators overseeing two or three routes are categorized as ‘Middle,’ while those managing four or more routes fall into the ‘Large’ category. This categorization aids in understanding the scale and scope of train operations. Many accidents and incidents occur within station locations, particularly on concourses or platforms, with approximately 40% attributed to human factors and 42% linked to technical factors. In the domain of human factors, 42% of accidents can be attributed to carelessness or errors, such as careless behavior, unauthorized track crossings, close proximity to tracks, incorrect driving procedures, disregard for safety stops, and errors in track switching, among others. Conversely, in the domain of technical factors, approximately 69% of accidents are associated with aging or defects in specific parts themselves, or inadequate maintenance practices.
4. Methodology
4.1. Regression Methods
The magnitude of time delay, a non-negative continuous measurement characterized by a prevalence of zeros as depicted in
Figure 5, can be quantified through regression techniques. Poisson and Negative Binomial (NB) regression models have emerged as widely employed tools in accident analysis. The Poisson model is well-suited for datasets exhibiting variance approximately equal to the mean, whereas the NB model is aptly suited for datasets with pronounced over-dispersion, where the variance significantly exceeds the mean. Consequently, the NB model is deemed appropriate for predicting time delays due to the substantial disparity between the variance and mean within both datasets, as elucidated in the data description. However, the data on time delay has two heterogeneous measurement distributions (e.g., zero or positive), which are not well described by these classical models. To deal with the excess frequencies of zero, two approaches have been adopted. One is the two-stage model. In the first stage of the model, a binary logit model was applied to the distribution of whether delay time occurred. And, when the delay time occurred from the model, the delay time was measured using the NB model. Another is the ZINB model, which analyzes data with excess zeros and over-dispersion, providing a more accurate representation of the underlying processes. The dependent variable, delay time was converted into a categorical variable with 5 min intervals, expressed as 0 to 21 (e.g., ‘1′ if the delay time is greater than 0 and less than or equal to 5), and then applied to the models. The NB model postulates that the Poisson means conform to a gamma distribution, and the probability mass function is expressed as follows: [see Cameron et al. [
41] (p. 100) for details]:
where
Let i = 1, 2, 3, …, n represent the observation index; m denotes the index for explanatory variables; signify the observed delayed time amount for observation i; represent the value of explanatory variable m for observation i; and denote the coefficients to be estimated corresponding to . The estimated outcome for delayed time for the observation, denoted as , is derived. The overdispersion parameter is represented as α. When α→0, it implies equivalence between the conditional mean and conditional variance (eliminating unobserved heterogeneity), effectively collapsing the NB model into the Poisson model. The likelihood function is denoted as L.
To model overdispersion in the presence of excessive zeros, the ZINB distribution is employed. For
, the value 0 manifests in two distinct states. The first state is the zero state, occurring with a probability of
, resulting exclusively in observations with a value of 0. The second state is the negative binomial state, occurring with a probability of (1 −
) and characterized by a negative binomial distribution [
42].
The means and their variances are defined
and
, and the log-likelihood function,
4.2. Artificial Neural Network Method
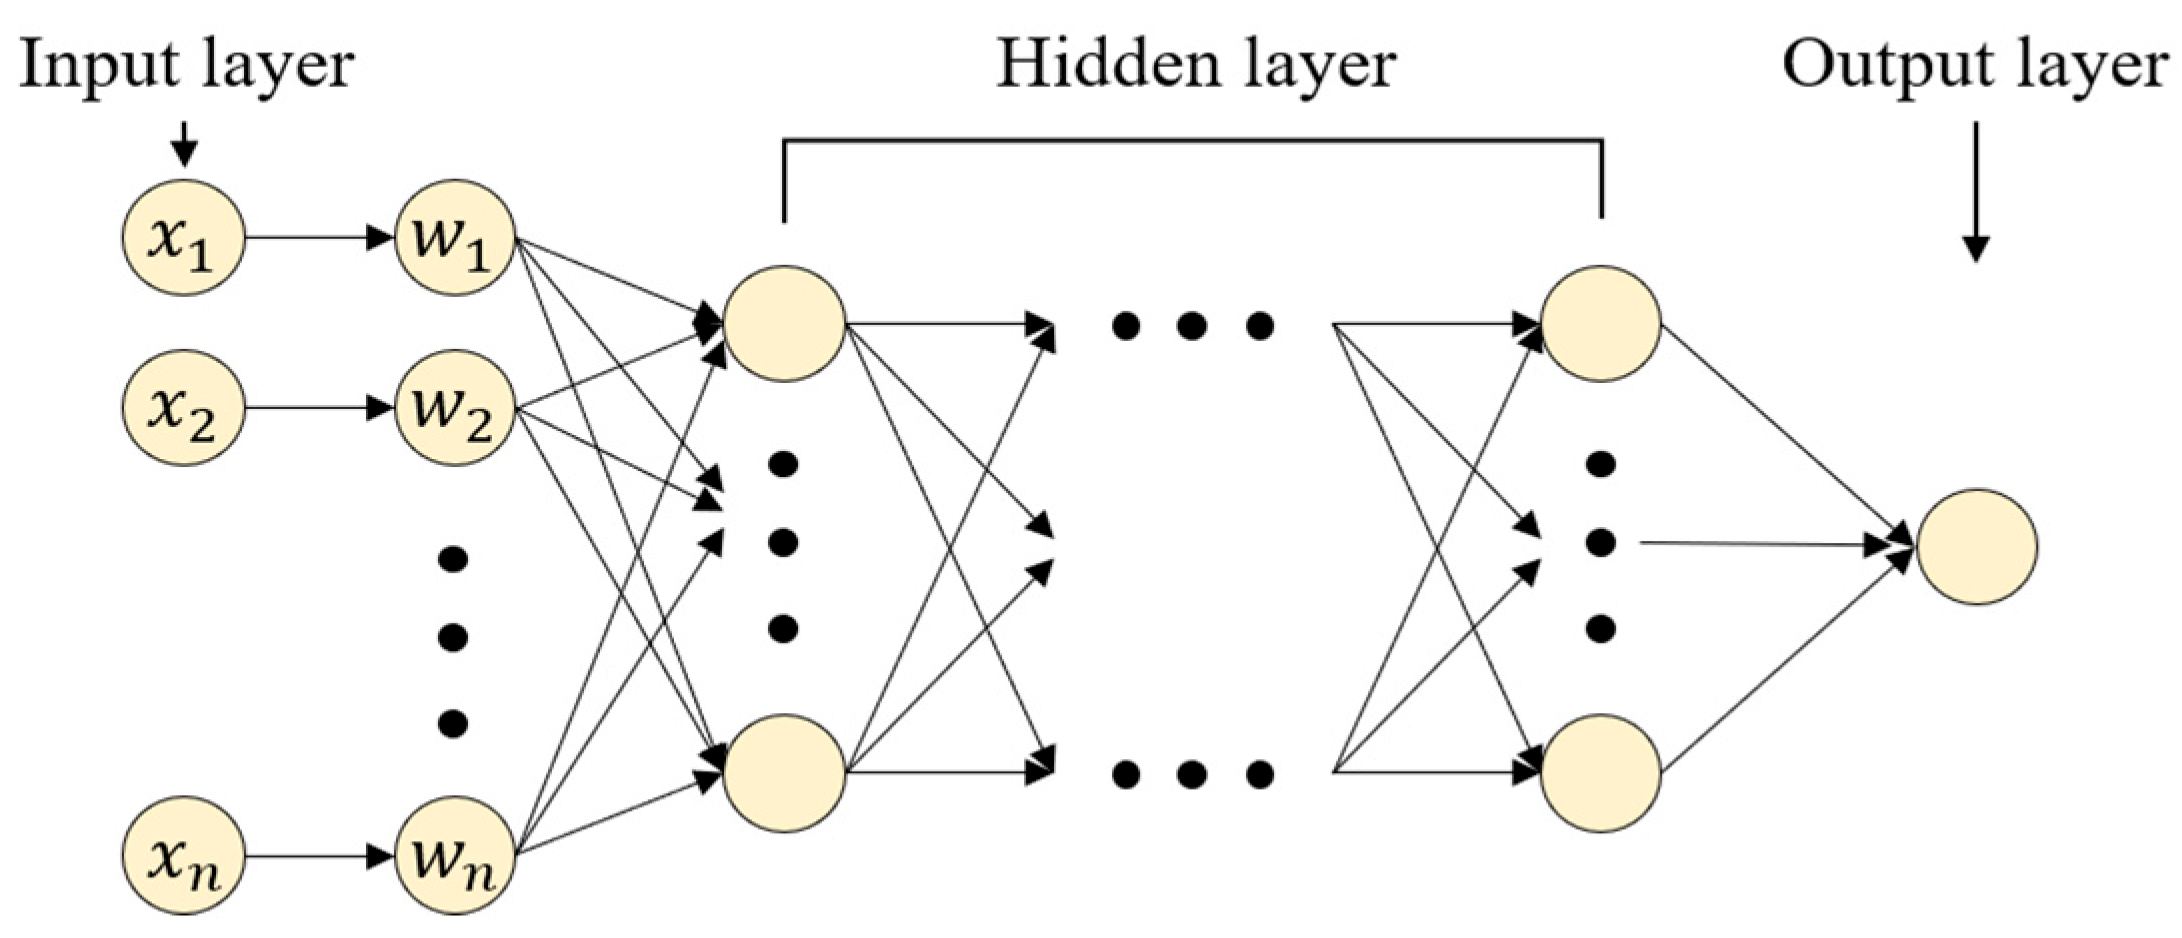
Artificial neural networks emulate the functionality of the human brain and facilitate progressive learning through a series of algorithmic operations. Within ANNs, information is processed via interconnected nodes, known as neurons, situated within the ANN framework. The standard ANN architecture, depicted in
Figure 6, comprises three fundamental components: the input layer, hidden layer, and output layer. Each neuron in the input layer serves as a data aggregator, collecting information from external sources and performing a role akin to that of a predictor or contributor in a regression model. In the context of artificial neural networks, the hidden layer resides between the input and output layers. To discern non-linear patterns, it is commonly recommended to employ a single hidden layer in most applications [
37,
43,
44,
45]. Augmenting the number of hidden layers introduces greater complexity and prolonged processing times, often without a proportional enhancement in model performance, as noted by Nielsen [
46]. Concerning the number of neurons within a hidden layer, Nielsen [
46] advises that it should be fewer than the neurons in the input layer.
Figure 7 illustrates a structure comprising a solitary node. This node receives inputs from either the data within the input layer or the outputs of other nodes, referred to as activations. Each input to the node is associated with a weight (notated as ‘w’) and a bias (notated as ‘b’) or a threshold. The weight characterizes the influence of the input on the node’s response. The node computes the weighted sum of inputs and subsequently applies an activation function, which may include threshold functions, Sigmoid functions, Rectified Linear Unit functions (ReLU), Hyperbolic Tangent functions, and Softmax functions, among others, to determine the node’s output. Training the neural network can be accomplished using various training algorithms, with the Backpropagation (BP) algorithm being one of the most widely adopted choices. The BP algorithm is employed to adjust the weights of neural network nodes, with the objective of minimizing the sum of squared errors during the training phase.
5. Analysis Results
To evaluate the time delay associated with both human-related and technical factors, the dataset underwent partitioning, allocating 80% of the data for model estimation and reserving the remaining 20% for testing purposes. The application of a Chi-squared test reveals that no statistically significant difference exists in the frequency distribution of time delay between these two subsets.
5.1. Human-Related Time Delays
Table 4 represents the modeling outputs for the delayed time caused by human-related factors with some of the explanatory variables shown in
Table 3. In general, the direction of estimates indicates a certain trend. For instance, in the outputs of the negative binomial part, a positive estimate suggests a higher likelihood of an increase in the delayed time, especially when associated with a
p-value equal to or greater than 0.05. Similarly, in the logit part outputs, a positive estimate signifies a greater probability of occurrence of time delays. These trends remain consistent across various models, except for estimates in the type of event within the negative binomial part. Nevertheless, the likelihood of delayed time occurrence is notably higher when the type of event is linked to high-potential events (2.708 in Two-stage; 2.980 in ZINB) or ground-level crossing accidents (0.931 in Two-stage; 2.980 in ZINB), as opposed to events related to humans (−2.867 in Two-stage; −2.865 in ZINB).
However, the duration of delayed time for human-involved (−0.357 in ZINB) or ground-level crossing accidents (−0.234 in ZINB) tends to be less than that for other types of events such as crashes, derailments, facility-involved accidents, and so on. The likelihood of a time delay occurring is not only higher during the fall season, but is also associated with a longer duration of delayed time, and this is statistically significant only at the negative binomial part of Two-stage model. When railroad accidents involve the public (2.215 and 1.513 in Tow-stage, respectively) or passengers (2.382 and 1.645 in ZINB, respectively), the likelihood of a time delay is higher compared to other person types. However, during the duration of the delay, events related to ‘passengers’ are likely to experience a reduction. The categorization of train operators into three groups based on the number of operating routes did not yield statistically significant explanations for time delays.
In cases involving conventional trains in railroad accidents, there is a diminished likelihood of time delays; however, the temporal duration of the delay shows a statistically significant likelihood of increase (0.189 in Two-stage; 0.243 in ZINB). Conventional trains, operated exclusively by ‘KORAIL’ across the country, generally have time headways at least exceeding 20~30 min—a notable contrast to express trains and metros, which operate with headways of 5 min or less. Constituting a mere 1.8% of the total passenger volume, compared to 95.5% for metros and 2.6% for express trains (as of Aug. 2023 in KOSIS), conventional trains are allocated a comparatively smaller share of resources by KORAIL. Consequently, accidents involving conventional trains result in inevitably longer delay times, given the relatively sluggish response attributed to their diminished strategic importance. The analysis indicates that when an incident occurs on the main line, between railroad stations, both models consistently show an increase in the probability of a delay occurring (positive signs in the logit part) as well as an extension in the length of the delay time (positive signs in the negative binomial part). Similarly, accidents related to suicide are associated with an elevated likelihood of delays and an extended duration of time.
To configure the ANN model, the input layer is designed to incorporate the same independent variables as detailed in
Table 4. The input layer comprises two variables, each accommodating 12 neurons, representing predictive factors related to the duration of time delays. During the development of the ANN model, the sigmoid activation function was selected in conjunction with the BP algorithm, as the application of the ReLU activation function failed to converge to optimal values. Throughout the course of this ANN study, an interesting observation emerges, indicating a consensus on the limited performance improvement attained by introducing additional hidden layers. In many instances, a single hidden layer is deemed sufficient to address many problems. However, this study explores the introduction of hidden layers ranging from 1 to 3, revealing that optimal convergence was not achieved with three hidden layers. Given that the efficacy of the BP training algorithm is contingent on the number of neurons within the hidden layer, various neuron counts ranging from 1 to 12 were systematically examined. The investigation concludes that the optimal number of neurons in the hidden layer is eight, resulting in the lowest values for Mean Square Error (MSE) and Root Mean Square Error (RMSE) for the training data. The analysis was conducted using the R 4.3.1 software package. The primary criteria employed to compare the performance superiority among the Two-stage model, ZINB model, and ANN model encompass the coefficients of determination (
), MSE, and RMSE. These criteria are defined as follows:
Within the framework of this analysis, we define as the i-th observed value, as the i-th predicted value generated by the model, and n as the total available dataset size.
Table 5 presents a concise overview of the comparative predictions derived from the three estimated models for the human-related factors. The
serves as a metric assessing the proximity of model-fit data, ranging from 0 to 1, where higher values indicate a more comprehensive explanation of dependent variables by independent variables. In the training dataset, the
values are 0.355 for the Two-stage model, 0.389 for the ZINB model, and 0.446 for the ANN model. Notably, the ANN model exhibits a 7.2% improvement in model fit compared to the Two-stage model and a 4.7% enhancement compared to the ZINB model. Similar trends are observed in the testing data, with an 8.8% and 3.1% improvement associated with the ANN model. Furthermore, upon examining the results of MSE and RMSE, the ANN model demonstrates relatively lower prediction error rates compared to the other two regression models.
5.2. Technical-Related Time Delays
Table 6 presents the results of the regression analysis concerning both the occurrence and the duration of delayed time attributed to technical factors. Similar to the findings for human-related factors, the coefficient estimates in both models exhibit considerable similarity. The probability of delayed time occurrence is elevated when events are associated with high-potential incidents (3.848 in the Two-stage model; 3.969 in the ZINB model). However, the duration of time delay was not found to be statistically significant in the negative binomial part. In instances of derailment accidents, there is an increased likelihood of prolonged delayed time (0.021 in ZINB). Additionally, when the accident involves fire, the duration of delayed time tends to increase. The analysis reveals that accidents associated with signal, telecommunication, rail, or structural facilities are less likely to experience time delays, as evidenced by the negative signs of all coefficient estimates in the logit part. Furthermore, the duration of time delay is less likely to be prolonged in cases involving signal or communication facilities (−0.290 in the Two-stage model and −0.236 in the ZINB model) and rail or structural facilities (−0.166 in the Two-stage model). Conversely, accidents linked to electric power facilities tend to exhibit an increase in the duration of time delay (0.151 in the Two-stage model and 0.185 in the ZINB model). Accidents involving personnel other than crew and control staff tend to decrease the likelihood of prolonged time delays. Specifically, in incidents related to conventional trains in railroad accidents, there is a statistically significant likelihood of an increase in the temporal duration of delay (0.422 in the Two-stage model and 0.441 in the ZINB model). This aligns with the interpretation of the model output for human-related factors. The analysis also indicates that incidents occurring on the main line, between railroad stations, consistently result in an elevated probability of extending the duration of time delay, as evidenced by positive signs in the negative binomial part on both models.
Table 7 provides a succinct summary of the comparative predictive performance among the three models concerning technical-related factors. The model-fit
values are recorded as 0.197 for the Two-stage model, 0.209 for the ZINB model, and 0.300 for the ANN model. Noteworthy is the ANN model’s outperformance, displaying a 6.6% improvement in model fit compared to the Two-stage model and a 5.9% enhancement compared to the ZINB model. These trends persist in the testing data, with a 10.6% and 6.0% improvement associated with the ANN model. Additionally, upon scrutiny of the MSE and RMSE results, the ANN model exhibits comparatively lower prediction error rates in contrast to the other two regression models.
6. Discussion
This study focuses on identifying key factors influencing the likelihood of time delays in railroad events, utilizing comprehensive historical data from 2001 to 2022 in Korea. The dataset is divided into two categories: accidents with a significant impact on human life or property and incidents leading to time delays. Over the years (2001–2022), there is a substantial decline in both accidents and incidents, with an AGR of approximately −9.9% for accidents and −3.7% for incidents. Adoption of advanced safety systems and technological innovations, such as automatic train control, contributes to the reduction in accidents. The study aims to measure time delays caused by accidents or incidents, considering factors like season, train operator size, railroad type, accident cause, and location. A total of 14,771 accidents and incidents occurred, with only 38.3% having time delay records on average over 22 years.
Reporting of accidents and incidents aligns with guidelines established under the Railway Safety Act from November 2007; therefore, the study used the data for the analysis starting from 2008. The total number of events used for human factors is 3244, and is 3350 for technical factors. The average delay time due to human factors ranges from 14.8 to 48.0 min, with an overall average of 27.2 min, while the average delay time due to technical factors ranges from 28.9 to 51.0 min, with an overall average of 34.3 min. There are variations in the annual average delay times, emphasizing the need for a dynamic and context-specific approach to address the causes of delays in the railway system. The overall decrease in the total number of events indicates positive trends in railway safety, but the varying delay times highlight the importance of understanding the specific factors contributing to delays for effective mitigation strategies.
To address excess zeros in the data, two approaches are employed: a two-stage model involving binary logit and NB models, and a ZINB model, offering a more accurate representation. The article further introduces the mathematical formulations of these models and their parameters. Additionally, ANNs are explored as an alternative method, mimicking human brain processes for non-linear pattern recognition. The structure and components of ANNs, along with the backpropagation algorithm for training, are explained. The study aims to provide insights into predicting delayed time in railway accidents, considering both traditional regression models and advanced ANN methods.
The study investigates time delays resulting from human-related and technical factors by dividing the dataset for model estimation and testing. Statistical tests indicate no significant difference in the frequency distribution of time delays between the two subsets. Modeling outputs, particularly from the Two-stage and ZINB models, consistently demonstrate trends in the likelihood and duration of delays associated with various factors. Human-related delays, influenced by event types, seasons, and passenger categories, show nuanced impacts. An ANN model is configured with optimal parameters, and its performance is compared to regression models, indicating that the ANN model provides superior predictions for human-related factors. Technical-related delays, influenced by incident types and facility involvement, are also analyzed, with the ANN model again showing enhanced predictive performance compared to regression models.
While the current dataset offers detailed information on delayed times based on factors like railway type, operator, accident cause and accident type, the author points out the need for more comprehensive data to assess the full impact of accidents. Suggestions include incorporating information such as the speed at the time of an accident, detailed breakdown of total delay time, including time affected by the main line, time required for recovery, time of occurrence and location of the route where the accident occurred. Despite these limitations, the study is considered instructive for transit agencies in assessing the repercussions of railway accidents and elevating service quality. The article also acknowledges the predictive superiority of the ANN model, but emphasizes that there are still shortcomings to address, such as the consideration of additional factors that have not statistically affected the dependent variable. Ultimately, the study provides valuable insights, but for policymakers seeking specific areas to focus resources for reducing the impact on rail accidents, further enhancements in data and analysis are necessary.
7. Conclusions
The study emphasizes the importance of considering both human and technical factors in predicting and understanding delays in railroad accidents. The primary conclusions drawn from analyzing factors impacting time delays in railroad accidents are as follows:
For the human-related factors:
Delayed time for human-involved or ground-level crossing accidents is typically shorter compared to other events.
Time delays are more likely in the fall season and tend to be longer.
Accidents involving the public or passengers on railroads have a higher likelihood of time delays, with shorter durations for passenger-related incidents.
Conventional train accidents have lower likelihoods of time delays, but longer delays when they occur.
Incidents on the main line, between stations, increase the probability and duration of time delays.
Suicide-related accidents lead to increased likelihood and duration of delays.
For the technical-related factors:
High-potential incidents increase delay likelihood.
Derailments or fires result in prolonged delays.
Signal, telecommunication, rail, or structural facility accidents have minimal delays and shorter delay durations.
Electric power accidents lengthen delays, while those involving non-crew personnel decrease delay likelihood.
Conventional train incidents extend delay durations.
Incidents on the main line, particularly between stations, lead to extended delays.


