Article

Prediction of Leaf Break Resistance of Green and Dry Alfalfa Leaves by Machine Learning Methods

1
Department of Informatics, Akdeniz University, Antalya 07070, Türkiye
2
Department of Machine, Technical Science Vocational School, Akdeniz University, Antalya 07070, Türkiye
3
Department of Entrepreneurship and Management, Faculty of Entrepreneurship, Business Engineering and Management, National University of Science and Technology Politehnica Bucharest, 060042 Bucharest, Romania
*
Authors to whom correspondence should be addressed.
Appl. Sci. 2024, 14(4), 1638; https://doi.org/10.3390/app14041638
Submission received: 19 December 2023 / Revised: 12 February 2024 / Accepted: 16 February 2024 / Published: 18 February 2024
(This article belongs to the Section Agricultural Science and Technology)

Abstract

:
Alfalfa holds an extremely significant place in animal nutrition when it comes to providing essential nutrients. The leaves of alfalfa specifically boast the highest nutritional value, containing a remarkable 70% of crude protein and an impressive 90% of essential vitamins. Due to this incredible nutritional profile, it becomes exceedingly important to ensure that the harvesting and threshing processes are executed with utmost care to minimize any potential loss of these invaluable nutrients present in the leaves. To minimize losses, it is essential to accurately determine the resistance of the leaves in both their green and dried forms. This study aimed to estimate the breaking resistance of green and dried alfalfa plants using machine learning methods. During the modeling phase, five different popular machine learning methods, Extra Trees (ET), Random Forest (RF), Gradient Boost (GB), Extreme Gradient Boosting (XGB), and CatBoost (CB), were used. The correlation coefficient (R2), root mean square error (RMSE), mean absolute error (MAE) and mean absolute percentage error (MAPE) metrics were used to evaluate the models. The obtained metric results and the graphs obtained from the prediction values of the models revealed that the machine learning methods made successful predictions. The best R2 (0.9853), RMSE (0.0171), MAE (0.0099) and MAPE (0.0969) values for the dry alfalfa plant were obtained from the model established with the ET method, while the best RMSE (0.0616) and R2 (0.96) values for the green alfalfa plant were obtained from the model established with the RF method and the best MAE (0.0340) value was obtained from the model established with the ET method. Additionally, the best MAPE (0.1447) value was obtained from the model established with the GB method.

1. Introduction

Alfalfa plants are necessary for animal feeding both in Turkey and worldwide, and they are used extensively. Green and dry can be consumed as grass, as well as silage can also be used. Alfalfa plants are rich in protein, mineral substances, trace elements, and vitamins, and they give high-quality grass [1]. There are losses in the nutritional value of alfalfa plants due to different reasons, from harvesting to utilization. These losses are generally losses due to plant respiration, nutrient loss, losses caused by rain damage, losses due to leaf breakage, and losses due to mechanization applications (mowing and conditioning, machine type, harrowing, baler) [2].
In animal nutrition, alfalfa is mostly used in dry form, but it undergoes significant nutrient losses during drying [3]. For alfalfa grass under natural drying conditions, the dry matter, crude protein and crude amount of cellulose losses increase even more. Although dry matter losses are realized between 15 and 25%, this rate is between 35 and 100% under rain damage depending on the weather conditions. Leaf losses increase due to the decrease in product moisture. Alfalfa leaves contain 70% of the crude protein and 90% of the vitamins. Leaves are also 40% more digestible than stems [4]. For this reason, the leaf losses that may occur in the plant should be minimized. To minimize the loss rate, mowing, raking and baling operations should be completed early in the morning, which increases the drying time of the product, and therefore, higher quality and higher efficient feed can be obtained [5].
Various studies have been carried out on the physico-mechanical properties of forage crops until today, but studies on the breaking resistance of alfalfa leaves have not been found much in the literature. The determination of the leaf break resistance is very important to improve the design, optimization and efficiency of the necessary machinery, equipment and cutting tools for harvesting and threshing alfalfa plants with minimum leaf loss. King and Vincent (1996) [6] studied the determination of the static and dynamic properties of flax plants indigenous to New Zealand. Yilmaz and Gokduman (2014) [7] determined the leaf breaking resistance of sage plants according to different moisture contents. As a result of the experiments conducted at three different moisture contents, it was reported that the leaf breaking force varied between 4.3 and 6.5 N (Newton). Arevalo et al. (2013) [8] investigated the mechanical properties of rosemary stems. In their study, they found that the compression forces causing deformations were low, about 2 N, and the shear force required to break the bundle at the harvest point varied between 30 and 50 N on average. Shinners et al. (1987) [9] found that longitudinal shearing of alfalfa stems required less than 1/10 of the energy required to shear alfalfa transversely. Öten et al. (2018) [10] carried out studies on the determination of both the green and dry leaf breaking resistance of some clover genotypes collected from the natural flora of Antalya province. It was reported that the highest leaf break force value was 1.0419 N and the lowest was 1.0022 N in the dry samples. Prince et al. (1969) [11] investigated the hardness modulus of green and dried alfalfa samples and found mean values of 0.225 GPa and 1.45 GPa, respectively. Türker (1992) [12] performed experimental measurements on 1700 alfalfa to determine the cutting resistance of alfalfa. The effects of factors such as the blade speed, blade opening, blade type, diameter of the alfalfa at the cutting point and cutting time on the cutting resistance of alfalfa were determined. Halyk and Hurlbut (1968) [13] reported that the stem of alfalfa has a tensile strength in the range 9–36 MPa and that this strength is dependent on the moisture content.
The literature shows that studies related to the evaluation of the mechanical qualities required to maintain the leaf quality of alfalfa or other forage crops, as well as the design and modernization of the equipment required for harvesting and threshing and the optimization of the operating parameters, are usually carried out under laboratory conditions and harsh field conditions. These techniques are exceedingly expensive, labor-intensive, and require a very drawn-out approach. Unconventional approaches can be employed in place of experimental procedures to precisely establish these required attributes in the current era where economy, energy, labor, and time are highly significant. The most popular non-conventional technique for figuring out the physical and mechanical characteristics of plant products is machine learning.
Machine learning, which is a sub-branch of artificial intelligence, can be defined as a method that makes predictions by using inferences from past experiences and data [14]. It focuses on teaching computers to learn from data and improve them through experience rather than being explicitly programmed to do so. In machine learning, algorithms are trained to find patterns and correlations in large data sets and make the best decisions and predictions based on this analysis [15]. Machine learning algorithms are one of the extremely popular methods applied to classification and regression problems in many fields, such as medicine [16,17], engineering [18,19], economy [20], education [21,22], business [23,24], natural sciences [25,26], sport sciences [27] and agriculture [28,29]. Alkali et al. (2014) [30] utilized an artificial neural network (ANN) to predict some mechanical properties of melon fruit. Kabas et al. (2023) [14] determined some engineering parameters of cherry tomatoes using machine learning algorithms. Cevher and Yıldırım (2022) [31] estimated the rupture energy values of Deveci and Abate Fetel pear fruit using an artificial neural network (ANN). An artificial neural network can be used to better estimate the volume and surface area of a fruit according to Ziaratban et al. (2017) [32]. Kabas et al. (2023) [33] conducted an experiment on the determination of hazelnut’s (Corylus avellana L.) terminal velocity and drag coefficient based on some fruit physical properties using machine learning algorithms. By using computerized mathematical and statistical processes on data, this technique models systems that make predictions. It belongs to the science of artificial intelligence. It includes several algorithms and method architectures. Numerous technical developments, such as speech and pattern recognition, data analysis, and prediction, have been made possible through machine learning. Using training data, machine learning, which learns and develops autonomously based on experience without outside assistance, may categorize and predict [34,35].
Knowing the leaf breaking resistance allows harvesting to be performed with a minimum leaf loss rate, thus minimizing leaf losses during harvesting and post-harvesting. This study aimed to provide an accurate prediction of the leaf break stress of alfalfa plants depending on some vegetative and mechanical parameters using machine learning. By using machine learning models, it was aimed to determine the most accurate model considering different inputs and network structures. The results obtained can be considered as an effective tool to deal with post-harvest losses of alfalfa leaves and to collect the necessary data for the optimization of existing processing systems and the design of the necessary machinery.

2. Materials and Methods

This research was carried out at Akdeniz University Vocational School of Technical Sciences, Antalya, Turkey, in 2023. Alfalfa (Victoria cultivar) obtained from local growers in Antalya province was used in the experiment. A total of 120 plant branches were taken as material, and 30 plant branches from each replicate were taken as the basis for this experiment in the trials carried out in 4 replicates in randomized blocks.
The measurements were carried out in the second year of cultivation and after the third mowing. The material to be measured for green breaking resistance was placed in containers filled with water to prevent moisture loss after mowing, with the cut ends in water and kept in this way until the measurement was performed.

2.1. Data Set

The petiole thickness of 120 alfalfa samples was measured with a digital caliper with a precision of 0.001 mm, and the petiole area was calculated with the formula A = π·d2/4 and the data were recorded.
A texture analyzer with a data sampling rate of 10 Hz and a 1000 N load cell with a sensitivity of 0.01 N was used to determine the breaking force of the leaves (Figure 1). A pulling speed of 8 mm min−1 was used to determine the leaf breaking resistance of alfalfa [36]. The device was calibrated following the calibration template before the analyses.
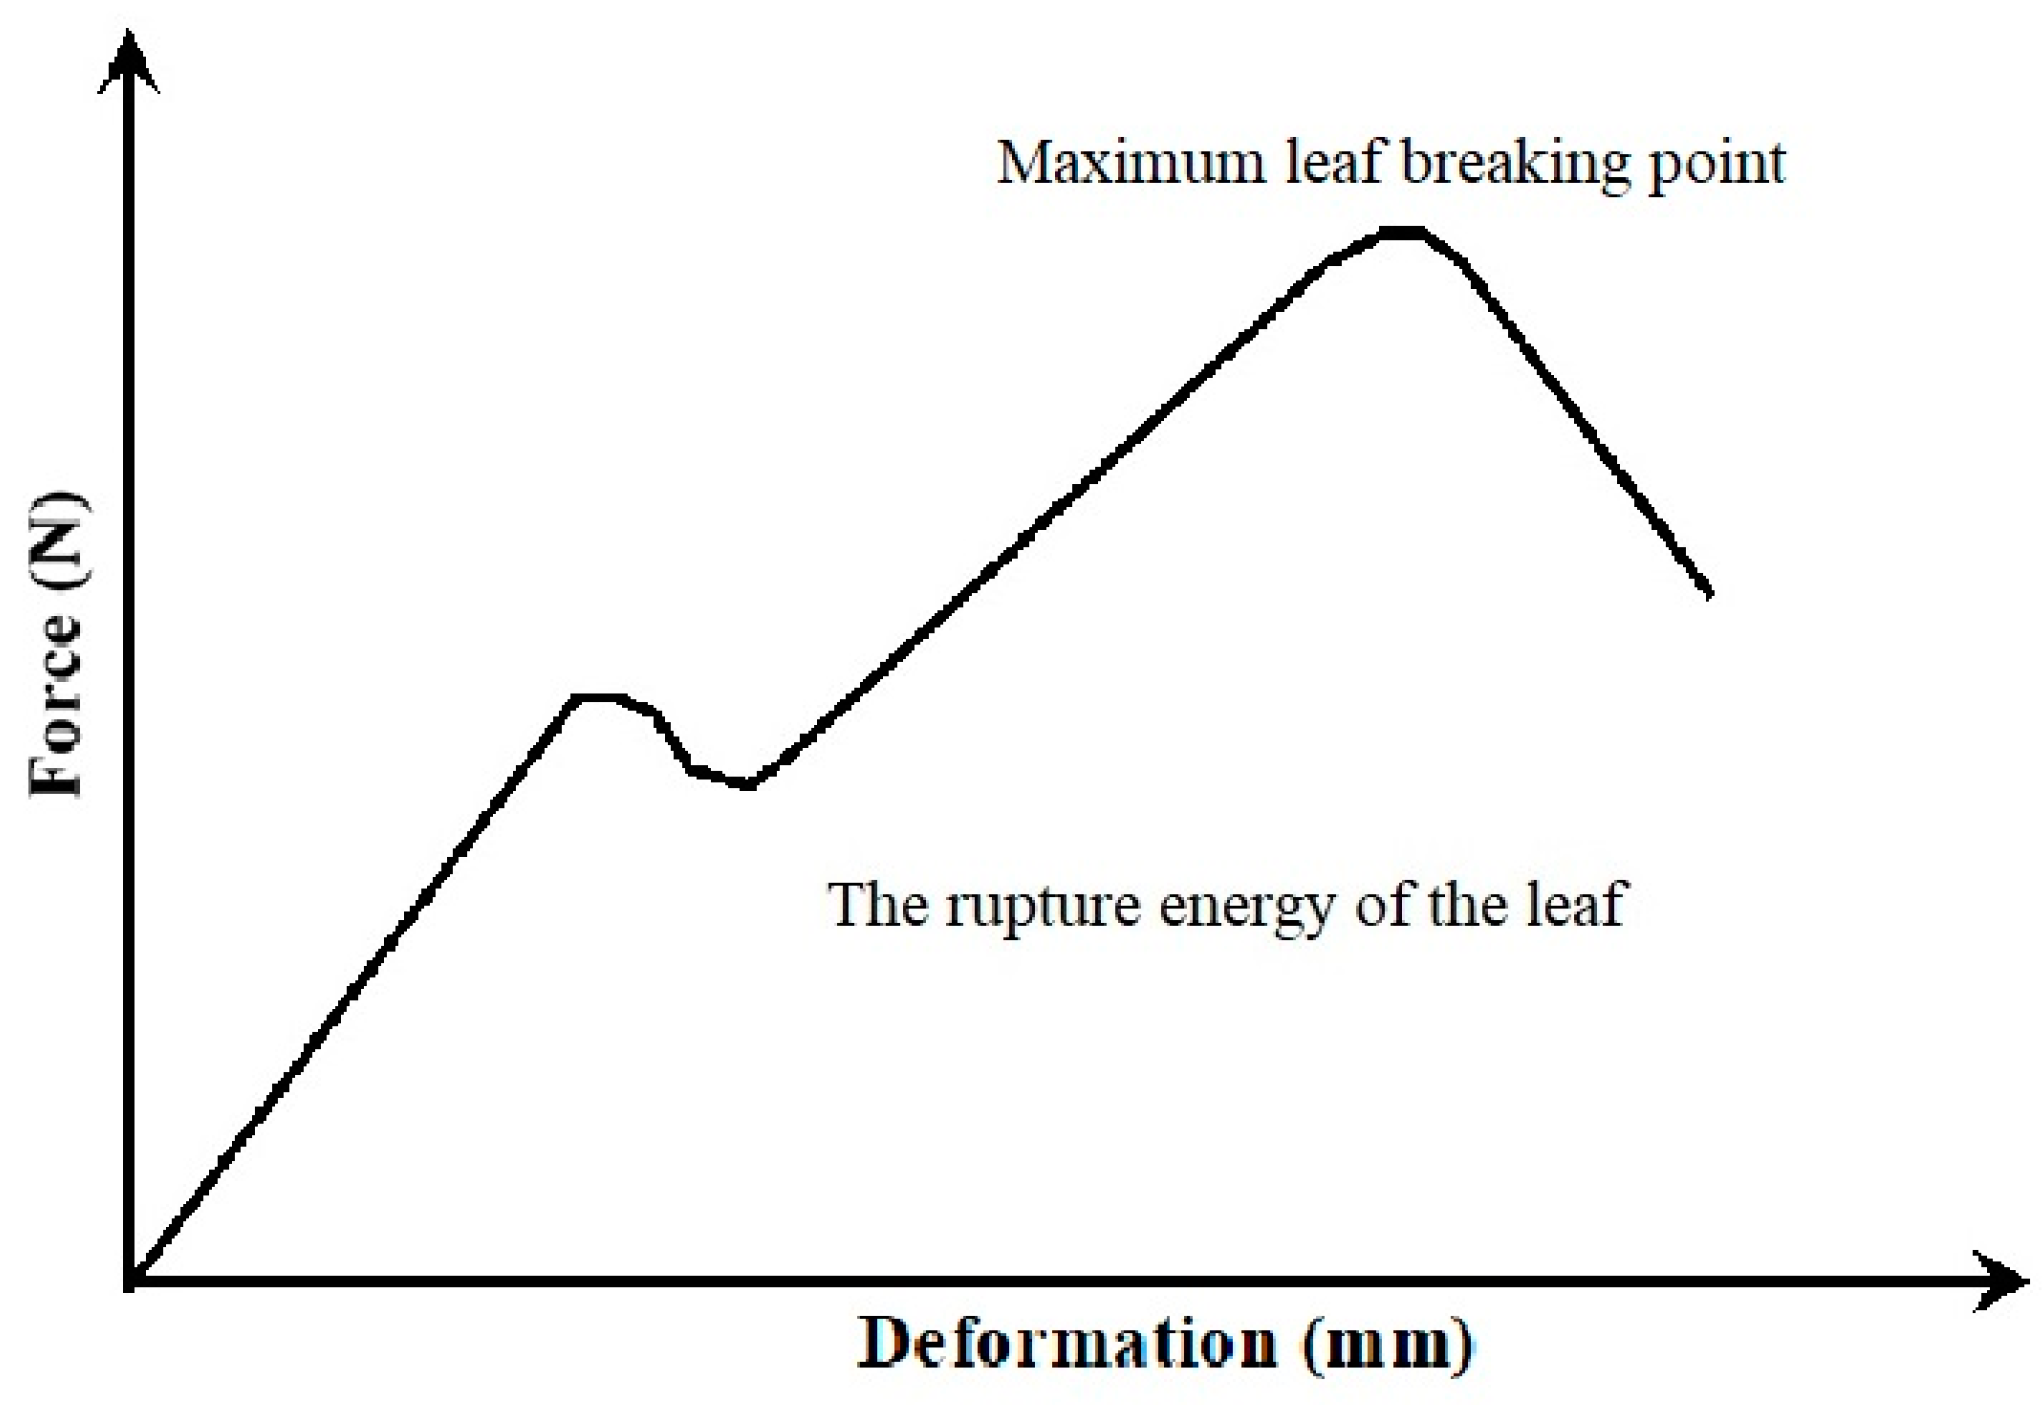
The leaves were fixed to the device with the help of a gripping jaw and the value read at the moment when the leaf broke away from the stem was determined as the breaking force of the leaf, and the obtained values were recorded on the computer with the help of a software. A force–deformation curve was created with the help of the obtained data (Figure 2). The rupture energy of the leaf was determined by calculating the area under the force–deformation curve. The breaking stress was calculated by the ratio of the determined leaf breaking forces to the petiole area.
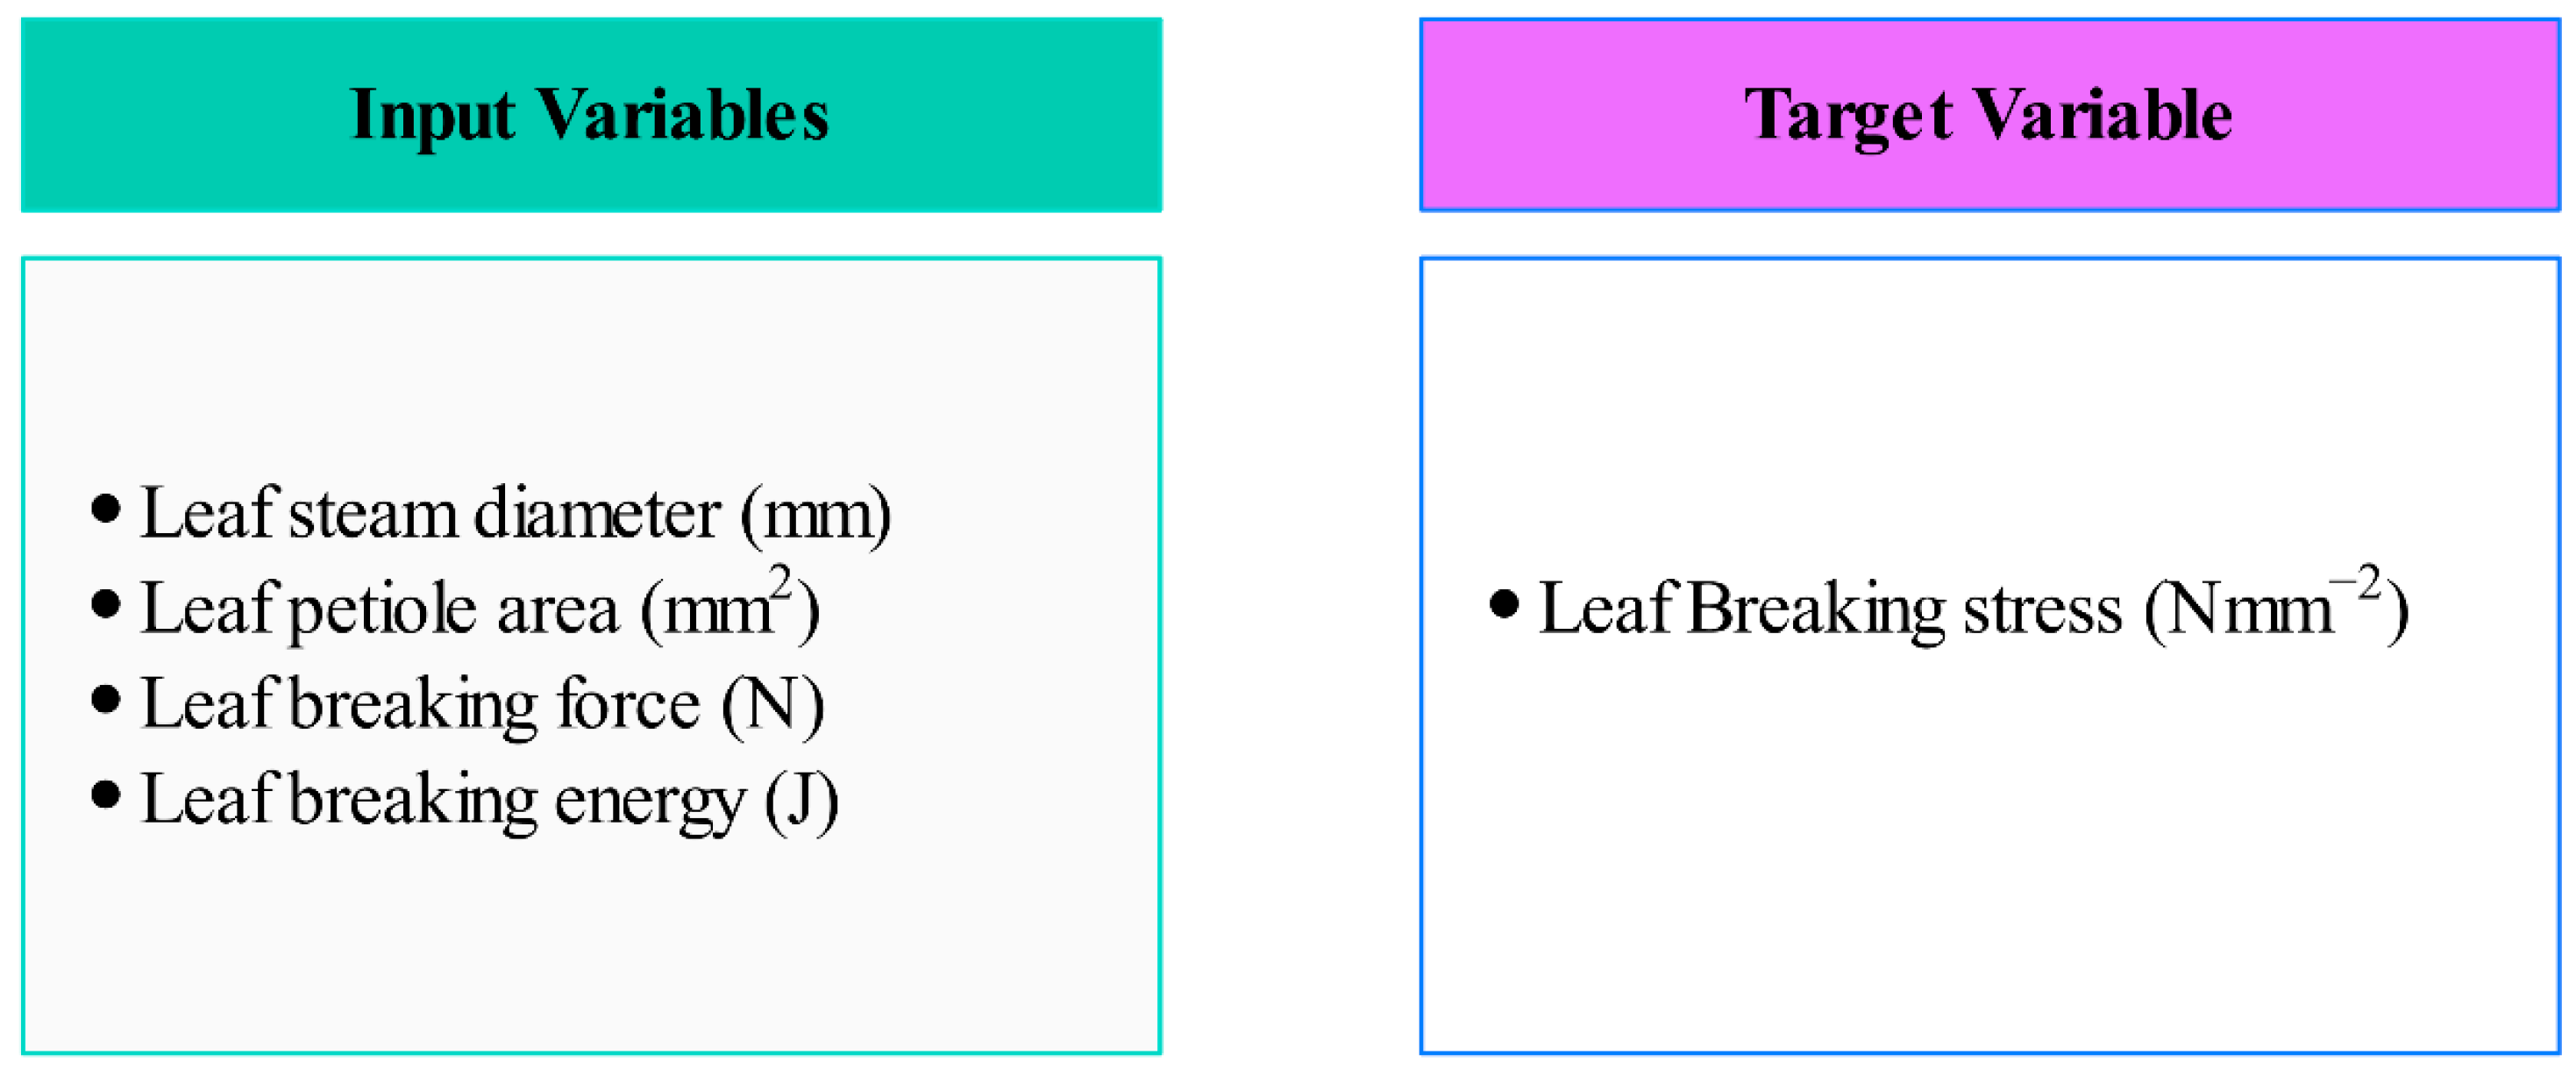
Trials were conducted when the main stems of the clover were green first, then dried at 105 °C for 24 h, and then the leaf breaking force measurement was realized. The input variables were the leaf stem diameter, leaf stem area, leaf breaking force, and leaf breaking energy, and the target variable was the leaf breaking stress. The whole variables used in the machine learning models are seen in Figure 3.

2.2. Machine Learning Methods

Machine learning, also known as predictive analytics or statistical learning, lies at the intersection of statistics, artificial intelligence, and computer science [37]. The goal of machine learning is to produce predictive or descriptive models using sample data or past experience so that the value of a continuous output or the class of a classificatory output can be predicted [38]. In this study, the leaf breaking stress of green and dried alfalfa plants was estimated using machine learning methods. During the modeling phase, five different machine learning methods, Extra Trees (ET), Random Forest (RF), Gradient Boost (GB), Extreme Gradient Boosting (XGB), and CatBoost (CB), were used. The models obtained using the five different methods were interpreted and the results were visualized. The data set of the study was divided into training and testing data, and 80–20%, 75–25% and 70–30% ratios tried in the partitioning process (training, testing), respectively. The best results were obtained with the training 70% and test 30% partitioning, and these values were interpreted. The modeling and visualization stages were carried out using the Python programming language. The workflow of the machine learning process is shown in Figure 4.
The first stage of the machine learning process is to obtain the data to be used in the modeling. The second and one of the most important stages is data preprocessing. At this stage, if there are missing and/or noisy variables in the data set, these variables are removed from the data set or filled with an appropriate predicted value [39,40]. In the third stage, machine learning algorithms are applied. At this stage, the data set is divided into training and testing without applying the machine learning method. The model is trained on the training data set, and the success of the trained model is realized on the test data set. In the fourth stage, modeling results are obtained. In the fifth stage, graphs of the results are created and in the last stage, the models are interpreted.

2.3. Extra Trees

ET, an ensemble-based machine learning method, was developed as an extension of the RF method to avoid the overfitting problem and increase the classification accuracy [41]. In this algorithm, all the data sets are used to train all the trees in an ensemble rather than using the bagging method to generate the training subset for each tree. This randomization significantly reduces the variance compared to the ensemble ML models. Instead of utilizing the bagging approach to create the training subset for each tree, this algorithm uses all the data sets to train all trees in an ensemble. Comparing this randomization to the ensemble ML models, the variance is significantly reduced [42,43].

2.4. CatBoost

CatBoost is an ensemble-based machine learning method just like RF, ET, and XGB. Based on the GB method, CB is an advanced version of the GB method. CB successfully tackles categorical attributes and takes advantage of coping with them during training as opposed to pre-processing time. Another advantage of the CB algorithm is that it uses a new scheme to calculate the leaf values when choosing the tree structure. This helps reduce overfitting [44].
During the modeling phase, a series of decision trees are created. Each decision tree influences the next to improve the modeling performance. Thus, the next tree is created with less loss. In other words, each decision tree is influenced by and learns from the previous one. The goal here is to create a strong learner [45]. In GB, DTs are trained iteratively to minimize the loss function, as shown in Figure 5 [46]. The image shown below the trees shows the training error of the tree (red). The error rate is high in the first and second trees. The error rate is minimized in the Nth tree by reducing iteratively [47].

2.5. Gradient Boosting

The purpose of the GB algorithm is based on combining a set of weak models that together allow for creating a stronger model [48]. The basic idea behind this algorithm is to build new base learners in such a way that they are maximally associated with the negative gradient of the loss function associated with the entire ensemble [49].
The fact that the loss function can be selected by the practitioner makes the GB method flexible, and the implementation of boosting algorithms is relatively simple [50].

2.6. Extreme Gradient Boosting

XGB, a GB-based method, uses the gradient descent optimization algorithm [51]. A highly scalable, flexible and versatile tool, XGB is designed to exploit resources correctly and to cope with the limitations of the earlier gradient boosting [52]. The novelty of XGB lies in the fact that it includes an objective function [53].
The objective function consists of the combination of the regularization term, which is used to prevent overfitting of the model, and the loss function, which measures the difference between the predicted value and the real value [54].

2.7. Random Forest

RF, one of the most common ensemble learning methods, is frequently used in both regression and classification problems [55]. The purpose of ensemble learning is based on combining the results generated by solving the same problem using many classifiers [56]. This gives the model result a higher precision and generalization ability. The features chosen by each tree during the model’s training process are just a small subset of the features chosen at random. The RF approach can achieve better generalization and anti-overfit abilities because to its strong randomness, which means that additional pruning is typically not required [57].

2.8. Models’ Evaluation Criteria

Since the output variable that is tried to be predicted in this study is continuous, the mean absolute error (MAE), mean absolute percentage error (MAPE), the coefficient of determination (R2), and root mean square error (RMSE) metrics were used to measure the prediction success of the established machine learning models [18,58,59]. The MAE, MAPE, R2, and RMSE metrics are defined in Equations (1)–(3), respectively.
R M S E = 1 m i = 1 m X i Y i 2 ,
M A E = 1 m i = 1 m X i Y i ,
M A P E = 1 m i = 1 m Y i X i Y i ,
R 2 = 1 i = 1 m X i Y i 2 i = 1 m Y ¯ Y i 2
The coefficient of determination, proportion of explained variance, or R2 for short, is known as a measure of the success of the independent variables in predicting the dependent variable [60]. R2 can be defined as the proportion of the variance in the dependent variable that can be predicted from the independent variables [59]. In the R2 metric, which takes a value between 0 and 1, it takes the value of 1 if the independent variables fully explain the dependent variable, while the value of 0 indicates the opposite situation. Accordingly, an R2 value approaching 1 indicates that the success of the model is high [61]. Another performance metric for regression models, the MAPE is used for the interpretation of the relative error [62].
While the MAPE takes a value between 0 and ∞, the mean absolute percentage error between the actual value and the prediction approaches 0, indicating that the success of the established model is high [59]. Prediction models with MAPE values between 10% and 20% are categorized as “correct/good”, whereas models with MAPE values below 10% are categorized as “high accuracy/very good” [63,64].
The RMSE is the square root of the mean of the squares of all the errors [65]. Like the MAPE, the RMSE measures, which take values between 0 and ∞, are also used in the interpretation of regression problems. Values close to 0 indicate that the model is successful [66,67,68]. The MAE is another statistical measure that is used in the interpretation of regression problems. While it takes values between 0 and ∞, values close to 0 indicate that the model is successful [18].

3. Results and Discussions

Modeling studies are very important in the evaluation of green and dry alfalfa leaf resistance. A statistical summary of some mechanical property data of dry and green alfalfa leaves used for the modeling study, including the means and standard deviations, is shown in Table 1. The differences between the mechanical properties of dry and green alfalfa are shown in Table 1. The leaf breaking force, leaf breaking resistance and leaf breaking tension of dry alfalfa are much lower than the values obtained in green alfalfa, which indicates that the leaf losses will be much higher in dry alfalfa. While the leaf breaking force of green alfalfa was 0.087 N, this value was found to be 0.031 N in dry alfalfa, and it is seen that there is a 64.36% decrease between these two values. This decrease was 61.65% in leaf breaking stress and 64.42% in leaf breaking energy. These values clearly show that the mechanical strength of alfalfa leaves decreases as they dry and so leaf losses will increase rapidly. Predicting the breaking resistance of alfalfa leaves in advance will make it possible to minimize the leaf losses that may occur during and after harvest.
In this study, five different machine learning methods, Extra Trees, Random Forest, Gradient Boost, Extreme Gradient Boosting, and Cat Boost, were used. The performances of the models were interpreted based on the evaluation metrics obtained as a result of the established modeling. The results of the models established to predict the breaking stress of the green alfalfa plant and dry alfalfa plant are shown in Table 2.

3.1. Interpretation of Modeling Results of Dried Alfalfa

According to the results in Table 2, for the dried alfalfa plant, the model established by the Extra Trees method is more successful in all the metrics. The best MAE value was obtained as 0.0099. The MAE value is close to 0, so it can be said that the model built is successful. The best MAPE value was obtained as 0.0969. Accordingly, the leaf breaking stress value of dried alfalfa plants can be estimated with an error of approximately 10%. This result shows that the model established with the Extra Tree method is successful. Similarly, the R2 value was obtained as 0.9853. Accordingly, the independent variables explain approximately 98.5% of the variance of the dependent variable. Since the R2 value obtained is close to 1, the established model is successful. The RMSE is a statistical metric that evaluates the error values of regression models built with machine learning methods. It is value close to zero, which indicates that the error obtained from the model is low, and this indicates that the established model is successful. The RMSE value was obtained as 0.0171. This result is close to 0 and shows the success of the established model. The worst RMSE, MAE, MAPE and R2 values were obtained from the model established with the Random Forest method. The results for these metrics were 0.0306, 0.0191, 0.2163 and 0.9499, respectively. As a result, the most successful model in predicting the leaf breaking stress value of dried alfalfa was obtained with the ET method, while the worst model was obtained with the RF method.
There are no studies that have been found to predict the leaf breaking stress of any plant using machine learning methods. In the field literature, it is seen that regression and classification studies are carried out using artificial neural network, logistic regression, support vector machines, extra trees, light gradient boosting, random forest, and decision tree regression methods [14,33,69].
In their study, Kabas et al. [14] made predictions with the value of R2:0.97 with the artificial neural networks model, R2:0.91 with the logistic regression, and R2:0.81 with the decision tree regression model. In another study, Kabas et al. [33] predicted the value of R2:0.92 with the support vector regression model. Kocer et al. [58] made predictions with the value of R2:0.76 with the Extra Trees model, R2:0.73 with the Random Forest and R2:0.68 with the Light Gradient Boosting model. In this study, the best R2 (0.9853), RMSE (0.0171), MAE (0.0099) and MAPE (0.0969) values for the dry alfalfa plant was obtained from the model established with the ET method.
In the machine learning models established to predict the breaking stress value of the dry alfalfa plant, the metric results were generally close to each other. The models were also more successful, with slightly better results in some metrics. Although the model established by the ET method was the most successful model in the MAE metric, all the models obtained similar results. The differences between the models were negligible. Therefore, it can be said that all the models achieved successful results in the MAE metric. We can also make this comment for the RMSE and R2. In the RMSE and R2 metrics, the model established with the ET method was more successful with small differences compared to the models established with other methods. Although the model established with the ET method was slightly more successful than the models established with other methods, the models established with the ET, CB, and XGB methods had similar values. It can be said that these models were more successful compared to the models established with the RF and GB methods in the MAPE metric.

3.2. Interpretation of Modeling Results of Green Alfalfa

Similarly, the machine learning model results established to predict the leaf breaking stress of green alfalfa plants are shown in Table 2. In terms of the R2 and RMSE metrics, the model built with Random Forest is the most successful. The best R2 value obtained is 0.96. Accordingly, the independent variables explain approximately 96% of the variance of the dependent variable. The established RF model is successful because the R2 value is close to 1. The fact that the RMSE value is close to zero indicates that the error obtained from the model is low, which indicates that the established model is successful. The RMSE value is obtained as 0.0616, which is close to 0 and shows the success of the established RF model. In terms of the MAPE metric, the model built with Gradient Boosting is the most successful. The best MAPE value obtained is 0.1447. Accordingly, the leaf breaking stress value of green alfalfa plant can be estimated with an error of approximately 14.5%. This result shows that the model established using the GB method is successful. The worst RMSE, MAPE, and R2 are 0.1194, 0.2163, and 0.8497, respectively.
Kuradusenge et al. [70] performed predictions with the value of R2:0.875 and RMSE: 129.9 with the RF model. In another study, Mostafaeipour et al. [71] produced predictions with the value of R2:0.953, MSE: 0.0102 and RMSE: 0.1010 with the Extreme Learning Machine model. Kabas et al. [72] produced predictions with the value of R2:0.9715, MAPE: 0.0146 and RMSE: 15.69 with the CatBoost model, and MAE: 10.63 with the RF model. In this study, while the best RMSE (0.0616) and R2 (0.96) values for green alfalfa plant were obtained from the model established with the RF method, the best MAE (0.0340) value was obtained from the model established with the ET method. Finally, the best MAPE (0.1447) value was obtained from the model established with the GB method.
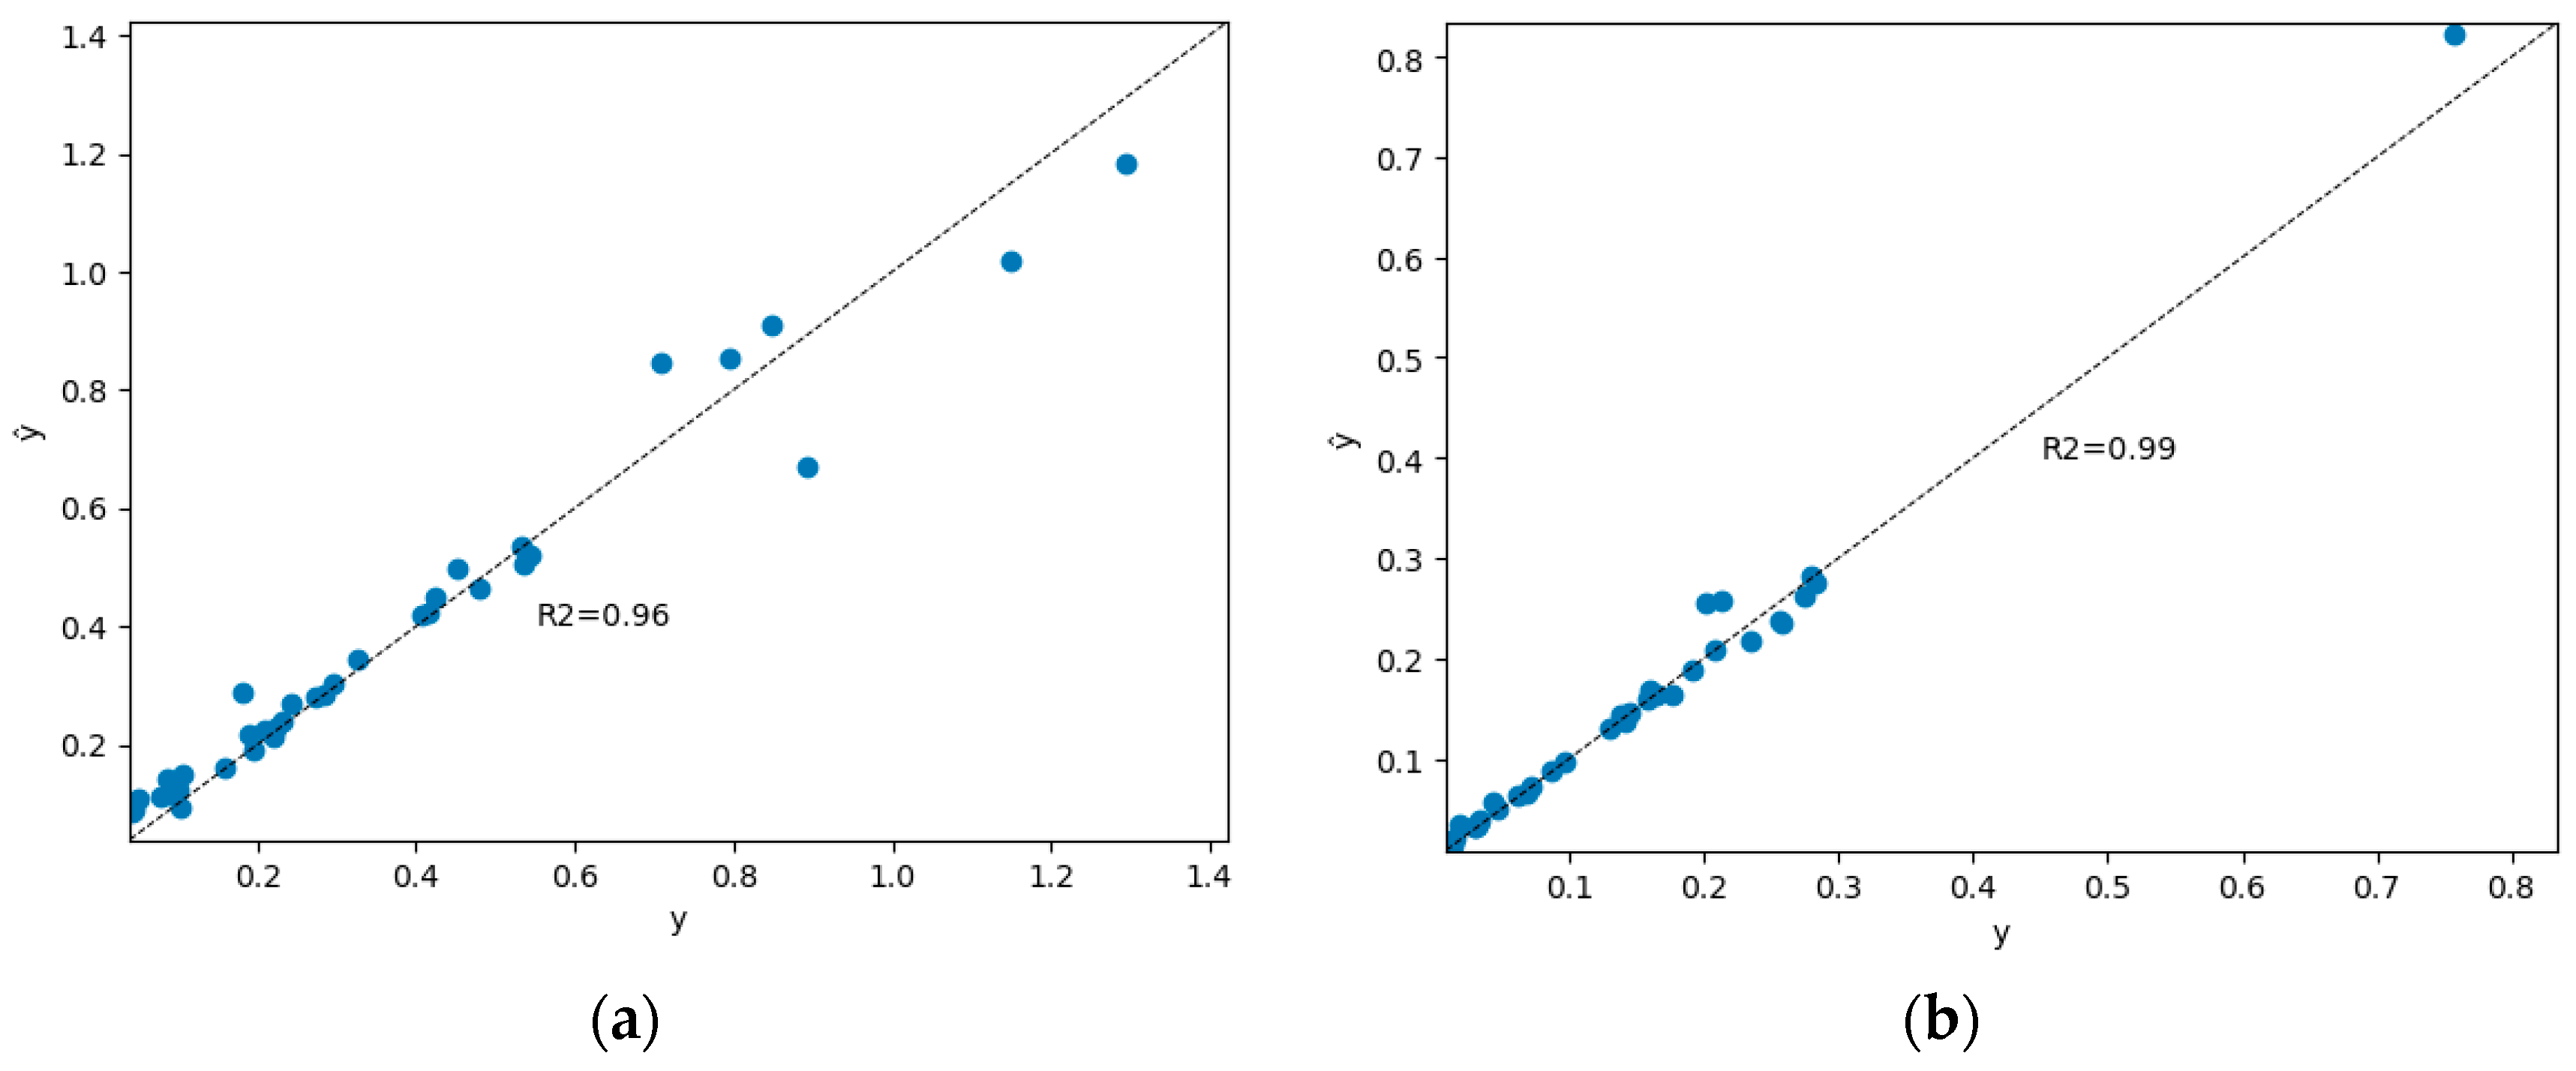
Figure 6 shows the scatterplots of the machine learning models. While the first graph was produced by the RF model, the second graph was produced by the ET model. Similarly, in the machine learning models established to predict the breaking stress value of the green alfalfa plant, the metric results are generally close to each other. When the predicted values and actual values are close to each other, the values will be on the y = x line. However, as the predicted values deviate from the actual values, the values will not lie on this line. It is clearly seen in the scatterplot that the deviations in the model established with the RF method are greater than in the model established with the ET method. Accordingly, it can be said that the model established with the ET method makes more successful predictions. It is also possible to note that the figures support the metric results shown in Table 2. The models performed better on some metrics, with small differences. Although the model established using the ET method was the most successful model in the MAE metric, all the models obtained similar results. The differences between the models were negligible. Therefore, it can be said that all models achieved successful results in the MAE metric. We can also make this comment for the RMSE metric. In the RMSE metric, the model established with the RF method is more successful with small differences compared to the models established with other methods. The models established with RF, ET, and CB have similar values in the RMSE metric. On the other hand, the model established with the RF method is slightly more successful than the models established with the other methods. A similar situation is valid for the R2 metric. Although the model established with the RF method is slightly more successful than the models established with other methods, the models established with the ET and CB methods also have similar values. It can be said that the models established with RF, ET, and CB are more successful in the R2 metric than the models established with the GB and XGB methods. Although the models established with GB, XGB and ET have similar values in the MAPE metric, the model established with the GB method is the most successful model in the MAPE metric.
Figure 7 shows the relationship between the actual and predicted breaking stress values. While the x-axis in the graphs shows the observations, the y-axis shows the stress value. Red lines show the actual values, dashed blue lines show the predicted values. The first graph was produced from the model in which we obtained the leaf breaking stress for the dried alfalfa plant using the RF method. The second graph was produced from the model obtained using the ET method. In both graphs, the actual and predicted values almost overlap. This shows that the established models are successful. The metric results shown in Table 2 and the line plots shown in Figure 7 support each other. The R2 and MAPE values of the model established with the RF method are 0.9499 and 0.2163, respectively. On the other hand, the R2 and MAPE values of the model established with the ET method are 0.9853 and 0.0969, respectively. These results show that although both models are extremely successful in predicting leaf breaking stress, it can be said that the model established with the ET method makes a more successful prediction. Accordingly, it can be said that the metric results and graphic results support each other.
In this study, the leaf breaking stress of dried and green alfalfa plants was predicted using the Extra Trees, Random Forest, Gradient Boost, Extreme Gradient Boosting and Cat Boost methods. For the dried alfalfa plant, the best R2 (0.985) value was obtained from the model established using the Extra Trees method. Similarly, the best RMSE (0.0171) and MAPE (0.0969) values were obtained from the model established with the Extra Trees method. For the green alfalfa plant, the best MAPE (0.1447) value was obtained from the model established using the Gradient Boosting method. The best RMSE (0.0616) and R2 (0.96) values were obtained from the model established with the Random Forest method.

4. Conclusions

Green and dried alfalfa leaf breaking stress characteristics are crucial factors in harvesting and threshing operations. The design and modification of machinery used in harvesting and threshing activities depend on these criteria. To compute these characteristics, a vast number of samples must be measured over an extended period of time. It takes a lot of time, money, and labor to measure a lot of samples. Various measuring mistakes also happen. Larger data sets, traits, and methods that can be utilized for future study may be developed together with more accurate and timely results for applications including discrimination, ranking, and prediction in the industrial sector.
In this study, the green and dried alfalfa leaf breaking stress value was successfully predicted using machine learning methods. The R2, MAE, MAPE, and RMSE metrics were calculated to evaluate the models. When the successful evaluations of the models for the dried alfalfa plant are made using the R2 metric, the model established by the ET method is the most successful model. Independent variables explain approximately 98.5% of the variance of the dependent variable (Table 2). The proportion of variance of the dependent variable explained by the independent variables is 98.5%. When success evaluations are made using the RMSE, MAE and MAPE metrics, the model established with the ET method is the most successful model. The leaf breaking stress value of the dried alfalfa plant can be estimated with an error of approximately 10% (MAPE). The RMSE and MAE value are 0.0171 and 0.0099, respectively. Since the results are close to 0, it can be said that the established model is successful. In fact, all the model results have close values in the R2, MAE and RMSE metrics. However, the model established with the ET method has become the most successful model, obtaining better results with slight differences. The situation is slightly different for the MAPE metric. While the models established with the GB and RF methods produce worse results, the models established with the ET, CB and XGB methods are more successful with similar results. However, the model established with the ET method has become the most successful model, obtaining better results with slight differences.
When the success evaluations of the models for the green alfalfa plant are made using the MAPE metric, the model established using the GB method is the most successful model. The leaf breaking stress value of green alfalfa plant can be estimated with an error of approximately 14.5%. For the R2 metric, the model established using the RF method is the most successful model. The proportion of variance of the dependent variable explained by the independent variables (Table 2) is 96%. For the RMSE metric, the model established with the RF method is the most successful model. The RMSE value is 0.0616. Since the result is close to 0, it can be said that the established model is successful. When success evaluations are made using the MAE metric, the model established with the ET method is the most successful model. The MAE value is 0.0099. Since the result is close to 0, it can be said that the established model is successful. In fact, all the model results have close values in the MAE and RMSE metrics. The situation is slightly different for the MAPE metric. While the models established with the RF and CB methods produce worse results, the models established with the GB, ET and XGB methods are more successful with similar results. The situation is slightly different for the R2 metric such as the MAPE. While the models established with the GB and XGB methods produce worse results, the models established with the RF, CB and ET methods are more successful with similar results.

Author Contributions

Conceptualization, U.E.; methodology, U.E. and O.K.; software, O.K.; validation, U.E. and O.K.; formal analysis, O.K. and G.M.; investigation, U.E. and O.K.; resources, G.M.; data curation, U.E.; writing—original draft preparation, U.E.; writing—review and editing, O.K. and G.M.; visualization, G.M. and O.K.; supervision, U.E. and O.K.; funding acquisition, G.M. All authors have read and agreed to the published version of the manuscript.

Funding

The APC was funded by the National University of Science and Technology Politehnica Bucharest.

Institutional Review Board Statement

Not applicable.

Informed Consent Statement

Not applicable.

Data Availability Statement

The raw data supporting the conclusions of this article will be made available by the authors on request.

Conflicts of Interest

The authors declare no conflicts of interest.

Nomenclature

ANNArtificial Neural Network
CBCatBoost
DTDecision Tree
ETExtra Trees
GBGradient Boost
GPaGiga Pascal
HHertz
JJoule
MAEMean Absolute Error
MAPEMean Absolute Percentage Error
MLMachine Learning
MPaMega Pascal
NNewton
RFRandom Forest
R2Correlation Coefficient
RMSERoot Mean Square Error
XGBExtreme Gradient Boosting

References

  1. Karadavut, U.; Palta, Ç.; Tezel, M.; Aksoyak, Ş. Yonca (Medicago sativa L.) bitkisinde bazı fizyolojik karakterlerin belirlenmesi. Ziraat Fakültesi Derg. 2011, 6, 8–16. [Google Scholar]
  2. Rotz, C.A. Loss models for forage harvest. Trans. ASAE 1995, 38, 1621–1631. [Google Scholar] [CrossRef]
  3. Güler, T.; Çerçi, İ.H. Güneş enerjisi destekli yonca kurutma ünitesinin geliştirilmesi ve elde edilen yoncaların toklular üzerine etkisi: 1. kurutma ünitesinin verimliliği ve yonca kalitesinin belirlenmesi. Fırat Üniversitesi Sağlık Bilim. Derg. 1999, 13, 309–318. [Google Scholar]
  4. Ekiz, H. Çayır ve Mera Yönetimi; The Ankara University: Ankara, Türkiye, 2023; Available online: https://acikders.ankara.edu.tr/pluginfile.php/33774/mod_resource/content/0/%C3%87AYIR%20VE%20MERA%20Y%C3%96NET%C4%B0M%C4%B0%20DERS%20MATERYAL%C4%B0%2014.%20KONU.pdf (accessed on 6 November 2023).
  5. Toruk, F.; Ülger, P.; Kayışoğlu, B.; Polat, C. Kaba Yem Hasat Mekanizasyonunun Yonca Otu Besin Değeri Kaybına Etkilerinin Saptanması Üzerine Bir Araştırma. In Proceedings of the 18. Tarımsal Mekanizasyon Kongresi, Tekirdağ, Türkiye, 17–18 September 1998; Tar-Mek: Ankara, Türkiye, 1998; pp. 649–660. [Google Scholar]
  6. King, M.J.; Vincent, J.F.V. Static and dynamic fracture properties of the leaf of new zealand flax phormium tenax (Phormiaceae: Monocotyledones). Proc. R. Soc. B Biol. Sci. 1996, 263, 521–527. [Google Scholar]
  7. Yilmaz, D.; Gökdüman, M.E. Physical-mechanical properties of origanum onites at different moisture contents. J. Essent. Oil Bear. Plants 2014, 17, 1023–1033. [Google Scholar] [CrossRef]
  8. Arévalo, C.A.; Castillo, B.; Londoño, M.T. Propiedades mecánicas de los tallos de romero (Rosmarinus officinalis L.). Agron. Colombia 2013, 31, 201–207. [Google Scholar]
  9. Shinners, K.J.; Koegel, R.G.; Barrington, G.P.; Straub, R.J. Evaluating longitudinal shear as a forage maceration technique. Trans. ASAE 1987, 30, 18–0022. [Google Scholar] [CrossRef]
  10. Öten, M.; Kabaș, Ö.; Kiremitci, S. Determination of leaf breaking strength in some clover genotypes collected from antalya natural flora. Derim 2018, 35, 81–86. [Google Scholar] [CrossRef]
  11. Prince, R.P. Measurement of ultimate strength of forage stalks. Trans. ASAE 1961, 4, 208–0209. [Google Scholar] [CrossRef]
  12. Türker, U. Yoncanın Kesilme Direncinin Belirlenmesi; Ankara University: Ankara, Turkey, 1992. [Google Scholar]
  13. Halyk, R.M.; Hurlbut, L.W. Tensile and shear strength characteristics of alfalfa stems. Trans. ASAE 1968, 11, 256–0257. [Google Scholar]
  14. Kabas, O.; Kayakus, M.; Ünal, İ.; Moiceanu, G. Deformation energy estimation of cherry tomato based on some engineering parameters using machine-learning algorithms. Appl. Sci. 2023, 13, 8906. [Google Scholar] [CrossRef]
  15. SAP Makine Öğrenmesi Nedir? Tanım, Türler ve Örnekler. Available online: https://www.sap.com/turkey/products/artificial-intelligence/what-is-machine-learning.html (accessed on 6 November 2023).
  16. Sidey-Gibbons, J.A.M.; Sidey-Gibbons, C.J. Machine learning in medicine: A practical introduction. BMC Med. Res. Methodol. 2019, 19, 64. [Google Scholar] [CrossRef]
  17. Roldan-Vasco, S.; Orozco-Duque, A.; Orozco-Arroyave, J.R. Swallowing disorders analysis using surface EMG biomarkers and classification models. Digit. Signal Process. 2023, 133, 103815. [Google Scholar]
  18. Duman, S.; Elewi, A.; Yetgin, Z. Distance estimation from a monocular camera using face and body features. Arab. J. Sci. Eng. 2022, 47, 1547–1557. [Google Scholar] [CrossRef]
  19. Vadyala, S.R.; Betgeri, S.N.; Matthews, J.C.; Matthews, E. A Review of physics-based machine learning in civil engineering. Results Eng. 2022, 13, 100316. [Google Scholar] [CrossRef]
  20. Mele, M.; Magazzino, C. Pollution, economic growth, and COVID-19 deaths in India: A machine learning evidence. Environ. Sci. Pollut. Res. 2021, 28, 2669–2677. [Google Scholar] [CrossRef] [PubMed]
  21. Cardona, T.; Cudney, E.A.; Hoerl, R.; Snyder, J. Data mining and machine learning retention models in higher education. J. Coll. Stud. Retent. Res. Theory Pract. 2023, 25, 51–75. [Google Scholar] [CrossRef]
  22. Pallathadka, H.; Wenda, A.; Ramirez-Asís, E.; Asís-López, M.; Flores-Albornoz, J.; Phasinam, K. Classification and prediction of student performance data using various machine learning algorithms. Mater. Today Proc. 2023, 80, 3782–3785. [Google Scholar] [CrossRef]
  23. van Dun, C.; Moder, L.; Kratsch, W.; Röglinger, M. ProcessGAN: Supporting the creation of business process improvement ideas through generative machine learning. Decis. Support Syst. 2023, 165, 113880. [Google Scholar] [CrossRef]
  24. Albaity, M.; Mahmood, T.; Ali, Z. Impact of machine learning and artificial intelligence in business based on intuitionistic fuzzy soft WASPAS method. Mathematics 2023, 11, 1453. [Google Scholar] [CrossRef]
  25. Melnikov, A.; Kordzanganeh, M.; Alodjants, A.; Lee, R.K. Quantum machine learning: From physics to software engineering. Adv. Phys. X 2023, 8, 2165452. [Google Scholar] [CrossRef]
  26. Zhang, S.Q.; Xu, L.C.; Li, S.W.; Oliveira, J.C.A.; Li, X.; Ackermann, L.; Hong, X. Bridging chemical knowledge and machine learning for performance prediction of organic synthesis. Chem. A Eur. J. 2023, 29, e202202834. [Google Scholar] [CrossRef] [PubMed]
  27. Giles, B.; Peeling, P.; Kovalchik, S.; Reid, M. Differentiating movement styles in professional tennis: A machine learning and hierarchical clustering approach. Eur. J. Sport Sci. 2023, 23, 44–53. [Google Scholar] [CrossRef] [PubMed]
  28. Cock, J.; Jiménez, D.; Dorado, H.; Oberthür, T. Operations research and machine learning to manage risk and optimize production practices in agriculture: Good and bad experience. Curr. Opin. Environ. Sustain. 2023, 62, 101278. [Google Scholar] [CrossRef]
  29. Taner, A.; Mengstu, M.T.; Selvi, K.Ç.; Duran, H.; Kabaş, Ö.; Gür, İ.; Karaköse, T.; Gheorghiță, N.-E. Multiclass apple varieties classification using machine learning with histogram of oriented gradient and color moments. Appl. Sci. 2023, 13, 7682. [Google Scholar] [CrossRef]
  30. Alkali, B.; Osunde, Z.E.; Sadiq, I.O.; Eramus, C.U. Applications of artificial neural network in determining the mechanical properties of melon fruits. IOSR J. Agric. Vet. Sci. 2014, 6, 12–16. [Google Scholar]
  31. Cevher, E.Y.; Yıldırım, D. Using artificial neural network application in modeling the mechanical properties of loading position and storage duration of pear fruit. Processes 2022, 10, 2245. [Google Scholar] [CrossRef]
  32. Ziaratban, A.; Azadbakht, M.; Ghasemnezhad, A. Modeling of volume and surface area of apple from their geometric characteristics and artificial neural network. Int. J. Food Prop. 2017, 20, 762–768. [Google Scholar] [CrossRef]
  33. Kabas, O.; Kayakus, M.; Moiceanu, G. Nondestructive estimation of hazelnut (Corylus avellana L.) terminal velocity and drag coefficient based on some fruit physical properties using machine learning algorithms. Foods 2023, 12, 2879. [Google Scholar] [CrossRef] [PubMed]
  34. Baltrusaitis, T.; Ahuja, C.; Morency, L.P. Multimodal machine learning: A survey and taxonomy. IEEE Trans. Pattern Anal. Mach. Intell. 2018, 41, 423–443. [Google Scholar] [CrossRef] [PubMed]
  35. Akmeşe, Ö.F.; Kör, H.; Erbay, H. Use of machine learning techniques for the forecast of student achievement in higher education. Inf. Technol. Learn. Tools 2021, 82, 297–311. [Google Scholar]
  36. ASAE S368.3; Compression Test of Food Materials of Convex Shape. American Society of Agricultural and Biological Engineers: St. Joseph, MI, USA, 2009; pp. 678–686.
  37. Muller, A.C.; Guido, S. Introduction to Machine Learning with Python (Early Release) Raw & Unedited; O’Reilly Media, Inc.: Sebastopol, CA, USA, 2016; pp. 1–376. [Google Scholar]
  38. Alpaydın, E. Introduction to Machine Learning, 2nd ed.; Dietterich, T., Ed.; The MIT Press: Cambridge, MA, USA, 2010; pp. 1–613. [Google Scholar]
  39. Brodley, C.E.; Friedl, M.A. Identifying mislabeled training data. J. Artif. Intell. Res. 1999, 11, 131–167. [Google Scholar] [CrossRef]
  40. Van Hulse, J.; Khoshgoftaar, T. Knowledge discovery from imbalanced and noisy data. Data Knowl. Eng. 2009, 68, 1513–1542. [Google Scholar] [CrossRef]
  41. Saeed, H.; Ahmed, M. Diabetes type 2 classification using machine learning algorithms with up-sampling technique. J. Electr. Syst. Inf. Technol. 2023, 10, 8. [Google Scholar] [CrossRef]
  42. Geurts, P.; Ernst, D.; Wehenkel, L. Extremely randomized trees. Mach. Learn. 2006, 63, 3–42. [Google Scholar] [CrossRef]
  43. El Bilali, A.; Abdeslam, T.; Ayoub, N.; Lamane, H.; Ezzaouini, M.A.; Elbeltagi, A. An interpretable machine learning approach based on DNN, SVR, Extra Tree, and CatBoost models for predicting daily pan evaporation. J. Environ. Manag. 2023, 327, 116890. [Google Scholar] [CrossRef] [PubMed]
  44. Dorogush, A.V.; Ershov, V.; Yandex, A.G. CatBoost: Gradient boosting with categorical features support. arXiv 2018, arXiv:1810-11363v1. [Google Scholar]
  45. Hussain, S.; Mustafa, M.W.; Jumani, T.A.; Baloch, S.K.; Alotaibi, H.; Khan, I.; Khan, A. A novel feature engineered-catboost-based supervised machine learning framework for electricity theft detection. Energy Rep. 2021, 7, 4425–4436. [Google Scholar] [CrossRef]
  46. Beskopylny, A.N.; Stel’makh, S.A.; Shcherban’, E.M.; Mailyan, L.R.; Meskhi, B.; Razveeva, I.; Chernil’nik, A.; Beskopylny, N. Concrete strength prediction using machine learning methods catboost, k-nearest neighbors, support vector regression. Appl. Sci. 2022, 12, 10864. [Google Scholar] [CrossRef]
  47. CatBoost-Open-Source Gradient Boosting Library. Available online: https://catboost.ai/news/catboost-enables-fast-gradient-boosting-on-decision-trees-using-gpus (accessed on 16 September 2023).
  48. Flores, V.; Keith, B. Gradient boosted trees predictive models for surface roughness in high-speed milling in the steel and aluminum metalworking industry. Complexity 2019, 2019, 1536716. [Google Scholar] [CrossRef]
  49. Zulfiqar, H.; Yuan, S.S.; Huang, Q.L.; Sun, Z.J.; Dao, F.Y.; Yu, X.L.; Lin, H. Identification of cyclin protein using gradient boost decision tree algorithm. Comput. Struct. Biotechnol. J. 2021, 19, 4123–4131. [Google Scholar] [CrossRef] [PubMed]
  50. Natekin, A.; Knoll, A. Gradient boosting machines, a tutorial. Front. Neurorobot. 2013, 7, 21. [Google Scholar] [CrossRef] [PubMed]
  51. Kumar, G.; Yadav, S.S.; Yogita; Pal, V. Machine learning-based framework to predict finger movement for prosthetic hand. IEEE Sensors Lett. 2022, 6, 6002204. [Google Scholar] [CrossRef]
  52. Al Daoud, E. Comparison between XGBoost, LightGBM and CatBoost using a home credit dataset. Int. J. Comput. Inf. Eng. 2019, 13, 6–10. [Google Scholar]
  53. Abdi, A.M. Land cover and land use classification performance of machine learning algorithms in a boreal landscape using sentinel-2 data. GIScience Remote Sens. 2020, 57, 1–20. [Google Scholar] [CrossRef]
  54. Chen, T.; Guestrin, C. XGBoost: A Scalable Tree Boosting System. In Proceedings of the KDD ’16: Proceedings of the 22nd ACM SIGKDD International Conference on Knowledge Discovery and Data Mining, San Francisco, CA, USA, 13–17 August 2016; Association for Computing Machinery: New York, NY, USA, 2016; pp. 785–794. [Google Scholar]
  55. Iannace, G.; Ciaburro, G.; Trematerra, A. Wind turbine noise prediction using random forest regression. Machines 2019, 7, 69. [Google Scholar] [CrossRef]
  56. Oshiro, T.M.; Perez, P.S.; Baranauskas, J.A. How many trees in a random forest? In Machine Learning and Data Mining in Pattern Recognition; Springer: Berlin/Heidelberg, Germany, 2012; pp. 154–168. [Google Scholar]
  57. Zhang, L.; Liu, Z.; Liu, D.; Xiong, Q.; Yang, N.; Ren, T.; Zhang, C.; Zhang, X.; Li, S. Crop mapping based on historical samples and new training samples generation in Heilongjiang province, China. Sustainability 2019, 11, 5052. [Google Scholar] [CrossRef]
  58. Kocer, A.; Kabas, O.; Zabava, B.S. Estimation of compressive resistance of briquettes obtained from groundnut shells with different machine learning algorithms. Appl. Sci. 2023, 13, 9826. [Google Scholar] [CrossRef]
  59. Chicco, D.; Warrens, M.J.; Jurman, G. The coefficient of determination r-squared is more informative than smape, mae, mape, mse and rmse in regression analysis evaluation. PeerJ Comput. Sci. 2021, 7, e623. [Google Scholar] [CrossRef]
  60. Nagelkerke, N.J.D. A note on a general definition of the coefficient of determination. Biometrika 1991, 78, 691–692. [Google Scholar] [CrossRef]
  61. Ozer, D. Correlation and the coefficient of determination. Psychol. Bull. 1985, 97, 307–315. [Google Scholar] [CrossRef]
  62. de Myttenaere, A.; Golden, B.; Le Grand, B.; Rossi, F. Mean absolute percentage error for regression models. Neurocomputing 2016, 192, 38–48. [Google Scholar] [CrossRef]
  63. Lewis, C.D.; Colin, D. Industrial and Business Forecasting Methods: A Practical Guide to Exponential Smoothing and Curve Fitting; Butterworth Scientific: London, UK, 1982; pp. 1–143. [Google Scholar]
  64. Witt, S.F.; Witt, C.A. Modeling and Forecasting Demand in Tourism.; Academic Press Ltd.: London, UK, 1992; pp. 1–208. [Google Scholar]
  65. Christie, D.; Neill, S.P. Measuring and Observing The Ocean Renewable Energy Resource, 2nd ed.; Bangor University: Bangor, UK, 2021; pp. 149–175. [Google Scholar]
  66. Tüchler, M.; Singer, A.C.; Koetter, R. Minimum mean squared error equalization using a priori information. IEEE Trans. Signal Process. 2002, 50, 673–683. [Google Scholar] [CrossRef]
  67. Chai, T.; Draxler, R.R. Root mean square error (RMSE) or mean absolute error (MAE)? —arguments against avoiding RMSE in the literature. Geosci. Model Dev. 2014, 7, 1247–1250. [Google Scholar] [CrossRef]
  68. Le, T.T. Prediction of tensile strength of polymer carbon nanotube composites using practical machine learning method. J. Compos. Mater. 2021, 55, 787–811. [Google Scholar] [CrossRef]
  69. de Sousa, I.C.; Nascimento, M.; Silva, G.N.; Nascimento, A.C.C.; Cruz, C.D.; Silva, F.F.E.; de Almeida, D.P.; Pestana, K.N.; Azevedo, C.F.; Zambolim, L.; et al. Genomic prediction of leaf rust resistance to arabica coffee using machine learning algorithms. Sci. Agric. 2020, 78, e20200021. [Google Scholar] [CrossRef]
  70. Kuradusenge, M.; Hitimana, E.; Hanyurwimfura, D.; Rukundo, P.; Mtonga, K.; Mukasine, A.; Uwitonze, C.; Ngabonziza, J.; Uwamahoro, A. Crop yield prediction using machine learning models: Case of Irish potato and maize. Agriculture 2023, 13, 225. [Google Scholar] [CrossRef]
  71. Mostafaeipour, A.; Fakhrzad, M.B.; Gharaat, S.; Jahangiri, M.; Dhanraj, J.A.; Band, S.S.; Issakhov, A.; Mosavi, A. Machine learning for prediction of energy in wheat production. Agriculture 2020, 10, 517. [Google Scholar] [CrossRef]
  72. Kabas, O.; Ercan, U.; Dinca, M.N. Prediction of briquette deformation energy via ensemble learning algorithms using physico-mechanical parameters. Appl. Sci. 2024, 14, 652. [Google Scholar] [CrossRef]
Figure 1. Biological material test instrument.
Applsci 14 01638 g001
Figure 2. Force–deformation curve.
Applsci 14 01638 g002
Figure 3. Input and target values.
Applsci 14 01638 g003
Figure 4. Workflow of the machine learning process.
Applsci 14 01638 g004
Figure 5. Iterative training of DTs in GB [47].
Applsci 14 01638 g005
Figure 6. Scatterplots of machine learning models: (a) Random Forest and (b) Extra Trees.
Applsci 14 01638 g006
Figure 7. Line plots of the machine learning models: (a) Random Forest and (b) Extra Trees.
Applsci 14 01638 g007
Table 1. Experimentally measured values of green and dry alfalfa.
Plan TypeVariablesMean ± SD
DriedLeaf stem diameter (mm)0.561 ± 0.157
Leaf petiole area (mm2)0.261 ± 0.152
Leaf breaking force (N)0.031 ± 0.023
Leaf breaking energy (J)0.037 ± 0.028
Leaf breaking stress (N mm−2)0.158 ± 0.204
GreenLeaf stem diameter (mm)0.580 ± 0.157
Leaf petiole area (mm2)0.280 ± 0.152
Leaf breaking force (N)0.087 ± 0.055
Leaf breaking energy (J)0.104 ± 0.066
Leaf breaking stress (N mm−2)0.412 ± 0.371
Table 2. Results of the machine learning models.
Plant TypeModelEvaluation Criteria
RMSEMAPEMAER2
DriedExtra Trees0.01710.09690.00990.9853
CatBoost0.01740.10680.01050.9838
Gradient Boosting0.02650.19360.01780.9624
Random Forest0.03060.21630.01910.9499
Extreme Gradient Boosting0.02230.12240.01240.9736
GreenExtra Trees0.07070.16040.03400.9472
CatBoost0.08500.18060.03870.9239
Gradient Boosting0.11940.14470.06210.8497
Random Forest0.06160.21350.03630.9600
Extreme Gradient Boosting0.10260.17500.05420.8889
Disclaimer/Publisher’s Note: The statements, opinions and data contained in all publications are solely those of the individual author(s) and contributor(s) and not of MDPI and/or the editor(s). MDPI and/or the editor(s) disclaim responsibility for any injury to people or property resulting from any ideas, methods, instructions or products referred to in the content.