Article

Multi-Identity Recognition of Darknet Vendors Based on Metric Learning

1
Research Institute, State Grid Zhejiang Electric Power Co., Ltd., Hangzhou 311152, China
2
School of Electronic Information and Electrical Engineering, Shanghai Jiao Tong University, Shanghai 200240, China
*
Author to whom correspondence should be addressed.
Appl. Sci. 2024, 14(4), 1619; https://doi.org/10.3390/app14041619
Submission received: 16 January 2024 / Revised: 13 February 2024 / Accepted: 15 February 2024 / Published: 17 February 2024
(This article belongs to the Special Issue AI-Based Image Processing: 2nd Edition)

Abstract

:
Dark web vendor identification can be seen as an authorship aliasing problem, aiming to determine whether different accounts on different markets belong to the same real-world vendor, in order to locate cybercriminals involved in dark web market transactions. Existing open-source datasets for dark web marketplaces are outdated and cannot simulate real-world situations, while data labeling methods are difficult and suffer from issues such as inaccurate labeling and limited cross-market research. The problem of identifying vendors’ multiple identities on the dark web involves a large number of categories and a limited number of samples, making it difficult to use traditional multiclass classification models. To address these issues, this paper proposes a metric learning-based method for dark web vendor identification, collecting product data from 21 currently active English dark web marketplaces and using a multi-dimensional feature extraction method based on product titles, descriptions, and images. Using pseudo-labeling technology combined with manual labeling improves data labeling accuracy compared to previous labeling methods. The proposed method uses a Siamese neural network with metric learning to learn the similarity between vendors and achieve the recognition of vendors’ multiple identities. This method achieved better performance with an average F1-score of 0.889 and an accuracy rate of 97.535% on the constructed dataset. The contributions of this paper lie in the proposed method for collecting and labeling data for dark web marketplaces and overcoming the limitations of traditional multiclass classifiers to achieve effective recognition of vendors’ multiple identities.

1. Introduction

The main purpose of anonymous communication networks, such as mix [1], Tor [2], I2P [3], and Freenet [4], is to hide users’ identity information and communication data. Cybercriminals often use anonymous communication networks to conceal their identities and carry out online crimes. Dark web marketplaces are a type of hidden service on the dark web; the trading volume in these marketplaces has been increasing in recent years [5,6]. The anonymity of the dark web makes it difficult to track the identities of the buyers and sellers in these transactions. Additionally, some vendors register accounts on the same market or multiple markets to reach a larger pool of potential buyers [7,8]. In this context, researching the problem of identifying vendors’ multiple identities on the dark web is particularly important.
Existing studies on identifying vendors’ multiple identities on the dark web suffer from several limitations: (1) The existing dark web market datasets, such as DNM (Darknet Market Archives) [9], were collected between 2011 and 2015, and some of the marketplaces included in the dataset, such as Dream Market, have since been shut down. (2) Data labeling for identifying vendors’ multiple identities is difficult, and previous studies have used two methods: (1) dividing each vendor account into two parts and treating them as new accounts with shared identities, or (2) determining whether two accounts belong to the same identity based on their account names. However, the first approach is inapplicable for cross-market research and the second method suffers from inaccurate labeling. (3) The problem of identifying vendors’ multiple identities on the dark web involves a large number of categories (each vendor identity is considered a category) and a limited number of samples for each category, making it difficult to use traditional multiclass classification models.
We consider identifying multiple identities of vendors on the dark web as authorship aliasing, which aims to find out which accounts in a given set are controlled by the same real-world vendor. With such an assumption, we propose a method for collecting and labeling data for dark web marketplaces and overcoming the limitations of traditional multiclass classifiers to achieve effective identification of vendors’ multiple identities. Our paper has the following contributions:
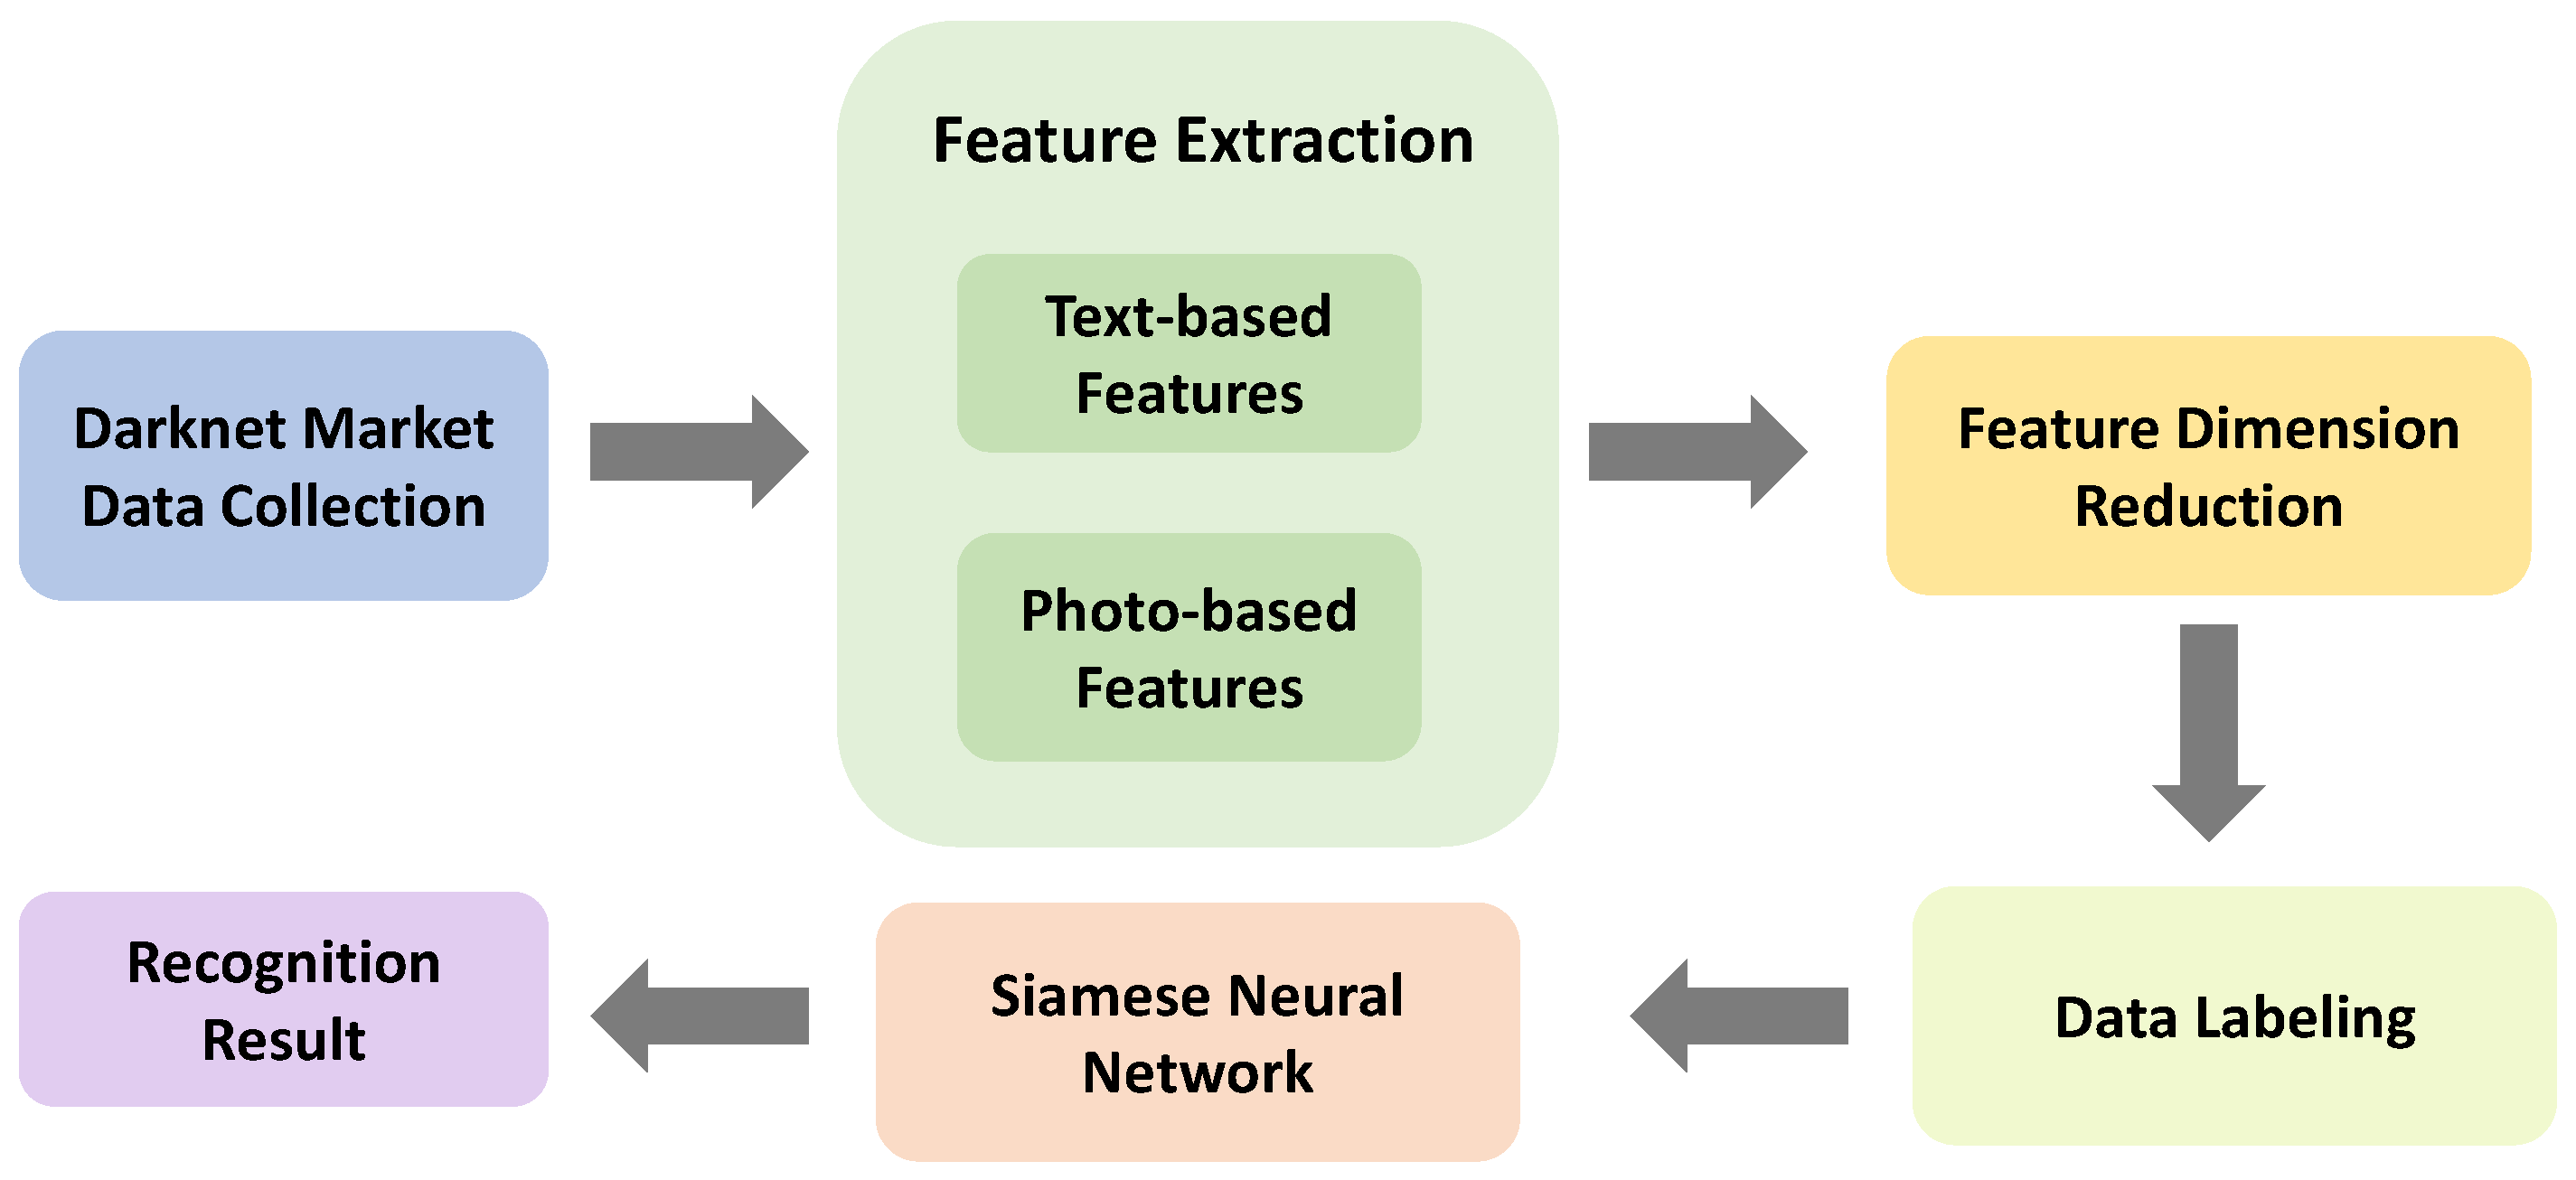
  • We collected product data from 21 currently active English dark web marketplaces through a web crawler system and propose a multi-dimensional feature extraction method based on product titles, descriptions, and images, which can comprehensively represent dark web marketplace products.
  • We combined pseudo-labeling technology with manual labeling to improve the accuracy of data labeling.
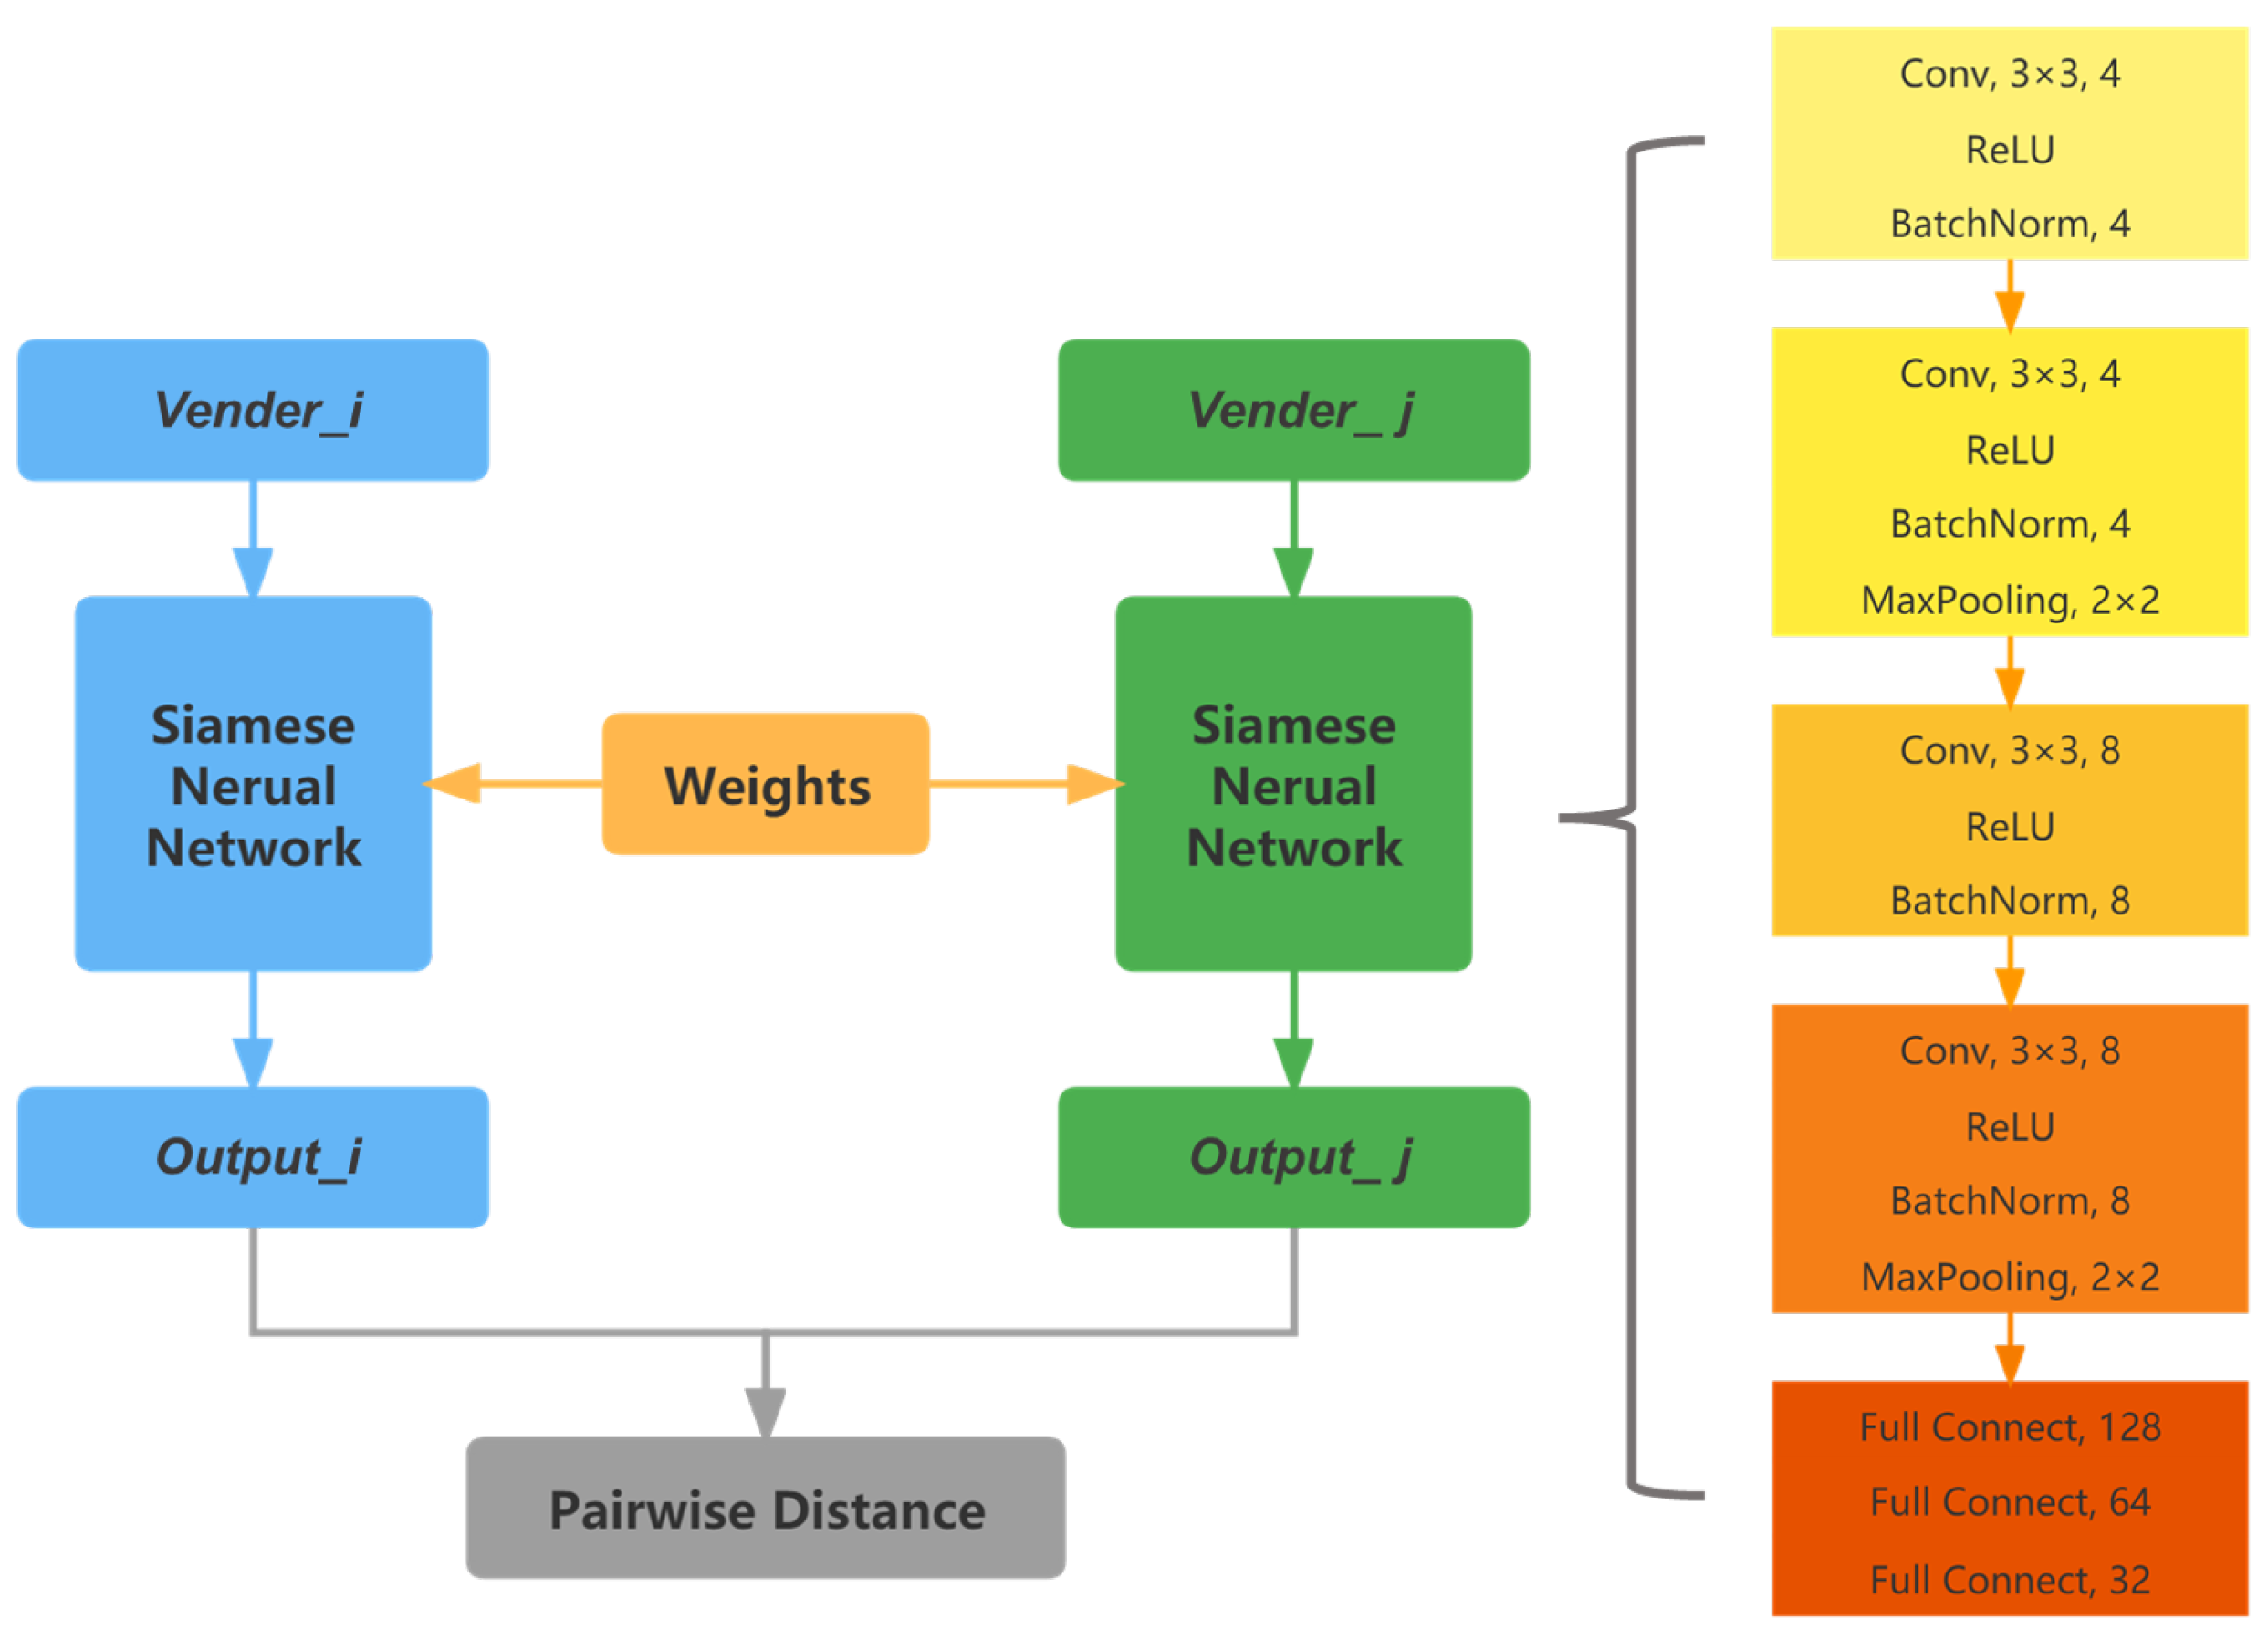
  • We propose to use a Siamese neural network with metric learning to learn the similarity between vendors and achieve the identification of vendors’ multiple identities.

2. Related Works

2.1. Multi-Identity Recognition

Multi-identity recognition can be viewed as an author attribution (AA) problem. Suman et al. [10] presented a capsule-based convolutional neural network (CNN) model over character n-grams for performing the AA task. Zhang et al. [11] proposed a novel strategy to encode the syntax parse tree of a sentence into a learnable distributed representation. Fabien et al. [12] proposed to incorporate a BERT (Bidirectional Encoder Representations from Transformers) [13] model into a classification model, which was used to process raw text and incorporate writing style features and hybrid features, which was ultimately fused to form a classification model with a 5.3% improvement over the best model at the time. A hybrid model for AA of short texts was proposed [14], comprising a pretrained RoBERTa-based language model for tweet-related stylistic features and a CNN model for users’ writing styles. With the development of the natural language processing, large language models (LLMs) have been used for authorship verification by providing step-by-step stylometric explanation prompts [15].

2.2. Features of Classification

Some researchers have used writing-style features to identify vendors’ multiple identities on the dark web. Xiao et al. [16] conducted a writing-style feature analysis of dark web market data from eight years (2011–2018) and identified 22,163 vendor accounts with sales records controlled by 15,652 different real-world vendors. They used a wide range of features, including edit distance between the IDs, same or different marketplace, Jaccard similarity for profile descriptions, and item titles and descriptions.
In addition to writing-style features, many other types of information can be obtained from dark web vendors. Kumar et al. [17] proposed the eDarkFind model, which summarized five types of features to describe a vendor, including the description text of their products, the location of the product, and the product category. They proposed an unsupervised cosine similarity matching method to detect a vendor’s multiple identities on dark web marketplaces, using the ability of multi-view learning to capture different and complementary information in the features. The accuracy of predicting vendor similarity reached 98%. Gianluigi et al. [18] were the first to construct an information network of dark web vendors based on PGP key relationships and apply writing-style features to dark web marketplaces. The analysis found that many vendors used different usernames on different markets but the same PGP key as their identity.
Some studies have used images published by vendors as features, based on the assumption that a vendor is likely to use the same image to describe similar products on different trading markets, or may take pictures of the same product from multiple angles. Wang et al. [19] extracted features from images published by vendors and studied them on three dark web markets (Agora, Evolution, and Silk Road 2). They used a special dataset labeling method, dividing each image published by a vendor into two parts, which were considered different identities of the same vendor. The classifier’s task was to classify these two parts into the correct vendor. Then, multiple pretraining models were used to construct a multiclass classifier, with each category representing a real-world vendor. Finally, the model achieved an accuracy ranging from 58% to 84.6% on the three dark web market datasets, after removing duplicate images. However, this labeling method prevented the model from conducting a cross-market analysis, while we prefer to identify accounts controlled by the same vendor in different markets.

3. Research Design

The overall framework of the proposed method for identifying multiple identities of darknet vendors is shown in Figure 1. Firstly, a distributed crawler is developed to collect the darknet market dataset. Then, text and image features are extracted, and dimension reduction is performed using a principal component analysis (PCA) and weighted generalized canonical correlation analysis (WGCCA). Finally, a Siamese neural network is utilized to accomplish the task of identifying the multiple identities of darknet vendors.

3.1. The Dataset

We collected darknet market product data (including vendor name, title, description, image, shipping origin, category, etc.) as the dataset used in this paper. The data were collected between 2020 and 2021, and in total, we obtained 185,460 items from 8507 vendors. Although the data collected from the darknet markets were already structured and saved, they still needed to be processed. Overall, the original data had three problems that needed to be preprocessed before it could be used:
  • There were duplicate items in the same market, which referred to items with the same name, description, vendor name, and category. These items increased the training time of the model but did not help the model converge. Additionally, some market item names could end in “Clone”, and these items also needed to be deduplicated.
  • The shipping origin of each market was not uniform. For example, some products had the United States as the shipping origin, and some markets were set to USA, US, U.S.A, United States, etc. These shipping origins were standardized to USA.
  • The categories were not uniform. For example, cannabis drugs were defined as cannabis in some markets and hashish in others.
For problem 1, which is duplicate data, we extracted the name, description, vendor name, and category from each product as a quadruple, and deduplicated based on this quadruple. Duplicate data were only retained for the first group. For problems 2 and 3, the shipping origin and category needed to be normalized. By defining a mapping between location and category names, names that represented the same location/category in different markets were mapped to a standardized name. For example, both USA and US were mapped to USA, and both cannabis and hashish were mapped to a Cannabis and Hashish category.

3.2. Feature Extraction

Due to the relatively small number of features at the vendor level, the features at the product level were aggregated to obtain the features at the vendor level. For each type of feature, the usual aggregation approach was to take the average of all features of products sold by each vendor to obtain the features of that vendor.

3.2.1. Text-Based Features

In the dataset, there were two types of text data, namely, product titles and descriptions, and features were extracted from each of them. To extract text-based features, we used the following methods.

BERT [13]

BERT is a pretrained language model and it can be used without tuning the parameters. We used BERT as a feature extraction network to which the title and description of the product were input, and the parameters of BERT were not adjusted.

Doc2Vec [20]

It is also used in [17] to extract text features as input to the model. We used the PV-DM approach to train the Doc2Vec model to generate features for product titles and descriptions. Two methods were used to aggregate the product-level features to the vendor-level features: (1) taking the average of the product features to obtain the vendor features; (2) adding [START] and [END] at the beginning and end of the title and description of each item sold by a vendor to identify a document, connecting these documents together, training a Doc2Vec model with PV-DBOW approach, and obtaining document vectors as features.

Writing-StyleFeatures 

The writing style also contains rich distinguishing features, and we extracted these features from product text, as shown in Table 1. Among them, the lexical richness can measure the vocabulary of an article, which can reflect the author’s personal word-usage characteristics and writing style. We used six methods, including TTR (type-token ratio), to calculate lexical diversity. We employed the method proposed by Covington et al. [21] to split a long text into multiple short texts of equal length using a sliding-window approach. The type-token ratio (TTR) was calculated for each short text, and the average TTR was taken as the final measure of lexical richness.

3.2.2. Photo-Based Features

In the dataset, the photo data were relatively simple, but some products did not have photos. For these products, their features were set to a vector of zeros. We used ResNet50 to calculate a 1000-dimensional feature for each image of a product. If a product had multiple images, the average of their feature calculation results was taken as the product’s feature. For vendors, the average calculation result of all the images they published was taken as their feature.

3.2.3. Feature Dimension Reduction

To reduce the dimension of the features extracted from different methods, WGCCA and PCA were applied in this work. Simply concatenating all features would result in a high-dimensional feature space, which hinders the speed of model inference. WGCCA and PCA both computed 784-dimensional features. This number was chosen for the convenience of transforming features into  28 × 28  grayscale images. The performance of both methods was compared in each experiment, and the better one was chosen as the final result.

3.3. Metric Learning

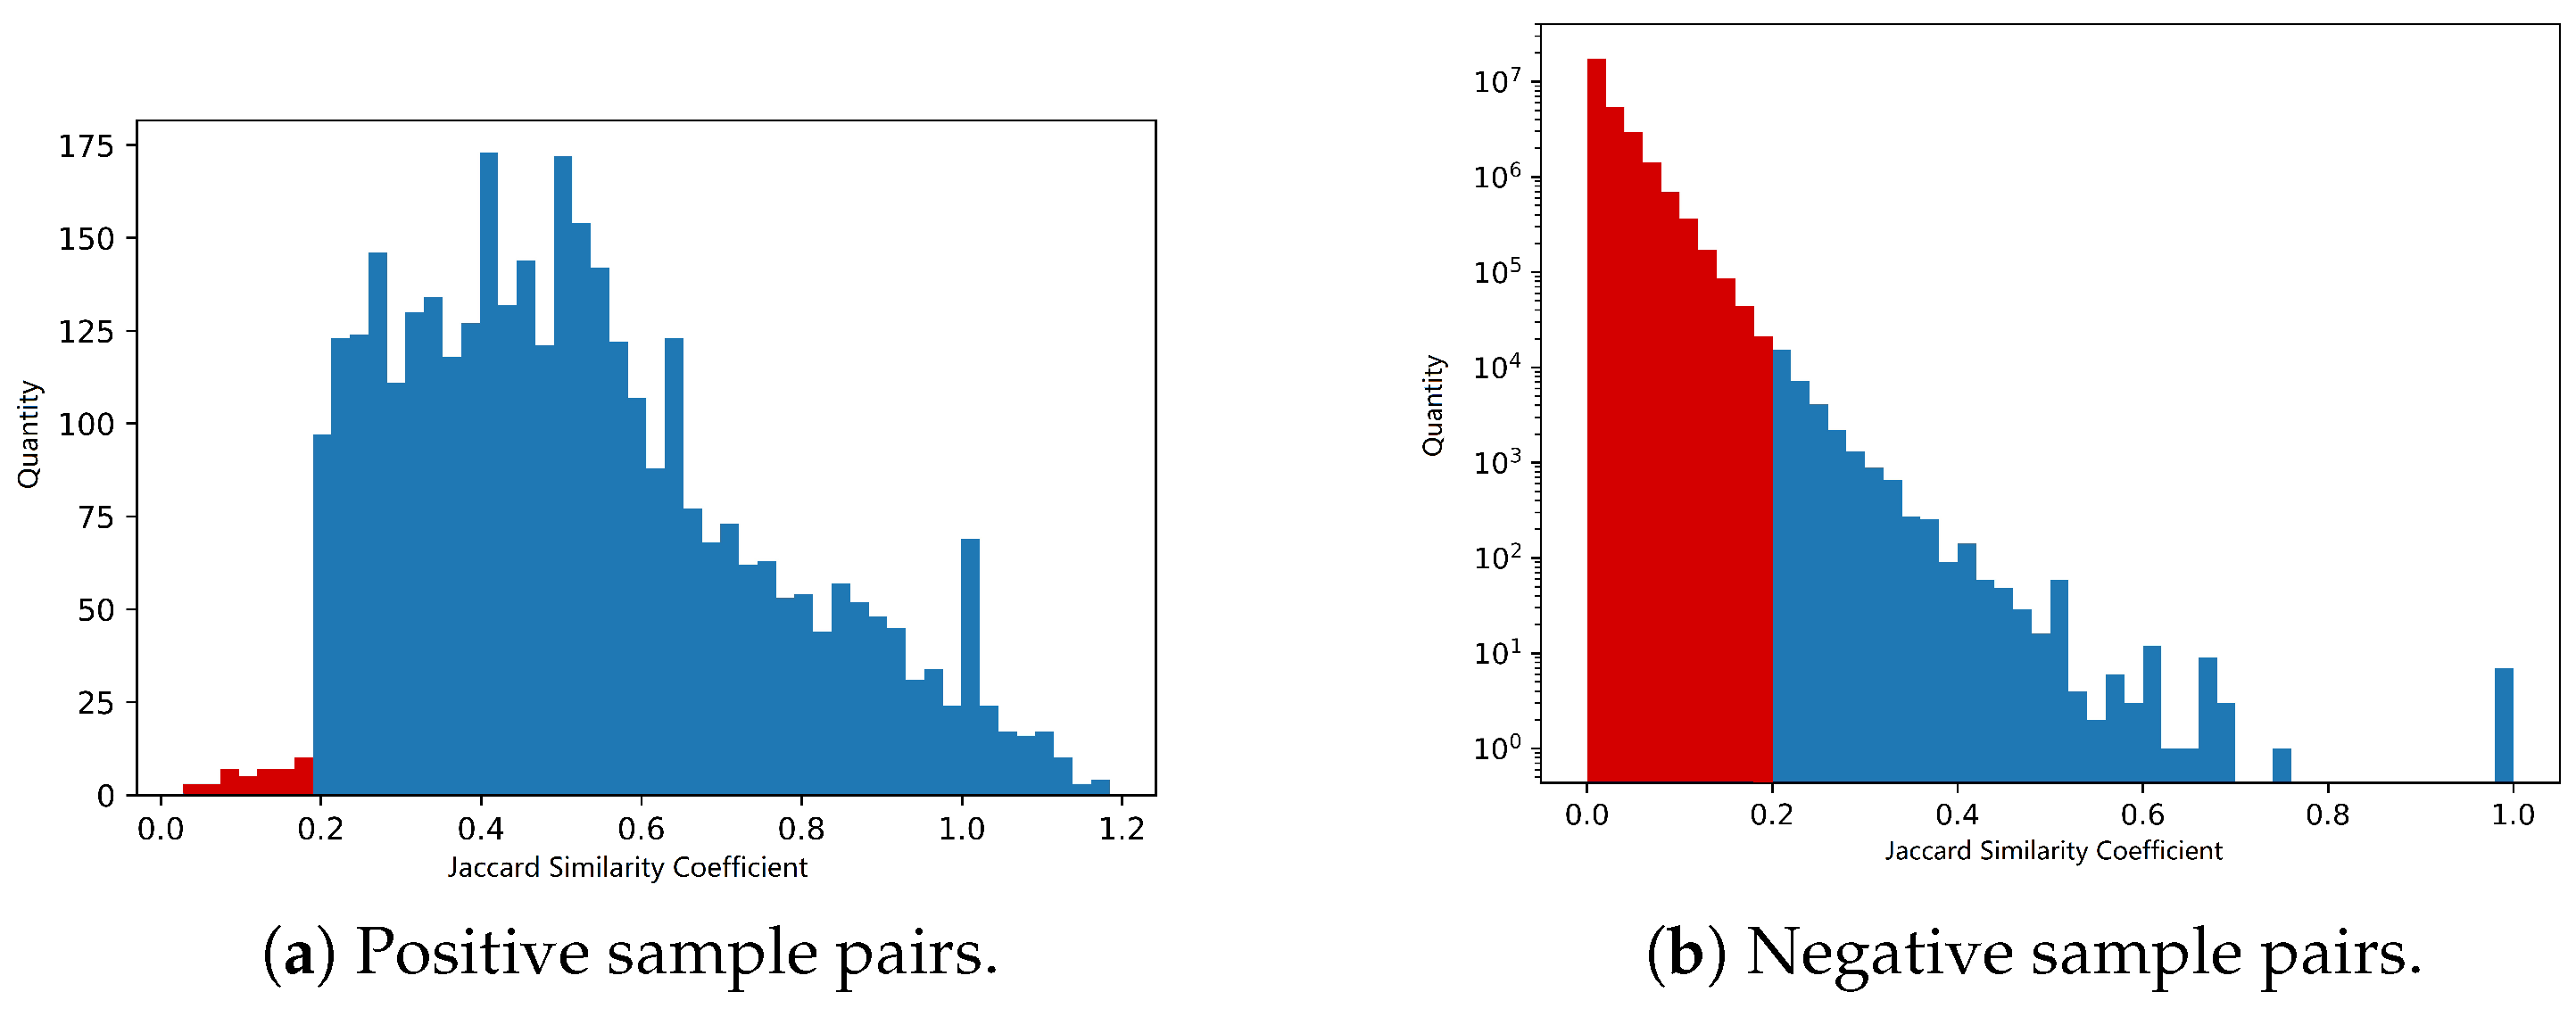
3.3.1. Data Labeling

We took all the accounts two by two as a sample, where the group whose accounts were of the same supplier was a positive sample, otherwise it was a negative sample. We considered the same username in different markets to be the same supplier and based the initial labeling on that. There were an enormous number of sample pairs ( n × ( n 1 ) 2  pairs for n vendor accounts). It was clear that there was a very serious class imbalance in the labeling of these positive and negative samples, reaching a ratio of nearly 1:8169. We assumed that multiple accounts controlled by the same vendor were more inclined to use more of the same words to describe goods and used this as a basis to filter out sample pairs. As shown in Figure 2, we calculated the Jaccard similarity coefficient for all good titles of each sample pair. We found that 98.46% of positive sample pairs had a similarity coefficient greater than 0.2, while 99.90% of negative sample pairs had a similarity coefficient less than 0.2. Therefore, we used 0.2 as a threshold to filter out sample pairs with a similarity coefficient less than 0.2 and did not include them in subsequent experiments.
Additionally, we use a pseudo-labeling algorithm [22] to improve data accuracy. The concept of pseudo-labeling originates from semi-supervised learning. Its primary method entails training a model using samples with known labels, subsequently applying this model to unlabeled samples. The predicted labels can then be regarded as the true labels for these samples and are integrated into the labeled sample set for iterative training.
In the experiment, the username was used as the initial labeling criterion. Accounts with the same username were regarded as positive samples before the model was trained, and the rest were regarded as negative samples. Then, the samples were divided into training and testing sets. Model training was performed using the methods described in Section 3.3.2. After the model was trained, it was used for label prediction on the testing set. The predicted labels were compared with the initial labels, and the samples with inconsistent results were manually labeled. Based on the collected information about goods and other information, it was artificially determined whether two accounts belonged to the same vendor. Finally, the manually labeled results were considered the correct labels. In the next round of training, the samples were redivided into training and testing sets randomly, and the above steps were repeated N times to increase the confidence of the labels. Compared to the original pseudo-label learning, we incorporated human labeling for samples with inconsistent prediction results and labels to improve the accuracy of pseudo-labels. Typically, the number of samples requiring human labeling per training round was less than  10 2 . The above steps were represented in pseudocode form, as shown in Algorithm 1. The final number of samples is shown in Table 2, and the ratio of positive to negative samples was approximately 1:8.
Algorithm 1 Pseudo-labeling algorithm.
Input:  M R n × d ▹ Vendor features, n is the number of vendors, d is the number of feature dimensions;
          P R p × 2                             ▹ Vendor sample pairs, p is the number of sample pairs;
          L R p × 1                                               ▹ Vendor sample pairs’ label;
         C                                                              ▹ Number of epochs
Output  L R p × 1                                                    ▹ New vendor sample pairs’ label;
1:
for    i = 2   to  C  do
2:
 
3:
    Shuffle P and L in the same order.
4:
     P t r a i n , L t r a i n , P t e s t , L t e s t = SplitTrainTestData ( P , L )
5:
     m o d e l = n e w m o d e l ( )
6:
     m o d e l . t r a i n ( M , P t r a i n , L t r a i n )
7:
     L p r e d = m o d e l . p r e d i c t ( M , P t e s t )
8:
     L p r e d = M a n u a l L a b e l i n g ( L t e s t , L p r e d )
9:
     L = U p d a t e L a b e l ( L , L p r e d )
10:
end for

3.3.2. Model Architecture

Assuming that the number of input samples is n and the number of output categories is m, then n and m have a relationship  2 n m < n  in general. That is to say the number of categories and the number of input samples are extremely close to each other, and it is difficult for a multicategorization model to learn the difference between a large number of categorized categories with a small number of samples. Therefore, we used a Siamese neural network to calculate the similarity between two vendors. The main idea was to select a pair of samples from the dataset as input, pass them through the same neural network structure to produce outputs, calculate the distance between the two outputs, and use contrastive loss to backpropagate and update the neural network weights.
The Siamese neural network structure we used consisted of a four-layer convolutional structure and a three-layer fully connected structure, the parameter settings of which are shown on the right side of Figure 3. The convolutional layer used ReLU as the activation function and batch normalization [23] to solve the problems of vanishing gradient and slow convergence of the model, and a pooling structure was added every two convolutional layers to alleviate the overfitting problem. For each vendor account, the extracted feature dimension was 784, which was reconstructed into a 28 × 28 × 1 image, i.e., a grayscale map with 28 × 28 pixels and 1 channel, and each time, a pair of vendor account’s feature grayscale maps was selected as input to train the model.
The computation process of Siamese neural networks is shown on the left side of Figure 3, where two neural networks share the same parameters. For each pair of dark web vendor samples, their features were input into the Siamese neural network, and the pairwise distance between the two outputs was calculated, followed by the use of contrastive loss for backpropagation.
The contrastive loss calculation is shown in Equation (1), where  d i  represents the distance between the ith pair of samples,  y i  represents the label of the ith pair of samples, indicating whether they are similar or dissimilar, and  m a r g i n  is a hyperparameter that determines how far apart dissimilar samples should be pulled. When the two samples are similar, i.e.,  y = 1 , the second term of the contrastive loss becomes 0, and only the first term  y i d i 2  is computed, where a larger distance between the two samples leads to a larger loss. When the two samples are dissimilar, i.e.,  y = 0 , the first term becomes 0, and only the second term is computed, where a smaller distance between the two samples leads to a smaller loss. The main idea of the contrastive loss is to encourage similar samples to be close together and dissimilar samples to be far apart.
L = 1 2 N i = 1 N y i d i 2 + ( 1 y i ) max ( margin d i , 0 ) 2

4. Evaluation

We constructed a model as shown in Figure 3 and designed the following experiment to validate the effectiveness of the model.
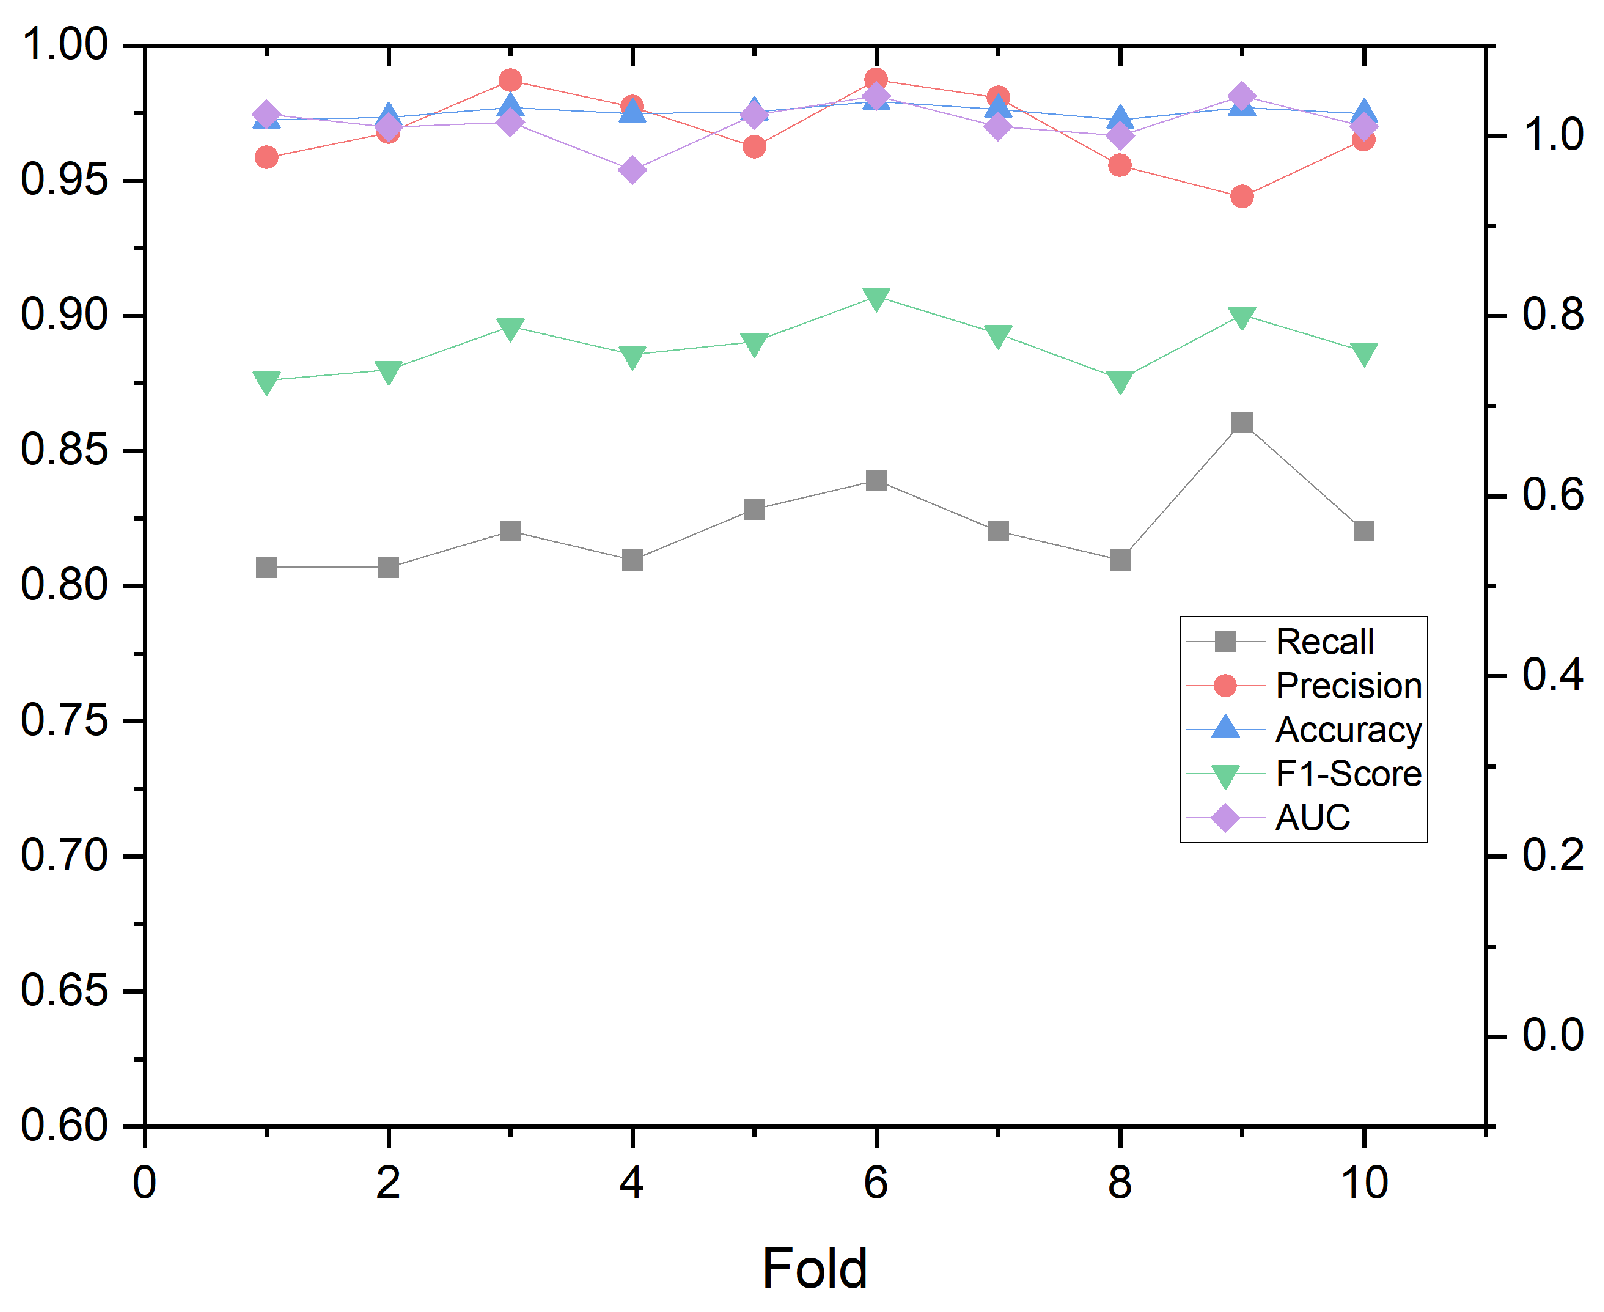
  • We employed a tenfold cross-validation to more comprehensively evaluate the model’s performance and reduce errors caused by sample set partitioning. In other words, the sample set was divided into ten parts, and ten models were trained with a training-to-test ratio of 9:1 to obtain ten evaluation results.
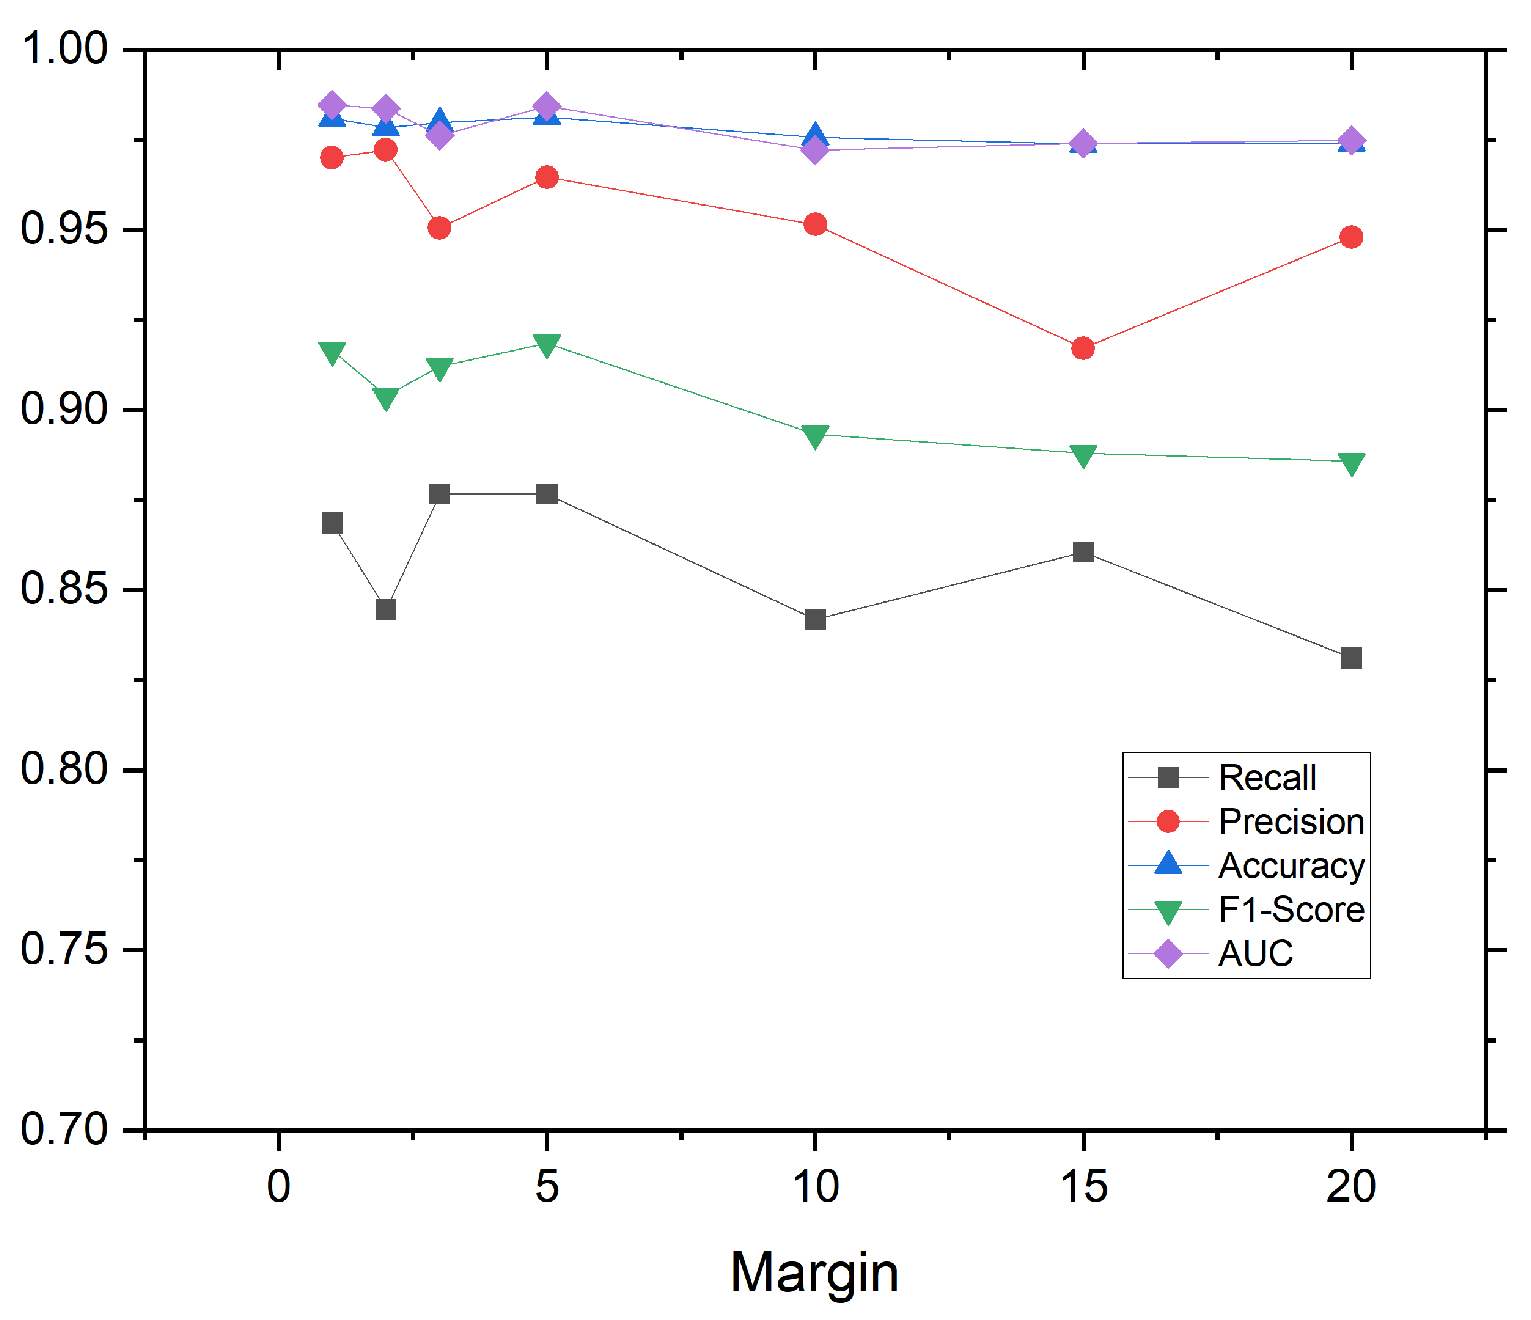
  • The parameter  m a r g i n  in Equation (1) determined how far the negative sample pairs were pulled apart from each other, and different  m a r g i n  were chosen to verify their effect on the model’s effectiveness.
  • Kumar et al. [17] proposed the eDarkFind model for identifying multiple identities of darknet vendors. The specific method involved using cosine similarity to determine whether two vendor accounts were controlled by the same real vendor. Our experiment compared the performance of our method with the eDarkFind model on the dataset collected in this study.

4.1. Tenfold Cross-Validation Result

The validation results obtained by using a 10-fold cross-validation with a 9:1 sample split ratio are shown in Figure 4. The average values obtained from the 10-fold cross-validation is shown in Table 3. The evaluation metrics used included accuracy, precision, recall, F1-score, and AUC. It can be seen that the AUC values of the ten models were all around 0.97, the accuracy values were all above 0.97, the precision values could reach up to 0.987, and the recall values were usually above 0.8 and could reach up to 0.86. Additionally, the F1-score values were around 0.9, indicating that the proposed Siamese neural network-based model had good performance. The average values obtained from the 10-fold cross-validation were as follows.

4.2. Impact of  m a r g i n

We set the range of values of  m a r g i n  to 1, 2, 3, 5, 10, 15, 20, and for each value of  m a r g i n , a model was built, and the model was trained using the same training set and tests; the results obtained are shown in Figure 5.
As can be seen in the figure, the performance of the model on the test set decreased after the value of  m a r g i n  exceeded five. A larger  m a r g i n  caused the model to overfit on the training set and therefore, the performance on the test set instead decreased. A more appropriate value for the parameter  m a r g i n  was five. Compared to the case where  m a r g i n  took a value of one, when  m a r g i n  = 5, the model had a better accuracy rate.

4.3. Compare with eDarkFind Model

Kumar et al. [17] proposed eDarkFind, an unsupervised algorithm for identifying multiple identities of darknet vendors, which also compared vendor accounts pairwise and used the cosine similarity of extracted features to determine whether two accounts were controlled by the same real vendor. However, they only used data related to drugs and medication from three darknet marketplaces (Dream Market, Wall Street, and Tochka), while the dataset used in this study covered all products from 21 darknet marketplaces.
We applied eDarkFind to the dataset we collected in this study, extracted the features provided by eDarkFind, and calculated the cosine similarity of vendor features. The evaluation metrics are compared in Table 4. It can be seen that the method based on Siamese neural networks had better performance than directly using cosine similarity to judge the identity of dark web vendors. The poorer performance of the eDarkFind model is due to the following reasons:
  • It only focuses on vendors selling drugs and only uses data from three markets, so it performs well on the original dataset;
  • It relies entirely on feature calculation, and once the number of vendors increases, the distinguishability of the features may not be clear.

5. Case Study

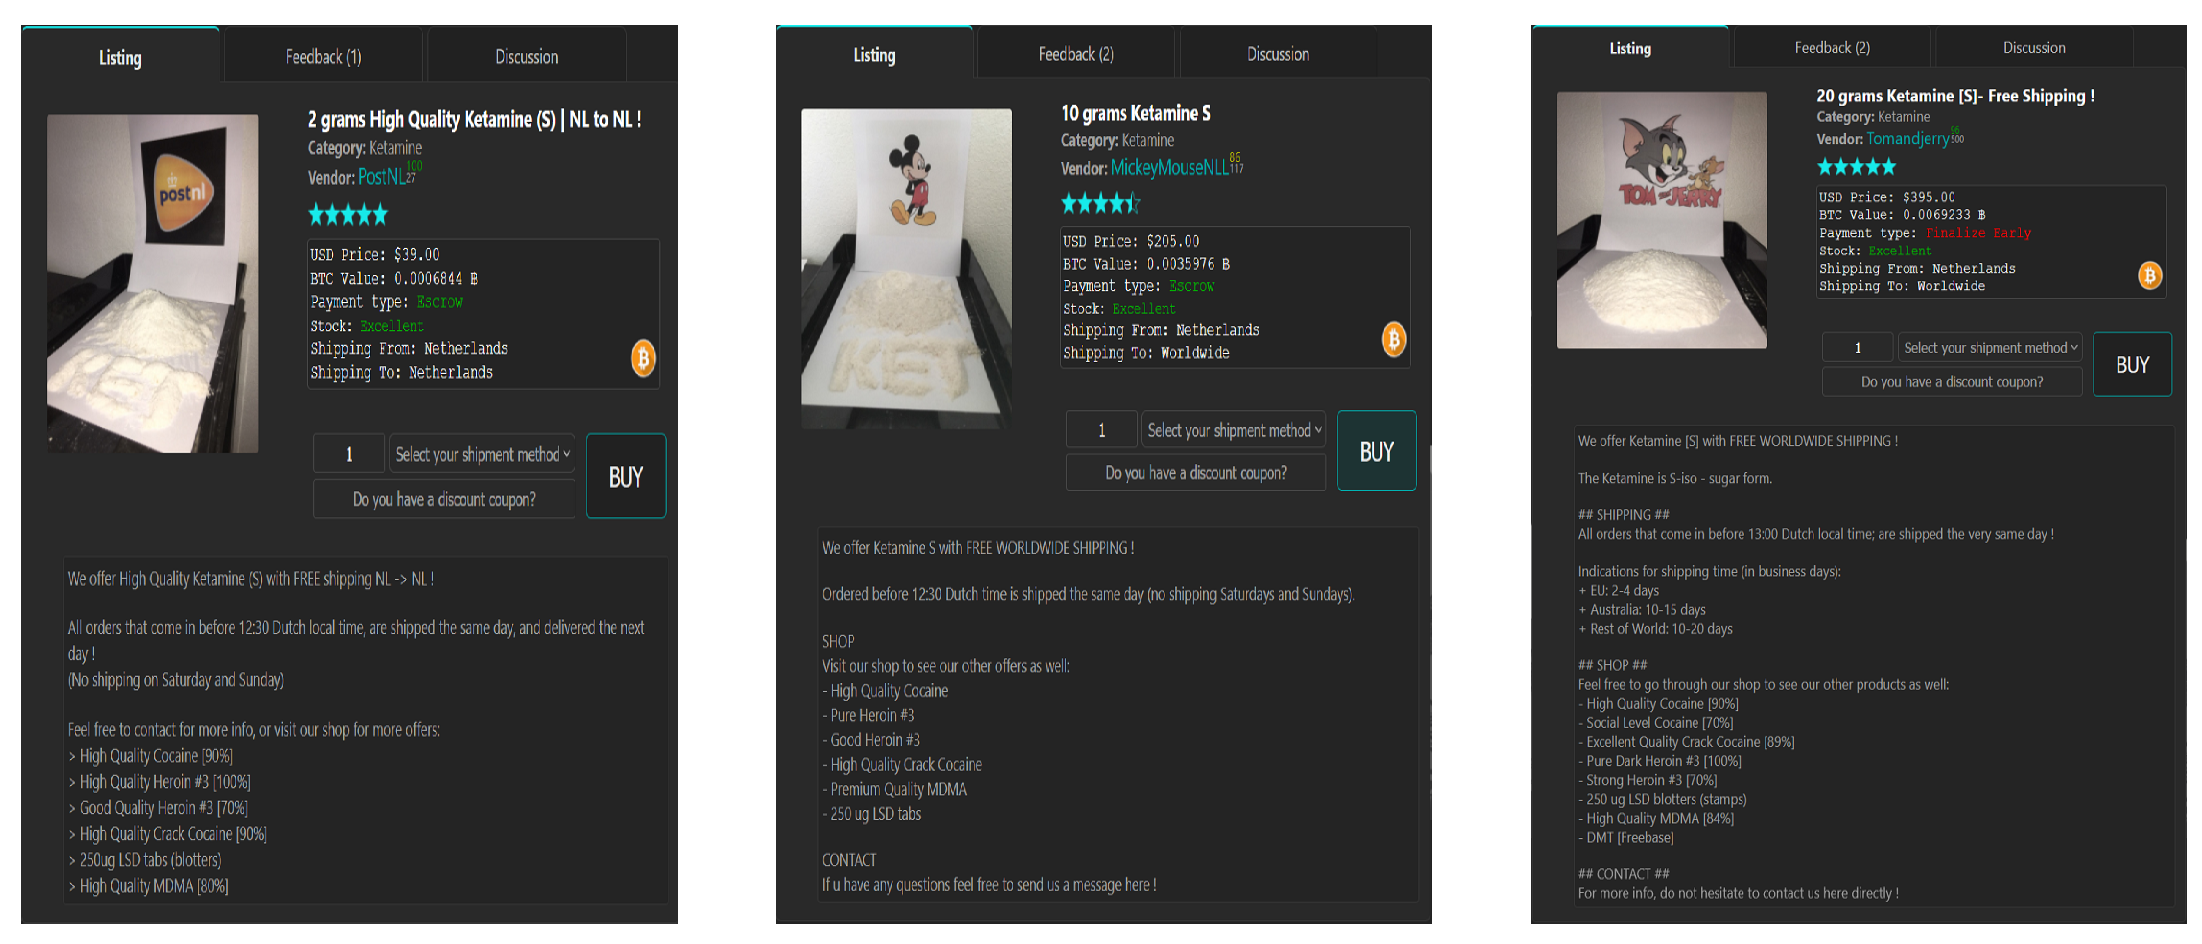
5.1. Drug Trafficking Group

In the dataset collected in this study, using the metric learning-based dark web vendor identification model combined with pseudo-labeling algorithm [22] and manual judgment (see Section 4.3), many drug trafficking groups were identified. Among them, the largest drug trafficking group created vendor accounts on 12 of the 21 English dark web marketplaces, using three different usernames and creating a total of 30 vendor accounts, as shown in Table 5.
We determined that these three accounts were controlled by the same real vendor based on the following characteristics.
These three accounts all set the shipping location of the drugs they sold to the Netherlands, and they all sold heroin, ketamine, cocaine, and ecstasy, indicating a high level of similarity in terms of categories and shipping locations.
We extracted the ketamine products posted by the three accounts on Vice City, as shown in Figure 6. From the product images, we observed that they all placed the ketamine on a piece of white paper, which was placed on a black table. They also printed their respective account icons on the white paper and stood them upright on the table. Moreover, in the product images posted by the PostNL and MickeymouseNLL accounts, the ketamine was arranged in the shape of the letters “KET”.
We compared the descriptions of the three products and found that they all included the delivery time and encouraged customers to contact them.

5.2. Same Username for Different Vendors

Similarly, we also identified examples of accounts using the same username across different markets but actually controlled by different real vendors. Figure 7 shows two accounts with the same username selling all products on the Dark0de and Darkfox markets, respectively. Based on the following differences in their product listings, we considered them to be controlled by different real vendors: (1) They used different photos with different backgrounds for their products. For example, the Dark0de market’s product list included photos with a blue background, while the Darkfox market’s product list only included photos with black and white backgrounds. (2) They sold different types of products. For example, the Dark0de market’s product list included THC capsules, while the Darkfox market’s product list included Xanax, neither of which appeared on the other’s product list. (3) Even for products of the same type, their descriptions were very different. For example, the description for synthetic cannabis was different, and they used different capitalization styles in their titles, with one account using all lowercase and the other using all uppercase letters.

6. Conclusions

In this paper, we collected product data from 21 existing English-language dark web markets, including vendor names, product titles and descriptions, images, shipping locations, and categories. We extracted features from product data, including text and image features. Pseudo-labeling was used to improve the accuracy of positive and negative sample labeling. We used a Siamese neural network with metric learning to learn the similarity between vendors and achieve the recognition of vendors’ multiple identities. We evaluated its effectiveness through a tenfold cross-validation and various evaluation metrics, achieving an average F1-score of 0.889 and an accuracy of 96.86%. It demonstrates the effectiveness of metric learning in the multi-identity problem, which consists of an extremely large number of categories and a small number of samples under each category. This method can be used to identify multiple accounts on different markets that are manipulated by the same vendor, providing leads to locate criminals trading on dark web markets.

Author Contributions

Conceptualization, Y.W. and F.Z.; methodology, Y.W.; software, W.X. and Y.H.; validation, W.X.; writing—original draft preparation, Y.W.; writing—review and editing, Y.H. and F.Z.; supervision, F.Z. All authors have read and agreed to the published version of the manuscript.

Funding

This research was funded by the State Grid Science and Technology Program (5700-202319297A-1-1-ZN). The funders Xin Sun and Jiajia Han had the following involvement with the study: background research and data collection.

Data Availability Statement

The data presented in this study are available on request from the corresponding author.

Conflicts of Interest

Author Yilei Wang was employed by State Grid Zhejiang Electric Power Co. Ltd. Research Institute. The remaining authors declare that the research was conducted in the absence of any commercial or financial relationships that could be construed as a potential conflict of interest.

References

  1. Chaum, D.L. Untraceable electronic mail, return addresses, and digital pseudonyms. Commun. ACM 1981, 24, 84–90. [Google Scholar] [CrossRef]
  2. Reed, M.G.; Syverson, P.F.; Goldschlag, D.M. Anonymous connections and onion routing. IEEE J. Sel. Areas Commun. 1998, 16, 482–494. [Google Scholar] [CrossRef]
  3. Astolfi, F.; Kroese, J.; Van Oorschot, J. I2p—The Invisible Internet Project; Leiden University Web Technology Report; Leiden University: Leiden, The Netherlands, 2015. [Google Scholar]
  4. Clarke, I.; Sandberg, O.; Wiley, B.; Hong, T.W. Freenet: A distributed anonymous information storage and retrieval system. In Proceedings of the Designing Privacy Enhancing Technologies, Berkeley, CA, USA, 25–26 July 2000; Springer: Berlin/Heidelberg, Germany, 2001; pp. 46–66. [Google Scholar]
  5. The 2021 Crypto Crime Report; Chainalysis: New York, NY, USA, 2021; pp. 44–45.
  6. Georgoulias, D.; Pedersen, J.M.; Falch, M.; Vasilomanolakis, E. Botnet business models, takedown attempts, and the darkweb market: A survey. ACM Comput. Surv. 2023, 55, 1–39. [Google Scholar] [CrossRef]
  7. Maneriker, P.; He, Y.; Parthasarathy, S. SYSML: StYlometry with Structure and Multitask Learning: Implications for Darknet Forum Migrant Analysis. In Proceedings of the Empirical Methods in Natural Language Processing, Online, 7–11 November 2021. [Google Scholar]
  8. Waldner, O. Illuminating Dark Paths: Identifying Patterns of Darknet Drug Vendor Migration. Independent Thesis, Malmö University, Malmö, Sweden, 2022. [Google Scholar]
  9. Branwen, G.; Christin, N.; Décary-Hétu, D.; Andersen, R.M.; StExo; Presidente, E.; Anonymous; Lau, D.; Sohhlz, D.K.; Cakic, V.; et al. Dark Net Market Archives, 2011–2015. 2015. Available online: https://www.gwern.net/DNM-archives (accessed on 5 December 2022).
  10. Suman, C.; Raj, A.; Saha, S.; Bhattacharyya, P. Authorship attribution of microtext using capsule networks. IEEE Trans. Comput. Soc. Syst. 2021, 9, 1038–1047. [Google Scholar] [CrossRef]
  11. Zhang, R.; Hu, Z.; Guo, H.; Mao, Y. Syntax encoding with application in authorship attribution. In Proceedings of the 2018 Conference on Empirical Methods in Natural Language Processing, Brussels, Belgium, 31 October–4 November 2018; pp. 2742–2753. [Google Scholar]
  12. Fabien, M.; Villatoro-Tello, E.; Motlicek, P.; Parida, S. BertAA: BERT fine-tuning for Authorship Attribution. In Proceedings of the 17th International Conference on Natural Language Processing (ICON), Online, 18–21 December 2020; pp. 127–137. [Google Scholar]
  13. Devlin, J.; Chang, M.W.; Lee, K.; Toutanova, K. Bert: Pre-training of deep bidirectional transformers for language understanding. arXiv 2018, arXiv:1810.04805. [Google Scholar]
  14. Wang, X.; Iwaihara, M. Integrating RoBERTa Fine-Tuning and User Writing Styles for Authorship Attribution of Short Texts. In Proceedings of the Web and Big Data: 5th International Joint Conference, APWeb-WAIM 2021, Guangzhou, China, 23–25 August 2021; Part I 5. Springer: Cham, Switzerland, 2021; pp. 413–421. [Google Scholar]
  15. Hung, C.Y.; Hu, Z.; Hu, Y.; Lee, R. Who Wrote it and Why? Prompting Large-Language Models for Authorship Verification. In Proceedings of the Findings of the Association for Computational Linguistics: EMNLP 2023, Singapore, 6–10 December 2023; pp. 14078–14084. [Google Scholar]
  16. Tai, X.H.; Soska, K.; Christin, N. Adversarial matching of dark net market vendor accounts. In Proceedings of the 25th ACM SIGKDD International Conference on Knowledge Discovery & Data Mining, Anchorage, AK, USA, 4–8 August 2019; pp. 1871–1880. [Google Scholar]
  17. Kumar, R.; Yadav, S.; Daniulaityte, R.; Lamy, F.; Thirunarayan, K.; Lokala, U.; Sheth, A. edarkfind: Unsupervised multi-view learning for sybil account detection. In Proceedings of the Web Conference 2020, Taipei, Taiwan, 20–24 April 2020; pp. 1955–1965. [Google Scholar]
  18. Me, G.; Pesticcio, L.; Spagnoletti, P. Discovering hidden relations between tor marketplaces users. In Proceedings of the 2017 IEEE 15th International Conference on Dependable, Autonomic and Secure Computing, 15th Intl Conf on Pervasive Intelligence and Computing, 3rd Intl Conf on Big Data Intelligence and Computing and Cyber Science and Technology Congress (DASC/PiCom/DataCom/CyberSciTech), Orlando, FL, USA, 6–10 November 2017; IEEE: Piscataway, NJ, USA, 2017; pp. 494–501. [Google Scholar]
  19. Wang, X.; Peng, P.; Wang, C.; Wang, G. You are your photographs: Detecting multiple identities of vendors in the darknet marketplaces. In Proceedings of the 2018 on Asia Conference on Computer and Communications Security, Incheon, Republic of Korea, 4 June 2018; pp. 431–442. [Google Scholar]
  20. Le, Q.; Mikolov, T. Distributed representations of sentences and documents. In Proceedings of the 31st International Conference on Machine Learning, Beijing, China, 21–26 June 2014; Volume 32, pp. 1188–1196. [Google Scholar]
  21. Covington, M.A.; McFall, J.D. Cutting the Gordian Knot: The Moving-Average Type–Token Ratio (MATTR). J. Quant. Linguist. 2010, 17, 94–100. [Google Scholar] [CrossRef]
  22. Lee, D.H. Pseudo-label: The simple and efficient semi-supervised learning method for deep neural networks. In Proceedings of the Workshop on Challenges in Representation Learning, ICML 2013, Atlanta, GA, USA, 16–21 June 2013; Volume 3, p. 896. [Google Scholar]
  23. Veličković, P.; Cucurull, G.; Casanova, A.; Romero, A.; Lio, P.; Bengio, Y. Graph attention networks. arXiv 2017, arXiv:1710.10903. [Google Scholar]
Figure 1. The overall architecture.
Applsci 14 01619 g001
Figure 2. Histogram of Jaccard similarity coefficient distribution for positive and negative sample pairs.
Applsci 14 01619 g002
Figure 3. Computing process and structure of the Siamese neural network.
Applsci 14 01619 g003
Figure 4. Tenfold cross-validation results.
Applsci 14 01619 g004
Figure 5. The influence of parameter  m a r g i n  on the model.
Applsci 14 01619 g005
Figure 6. Examples of drug trafficking group’s products.
Applsci 14 01619 g006
Figure 7. Example of the same username for different vendors.
Applsci 14 01619 g007
Table 1. Writing- style features.
Feature DimensionFeature NameNumber of Features
Lexical featuresCharacter count1
Number and frequency of digits/whitespaces/special characters6
Number of letters/number and frequency of uppercase letters4
Number of words1
Average word length1
Lexical richness6
Proportion of lowercase/uppercase letters52
Number and frequency of punctuation marks2
Grammatical featuresNumber and frequency of function words2
Structural featuresNumber of paragraphs1
Average paragraph indent1
Separator between paragraphs1
Average number of words/sentences/characters per paragraph3
Total 81
Table 2. Number of Positive and Negative Sample Pairs.
Positive Sample PairsNegative Sample Pairs
Quantity372826,827
Table 3. The average values obtained from the 10-fold cross-validation.
PrecisionRecallAccuracyF1-ScoreAUC
96.868%82.252%97.535%0.8890.971
Table 4. Comparison with the eDarkFind model.
AccuracyPrecisionRecallAUC
eDarkFind76.789%43.94%44.53%0.768
Siamese neural network97.535%96.877%82.25%0.971
Table 5. Drug trafficking group.
MickeymouseNLPostNLTomandjerry
Apollon
Tor2door
Darkfox
Monopoly
Cartel
Versus
Cypher
Dark0de
Vice City
Agartha
Incognito
TomAndJerry
Disclaimer/Publisher’s Note: The statements, opinions and data contained in all publications are solely those of the individual author(s) and contributor(s) and not of MDPI and/or the editor(s). MDPI and/or the editor(s) disclaim responsibility for any injury to people or property resulting from any ideas, methods, instructions or products referred to in the content.

