1. Introduction
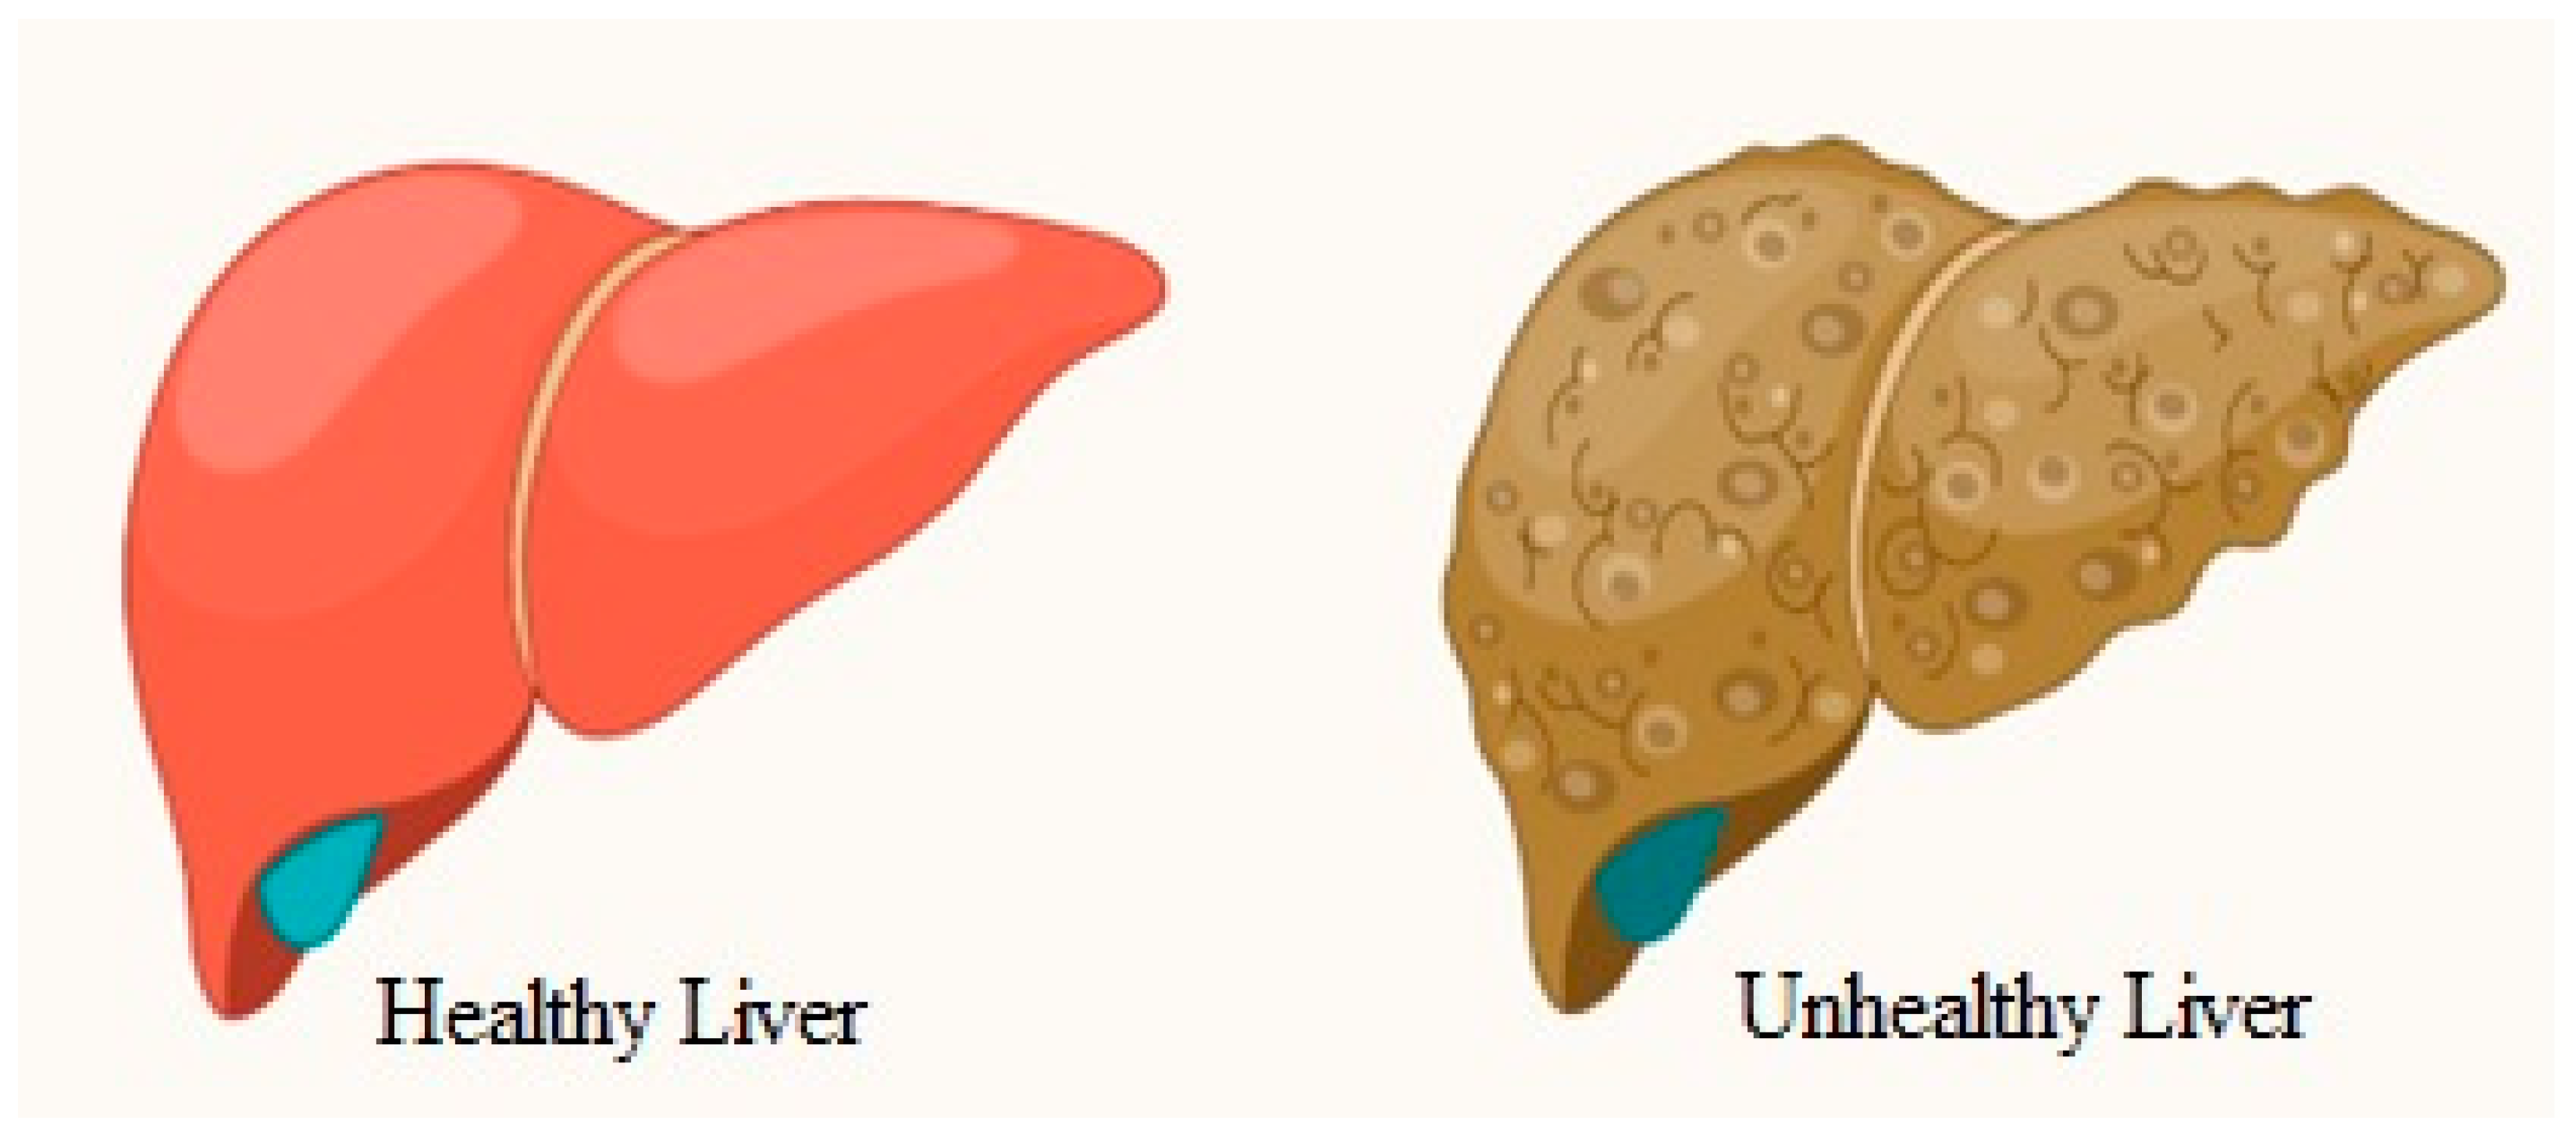
The liver ailment is a canopy term for a number of conditions that can damage the liver, one of the body’s most vital organs. Some of these include “hepatitis, cirrhosis, and cancer”. These illnesses have a significant effect on the healthcare system and place a heavy burden on the lives of millions of individuals as shown in
Figure 1. Early diagnosis is very important to ensure that patients be given the most effective and possible treatment [
1].
The liver is a vital organ for many metabolic processes, such as the production of bile and protein synthesis. There are other types of liver diseases, such as non-alcoholic fatty liver disease (NAFLD), alcoholic liver disease, hemochromatosis, autoimmune liver diseases, etc. These conditions can lead to significant morbidity and mortality [
2]. The increasing number of liver diseases has been identified due to a range of environmental, genetic, and lifestyle factors. One factor contributing to this issue is the rising prevalence of individuals engaging in excessive alcohol consumption and adopting bad dietary habits. The interaction of environmental, genetic, and lifestyle factors worsens these disorders. In addition to posing a direct danger to individuals’ health, liver diseases may also have significant economic consequences. The financial and therapeutic costs associated with these diseases are significant, ultimately straining the healthcare system and burdening families and individuals. Furthermore, there are additional effects, such as reduced efficiency, increased disability, and reduced quality of living, which may have significant effects on both society and the individuals involved [
3,
4].
Developing effective methods for diagnosing, preventing, and treating liver diseases is necessary since they are crucial elements of an integrated approach [
5] for managing liver disease problems. Modifications to an individual’s lifestyle, together with public health measures such as hepatitis B and C vaccinations, may help decrease the intensity and occurrence rate of the disease [
6].
Liver diseases have become a serious global health issue due to their increasing frequency as well as the severity of their symptoms. The objective of this examination is to provide a comprehensive analysis of the impact caused by these ailments by summarizing the research conducted by scholars in the work [
7]. By learning more about the numerous risk factors and epidemiology of liver disorders, as mentioned by the researchers [
8], there is scope to develop effective therapies that will aid in reducing the impact of these illnesses and improving the quality of life for those who suffer from them.
In most cases, a combination of imaging and histology tests may confirm a diagnosis of liver disease. This approach is widely used. However, it seems that these procedures are both time-consuming and ineffective. This is why new approaches are so important; they will improve the precision of these procedures, which in turn will aid in prognosis prediction for patients.
ML and DL has gained immense popularity in the field of healthcare [
9]. These methods rely on artificial neural networks, which are specifically designed to learn from large datasets. DL, in particular, is highly beneficial for complex tasks such as predicting time series and analyzing images. In the context of liver infection diagnosis and prognosis, DL can be used to improve accuracy by identifying intricate patterns within the data [
10]. This research aims to investigate the application of DL techniques in diagnosing and predicting liver infections.
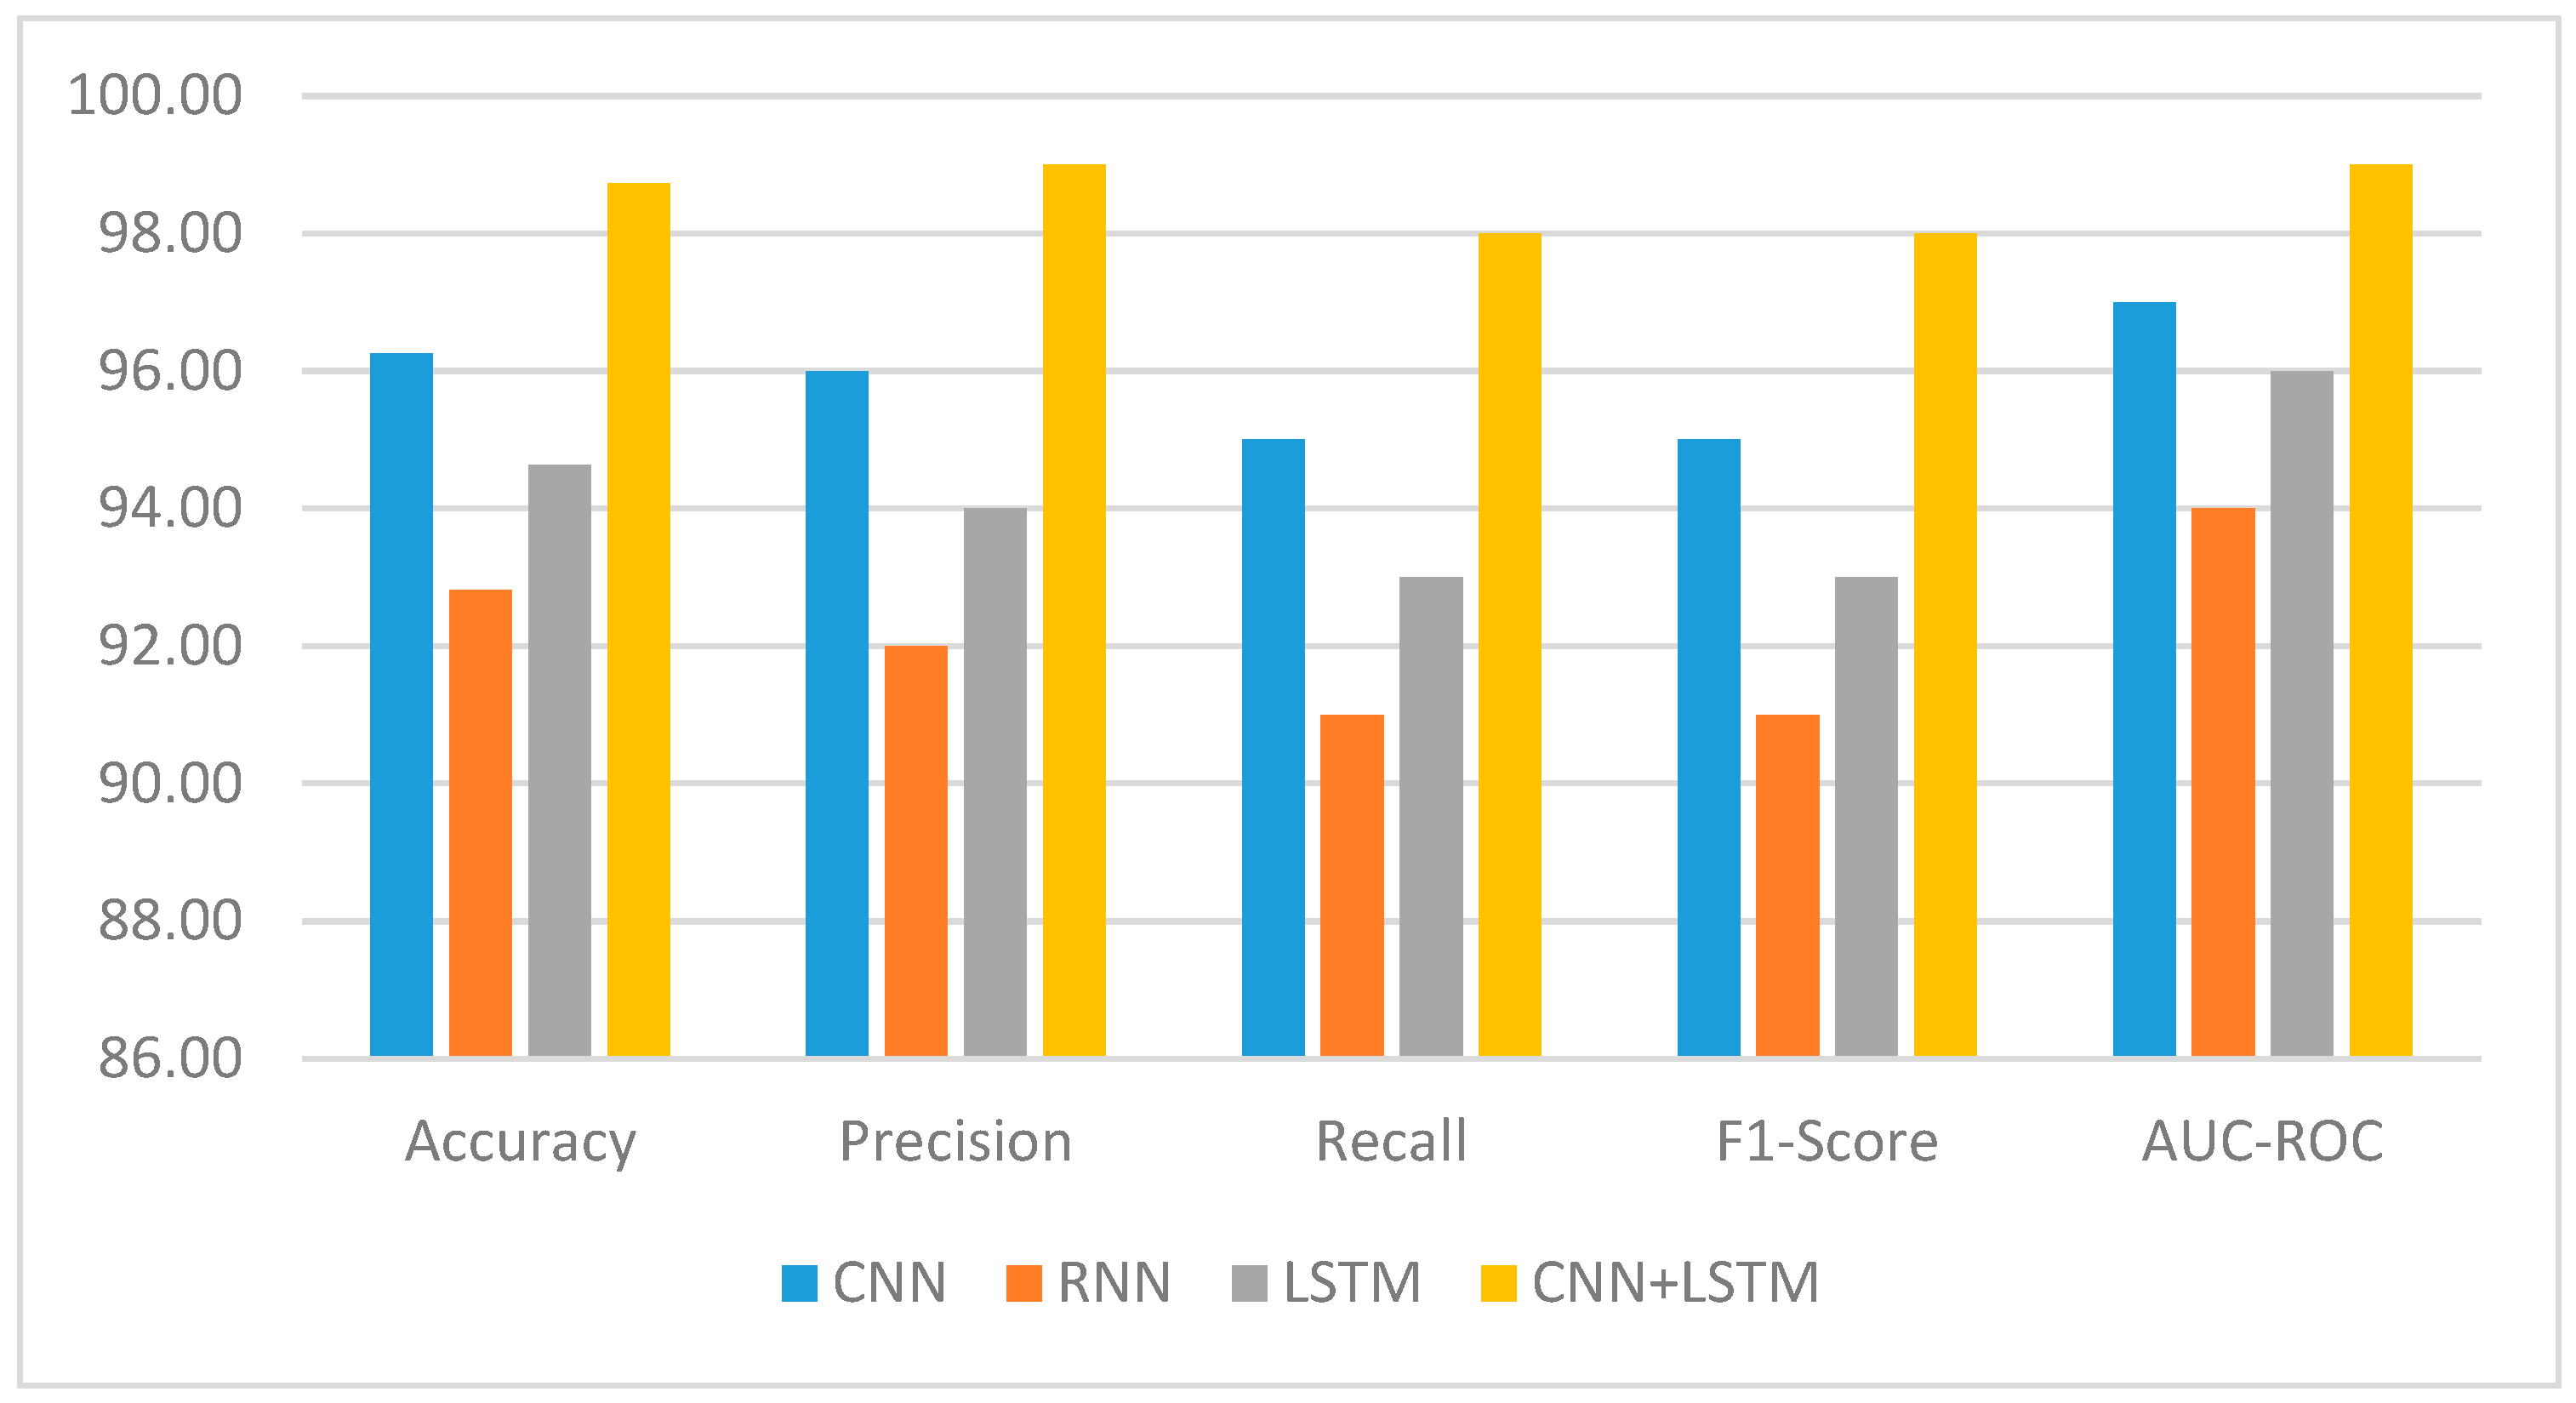
In order to achieve a better result, we provide CNN+LSTM, a novel deep learning model that combines CNN and LSTM networks. Data in sequential and image types are handled by these two networks. The goal of the CNN+LSTM model is to enhance the accuracy and predictive capability of liver disease analysis by capturing temporal and spatial dependencies in the data. The evaluation for the CNN+LSTM model will be performed on a well-defined set of liver disease cases. It will be evaluated by applying several metrics, such as accuracy, precision and recall, AUC and ROC, and F1_score. AUC and ROC are widely used as evaluation metrics in ML, especially for tasks related to binary classification. Not only that, but they could additionally be expanded to incorporate multi-class classification issues. The results after evaluation will be used to determine the model’s effectiveness in predicting the prognosis of patients and subtyping liver disease.
This study’s results may have profound implications for the future of liver disease treatment. If the model proves to be useful, the process of diagnosis will improve both its efficiency and accuracy. A precise prediction of a patient’s future course of disease is essential for clinicians to develop customized treatment plans and improve patient outcomes. This study utilizes the advanced capabilities of DL to improve the field of liver disease diagnosis, prognosis, and treatment, resulting in benefits for patients, society, and healthcare professionals.
2. Related Work
The domain of liver disease research is widespread. Numerous kinds of studies are carried out globally to enhance awareness of the disease and improve the treatment of patients. The field of liver disease identification and diagnosis has seen significant advancements with the use of ML and DL techniques. Over the years, researchers have explored the application of these techniques to increase the accuracy and efficiency of liver infection diagnosis. In this literature review, our aim is to provide a complete overview of recent studies and advancements in liver disease detection using ML and DL approaches. By examining many research papers, we explore various methodologies, draw attention to vital findings, and identify potential areas where the use of hybrid techniques might enhance disease detection. One area of ongoing research is the development of non-invasive diagnostic methods for liver diseases. Traditional diagnostic procedures, such as liver biopsies, can be invasive, time-consuming, and can carry certain risks [
1,
4]. However, emerging technologies, such as imaging modalities and blood biomarkers, are being studied as potential non-invasive alternatives. These methods aim to provide accurate assessments of liver health, fibrosis staging, and disease progression without the need for invasive procedures.
The main objective of using deep learning techniques here is to classify and determine the level of seriousness of liver fibrosis. A deep learning model is created to visually illustrate the analytical decisions made by the algorithm. The article likely contains comprehensive information on the building blocks of the deep learning model, the dataset used for training and testing, and the obtained performance metrics. The possible results of this study [
11] should help us learn more about how effective visual explanations are at helping people understand the diagnostic decisions made by the DL model and how accurate the model is at grading liver fibrosis. The authors want to investigate the use of machine learning algorithms for the automated detection of liver illness, with a special emphasis on a model that does not include a voting mechanism. The authors propose a methodology that employs abstention techniques, permitting the model to abstain from giving a diagnosis when there is doubt about the underlying problem. The study will provide a detailed account of the approach used, including the particular machine learning algorithms and methods adopted for the identification of liver disease.
An automatic system for the segmentation of the liver and tumor was developed by Manjunath et al. [
12] using a DL approach. They probably trained a DL model on CT scans so that it could robotically segment the liver and tumor areas. The accuracy of the segmentation results could be evaluated using performance assessment metrics such as dice similarity coefficient (DSC) or the Jaccard index (JI), which was described in the paper along with the architecture of the DL model, the dataset used for training and evaluation, and the performance evaluation metrics.
Yang et al. [
13] developed a machine learning (ML) model utilizing laboratory characteristics to exclude instances of “non-alcoholic greasy liver disease” (NAGLD) among the general population. There were excellent statistics that made use of a dataset that includes clinical information along with experimentation testing results. The paper included a thorough account of the feature selection process, model training, and performance assessment. The results of the model are expected to show the ability of the model to correctly recognize and exclude people without Non-Alcoholic Fatty Liver Disease (NAFLD) by using laboratory values.
The work referenced in [
14] focuses on using machine learning methods to predict fatty liver disease. The scholars explored a range of machine learning methodologies, including random forest (RF), decision trees (DT), artificial neural networks (ANN), and support vector machines (SVM). The report included an in-depth description of the utilized dataset, including clinical and image data. Moreover, an explanation of the pre-processing and feature selection methods was provided. It was anticipated that these results would be presented with a demonstration showcasing the performance of each machine learning algorithm, encompassing pertinent evaluation metrics such as accuracy, sensitivity, specificity, and more.
In the study on the classification of liver cancer by combined CT scans and MR, researchers [
15] proposed a hybrid-feature analysis that is based on machine learning. They created a model that improves the accuracy of liver cancer classification by combining features from both types of imaging modalities. The pre-processing steps, technique for feature extraction, and machine learning algorithm that were used were all described in the paper. It was anticipated that these findings would demonstrate that the proposed model possesses superior performance when compared to using each imaging modality individually with various metrics [
16].
The work [
17] developed a method for screening for liver disease that is based on tightly coupled deep neural networks. For the purpose of screening for liver disease, the authors made use of DL techniques, more specifically, densely connected neural networks. The pre-processing steps that were utilized, the dataset that was used for training and estimation, and the architecture of the deep neural network were all described in the paper. In addition to other pertinent performance metrics, their findings included a comparison of this approach with others, as well as a discussion of the accuracy of the model in screening for liver disease.
The work [
18] investigated the use of digital testing for pathology and ML in the context of kidney, lung, and liver diseases. The authors examined previously published studies and discussed the utilization of digital pathology images as well as ML techniques in the process of diagnosing these diseases. Findings from many studies were put together in this article, along with an analysis of the effects and possible benefits of using digital pathological testing and machine learning methods in the areas of kidney, lung, and liver diseases.
The work [
19] examined both the obstacles that must be overcome and the potential benefits of using DL in the diagnosis of liver disease. They provided an overview of the DL techniques, discussed the challenges that are faced in liver disease diagnosis, such as limited data or interpretability, and investigated potential future directions in this field. This paper provided perspectives on the potential benefits and limitations of using DL to diagnose liver disease and presented insights based on the literature review.
In their study [
20] the authors focus on the first detection and diagnosis of liver cancer using dynamic network biomarkers and DL. The authors suggested a new method that integrates dynamic network biomarkers with deep learning algorithms. The article includes a description of the methods used to find dynamic network biomarkers, as well as an explanation of the architecture of the DL model. Their results include the performance of the proposed approach. This encompasses the model’s accuracy, sensitivity, specificity, and ability to identify liver cancer early.
The study investigated by authors [
21] present in-depth knowledge of the use of machine learning models in the clinical diagnosis of both primary and metastatic liver tumors. They provided a thorough analysis of the literature and a summary of the results from several studies that have used machine learning models to diagnose liver cancer. The study discusses the various machine learning techniques used, the datasets examined, and the stated diagnostic accuracy of the models.
In the works [
22,
23], a more advanced preprocessing technique was suggested for the detection of liver disease that utilizes collective machine learning techniques. They devised a preprocessing technique that enhances the execution of machine learning procedures for the detection of liver illnesses. The article discusses the preparation procedures, ensemble techniques, and the dataset used. It was expected that the proposed preprocessing strategy will work better than standard methods, as shown by measures such as accuracy, compassion, specificity, and RUP.
To develop an intelligent model using machine learning techniques to accurately forecast the first phases of liver disease, the authors of [
24,
25,
26] developed a machine learning model to accurately forecast the occurrence of early liver disease by using a diverse range of features. The article describes the feature selection technique, the machine learning algorithm used, and the dataset utilized. The findings include the system’s effectiveness in predicting early liver disease, as well as metrics such as accuracy, sensitivity, specificity, and RUP. The literature review highlights the advancements achieved in liver disease detection via the use of ML and DL approaches. Researchers have verified the efficacy of these methods in several facets of liver illness, encompassing fibrosis staging, liver cancer categorization, and the diagnosis of non-alcoholic liver disease [
27,
28,
29], among others. Nevertheless, it is crucial to acknowledge and resolve certain constraints, such as the variability of diseases and the accessibility of standardized information, to enhance the precision and applicability of these models.
An essential and challenging task during surgical procedures is the precise recognition of different types of tissues in real time. Study [
30] used hyper spectral imaging (HSI) and machine learning to perform tissue segmentation in numerous medical fields. The process consisted of two main parts. In the first phase, the data were preprocessed to address the significant complexity of the spectrum’s dimensionality and the variability of tissue spectra across patients, which are two common challenges in HSI. Principal Component Analysis (PCA) was used on the spectral domain of HSI data to eliminate anomalies, enhance the smoothness of the spectrum, standardize the data, and decrease the number of dimensions during the preprocessing phase. Gaussian filters were used at several stages of processing in the spatial domain. Subsequently, they used a refined machine learning model to partition the tissues. After a statistical evaluation of seven machine learning models employing three levels of geographical analysis, the most optimal model was chosen.
Study [
31] presented a novel deep learning methodology to precisely segment liver tumors and detect liver structures in CT imaging. The suggested method uses the LiTS17 database and has four sub layers and a fully connected layer that can differentiate between liver and liver tumors. Based on the LiTS17 dataset U-Net approach, the used method was able to obtain a higher accuracy in DC, mean, F1 score, and recall value. The proposed approach was further evaluated in a noisy setting, and the network demonstrated robustness over a diverse range of signal-to-noise ratios (SNRs). The proposed methodology has shown satisfactory and favorable results when compared to previous research.
Study [
32] presented an innovative method for precisely distinguishing liver tissue and tumors from CT scan volumes. The proposed methodology used a hybrid ResUNet strategy, integrating the ResNet and UNet architectures, to successfully address this difficulty. The study primarily used two intersecting models for liver segmentation and assessment of the region of interest. Liver segmentation was conducted to examine the liver via a volumetric abdominal CT image. The proposed model employs CT volume slices of patients diagnosed with liver tumors and was evaluated using the publicly accessible HSI dataset. The experimental investigation showed that the liver segmentation achieved a higher accuracy. The authentication rate of the dice coefficient also showed improvement, indicating effective testing and the framework’s preparedness for diagnosing liver illness.
The authors [
33] proposed a liver image segmentation approach that combines GANs with Mask R-CNN. Initially, due to the presence of noisy elements in the majority of images, the researchers explored the integration of Mask R-CNN and GANs to enhance the precision of pixel-wise classification. A further advantage of mean clustering is its ability to maintain the picture’s aspect ratio. Obtaining additional significant anchors has the potential to greatly enhance the effectiveness of segmentation. Ultimately, we developed a GAN Mask R-CNN algorithm that outperformed the previously used Mask R-CNN, Mask-CNN, and k-NN in terms of both the DC and F1 scores. This paper introduces an innovative deep learning approach for accurately segmenting liver tumors and identifying hepatic structures in computed tomography images. Based on the favorable outcomes, it is anticipated that the suggested methodology will be promptly used to aid radiologists and specialized physicians.
Study [
34] presented an innovative method for precisely distinguishing liver tissue and tumors from CT images. The proposed approach used a hybrid ResUNet model, which integrates the ResNet and UNet models, to proficiently address this difficulty. Liver segmentation was conducted to examine the liver via a volumetric abdominal CT scan. The proposed system employs computed tomography (CT) volume slices of patients who have been diagnosed with liver tumors. This model deals with CT images of liver diseases using the IRCADB01 dataset. The identification accuracy proves that it can easily be used to find out about any type of unexpected thing in the liver.
In study [
35], the researchers used a two-step method to determine the presence of liver tumors. The liver region was first partitioned using mask-RCNN, followed by the identification of tumors using MSER (maximally stable external regions). The classification was conducted via a hybrid CNN model based on DL. The purpose of this framework was to distinguish between cancerous and healthy liver tissue, while the aim of the classification method was to categorize the identified tumors into many categories. The objective of this study was to provide an impartial prediction that is free from any human fallibility. In contrast, our suggested technique achieves segmentation and classification performance that is almost equivalent to the leading method. Moreover, it offers the utmost accuracy in detecting lesions while maintaining a high percentage of accurately identifying them.
In work [
36], a multi-layer GAN was applied to improve CT image quality. A CT diagnosis may be made using the improved pictures produced to distinguish between a normal and cancerous liver. Three open-source datasets—Ircadb, Sliver07, and LiTS—were used to evaluate the suggested approach. Both quantitative and qualitative analyses were conducted based on three datasets. There was a higher quality of the medical images when the multi-level GAN was combined with AlexNet for binary classification. This is because the structural features were preserved and artefacts were reduced. The testing accuracy was evaluated using both filtered and unfiltered images. Moreover, the suggested multi-level GAN is very appropriate for computer-assisted diagnosis, as it surpasses other models on all three datasets.
In work [
9], the authors used the AIM-Unet model for an automated system using the AIM-Unet model for better results. They applied CHAOS, LIST, and 3DIRCADb datasets and achieved a DC, F1 score, and ACC with 97.86%, 96.1%, and 9.57%, respectively. This accuracy is remarkable as compared to DC and F1 score values. The researchers in their work [
16] applied a U-Net model where the LiTS17 dataset was used, and with the help of the U-Net model, the DC, F1 score, and recall values were 91.1%, 99.4%, and 91.2%, respectively. In works [
17,
19], the authors used the LiTS dataset and achieved a DC score of 94.33% and 95.13%, respectively. The scholars of [
17] enhanced the precision of CT liver segmentation. A semi-supervised adversarial learning model was trained using DAP, and they applied a semi-supervised model that uses a training dataset lacking annotations to reduce the number of medical picture annotations that are necessary. Whereas the researchers in [
19] applied CoFCNN, the two features are shared throughout the segmentation path, and two inputs are sent into CoFCNNs simultaneously. The researchers in [
20] applied DeepMedic+CNN. They used liver multi-scale segmentation utilizing DeepMedic CNN fusion of completely connected layers and achieved a DC value of 93% based on the SLIVER07 and LiTS datasets. Their use of CNN segmentation as a starting point resulted in a decrease in inter-observer variation. In work [
21], a hybrid CNN was developed for automated liver segmentation employing a 3D CNN with a hybrid loss function and achieved a DC accuracy of 82.02% using the CHAOS dataset. However, there is the possibility to train on tiny datasets, but the outcome is average. The work in [
24] used ResU-Net for the automated identification and labeling of liver functional areas using a 3D DNN with different classes. The authors used the MSDC-T8 dataset and achieved a DC accuracy of 89.2%. It was observed that there is a considerable computational cost associated with successful segmentation, and more research on different datasets is required. In work [
30], a 3D Fully Convolutional Network (FCNN) Deep Learning (DL) technique was proposed for segmenting the liver, stomach, and pancreas utilizing divided convolution units. The authors showed an early effort to use divided CNN for liver segmentation, which requires post-processing. They showed that the DC value was 92.93% using the pancreas-CT. In the work [
31] the authors used the FKFCM technique for segmenting livers and tumors. They used SLIVER07 and achieved a DC score of 86.42%, which shows that significant outcomes were achieved while using unsupervised learning. In the work [
32] the authors used U-Net architecture and MSA, where the HSI dataset was applied, and they scored F1 score and DC values of 90.8% and 81.3%, respectively. They used the U-Net model and had remarkable precision in detecting liver, duct, vein, and artery tissues. In contrast, the accuracy of logistic regression with elastic net periodicity and multi-scale spatial analysis was comparatively lower. In work [
33], the Mask R-CNN + GAN with KNN architecture was applied. The authors used the IRCADB01 dataset and gained the accuracy of recognition (ACC), recall, and F1 scores of 91.3%, 92.2%, and 92.3%, respectively. The applied Mask-R-CNN + GAN enhanced the pixels for better classification. The aspect’s image ratio was modified using k-NN in order to obtain more prominent anchors, hence improving the segmentation’s efficacy. In the work [
34] the authors applied hybrid ResNet and UNet architectures. The dataset IRCADB01 was used, and they gained ACC, DC, and F1 scores with results of 99.55%, 97.85%, and 98.16%, respectively. This model deals with CT images of liver diseases using the IRCADB01 dataset. The identification accuracy proves that it can easily be used to find out about any type of unexpected thing in the liver. In the work [
35] the scholars applied a cascaded fully convolutional neural network in the ACC, DC, and F1 scores. The accuracy of segmentations and dice coefficient values indicated the detection, and its accuracy was significantly higher compared to other researchers. The researchers [
36] applied AlexNet with multi-layer GAN for liver diagnosis. In their research experiment, they applied three publicly available datasets: Ircadb, Sliver07, and LiTS. In this regard, to achieve a better result, they adopted binary classification and achieved DC and F1 scores of 90.37% and 85.90%, respectively. It was shown that there is a better quality of medical images when the multi-level GAN is combined with AlexNet for binary classification. This is because the structural features are preserved and the artefacts are reduced. The testing accuracy was evaluated using both filtered and unfiltered images. Moreover, the suggested multi-level GAN is very appropriate for computer-assisted diagnosis, as it surpasses other models on all three datasets.
It is important to acknowledge the limitations of existing approaches. Moreover, the presence of superior and carefully selected datasets is essential for effectively building precise machine learning models. Nevertheless, acquiring standardized datasets for liver illnesses poses complications. The scarcity of such datasets impedes the development of reliable and widely applicable algorithms. To tackle these issues, there are ongoing developments in medical science and technology. Scientists are now engaged in efforts to develop more extensive datasets that include a broader spectrum of liver illnesses. Furthermore, continual endeavors are being taken to create machine learning algorithms that can acquire knowledge from smaller or more varied datasets while nevertheless maintaining precision.
To overcome these limitations, the integration of hybrid techniques emerges as a potential solution. By combining multiple approaches, hybrid techniques can leverage the complementary strengths of different modalities and algorithms, leading to more robust and accurate disease detection. Future research should focus on developing standardized datasets, exploring feature fusion strategies, and evaluating the performance of hybrid models across diverse liver diseases. With continued advancements in ML and DL, and the integration of hybrid techniques, we can expect further improvements in liver disease detection and diagnosis, ultimately leading to enhanced patient care and outcomes.
3. Proposed Method
To effectively use ML and DL for complicated medical and diagnostic activities, we have formulated a comprehensive approach to handle the complexities related to medical imaging and diagnostic processes, specifically for liver disease. This section is arranged in the following sub-sections: dataset used, pre-processing, applied algorithm, proposed (CNN+LSTM) model, and model training detail with the help of hyperparameter turning.
3.1. Applied Dataset
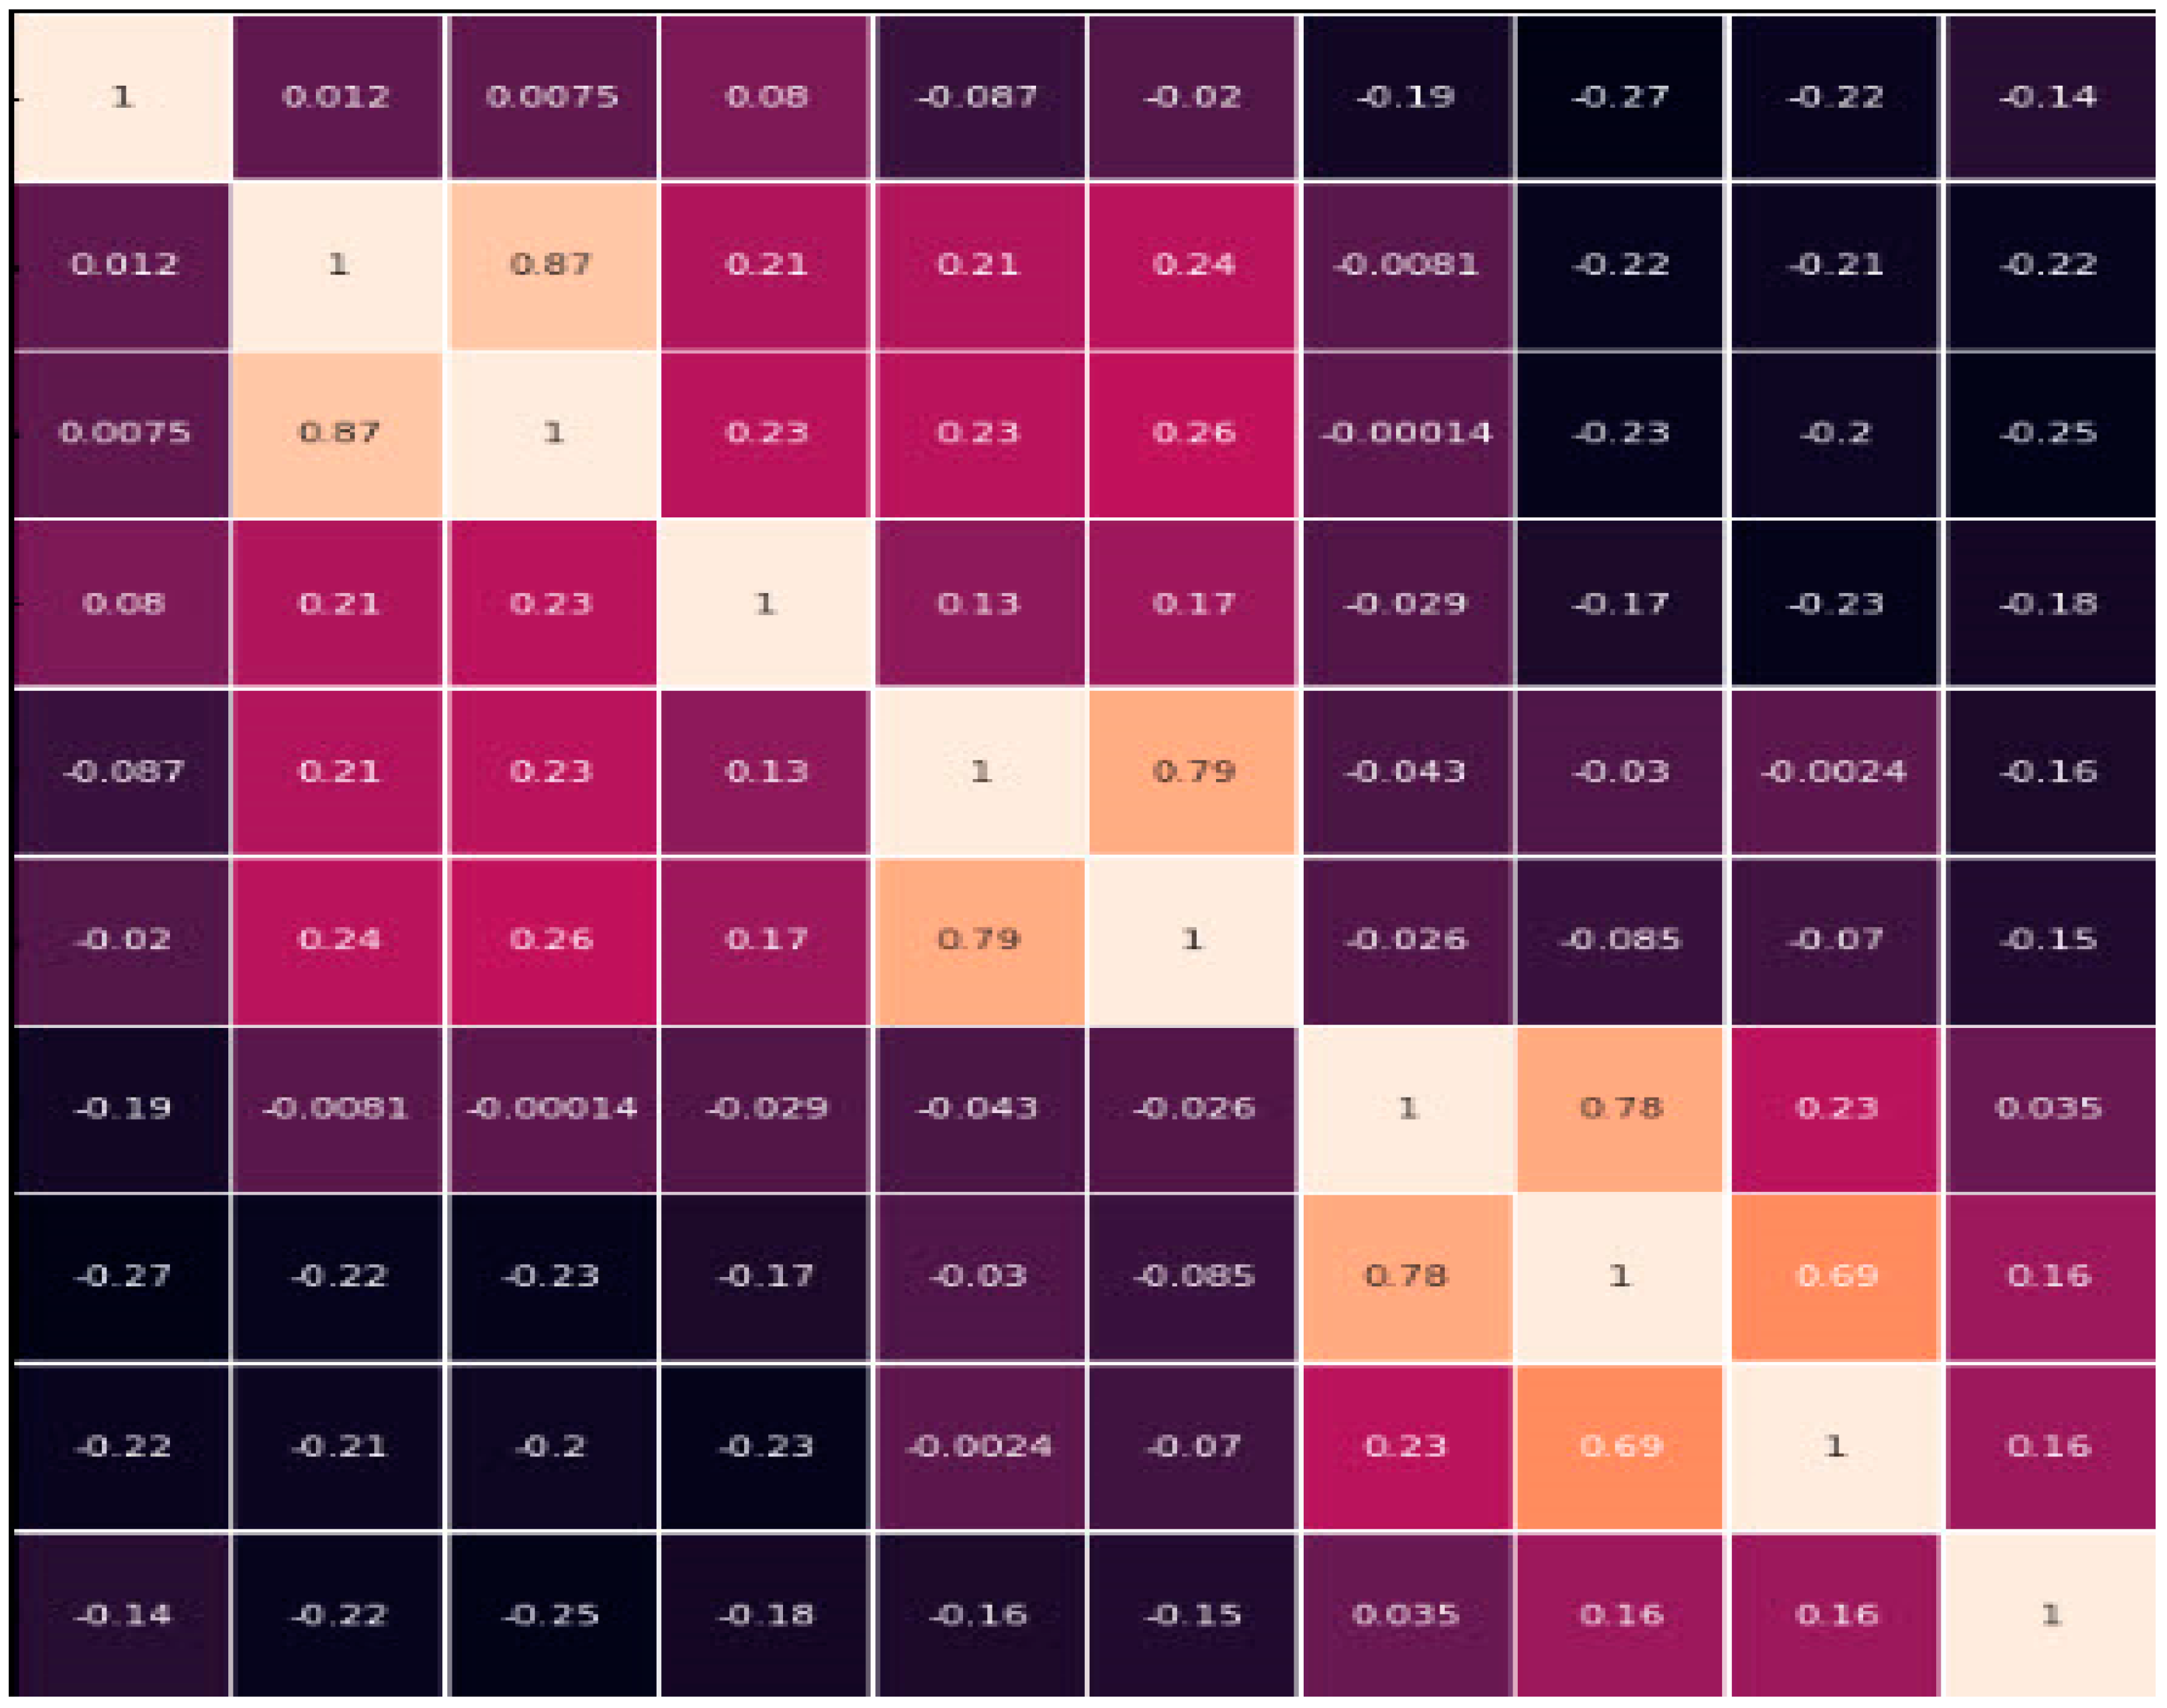
The Kaggle database for liver disease patients provides valuable information for developers and researchers working on the condition. It contains ten variables, such as “total bilirubin, age, gender, albumin, total proteins, direct bilirubin, SGPT, alkaline phosphatase, and A/G ratio”. These variables provide essential details on many aspects of the liver’s condition, functioning, and possible abnormalities. Through the analysis of the data and the use of machine learning or statistical methodologies, researchers and developers can identify patterns, construct predictive models, and make valuable contributions to the diagnosis, treatment, and comprehension of liver disorders. Apart from the ten variables or parameters, we have applied different labels such as Accuracy, Precision, Recall, F1 Score, AUC-ROC, etc. for our deep learning method. We also have applied the Hyperparameter for finding the where; for measuring the performance we applied Optimizer, rate of learning, size of each batch, total epochs, CNN architecture, LSTM units, dropout rate of CNN and LSTM, and loss function. The data were gathered from 30,000 individuals, and experts were notified of the information [
26]. The information collected from the Kaggle database was utilized to train DL systems to identify individuals with liver disease. The dataset’s size and well-labeled nature make it an ideal resource for developers and researchers. It holds information about 30,000 individuals, which is enough to be considered statistically significant.
3.2. Data Pre-Processing
Missing Value Imputation: The method of imputing missing values involves replacing the absent data points with approximated values. The dataset includes a feature referred to as “Total Bilirubin”, which is absent for certain cases. The process of imputing missing values in this feature involves utilizing “mean imputation”, whereby the missing values are substituted with the mean value derived from the available non-missing values.
Normalization of Data: Normalization of data is a method applied to standardize and measure data in the direction to carry them to a comparable range and magnitude. There are several approaches available for achieving this objective, including the utilization of min-max normalization techniques. The dataset includes the variable “Age”. This particular feature has a distinct magnitude in comparison to the remaining features within the given datasets. The feature has been normalized using min-max regularization.
Selection of Features: The process of identifying the most significant characteristics for a given assignment involves the utilization of a technique known as “recursive feature elimination”. The dataset includes the variable “Gender”. There is no observed correlation between this attribute and the target variable. Therefore, the aforementioned feature was excluded from the dataset in order to improve the performance of the proposed model.
Data transformation: The method involves converting the data into a format that is better suited for deep learning algorithms. The proposed model employed the technique of discretization for the purpose of transforming the data. The dataset includes the variable “Total Bilirubin”. The aforementioned characteristic exhibits continuity. Therefore, it is necessary to discretize this particular feature into a predetermined number of bins.
3.3. Applied Algorithm
Convolutional Neural Networks (CNNs): The CNNs are mostly employed in the field of computer visualization, namely for tasks involving image and video recognition. However, they may also be effectively utilized for sequential data analysis, including text processing. The CNNs are specifically built to learn and analyze spatial hierarchies of features from input data. This enables them to efficiently capture and represent patterns and structures within the data.
The essential components of CNNs encompass the following three layers, namely—convolutional, pooling and fully connected layers. Convolutional neural networks also employ filtering techniques to apply them to input datasets, aiming to extract local features and generate feature maps. The sharing layers effectively reduce the spatial dimensions of the feature maps while retaining crucial information. The interconnected layers of the neural network combine the extracted features and produce predictions based on the learned demonstrations. The representation of the output of a convolutional layer can be achieved by the utilization of the convolution process, which is commonly termed as such,
where,
= “element at position (
i,
j) is fed as input to achieve output feature map”;
K = “CNN kernel”;
X = “input data of a feature map”;
M and
N = “extents of the kernel”.
The outcome of the CNN is then voted for a triggering function called ReLU (Rectified Linear Unit). This presents non-linearity,
where,
Y = “output after the activation function is applied to the feature map
H”.
Recurrent Neural Networks (RNN): The RNNs are designed to efficiently handle sequential data by capturing temporal dependencies and maintaining information across time steps. These techniques seem to be particularly advantageous in jobs that need the examination of sequential patterns, such as natural language processing (NLP), speech recognition, and investigation of time series data. Recurrent neural networks are characterized by the presence of feedback connections, which facilitate the transmission of information from one temporal step to the subsequent one. This stands in contrast to the unidirectional flow of information in feed-forward neural networks. The utilization of this architectural design allows RNNs to effectively preserve an internal memory, hence enhancing their ability to capture and represent long-term data dependencies.
The essential component of an RNN is the recurrent hidden layer, responsible for processing sequential data. Furthermore, each hidden unit within the recurrent layer is equipped with a recurrent connection, enabling it to receive its own prior output as an input. This facilitates the network’s ability to retain and integrate knowledge from preceding iterations, hence enhancing its computational process in the present iteration. The computation within an RNN can be denoted by the subsequent mathematical expressions.
where
= hidden layer at time
t,
is input at time
t,
= “weighted matrix for the RNN connections”,
= “weight matrix for the input connections”,
= “weight matrix for the output connections”,
and
are “bias terms”, and
= “activation function”.
RNNs are suitable for emotion recognition tasks that involve sequential data, such as analyzing the temporal patterns in speech or text data. However, standard RNNs have the lack of the disappearing “gradient problem” because of their limitations in capturing long-term dependence.
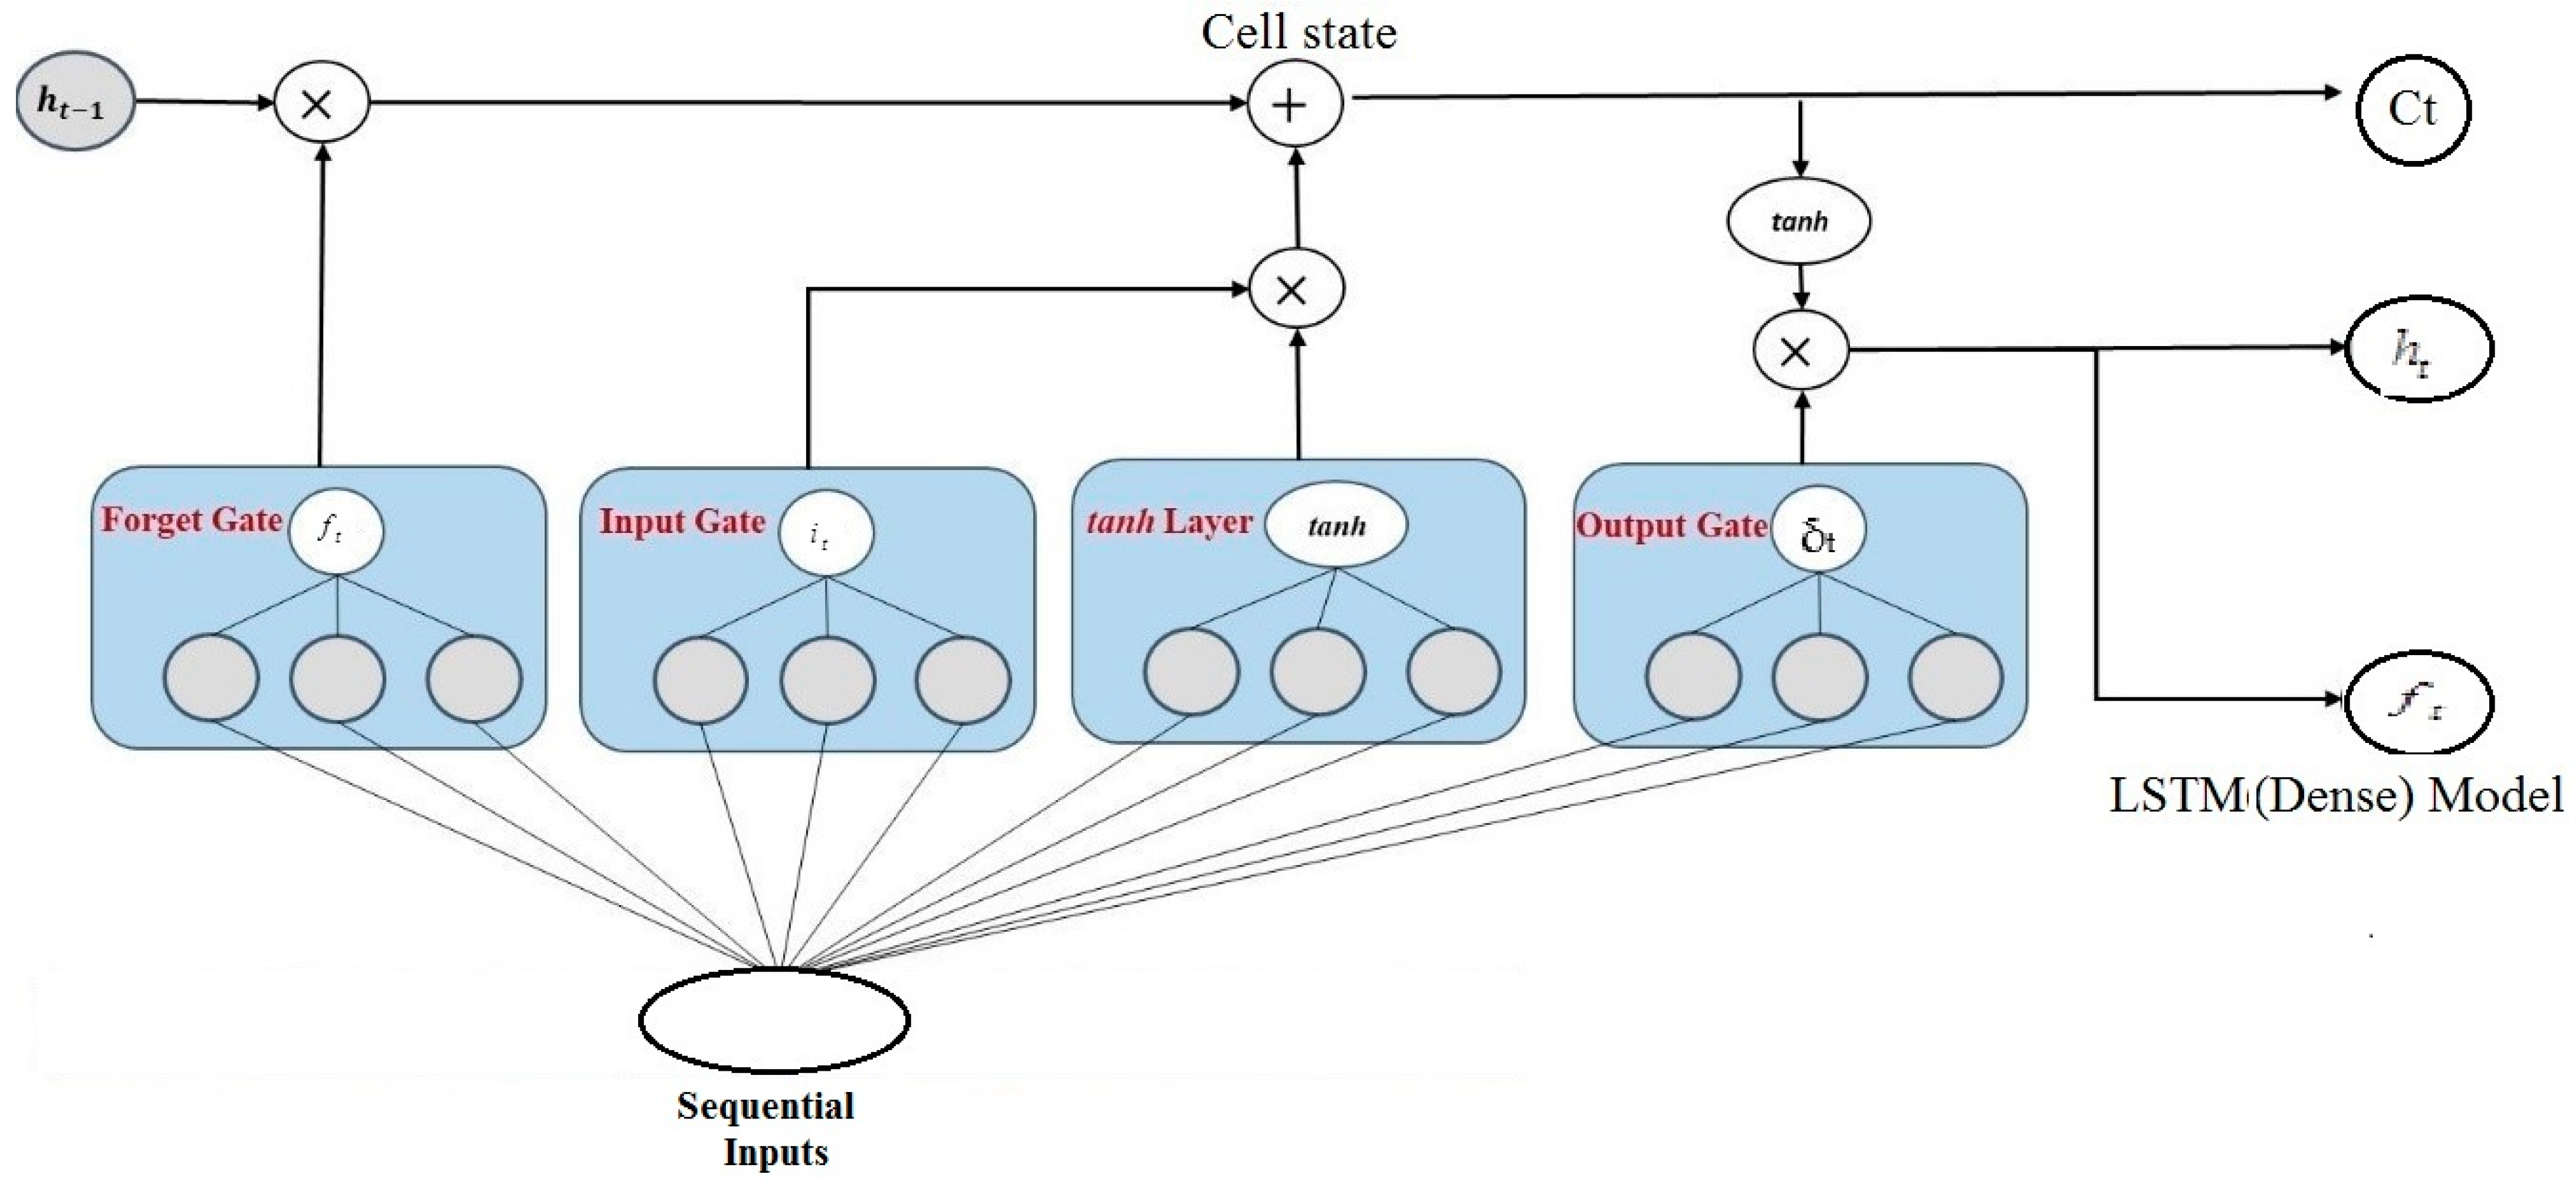
Long Short-Term (LST) Memory: The LSTM networks are a type of recurrent neural network that can capture dependency over time in serial data and solve the issue of vanishing gradients. Long short-term memory networks add a memory cell and numerous gating methods to regulate data transfer across the network. The LSTM architecture consists of three main components of gates: input, forget, and output. They regulate the information flow by updating or discarding statistics from the memory cell depending on the current and previous inputs. This permits LSTMs to learn long-term reliance by effectively retaining relevant information over many time steps.
where the forget gate is
, input gate is
, and output gate is
, respectively. Moreover, the term
is stating the updated state of a memory cell and the hidden state with respect to time
t is
. The input with respect to time
t is represented by
. We measure the matrices of weight with the following symbols:
,
,
,
,
, and
correspondingly. The biases are measured by
and
We measure the sigmoid function for activation by the
symbol. The LSTM network works as another part of the DL model, which is comprised of memory blocks, or a collection of subnets that are usually connected. Memory blocks consist of an output gate, an input gate, a forget gate, and a memory cell. In contrast to the conventional recurrent unit, which updates its contents at each iteration, the LSTM unit utilizes the introduced gates to determine whether or not to retain the existing memory. LSTM explicitly avoids the long-term dependency conundrum. In contrast to the solitary neural network layer found in recurrent neural networks, the LSTM architecture comprises four interconnected layers. The structure of LSTM is wherein each line represents a complete vector connecting the output of one node to the inputs of the other.
LSTM layers are especially designed to collect and represent long-term relationships in sequential data. They possess the capability to retain knowledge from previous inputs and use it to generate estimates for future inputs. Its layers have the ability to handle input sequences that have different values, and the layers provide the ability to automatically adjust and acquire knowledge from sequences of varying lengths, unlike conventional feed-forward neural networks that need inputs of fixed sizes. This model facilitates the acquisition and transmission of significant gradient information over different time steps. This process is crucial for the successful training of deep recurrent neural networks. LSTMs provide the capability of effectively acquiring and representing information across many time scales when modelling sequential data. This mechanism inherent in LSTM layers enables them to flexibly regulate the amount of past information they keep and the amount of new information to adapt, successfully capturing both short-term and long-term dependencies in the data. This skill is crucial in jobs that involve the varying significance of contextual information throughout various time periods. Its layers are suitable for jobs involving multi-dimensional input data, such as disease identification, image recognition, video analysis, and audio processing. DL models can quickly find temporal links in the input data by using LSTM layers along with convolutional or fully connected layers.
LSTMs have been applied in various NLP tasks successfully, including sentiment analysis and recognition. Their ability to capture long-term dependencies makes them suitable for analyzing sequential data and extracting meaningful features related to emotions.
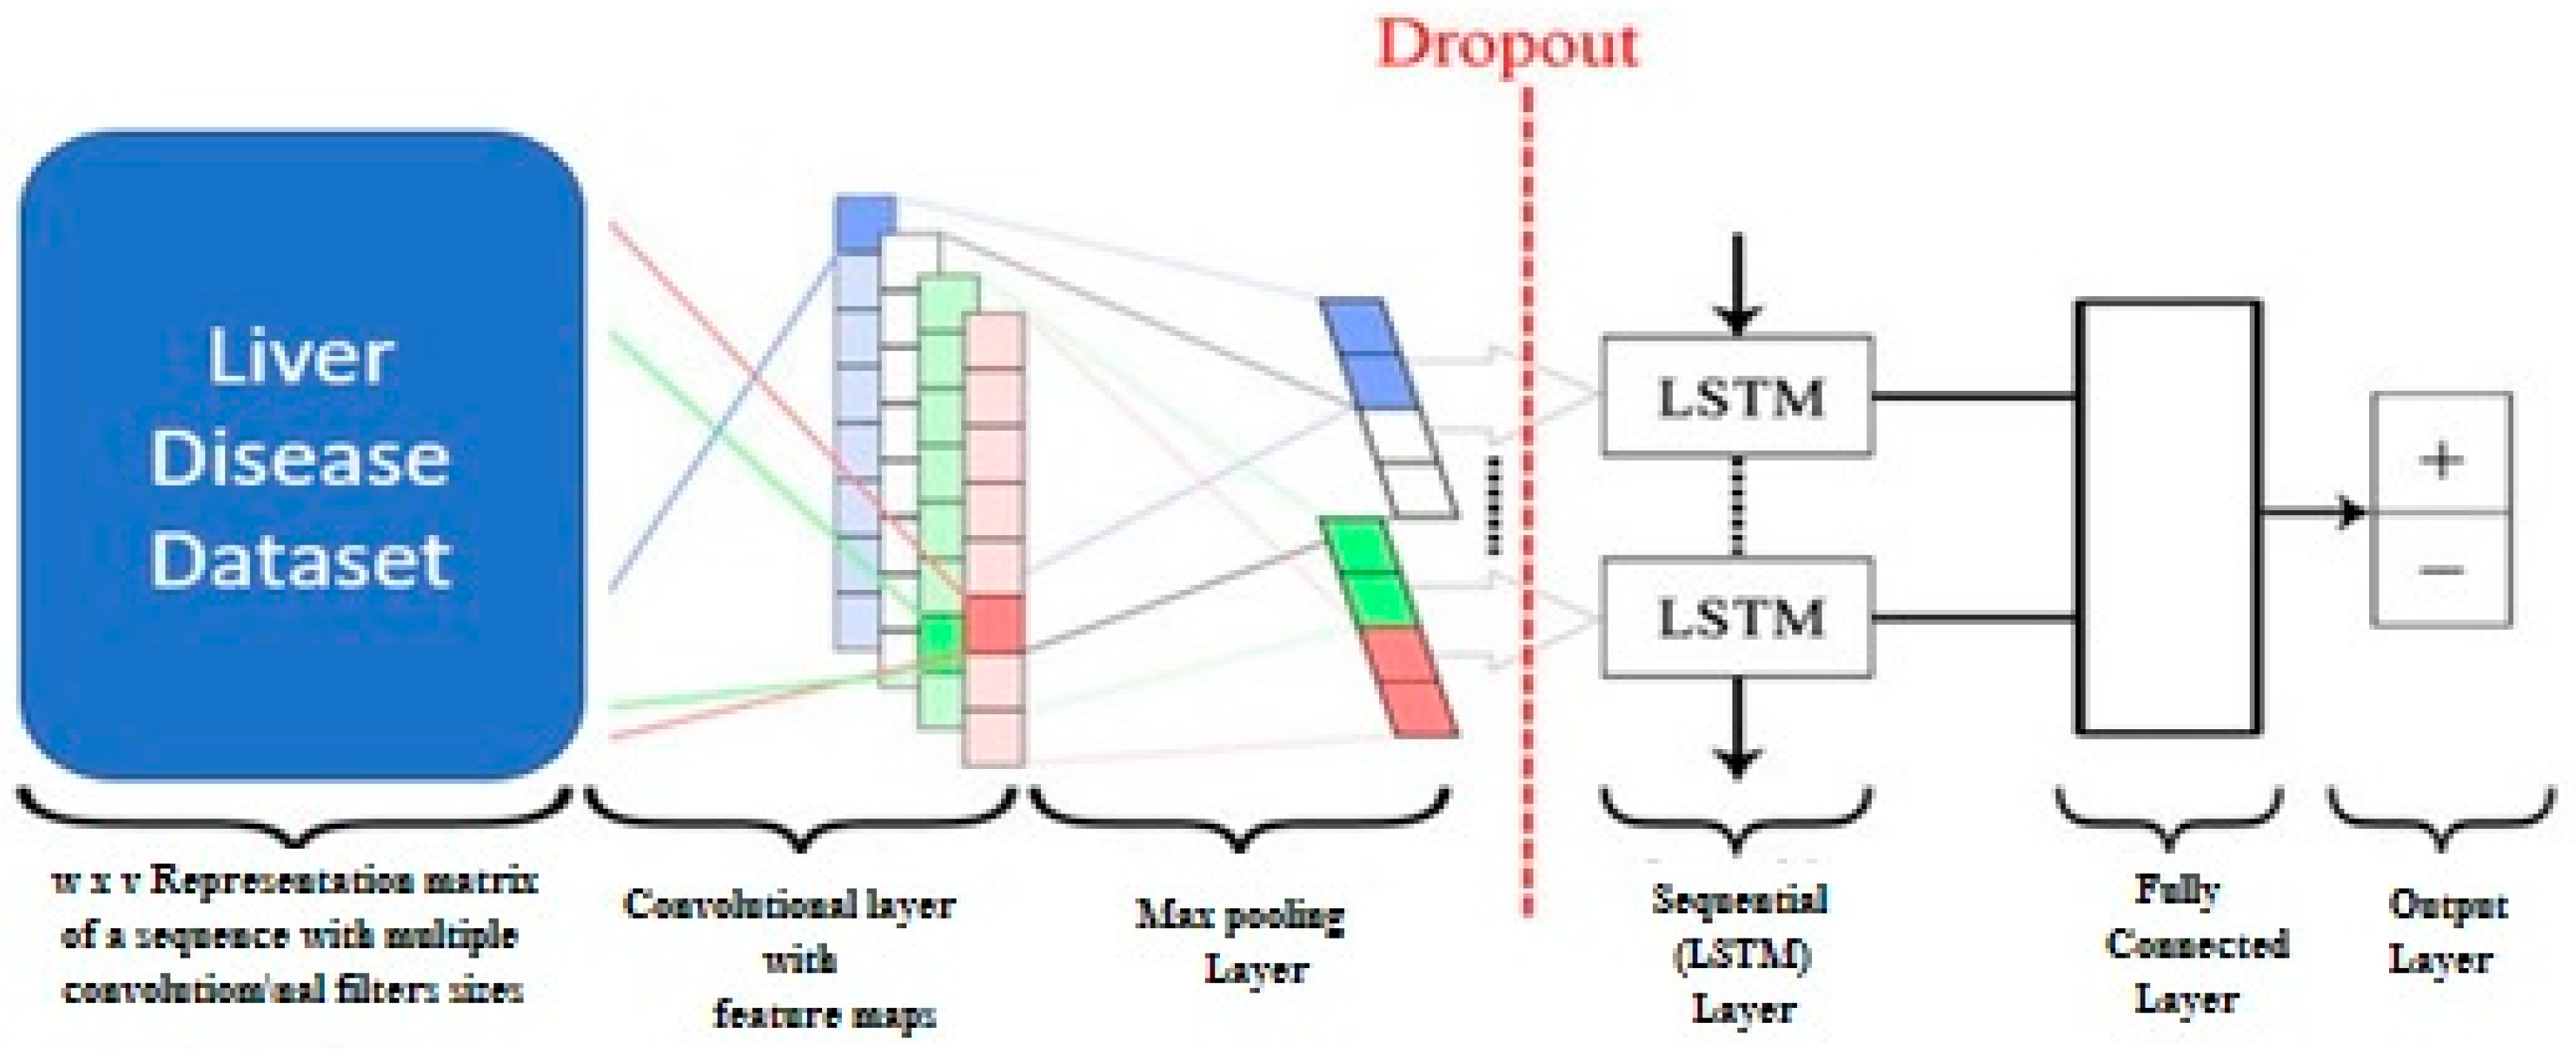
Proposed (CNN and LSTM) Model: The proposed approach involves the utilization of a CNN+LSTM model, which integrates the functionalities of both CNN and LSTM networks, for the purpose of liver disease diagnosis. The utilization of temporal and medical data facilitates the provision of a diagnostic with enhanced accuracy. The CNN is employed as the primary extraction component of the model. The system undertakes a range of functions, including the acquisition of spatial data and the identification of localized patterns within medical images. The resulting output maps are subsequently subjected to down sampling in order to preserve their distinctive properties. The LSTM component subsequently analyses the data obtained from the CNN. The machine learning algorithm has the capability to acquire knowledge on the patterns and temporal relationships within the data, enabling the identification of distinct indicators associated with liver disease.
The schematic diagram in
Figure 2 represents the proposed model based on CNN and LSTM. We have incorporated the diagrammatic representation through
Figure 3 for representing and demonstrating the LSTM model with dense level 1, and
Figure 4 demonstrates the details of the proposed CNN and LSTM models. The suggested model integrates the capabilities of LSTM and CNN in order to effectively identify liver illness. By virtue of its training on the Kaggle dataset, the system is capable of generating accurate and prompt diagnoses. Additionally, it aids in improving the overall quality and effectively managing other components associated with the system.


 ,
, 

