Article

Textural and Conventional Pretherapeutic [18F]FDG PET/CT Parameters for Survival Outcome Prediction in Stage III and IV Oropharyngeal Cancer Patients

by
David Palomino-Fernández
1,†,
Eva Milara
1,*,†,
Álvaro Galiana
2,
Miguel Sánchez-Ortiz
3,
Alexander P. Seiffert
1,
Justino Jiménez-Almonacid
4,
Adolfo Gómez-Grande
2,5,
Sebastián Ruiz-Solís
2,
Ana Ruiz-Alonso
3,
Enrique J. Gómez
1,6,
María José Tabuenca
2 and
Patricia Sánchez-González
1,6,*
1
Biomedical Engineering and Telemedicine Centre, ETSI Telecomunicación, Center for Biomedical Technology, Universidad Politécnica de Madrid, 28040 Madrid, Spain
2
Department of Nuclear Medicine, Hospital Universitario 12 de Octubre, 28041 Madrid, Spain
3
Department of Radiation Oncology, Hospital Universitario 12 de Octubre, 28041 Madrid, Spain
4
Department of Pathology, Hospital Universitario 12 de Octubre, 28041 Madrid, Spain
5
Facultad de Medicina, Universidad Complutense de Madrid, 28040 Madrid, Spain
6
Centro de Investigación Biomédica en Red de Bioingeniería, Biomateriales y Nanomedicina, Instituto de Salud Carlos III, 28029 Madrid, Spain
*
Authors to whom correspondence should be addressed.
These authors contributed equally to this work.
Appl. Sci. 2024, 14(4), 1454; https://doi.org/10.3390/app14041454
Submission received: 12 September 2022 / Revised: 24 October 2022 / Accepted: 9 February 2024 / Published: 10 February 2024
(This article belongs to the Special Issue Medical Imaging and Application in Radiotherapy)

Abstract

:
Evidence is emerging about the value of textural features as powerful outcome predictors in cancer lesions. The aim of this study is to evaluate the potential of [18F]FDG PET/CT conventional and textural parameters as survival predictors in patients with stage III and IV oropharyngeal cancer. The database includes 39 patients. Segmentation of the primary lesions was performed. A total of 48 features were extracted, comprising conventional parameters and textural features. A 2-year follow-up period to analyze the Overall Survival (OS) and Relapse-Free Survival (RFS) rates was defined. Kaplan–Meier and Cox proportional hazards regression analyses were computed. Higher TLG (p = 0.001) and Surface (p = 0.001) are significantly related to better OS in Cox regression analysis after multiple-testing correction. Higher GLZLM_ZLNU (p = 0.001) is significantly related to greater relapse rates in RFS Kaplan–Meier analysis after multiple-testing correction. Quantitative [18F]FDG PET/CT image features, especially the TLG, have been confirmed as predictors of OS and RFS. Textural features, such as GLZLM_ZLNU, demonstrated a potential predictive value for the OS and RFS of the patients. RFS analysis suggest stabilization of patients adhering to the treatment, showing no relapse events after 20 months of follow-up. [18F]FDG PET/CT is a useful tool for predicting prognosis after chemoradiation therapy of oropharyngeal cancer patients.

1. Introduction

Head and neck cancer is the sixth most common neoplasm in the world [1], with some known risk factors such as smoking, oral health, genetics, and the presence or not of human papilloma virus infection (HPV) [2,3]. Nevertheless, the presence of HPV has been identified as a good prognostic factor, since HPV-positive cases show a reduction in mortality by 58% and a better response to treatment than HPV-negative patients [2]. This is especially relevant in patients with oropharyngeal cancer, where the latest AJCC classification discriminates according to HPV status, due to its prognostic nature [4]. Diet, ultraviolet radiation, oral health, or genetic predisposition are other risk factors with lower incidence [3].
Despite its high incidence, the survival rate has been increasing in recent years due to early diagnosis and the improvement in therapeutic strategies [1]. Functional images using Positron Emission Tomography (PET) with 18F-2-fluorine-2-deoxy-D-glucose ([18F]FDG) in combination with computed tomography (CT) are a useful tool to assess the recurrence before the treatment or in the case of relapse thanks to the high negative predictive value [1], especially during the first two years post-treatment due to the high risk of relapse (50–60%) [5,6] in locoregional advanced oropharyngeal cancer (stage III or IV). [18F]FDG PET/CT images help to evaluate efficiently the changes produced in tissues after therapies and treatments, discriminating between active residual disease, recurrent disease, and post-treatment fibrosis. As a result of such high levels of sensibility and specificity, PET-CT findings lead to a change in management for up to 25% of patients [7,8,9].
[18F]FDG PET images are usually analyzed quantitatively through the Standardized Uptake Value (SUV), which represents the relative radiotracer uptake in the lesion [1]. The [18F]FDG uptake in head and neck cancer was evaluated by Torizuka et al. [2], where lower SUVs were related to greater survival rates and disease control. In addition, the evaluation of volumetric parameters, such as the Metabolic Tumor Volume (MTV) and Total Lesion Glycolysis (TLG), has shown promising results. Pak et al. [3] have demonstrated that higher MTV and TLG are related to tumor recurrence. Creff et al. [10] proved the prognostic effectiveness of [18F]FDG PET parameters among patients with head and neck squamous cell cancer. Additionally, Bonomo et al. [7] demonstrated the prognostic relevance of [18F]FDG PET parameters in the context of locally advanced head and neck squamous cell carcinoma.
Radiomics is an evolving field that uses a non-invasive methodology to characterize tissues and organs based on a large number of features extracted from the medical images. The underlying hypothesis of radiomics is that genomic cancer subtypes are reflected in image-based features. Subsequently, recent techniques such as textural analysis have demonstrated to be optimal to quantify these cancer phenotype properties [11,12,13]. These sub-visual features can be grouped into intensity, shape, and textural relationships between pixels. The textural features, or second order, represent the spatial distribution relationship between voxel intensities, such as the gray level co-occurrence matrix (GLCM), which calculates the correlation between two gray levels at a certain distance and a certain direction in an image.
In the last years, the use of radiomics for the analysis of [18F]FDG PET/CT images in oncology has increased [8,11,14,15]. In head and neck cancer, intratumoral heterogeneity is considered one of the main factors that influences treatment progression and chemotherapy resistance [16]. Molecular heterogeneity is reflected macroscopically through these textural image features [14]. Consequently, the relationship between genetic and metabolic heterogeneities and its ability of prognosis in [18F]FDG PET images was evidenced in recent studies [8,13,17,18,19,20]. These studies demonstrated that the greater the homogeneity is within an FDG-avid region, the better the disease prognosis.
Several studies have revealed that textural parameters in [18F]FDG PET images, as tumor heterogeneity indicators, have shown to provide additional prognostic value for treatment outcomes [12,19,21,22,23,24,25,26]. Furthermore, the combination of clinical and textural parameters has shown complementary predictive value for locoregional recurrence and Overall Survival (OS) [12] in head and neck cancer. The ability of radiomics to stratify patients into potential risk cancer phenotypes may be of great use in clinical decision support systems. Radiomics can be used as a tool to enhance personalized medicine, evaluating patient-specific treatment efficacy and optimal treatment strategies during follow-up.
In this study, the aim was to evaluate the potential of radiomics analysis using [18F]FDG PET/CT images. The purpose was to identify predictive [18F]FDG PET radiomic features to predict recurrence and OS in patients with stage III and IV oropharyngeal cancer. The prognostic value of the combination of conventional and textural features was evaluated. We studied the relationship of these features, as well as clinical and pathological characteristics, especially HPV status, to treatment response and patient survival.

2. Materials and Methods

2.1. Study Cohort

Eligibility criteria included histologically confirmed HPV status oropharyngeal squamous cell carcinoma; American Joint Committee on Cancer (AJCC) 7th edition clinical categories T1–T2, N2a–N3 M0 or T3–T4, N0–N3 M0 (stage III or IV); Eastern Cooperative Oncology Group (ECOG) performance status 0–2; age of at least 18 years; and chemoradiotherapy concurrent treatment. Exclusion criteria included concomitant tumor present in another location or incomplete treatment. Lastly, due to software limitations, patients with tumor sizes smaller than 64 voxels were excluded.
Importantly, HPV-related oropharyngeal cancer patients’ staging should be done following the AJCC TNM 8th edition, whereas clinical decision making should follow the AJCC TNM 7th edition. This is the reason why we decided to unify our sample following the AJCC TNM 7th edition.
After applying the exclusion criteria, 39 patients (median age, 66; range, 53–82) were included in the study population. It must be noted that the vast majority of patients of this database are smokers (36 of 39 patients), being a risk factor for head and neck cancer [22], making it impossible to establish differences between smokers and non-smokers. Patient demographics are summarized in Figure 1, and the followed workflow is described in Table 1.

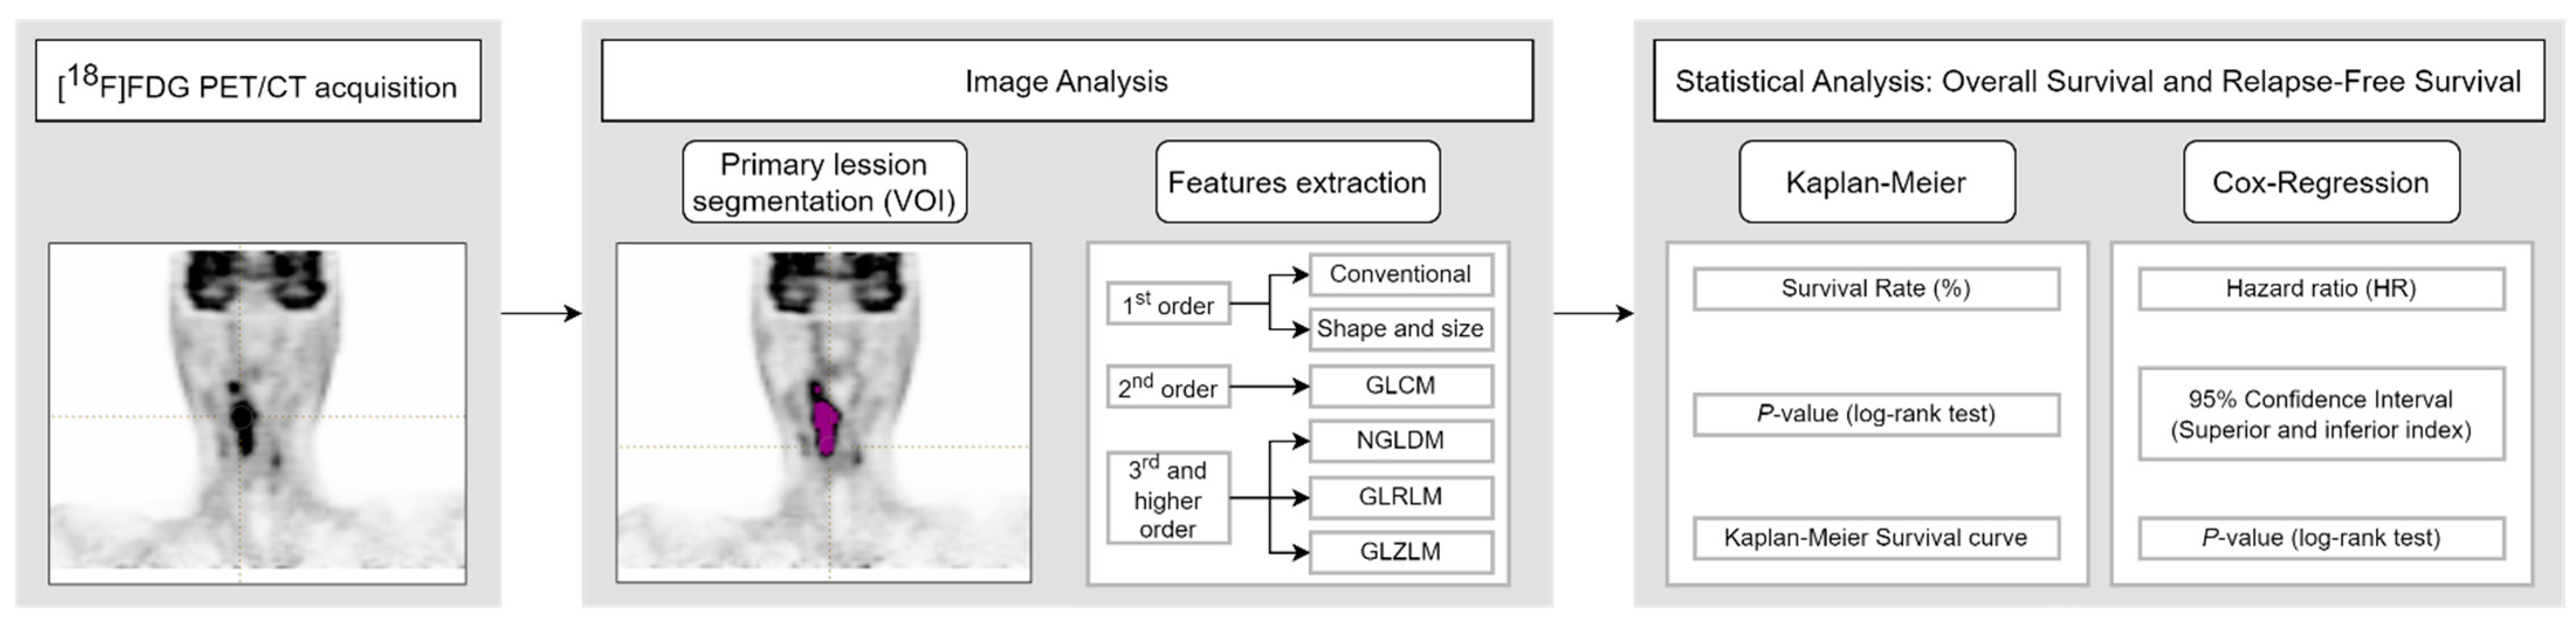
2.2. [18F]FDG PET/CT Acquisition

Patients were subject to a 4 to 6 h fasting before the images were taken. Glucose levels were all below 200 mg/dL. Images were analyzed by experienced nuclear medicine physicians, and all primary lesions were defined through their evaluation. Selective head and neck images were acquired using a Siemens Biograph TruePoint PET/CT Model 1093 (Siemens Healthineers). Patients were weighted before the study, and a dose of 5 Mbq per kg was administered, which resulted in a mean dose of 341.14 ± 67.43 MBq of [18F]FDG intravenously administered. Images were acquired 73.02 ± 21.80 min post injection. Imaging protocol included a dedicated head and neck image from the top of the skull to the sternum manubrium with arms down, and a whole-body image from the base of the skull to the mid-thighs with arms up. Images were reconstructed using a Point Spread Function (PFS), with 3 iterations and 21 subsets. Attenuation correction was performed using simultaneously acquired low-dose CT scans. Additionally, scatter and random corrections were performed. The reconstructed PET images had a matrix size of 168 × 168 and voxel size of 4.07 × 4.07 mm.

2.3. Image Analysis

Segmentation of the primary tumors was performed using the LIFEx v6.30 software (https://www.lifexsoft.org (accessed on 9 February 2024) [27]. An initial volume encompassing the whole tumor was manually drawn on the [18F]FDG PET images according to clinical data. Images were read by an experienced nuclear medicine physician (example in Figure 2). Specifically, the SUVmax from the corresponding initial clinical records was used to distinguish the primary lesion from secondary lymph nodes. The segmentation of the tumor, i.e., the primary lesion, was computed applying a threshold of 41% of the SUVmax inside the previously drawn volume [28], obtaining the volume of interest (VOI). LIFEx was set up using the following input parameters for calculation of textural features: 64 gray levels for intensity discretization; and absolute resampling between a minimum of 0 and a maximum of 39 (the maximum SUV of the segmented VOIs for the whole study cohort) for intensity rescaling [29]. A total of 48 features were extracted. These included 13 conventional parameters, 4 shape and size features, 6 second-order textural features (from the gray-level co-occurrence matrix, GLCM), and 25 third and higher order textural features (3 from the neighborhood gray-level different matrix, NGLDM; 11 from the gray-level run-length matrix, GLRLM; and 11 from the gray-level zone-length matrix, GLZLM) [30,31,32,33]. Shape and size features include the MTV, Sphericity, Compacity, and Surface. Texture indices were computed for each of the gray-level matrixes mentioned above.

2.4. Statistical Analysis

OS and Relapse-Free Survival (RFS) of oropharyngeal stage III and IV cancer patients were analyzed for a follow-up period of 24 months. OS was defined as the time from the date of diagnosis to date of death (all causes) or date of last contact. RFS was defined as the time between the end of treatment (radiotherapy or surgery) date to the date of relapse, date of cancer-specific death, or date of last contact. Patients in the database with disease persistence were also included in RFS analysis, considering persistence as a relapse event at the start of the survival analysis.
The optimal cut-off values of continuous variables to define high- and low-value subgroups in Kaplan–Meier analysis were obtained using the receiver operating characteristic (ROC) and the closest-to-(0,1) criterion. Univariate survival rates (SRs) were calculated using Kaplan–Meier analysis, using a log-rank test to compare between high and low value subgroups, reporting the p-value. Association between features and survival (OS and RFS) was also evaluated using univariate Cox proportional hazards regression analysis. Statistically significant features in univariate analysis were included in a multivariate Cox proportional hazards regression analysis, using the stepwise backwards conditional regression model. The associated p-values and hazard ratio (HR) coefficients, with a 95% confidence interval (CI), were computed. A p-value less than 0.05 was considered statistically significant. p-values were corrected for multiple testing with the false discovery rate method by Benjamini–Hochberg. In addition, the univariate Cox proportional hazards regression analysis, with the same criterion, was performed, adjusting each variable by the HPV status to evaluate its importance in survival outcomes. Statistical analysis was performed using SPSS software version 26.0 (IBM Corp.).

3. Results

3.1. Overall Survival Analysis

The 2-year OS was 69% for the entire study cohort. Results of OS univariate Kaplan–Meier analyses of clinical characteristics and image features are summarized in Table 2 and Figure 3. For Kaplan–Meier analysis, HPV-positive (SR: 92.3%) showed a better prognosis of OS than HPV-negative (SR: 57%; p = 0.037). In the same way, cases with TLG (p = 0.029) lower than the optimal cut-off resulted in a higher survival rate (SR: 82.4%) compared to the high-value subgroup (SR: 50%). However, results were not statistically significant after multiple-testing correction. OS curves are shown for clinical characteristics and SUVmax in Figure 3.
Several textural and conventional features proved to be significant in predicting clinical outcomes in OS (See Table 3). Firstly, TLG (HR = 1.006 (1.003–1.009), p = 0.001) was the most significant parameter. Shape and size parameters such as MTV (HR = 1.075 (1.025–1.126), p = 0.003), with the highest HR, and Surface (HR = 1.000 (1.000–1.001), p = 0.001) were also significant features. Three textural parameters corresponding to the GLRLM and GLZLM matrices were statistically significant. Nevertheless, none of the clinical features were statistically significant. Additionally, a multivariate Cox analysis was computed, including only significant features in univariate analysis after multiple-testing correction. Only the TLG was retained in the multivariate model (HR = 1.006 (1.002–1.009), p = 0.001).
Table 3. Cox regression analyses for overall survival for 2-year follow-up of relevant clinical characteristics and significant image features. * Statistically significant p-value after multiple-testing correction by means of Benjamini–Hochberg procedure. RLNU: run-length non-uniformity; GLNU: gray-level non-uniformity; ZLNU: zone-length non-uniformity.
UnivariateMultivariate
HR (95% CI)p-ValueHR (95% CI)p-Value
HPV0.152 (0.020–1.182)0.072
Tumor stage27.519 (0.049–1.559 × 10⁵)0.305
Location1.410 (0.447–4.442)0.558
Smoker23.267 (0.004–1.348 × 10⁵)0.477
SUVmax1.037 (0.981–1.096)0.199
TLG1.006 (1.003–1.009)0.001 *1.006 (1.002–1.009)0.001
MTV1.075 (1.025–1.126)0.003
Surface1.000 (1.000–1.001)0.001 *
GLRLM RLNU1.002 (1.000–1.003)0.043
GLZLM GLNU1.069 (1.005–1.137)0.033
GLZLM ZLNU1.017 (1.005–1.030)0.007
For HPV status adjustment, two more variables were significant in predicting clinical outcome in OS (Skewness (HR = 0.141 (0.022–0.906), p = 0.039) and Entropy (28.669 (1.726–476.315), p = 0.019)), resulting in six variables with better results than those non-adjusted by HPV Cox regression (see Table 4). However, TLG (HR = 1.005 (1.002–1.009), p = 0.002), with worse results than those obtained in the previous analysis, was still the most significant variable. In addition, these results showed no significant variables after multiple-testing correction by means of the Benjamini–Hochberg procedure.
Table 4. Cox regression analyses for overall survival for 2-year follow-up of relevant clinical characteristics and significant image features adjusted for the HPV status variable before multiple-testing correction by means of the Benjamini–Hochberg procedure. No p-value was significant after multiple-testing correction. Tumor stage is not included due to non-convergence.
Univariate
HR (95% CI)p-Value
Location1.446 (0.459–4.556)0.529
Smoker157,042.285 (0.000–)0.986
SUVmax1.038 (0.989–1.088)0.129
Skewness0.141 (0.022–0.906)0.039
TLG1.005 (1.002–1.009)0.002
MTV1.068 (1.019–1.119)0.006
Surface1.000 (1.000–1.001)0.005
GLCM_Entropy28.669 (1.726–476.315)0.019
GLRLM_RLNU1.002 (1.000–1.003)0.038
GLZLM_GLNU1.065 (1.003–1.130)0.039
GLZLM_ZLNU1.018 (1.006–1.030)0.004

3.2. Relapse-Free Survival Analysis

The 2-year RFS was 41.0% for the study cohort, including those with tumor persistence as relapse cases. In the same way as in OS analysis (see Table 2), HPV and TLG turned out to be significant features in RFS Kaplan–Meier analysis (see Table 5). The most important clinical feature is the HPV status (p = 0.023), being a prognostic indicator of higher RFS in HPV-positive patients (SR: 45.5% in positive subgroup versus SR: 84.6% in negative subgroup). Additionally, four texture and two shape features were found to be statistically significant predictors of RFS, with ZLNU being the best indicator. For ZLNU (p = 0.001) the longer relapse-free survival is related to lower values (SR: 78.4%) rather than higher values (SR: 26.7%). For Surface (p = 0.004), the best prognosis is related to lower values (SR: 82.1%) rather than high values (SR: 38.1%), and for MTV (p = 0.006) a better prognosis is related to lower values (SR: 78.9%) rather than higher values (SR: 36.8%). While the results were statistically significant before multiple-testing correction, only ZLNU was significant afterwards. The RFS curves of relevant clinical features are shown in Figure 4.
In the case of RFS Cox regression analysis (See Table 6), three shape features and one texture feature were statistically significant predictors of RFS, with the most significant being TLG (HR = 1.003 (1.000–1.006), p = 0.026) and Surface (HR = 1.000 (1.000–1.000), p = 0.028). The multivariate analysis was not performed, considering that no feature remained statistically significant after multiple-testing correction in univariate Cox regression analysis.

4. Discussion

New cancer treatment techniques are currently being studied to improve patient survival [34,35,36]. However, the same technique may have different results in patients diagnosed with the same cancer. For this reason, studying the possible therapeutic strategies based on the clinical and image characteristics of the patient at the time of diagnosis is a matter of great importance. In this study, cancer lesions from [18F]FDG PET/CT images of patients with oropharyngeal cancer are analyzed to assess the predictive value of clinical, quantitative, and textural features, assessing OS and RFS over a 2-year follow-up period. Concretely, 48 parameters are extracted, including 13 conventional parameters, 4 shape and size features, and 31 textural features. Kaplan–Meier curves and Cox proportional hazards regression analyses are computed.
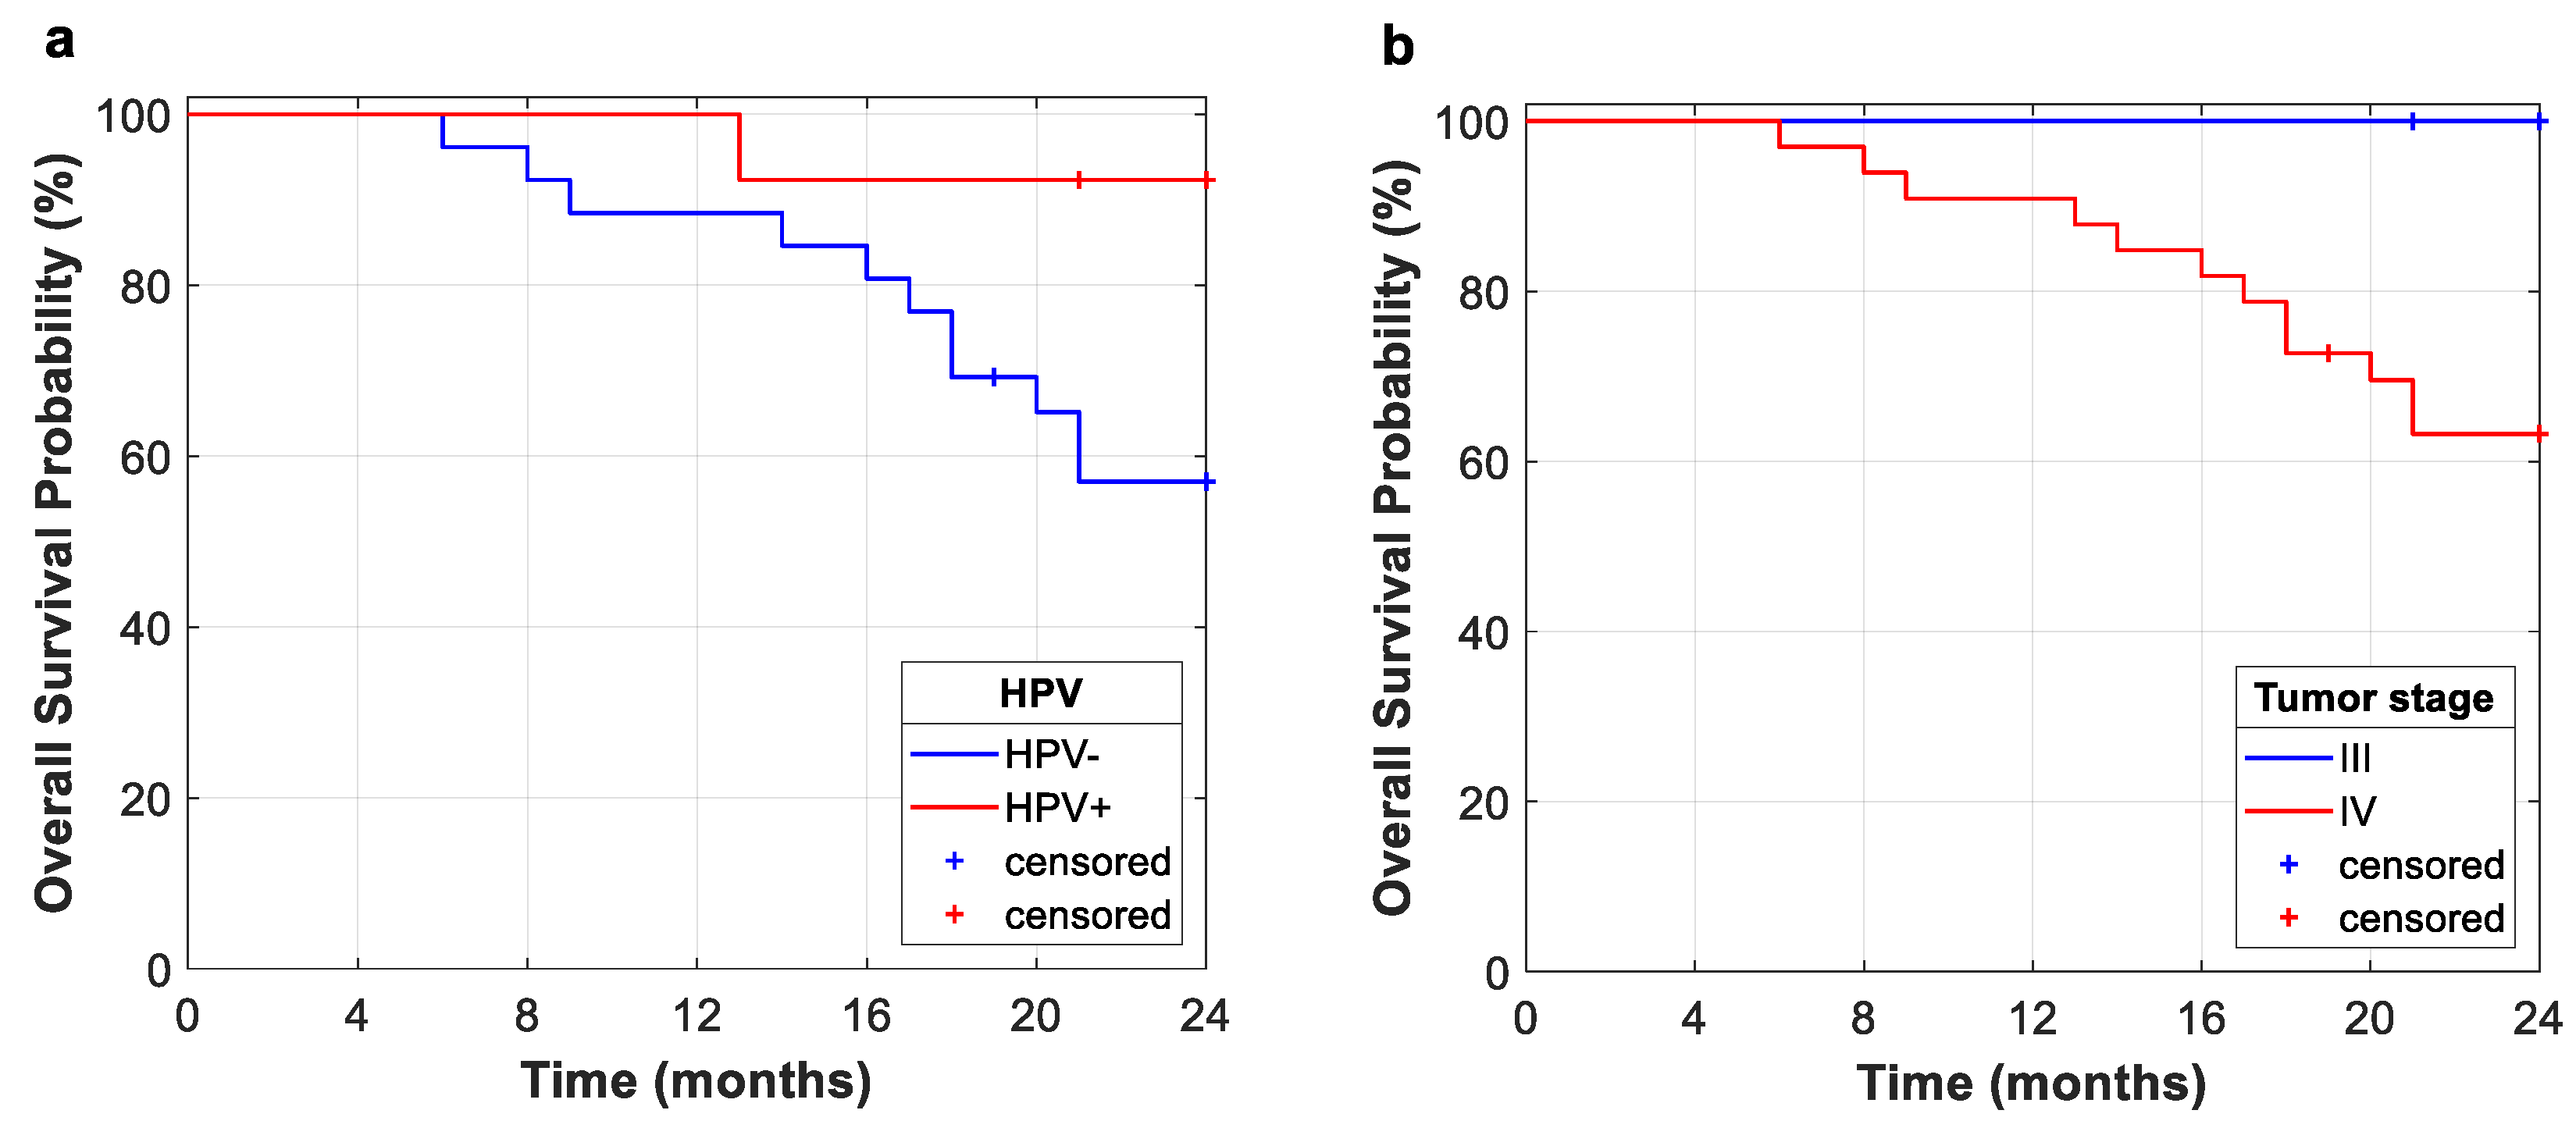
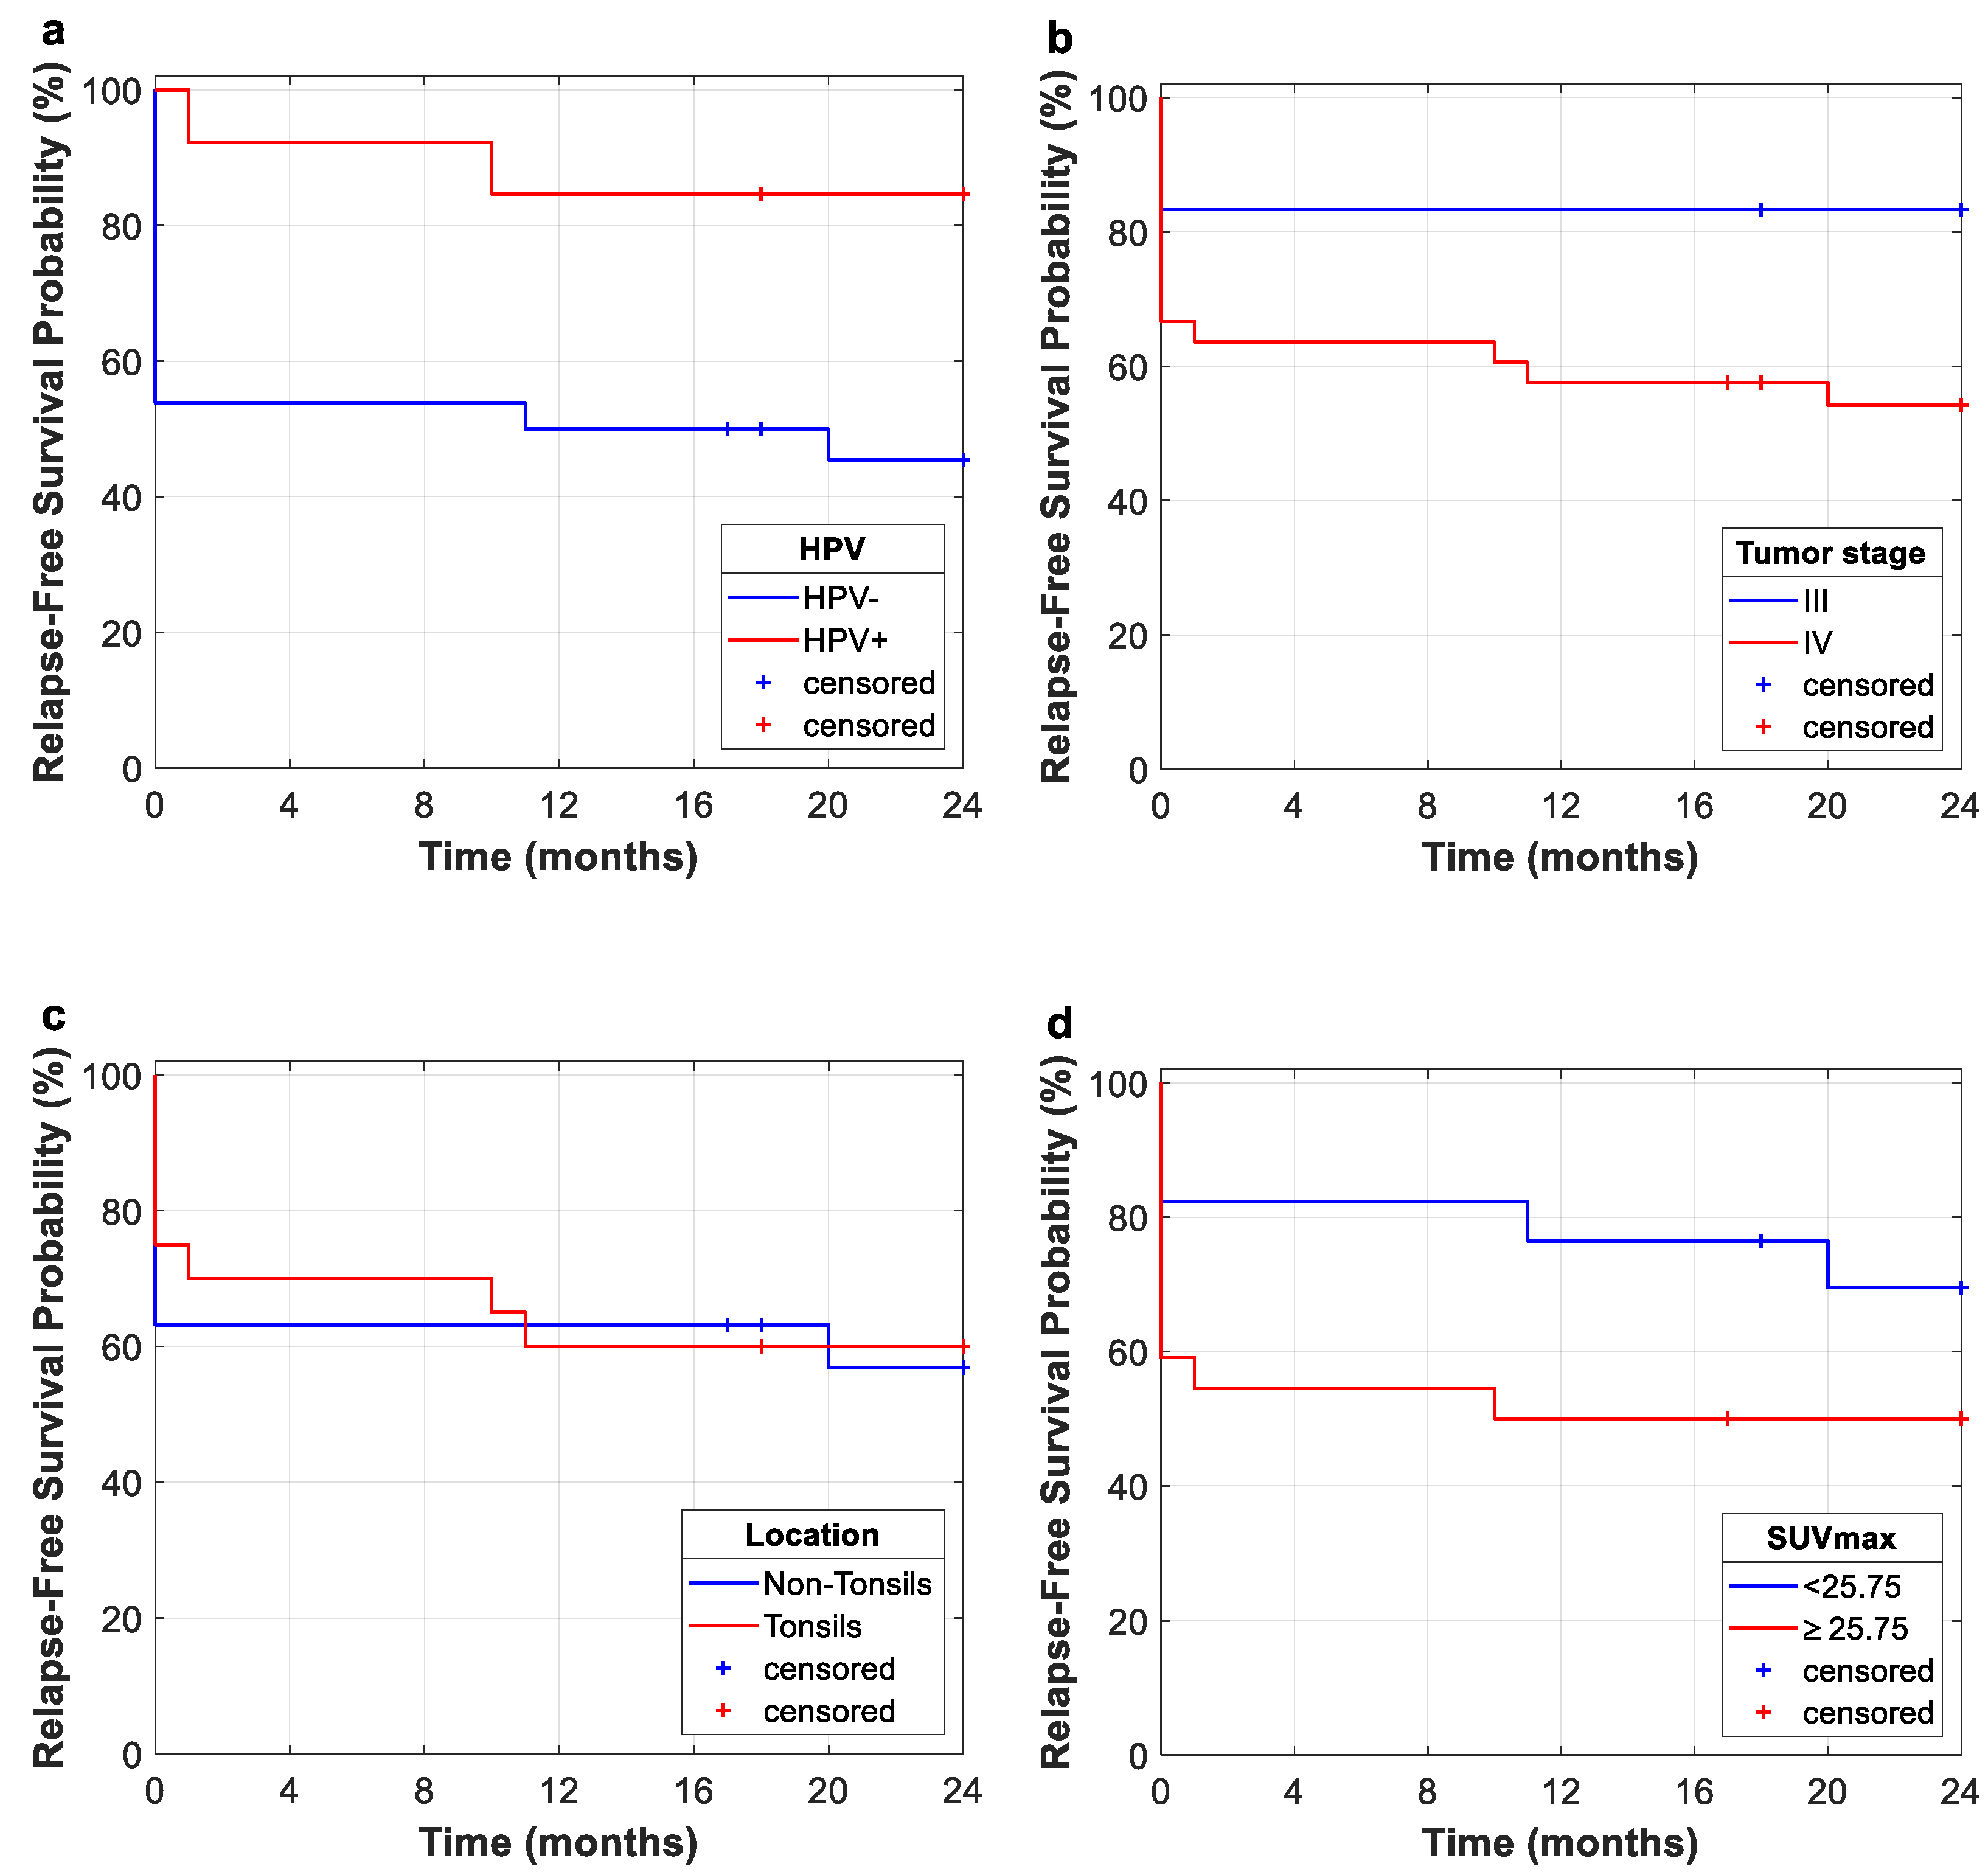
This study evidences the importance of HPV status for the prognosis of oropharyngeal cancer for OS and RFS. In this study, Kaplan–Meier curves for OS and RFS showed that HPV-negative diagnosis is related to poorer outcomes. However, future clinical trials should include a greater variety of patients in order to further study the implications of HPV status. This fact suggests that within the group of patients who respond satisfactorily, the vast majority achieve a sustained response, with low rates of relapse. As shown in Kaplan–Meier curves, several retrospective studies have demonstrated that patients with HPV-positive status have a better prognosis than patients with HPV-negative status, especially those patients with oropharyngeal carcinoma. This is due to the fact that HPV-positive cases are identified as a tumor entities with different biological, pathological, and clinical features [37,38]. Consequently, a better OS and RFS is expected in these patients.
The fact that most of our cohort are stage IV (84.64%) may explain the low rates of OS and RFS, along with the inclusion of tumor persistence as relapse cases. Nevertheless, the Kaplan–Meier curve for the entire study cohort shows that no relapse occurs after 20 months from the end of treatment (radiotherapy or radiotherapy plus surgery), which suggests that within the group of patients who respond satisfactorily, the vast majority achieve a sustained response, with low rates of relapse.
Most patients in our database are smokers (92.31%), which hinders finding differences between smokers and non-smokers in terms of survival, as well as differences between HPV-positive and HPV-negative smokers. Nevertheless, various studies have evidenced that HPV-positive patients with a smoking history have worse treatment outcomes and an increased risk of death. The specific impact of tobacco remains unknown, but it could have an effect by inducing additional genetic alterations or, indeed, provoking other disorders such as cardiac or respiratory diseases [38,39].
As well as HPV, other clinical features are evaluated for survival analysis. Tumor stage and localization are important features to characterize the tumor obtaining high HR for every analysis, but no statistically significant relationship to survival rates was observed. On the other hand, greater values of some quantitative features, such as SUVmax, TLG, and MTV, are in all cases related to a poorer prognosis [2,3]. Nonetheless, volumetric features (MTV and TLG) turn out to be better predictors than SUV measures. The prognostic value of TLG can be highlighted, with higher values being related to lower survival rates in Kaplan–Meier (p = 0.029) and Cox regression analyses (p = 0.001) for OS. TLG demonstrated a prognostic value in RFS analysis as well, being related to higher relapse rates in Kaplan–Meier (p = 0.010) and Cox regression analyses (p = 0.026). It is worth mentioning that Surface resulted in a great prognostic feature in the OS Cox regression analysis (p = 0.001), being, along with TLG, the unique feature that remained statistically significant after multiple-testing correction. This shape feature also was a statistically significant predictor for RFS Kaplan–Meier (p = 0.004) and Cox regression (p = 0.028) analyses, with higher values related to poorer prognosis.
Although several studies have demonstrated the utility of SUV metrics as well as metabolic features such as TLG and MTV to predict clinical outcomes in head and neck cancer [3,7,10], they do not reflect information of intratumoral heterogeneity. Spatial distribution of metabolic activity in the tumor can be evaluated through textural image features describing spatial relationships between pixel intensities [8,14,15]. Recent studies have shown the potential of texture analysis to reveal intratumoral heterogeneity, which can lead to poor prognosis in head and neck cancer [8,17,18]. Our analyses suggest heterogeneity patterns with respect to gray-level non-uniformity matrixes (GLRLM and GLZLM).
Cox regression analyses for 2-year OS showed that gray-level texture indices (GLRLM_RLNU, GLZLM_GLNU and GLZLM_ZLNU) result in poorer prognosis for higher values of these indices. This fact is reflected by means of the HR for these image features (GLRLM_RLNU, HR = 1.002 (1.000–1.003), p = 0.043; GLZLM_GLNU, HR = 1.069 (1.005–1.137), p = 0.033; GLZLM_ZLNU, HR = 1.017 (1.005–1.030), p = 0.007). Additionally, RFS Cox regression analysis revealed higher relapse rates for higher values of GLZLM_ZLNU (HR = 1.011 (1.001–1.022), p = 0.031). As mentioned, recent studies have supported the assumption of higher intratumoral heterogeneity being related to poorer outcomes [8,17,18]. Specifically, these three textural features have also been found to be prognostic factors in head and neck cancer by previous studies [13,19,20]. This premise is reinforced in univariate RFS analysis. Log-rank tests for 2-year follow-up reflect differences in RFS rates for zone-length non-uniformity (GLZLM_ZLNU) (p = 0.001), with the better prognosis related to lower values (SR: 78.4% vs. SR: 26.7%, low- and high-value subgroups, respectively), i.e., higher intratumoral heterogeneity means poorer prognosis. RFS Kaplan–Meier results remained statistically significant after multiple-testing correction. Additional textural features were statistically significant in RFS Kaplan–Meier (GLCM_Entropy, p = 0.023; NGLDM_Busyness, p = 0.040; GLZLM_GLNU, p = 0.047) analysis. However, this may be due to the small size of the cohort; these results were not statistically significant after multiple-testing correction. Cox regression analyses adjusted by HPV status did not demonstrate the influence of HPV in the outcomes of OS or RFS, since the results showed that some variables are influenced by this factor, obtaining lower p-values, while others are not, making it no longer significant. Further studies involving greater cohorts are needed to prove these findings. Limitations of this study include a small cohort of patients, considering that 7 patients out of the 46 total subjects were excluded due to tumor stage or size. In addition, the database is unbalanced (36 male and 3 female, 36 smokers and 3 non-smokers, and 26 HPV-negative and 13 HPV-positive). Therefore, no differences between smokers and non-smokers, nor differences between HPV-positive and HPV-negative smokers, could be evaluated. Another limitation is the number of radiomic features analyzed, as other studies evaluate hundreds of characteristics, such as in [12,25], while this study is limited to the LIFEx feature extraction. In addition, only survival and univariate analyses are performed, while machine learning models were developed previously by other authors [40,41]. For future works, it is proposed to analyze a larger and more balanced (sex, smoker, and HPV status) database and a larger group of radiomic characteristics, also by using machine learning models.

5. Conclusions

[18F]FDG PET/CT is a non-invasive imaging modality that can provide valuable information about tumor metabolic activity. [18F]FDG PET image quantification has been widely used for head and neck cancer assessment. TLG turns out to be a strong predictor for prognosis in our patient population. Textural indices seem to be a promising tool in oncological management. Several gray-level matrix textural features have shown to be possible predictors of poorer clinical outcomes in our analyses (GLRLM_RLNU, GLZLM_ZLNU and GLZM_GLNU).

Author Contributions

All authors contributed to the conceptualization of the work, the investigation, and the review and editing of the manuscript. D.P.-F., E.M., Á.G., M.S.-O. and J.J.-A. were responsible for the data curation. D.P.-F., E.M., Á.G., M.S.-O., A.P.S. and P.S.-G. were responsible for methodology and validation, ensuring the reproducibility of the results. D.P.-F. and E.M. were responsible for the software. D.P.-F., E.M., A.P.S. and P.S.-G. were responsible for the formal analysis, the writing—original draft, and visualization of the published work. A.G.-G., S.R.-S., A.R.-A. and E.J.G. and M.J.T. were responsible for providing the resources. P.S.-G. was responsible for the supervision. All authors have read and agreed to the published version of the manuscript.

Funding

This research received no external funding.

Institutional Review Board Statement

The study was conducted according to the guidelines of the Declaration of Helsinki and approved by the Institutional Review Board (or Ethics Committee) of Hospital Universitario 12 de Octubre (protocol code 23/649).

Informed Consent Statement

All investigators had the responsibility to obtain written informed consent from patients. All data were circulated anonymously. All patients included in this study provided written informed consent.

Data Availability Statement

The data presented in this study are available on request from the corresponding authors. The data are not publicly available due to clinical patient information.

Acknowledgments

The author E. Milara received financial support through a predoctoral fellowship (Ayuda del Programa Propio de I+D+i 2020) from Universidad Politécnica de Madrid, Spain. The project was partially supported by COVITECH-CM (Plataforma científico-tecnológica para alerta, diagnóstico, pronóstico, terapia y seguimiento de la enfermedad COVID19 y futuras pandemias) and REACT-UE through the European Regional Development Fund (ERDF), the European Social Fund (EFS), and the Fund for European Aid to the Most Deprived (FEAD).

Conflicts of Interest

The authors declare no conflict of interest.

References

  1. Moon, S.H.; Hyun, S.H.; Choi, J.Y. Prognostic Significance of Volume-Based PET Parameters in Cancer Patients. Korean J. Radiol. 2013, 14, 1–12. [Google Scholar] [CrossRef]
  2. Torizuka, T.; Tanizaki, Y.; Kanno, T.; Futatsubashi, M.; Naitou, K.; Ueda, Y.; Ouchi, Y. Prognostic Value of 18F-FDG PET in Patients with Head and Neck Squamous Cell Cancer. Am. J. Roentgenol. 2009, 192, 156–161. [Google Scholar] [CrossRef]
  3. Pak, K.; Cheon, G.J.; Nam, H.; Kim, S.; Kang, K.W.; Chung, J.; Kim, E.E.; Lee, D.S. Prognostic Value of Metabolic Tumor Volume and Total Lesion Glycolysis in Head and Neck Cancer: A Systematic Review and Meta-Analysis. J. Nucl. Med. 2014, 55, 884–890. [Google Scholar] [CrossRef] [PubMed]
  4. Machczyński, P.; Majchrzak, E.; Niewinski, P.; Marchlewska, J.; Golusiński, W. A Review of the 8th Edition of the AJCC Staging System for Oropharyngeal Cancer According to HPV Status. Eur. Arch. Oto-Rhino-Laryngol. 2020, 277, 2407–2412. [Google Scholar] [CrossRef]
  5. Denaro, N.; Merlano, M.C.; Russi, E.G. Follow-up in Head and Neck Cancer: Do More Does It Mean Do Better? A Systematic Review and Our Proposal Based on Our Experience. Clin. Exp. Otorhinolaryngol. 2016, 9, 287–297. [Google Scholar] [CrossRef] [PubMed]
  6. Asheer, J.; Jensen, J.S.; Grønhøj, C.; Jakobsen, K.K.; Von Buchwald, C. Rate of Locoregional Recurrence among Patients with Oropharyngeal Squamous Cell Carcinoma with Known HPV Status: A Systematic Review. Acta Oncol. 2020, 59, 1131–1136. [Google Scholar] [CrossRef]
  7. Bonomo, P.; Merlotti, A.; Olmetto, E.; Bianchi, A.; Desideri, I.; Bacigalupo, A.; Franco, P.; Franzese, C.; Orlandi, E.; Livi, L.; et al. What Is the Prognostic Impact of FDG PET in Locally Advanced Head and Neck Squamous Cell Carcinoma Treated with Concomitant Chemo-Radiotherapy? A Systematic Review and Meta-Analysis. Eur. J. Nucl. Med. Mol. Imaging 2018, 45, 2122–2138. [Google Scholar] [CrossRef]
  8. Lee, J.W.; Lee, S.M. Radiomics in Oncological PET/CT: Clinical Applications. Nucl. Med. Mol. Imaging 2018, 52, 170–189. [Google Scholar] [CrossRef] [PubMed]
  9. Johansen, J.; Buus, S.; Loft, A.; Keiding, S.; Overgaard, M.; Hansen, H.S.; Grau, C.; Bundgaard, T.; Kirkegaard, J.; Overgaard, J. Prospective Study of 18FDG-PET in the Detection and Management of Patients with Lymph Node Metastases to the Neck from an Unknown Primary Tumor. Results from the Dahanca-13 Study. Head Neck 2007, 30, 471–478. [Google Scholar] [CrossRef]
  10. Creff, G.; Devillers, A.; Depeursinge, A.; Palard-Novello, X.; Acosta, O.; Jegoux, F.; Castelli, J. Evaluation of the Prognostic Value of FDG PET/CT Parameters for Patients with Surgically Treated Head and Neck Cancer: A Systematic Review. JAMA Otolaryngol. Head Neck Surg. 2020, 146, 471–479. [Google Scholar] [CrossRef]
  11. Morland, D.; Triumbari, E.K.A.; Boldrini, L.; Gatta, R.; Pizzuto, D.; Annunziata, S. Radiomics in Oncological PET Imaging: A Systematic Review—Part 1, Supradiaphragmatic Cancers. Diagnostics 2022, 12, 1329. [Google Scholar] [CrossRef]
  12. Martens, R.M.; Koopman, T.; Noij, D.P.; Pfaehler, E.; Übelhör, C.; Sharma, S.; Vergeer, M.R.; Leemans, C.R.; Hoekstra, O.S.; Yaqub, M.; et al. Predictive Value of Quantitative 18F-FDG-PET Radiomics Analysis in Patients with Head and Neck Squamous Cell Carcinoma. EJNMMI Res. 2020, 10, 102. [Google Scholar] [CrossRef]
  13. Vallières, M.; Kay-Rivest, E.; Perrin, L.J.; Liem, X.; Furstoss, C.; Aerts, H.J.W.L.; Khaouam, N.; Nguyen-Tan, P.F.; Wang, C.S.; Sultanem, K.; et al. Radiomics Strategies for Risk Assessment of Tumour Failure in Head-and-Neck Cancer. Sci. Rep. 2017, 7, 10117. [Google Scholar] [CrossRef]
  14. Ha, S.; Choi, H.; Paeng, J.C.; Cheon, G.J. Radiomics in Oncological PET/CT: A Methodological Overview. Nucl. Med. Mol. Imaging 2019, 53, 14–29. [Google Scholar] [CrossRef] [PubMed]
  15. Lambin, P.; Rios-Velazquez, E.; Leijenaar, R.; Carvalho, S.; van Stiphout, R.G.P.M.; Granton, P.; Zegers, C.M.L.; Gillies, R.; Boellard, R.; Dekker, A.; et al. Radiomics: Extracting More Information from Medical Images Using Advanced Feature Analysis. Eur. J. Cancer 2012, 48, 441–446. [Google Scholar] [CrossRef] [PubMed]
  16. Niehr, F.; Eder, T.; Pilz, T.; Konschak, R.; Treue, D.; Klauschen, F.; Bockmayr, M.; Türkmen, S.; Jöhrens, K.; Budach, V.; et al. Multilayered Omics-Based Analysis of a Head and Neck Cancer Model of Cisplatin Resistance Reveals Intratumoral Heterogeneity and Treatment-Induced Clonal Selection. Clin. Cancer Res. 2018, 24, 158–168. [Google Scholar] [CrossRef] [PubMed]
  17. Choi, J.; Gim, J.A.; Oh, C.; Ha, S.; Lee, H.; Choi, H.; Im, H.J. Association of Metabolic and Genetic Heterogeneity in Head and Neck Squamous Cell Carcinoma with Prognostic Implications: Integration of FDG PET and Genomic Analysis. EJNMMI Res. 2019, 9, 97. [Google Scholar] [CrossRef] [PubMed]
  18. Bogowicz, M.; Riesterer, O.; Stark, L.S.; Studer, G.; Unkelbach, J.; Guckenberger, M.; Tanadini-Lang, S. Comparison of PET and CT Radiomics for Prediction of Local Tumor Control in Head and Neck Squamous Cell Carcinoma. Acta Oncol. 2017, 56, 1531–1536. [Google Scholar] [CrossRef]
  19. Chen, S.W.; Shen, W.C.; Lin, Y.C.; Chen, R.Y.; Hsieh, T.C.; Yen, K.Y.; Kao, C.H. Correlation of Pretreatment 18F-FDG PET Tumor Textural Features with Gene Expression in Pharyngeal Cancer and Implications for Radiotherapy-Based Treatment Outcomes. Eur. J. Nucl. Med. Mol. Imaging 2017, 44, 567–580. [Google Scholar] [CrossRef] [PubMed]
  20. Yoon, H.; Ha, S.; Kwon, S.J.; Park, S.Y.; Kim, J.; Yoo, I.R. Prognostic Value of Tumor Metabolic Imaging Phenotype by FDG PET Radiomics in HNSCC. Ann. Nucl. Med. 2021, 35, 370–377. [Google Scholar] [CrossRef]
  21. Lovinfosse, P.; Polus, M.; van Daele, D.; Martinive, P.; Daenen, F.; Hatt, M.; Visvikis, D.; Koopmansch, B.; Lambert, F.; Coimbra, C.; et al. FDG PET/CT Radiomics for Predicting the Outcome of Locally Advanced Rectal Cancer. Eur. J. Nucl. Med. Mol. Imaging 2018, 45, 365–375. [Google Scholar] [CrossRef]
  22. Dittrich, D.; Pyka, T.; Scheidhauer, K.; Lütje, S.; Essler, M.; Bundschuh, R.A. Textural Features in FDG-PET/CT Can Predict Outcome in Melanoma Patients to Treatment with Vemurafenib and Ipililumab. Nuklearmedizin 2020, 59, 228–234. [Google Scholar] [CrossRef]
  23. Cheng, N.M.; Fang, Y.H.D.; Lee, L.Y.; Chang, J.T.C.; Tsan, D.L.; Ng, S.H.; Wang, H.M.; Liao, C.T.; Yang, L.Y.; Hsu, C.H.; et al. Zone-Size Nonuniformity of 18F-FDG PET Regional Textural Features Predicts Survival in Patients with Oropharyngeal Cancer. Eur. J. Nucl. Med. Mol. Imaging 2015, 42, 419–428. [Google Scholar] [CrossRef]
  24. Cheng, N.-M.; Dean Fang, Y.-H.; Tung-Chieh Chang, J.; Huang, C.-G.; Tsan, D.-L.; Ng, S.-H.; Wang, H.-M.; Lin, C.-Y.; Liao, C.-T.; Yen, T.-C. Textural Features of Pretreatment 18 F-FDG PET/CT Images: Prognostic Significance in Patients with Advanced T-Stage Oropharyngeal Squamous Cell Carcinoma. J. Nucl. Med. 2013, 54, 1703–1709. [Google Scholar] [CrossRef] [PubMed]
  25. Haider, S.P.; Mahajan, A.; Zeevi, T.; Baumeister, P.; Reichel, C.; Sharaf, K.; Forghani, R.; Kucukkaya, A.S.; Kann, B.H.; Judson, B.L.; et al. PET/CT Radiomics Signature of Human Papilloma Virus Association in Oropharyngeal Squamous Cell Carcinoma. Eur. J. Nucl. Med. Mol. Imaging 2020, 47, 2978–2991. [Google Scholar] [CrossRef] [PubMed]
  26. Liao, K.Y.-K.; Chiu, C.-C.; Chiang, W.-C.; Chiou, Y.-R.; Zhang, G.; Yang, S.-N.; Huang, T.-C. Radiomics Features Analysis of PET Images in Oropharyngeal and Hypopharyngeal Cancer. Medicine 2019, 98, e15446. [Google Scholar] [CrossRef] [PubMed]
  27. Nioche, C.; Orlhac, F.; Boughdad, S.; Reuze, S.; Goya-Outi, J.; Robert, C.; Pellot-Barakat, C.; Soussan, M.; Frouin, F.E.; Buvat, I. Lifex: A Freeware for Radiomic Feature Calculation in Multimodality Imaging to Accelerate Advances in the Characterization of Tumor Heterogeneity. Cancer Res. 2018, 78, 4786–4789. [Google Scholar] [CrossRef] [PubMed]
  28. Boellaard, R.; Delgado-Bolton, R.; Oyen, W.J.G.; Giammarile, F.; Tatsch, K.; Eschner, W.; Verzijlbergen, F.J.; Barrington, S.F.; Pike, L.C.; Weber, W.A.; et al. FDG PET/CT: EANM Procedure Guidelines for Tumour Imaging: Version 2.0. Eur. J. Nucl. Med. Mol. Imaging 2015, 42, 328–354. [Google Scholar] [CrossRef] [PubMed]
  29. Guezennec, C.; Bourhis, D.; Orlhac, F.; Robin, P.; Corre, J.B.; Delcroix, O.; Gobel, Y.; Schick, U.; Salaün, P.Y.; Abgral, R. Inter-Observer and Segmentation Method Variability of Textural Analysis in Pretherapeutic FDG PET/CT in Head and Neck Cancer. PLoS ONE 2019, 14, e0214299. [Google Scholar] [CrossRef] [PubMed]
  30. Haralick, R.M.; Dinstein, I.; Shanmugam, K. Textural Features for Image Classification. IEEE Trans. Syst. Man Cybern. 1973, SMC-3, 610–621. [Google Scholar] [CrossRef]
  31. Amadasun, M.; King, R. Texural Features Corresponding to Texural Properties. IEEE Trans. Syst. Man Cybern. 1989, 19, 1264–1274. [Google Scholar] [CrossRef]
  32. Xu, D.H.; Kurani, A.S.; Furst, J.D.; Raicu, D.S. Run-Length Encoding for Volumetric Texture. Heart 2004, 27, 452–458. [Google Scholar]
  33. Thibault, G.; Fertil, B.; Navarro, C.; Pereira, S.; Cau, P.; Levy, N.; Sequeira, J.; Mari, J.L. Shape and Texture Indexes Application to Cell Nuclei Classification. Int. J. Pattern Recognit. Artif. Intell. 2013, 27, 1357002. [Google Scholar] [CrossRef]
  34. Praveen, S.; Tyagi, N.; Singh, B.; Karetla, G.R.; Thalor, M.A.; Joshi, K.; Tsegaye, M. PSO-Based Evolutionary Approach to Optimize Head and Neck Biomedical Image to Detect Mesothelioma Cancer. Biomed Res. Int. 2022, 2022, 3618197. [Google Scholar] [CrossRef] [PubMed]
  35. Chen, B.Q.; Zhao, Y.; Zhang, Y.; Pan, Y.J.; Xia, H.Y.; Kankala, R.K.; Wang, S.B.; Liu, G.; Chen, A.Z. Immune-Regulating Camouflaged Nanoplatforms: A Promising Strategy to Improve Cancer Nano-Immunotherapy. Bioact. Mater. 2023, 21, 1–19. [Google Scholar] [CrossRef]
  36. Jang, J.; Kim, Y.; Kim, J.-H.; Cho, S.-M.; Lee, K.-A. Cost-Effectiveness Analysis of Germline and Somatic BRCA Testing in Patients with Advanced Ovarian Cancer. Ann. Lab. Med. 2023, 43, 73–81. [Google Scholar] [CrossRef]
  37. Schache, A. Human Papillomavirus and Survival of Patients with Oropharyngeal Cancer. In 50 Landmark Papers Every Oral & Maxillofacial Surgeon Should Know; CRC Press: Boca Raton, FL, USA, 2020; pp. 31–36. [Google Scholar] [CrossRef]
  38. Vatca, M.; Lucas, J.T.; Laudadio, J.; D’Agostino, R.B.; Waltonen, J.D.; Sullivan, C.A.; Rouchard-Plasser, R.; Matsangou, M.; Browne, J.D.; Greven, K.M.; et al. Retrospective Analysis of the Impact of HPV Status and Smoking on Mucositis in Patients with Oropharyngeal Squamous Cell Carcinoma Treated with Concurrent Chemotherapy and Radiotherapy. Oral Oncol. 2014, 50, 869–876. [Google Scholar] [CrossRef]
  39. Mirghani, H.; Leroy, C.; Chekourry, Y.; Casiraghi, O.; Aupérin, A.; Tao, Y.; Nguyen, F.; Caroline, E.; Breuskin, I.; Plana, A.M.; et al. Smoking Impact on HPV Driven Head and Neck Cancer’s Oncological Outcomes? Oral Oncol. 2018, 82, 131–137. [Google Scholar] [CrossRef]
  40. Folkert, M.R.; Setton, J.; Apte, A.P.; Grkovski, M.; Young, R.J.; Schöder, H.; Thorstad, W.L.; Lee, N.Y.; Deasy, J.O.; Oh, J.H. Predictive Modeling of Outcomes Following Definitive Chemoradiotherapy for Oropharyngeal Cancer Based on FDG-PET Image Characteristics. Phys. Med. Biol. 2017, 62, 5327–5343. [Google Scholar] [CrossRef]
  41. Fujima, N.; Andreu-Arasa, V.C.; Meibom, S.K.; Mercier, G.A.; Truong, M.T.; Hirata, K.; Yasuda, K.; Kano, S.; Homma, A.; Kudo, K.; et al. Prediction of the Local Treatment Outcome in Patients with Oropharyngeal Squamous Cell Carcinoma Using Deep Learning Analysis of Pretreatment FDG-PET Images. BMC Cancer 2021, 21, 900. [Google Scholar] [CrossRef]
Figure 1. Methodology workflow diagram.
Applsci 14 01454 g001
Figure 2. Fifty-eight-year-old male with squamous cell carcinoma of the right tonsil, which is shown to invade adjacent spaces of the oropharynx; especially significant is the invasion of muscular and adipose tissue nearby. Moreover, the tumor causes a reduction of the airway diameter. Intense and homogeneous [18F]FDG uptake is seen in all the malignant tissue as usually identified in these tumors. PET-CT in this case was also used for radiotherapy planning and as a basal study for therapeutic response in subsequent studies.
Applsci 14 01454 g002
Figure 3. Kaplan-Meier curves of OS analysis for 2-year follow-up. Relevant clinical features are shown. (a): HPV; (b): tumor stage; (c): tumor location; (d): SUVmax. The Kaplan-Meier curve for smokers is not included due to the lack of representativeness of the non-smoker group.
Applsci 14 01454 g003aApplsci 14 01454 g003b
Figure 4. Kaplan-Meier curves of RFS for 2-year follow-up. Relevant clinical features are shown. (a): HPV; (b): tumor stage; (c): tumor location; (d): SUVmax. The Kaplan-Meier curve for smokers is not included due to the lack of representativeness of the non-smoker group.
Applsci 14 01454 g004
Table 1. Demographic and clinical features of patients.
Number (%)
Total patients39
Male patients36 (92.31)
Age, years (median, range)66 (53–82)
Dose, Gy (median, range)7000 (6572–7200)
Chemotherapy
  Cisplatin23 (58.97)
  Cetuximab13 (33.33)
Tumor stage
  III6 (15.38)
  IV33 (84.62)
HPV status
  HPV-positive13 (33.33)
  HPV-negative26 (66.67)
Tumor site
  Palate1 (2.56)
  Soft palate3 (7.69)
  Tongue base9 (23.08)
  Tonsils20 (51.28)
  Side wall4 (10.26)
  Rear wall2 (5.13)
Smoker status
  Smoker36 (92.31)
  Non-smoker3 (7.69)
Surgery16 (41.03)
Follow-up time (median, range)38 (6–125)
Relapse4 (10.26)
Death19 (48.72)
Table 2. Univariate overall survival rates and log-rank tests for 2-year follow-up of relevant clinical characteristics, SUVmax, and significant image features before multiple-testing correction by means of the Benjamini–Hochberg procedure. No p-value was significant after multiple-testing correction.
Optimal Cut-off ValueSurvival Rate (%)p-Value (Log-Rank Test)
HPVNegative (−)57.00.037
Positive (+)92.3
Tumor stageIII-0.100
IV63.2
LocationNon-Tonsils73.00.553
Tonsils65.0
SmokerSmoker66.30.270
Non-Smoker-
SUVmax<21.8274.80.325
≥21.8260.0
TLG<122.2982.40.029
≥122.2950.0
Table 5. Univariate relapse-free survival rates and log-rank tests for 2-year follow-up of relevant clinical characteristics and significant image features. * Statistically significant p-value after multiple-testing correction by means of the Benjamini–Hochberg procedure.
Optimal Cut-off ValueSurvival Rate (%)p-Value (Log-Rank Test)
HPVNegative (−)45.50.023
Positive (+)84.6
Tumor stageIII83.30.220
IV54.2
LocationNon-Tonsils56.80.869
Tonsils60.0
SmokerSmoker55.10.165
Non-Smoker-
SUVmax<25.7569.50.177
≥25.7550.0
TLG<176.3680.90.010
≥176.3640.9
MTV<11.2278.90.006
≥11.2236.8
Surface<4286.0682.10.004
≥4286.0638.1
GLCM Entropy<2.1173.00.023
≥2.1137.5
NGLDM Busyness<0.2680.00.040
≥0.2645.0
GLZLM GLNU<14.1171.80.047
≥14.1141.2
GLZLM ZLNU<75.1378.40.001 *
≥75.1326.7
Table 6. Cox regression analysis for relapse-free survival for 2-year follow-up of relevant clinical characteristics and statistically significant image features. No p-value was significant after multiple-testing correction.
Univariate
HR (95% CI)p-Value
HPV0.243 (0.055–1.077)0.063
Tumor stage2.934 (0.387–22.200)0.298
Location0.930 (0.349–2.480)0.884
Smoker23.320 (0.011–4.73 × 10⁴)0.418
SUVmax1.017 (0.962–1.074)0.560
TLG1.003 (1.000–1.006)0.026
Sphericity0.002 (0.000–0.605)0.033
Surface1.000 (1.000–1.000)0.028
GLZLM ZLNU1.011 (1.001–1.022)0.031
After the adjustment for the HPV status variable, none of the characteristic proved to be significant in predicting clinical outcome in RFS (see Table 7). However, both tumor stage (HR = 3.624 (0.484–27.127), p = 0.210) and SUVmax (HR = 1.019 (0.974–1.067), p = 0.407) resulted in better p-values.
Table 7. Cox regression analyses for relapse-free survival for 2-year follow-up of relevant clinical characteristics and significant image features adjusted for the HPV status variable before multiple-testing correction by means of the Benjamini–Hochberg procedure. No p-value was significant after multiple-testing correction.
Univariate
HR (95% CI)p-Value
Tumor stage3.624 (0.484–27.127)0.210
Location0.973 (0.412–2.295)0.949
Smoker6.883 × 105 (0.000–)0.987
SUVmax1.019 (0.974–1.067)0.407
Disclaimer/Publisher’s Note: The statements, opinions and data contained in all publications are solely those of the individual author(s) and contributor(s) and not of MDPI and/or the editor(s). MDPI and/or the editor(s) disclaim responsibility for any injury to people or property resulting from any ideas, methods, instructions or products referred to in the content.

