
The Effects of a Simulated Duathlon on Trunk Motion: A Sensor Based Approach


Abstract
1. Introduction
2. Methods
2.1. Participants
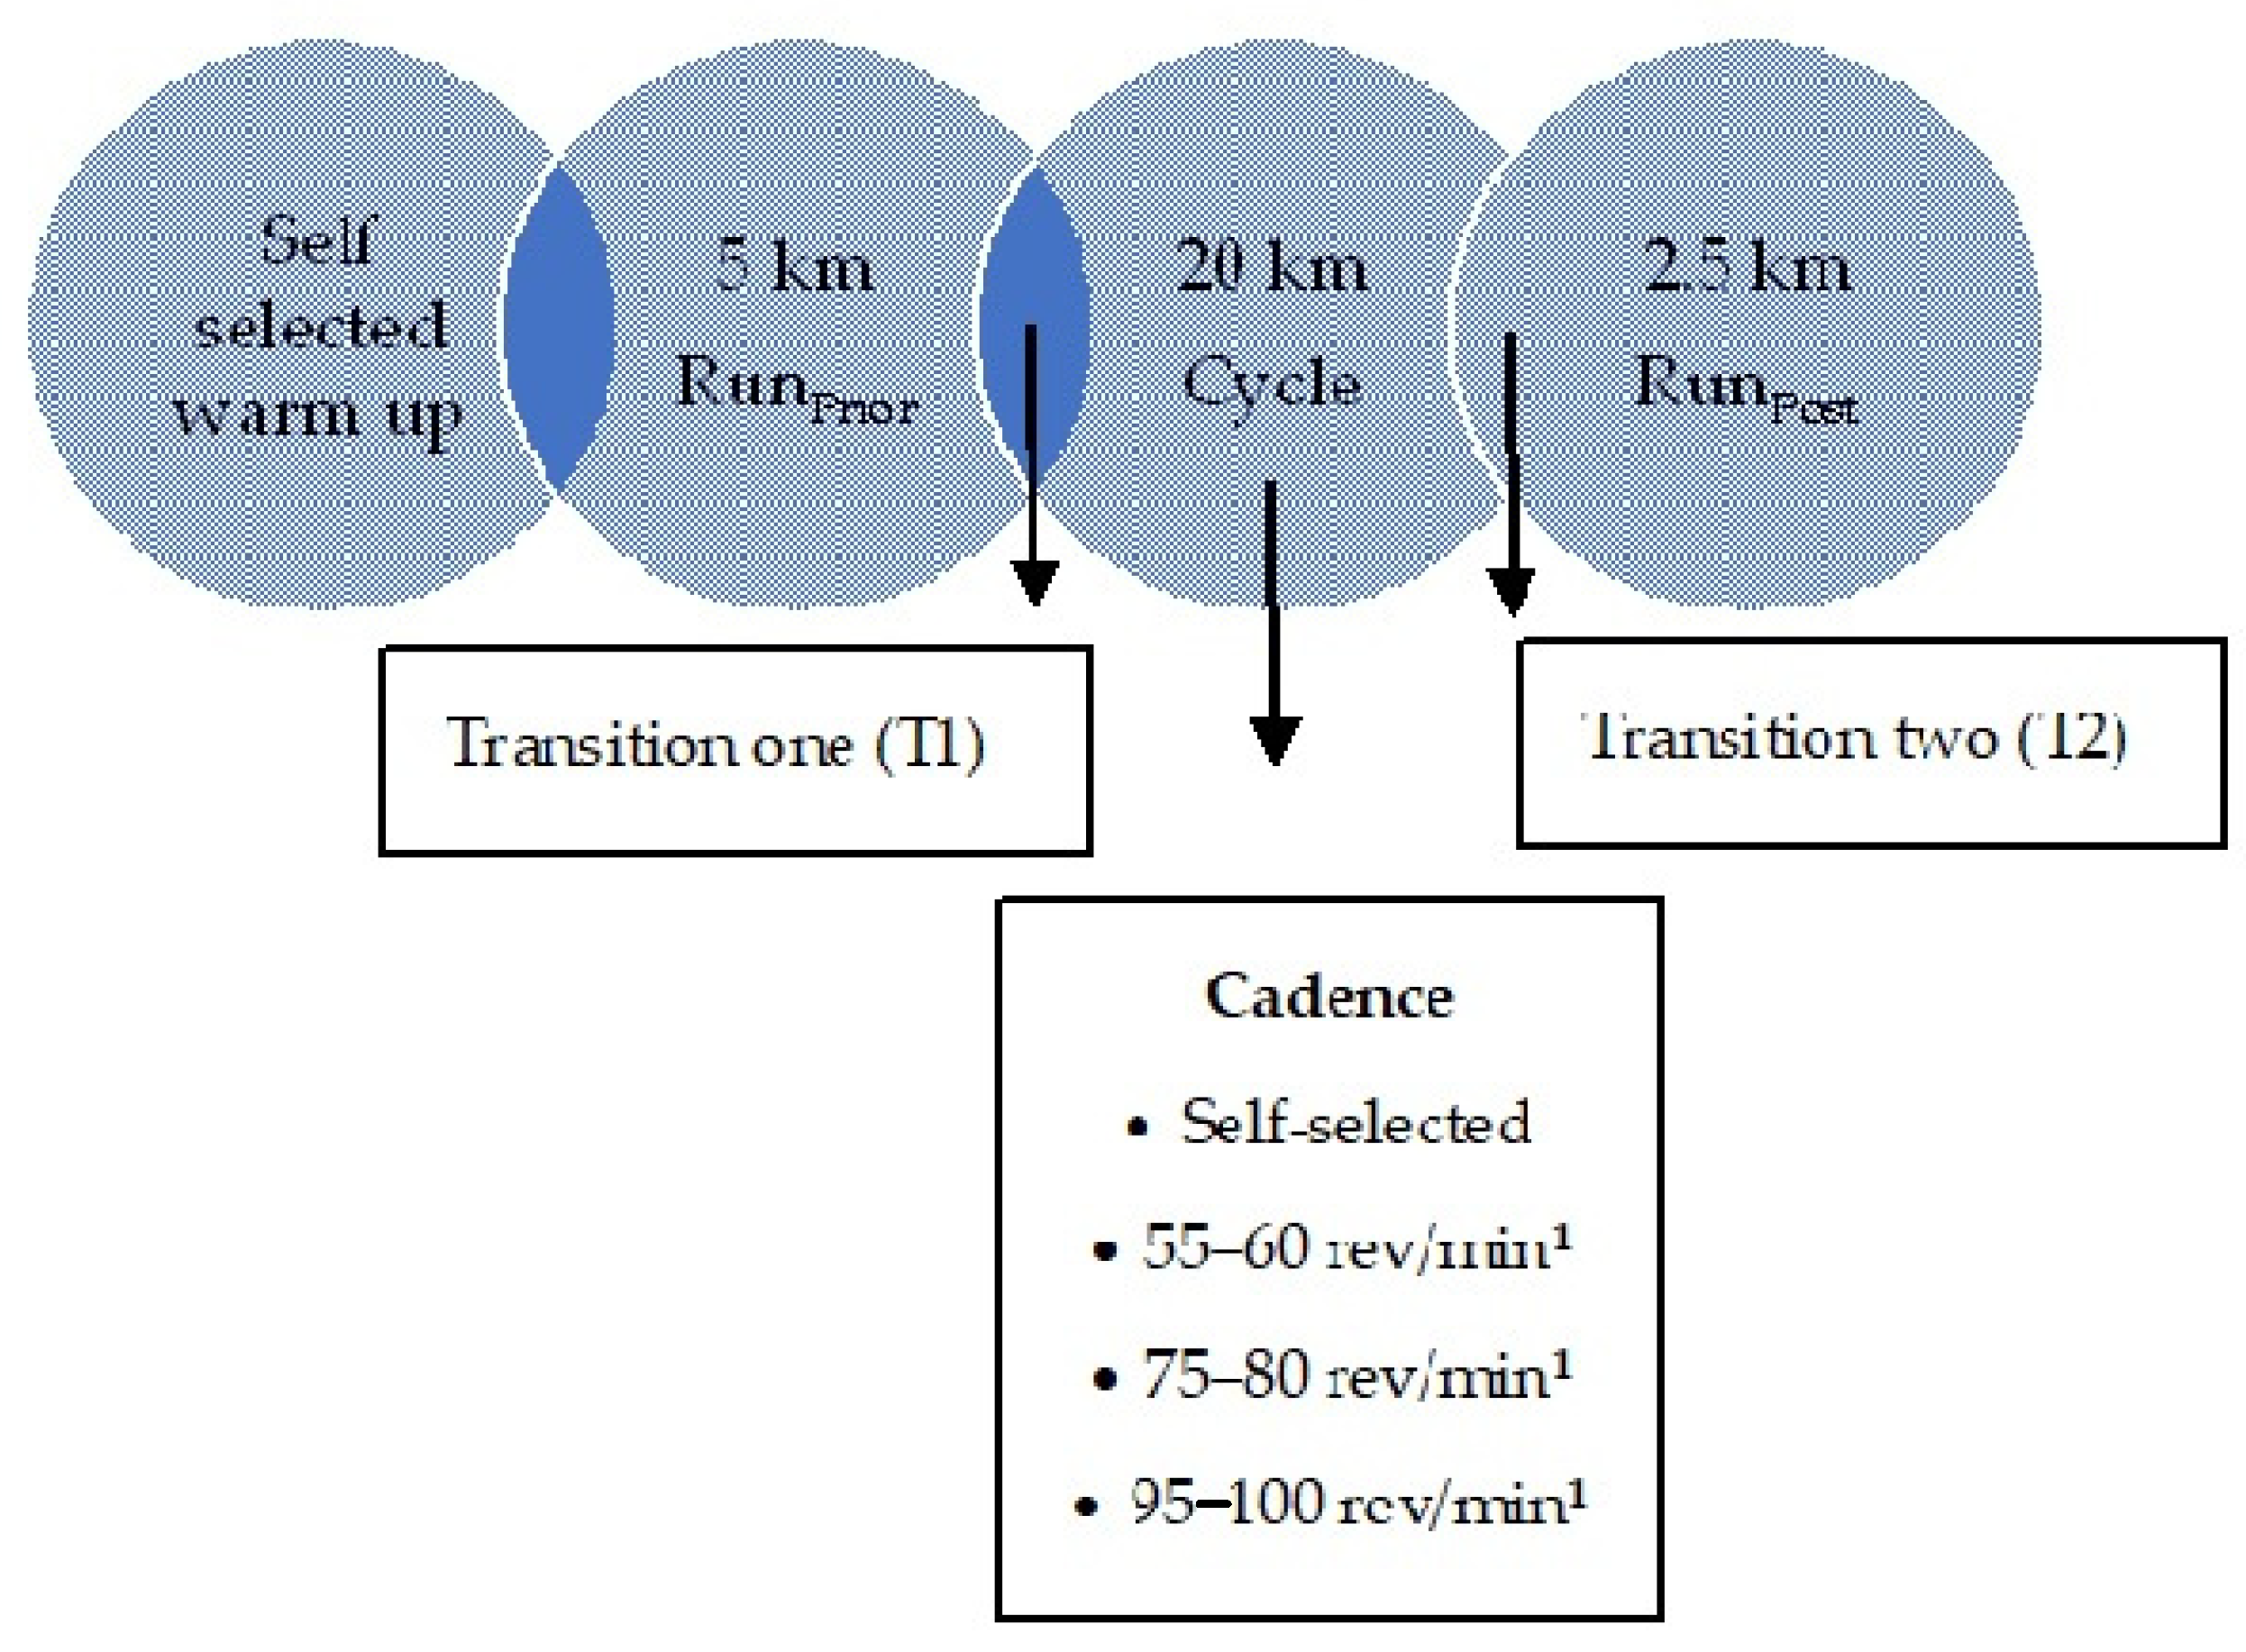
2.2. Overview
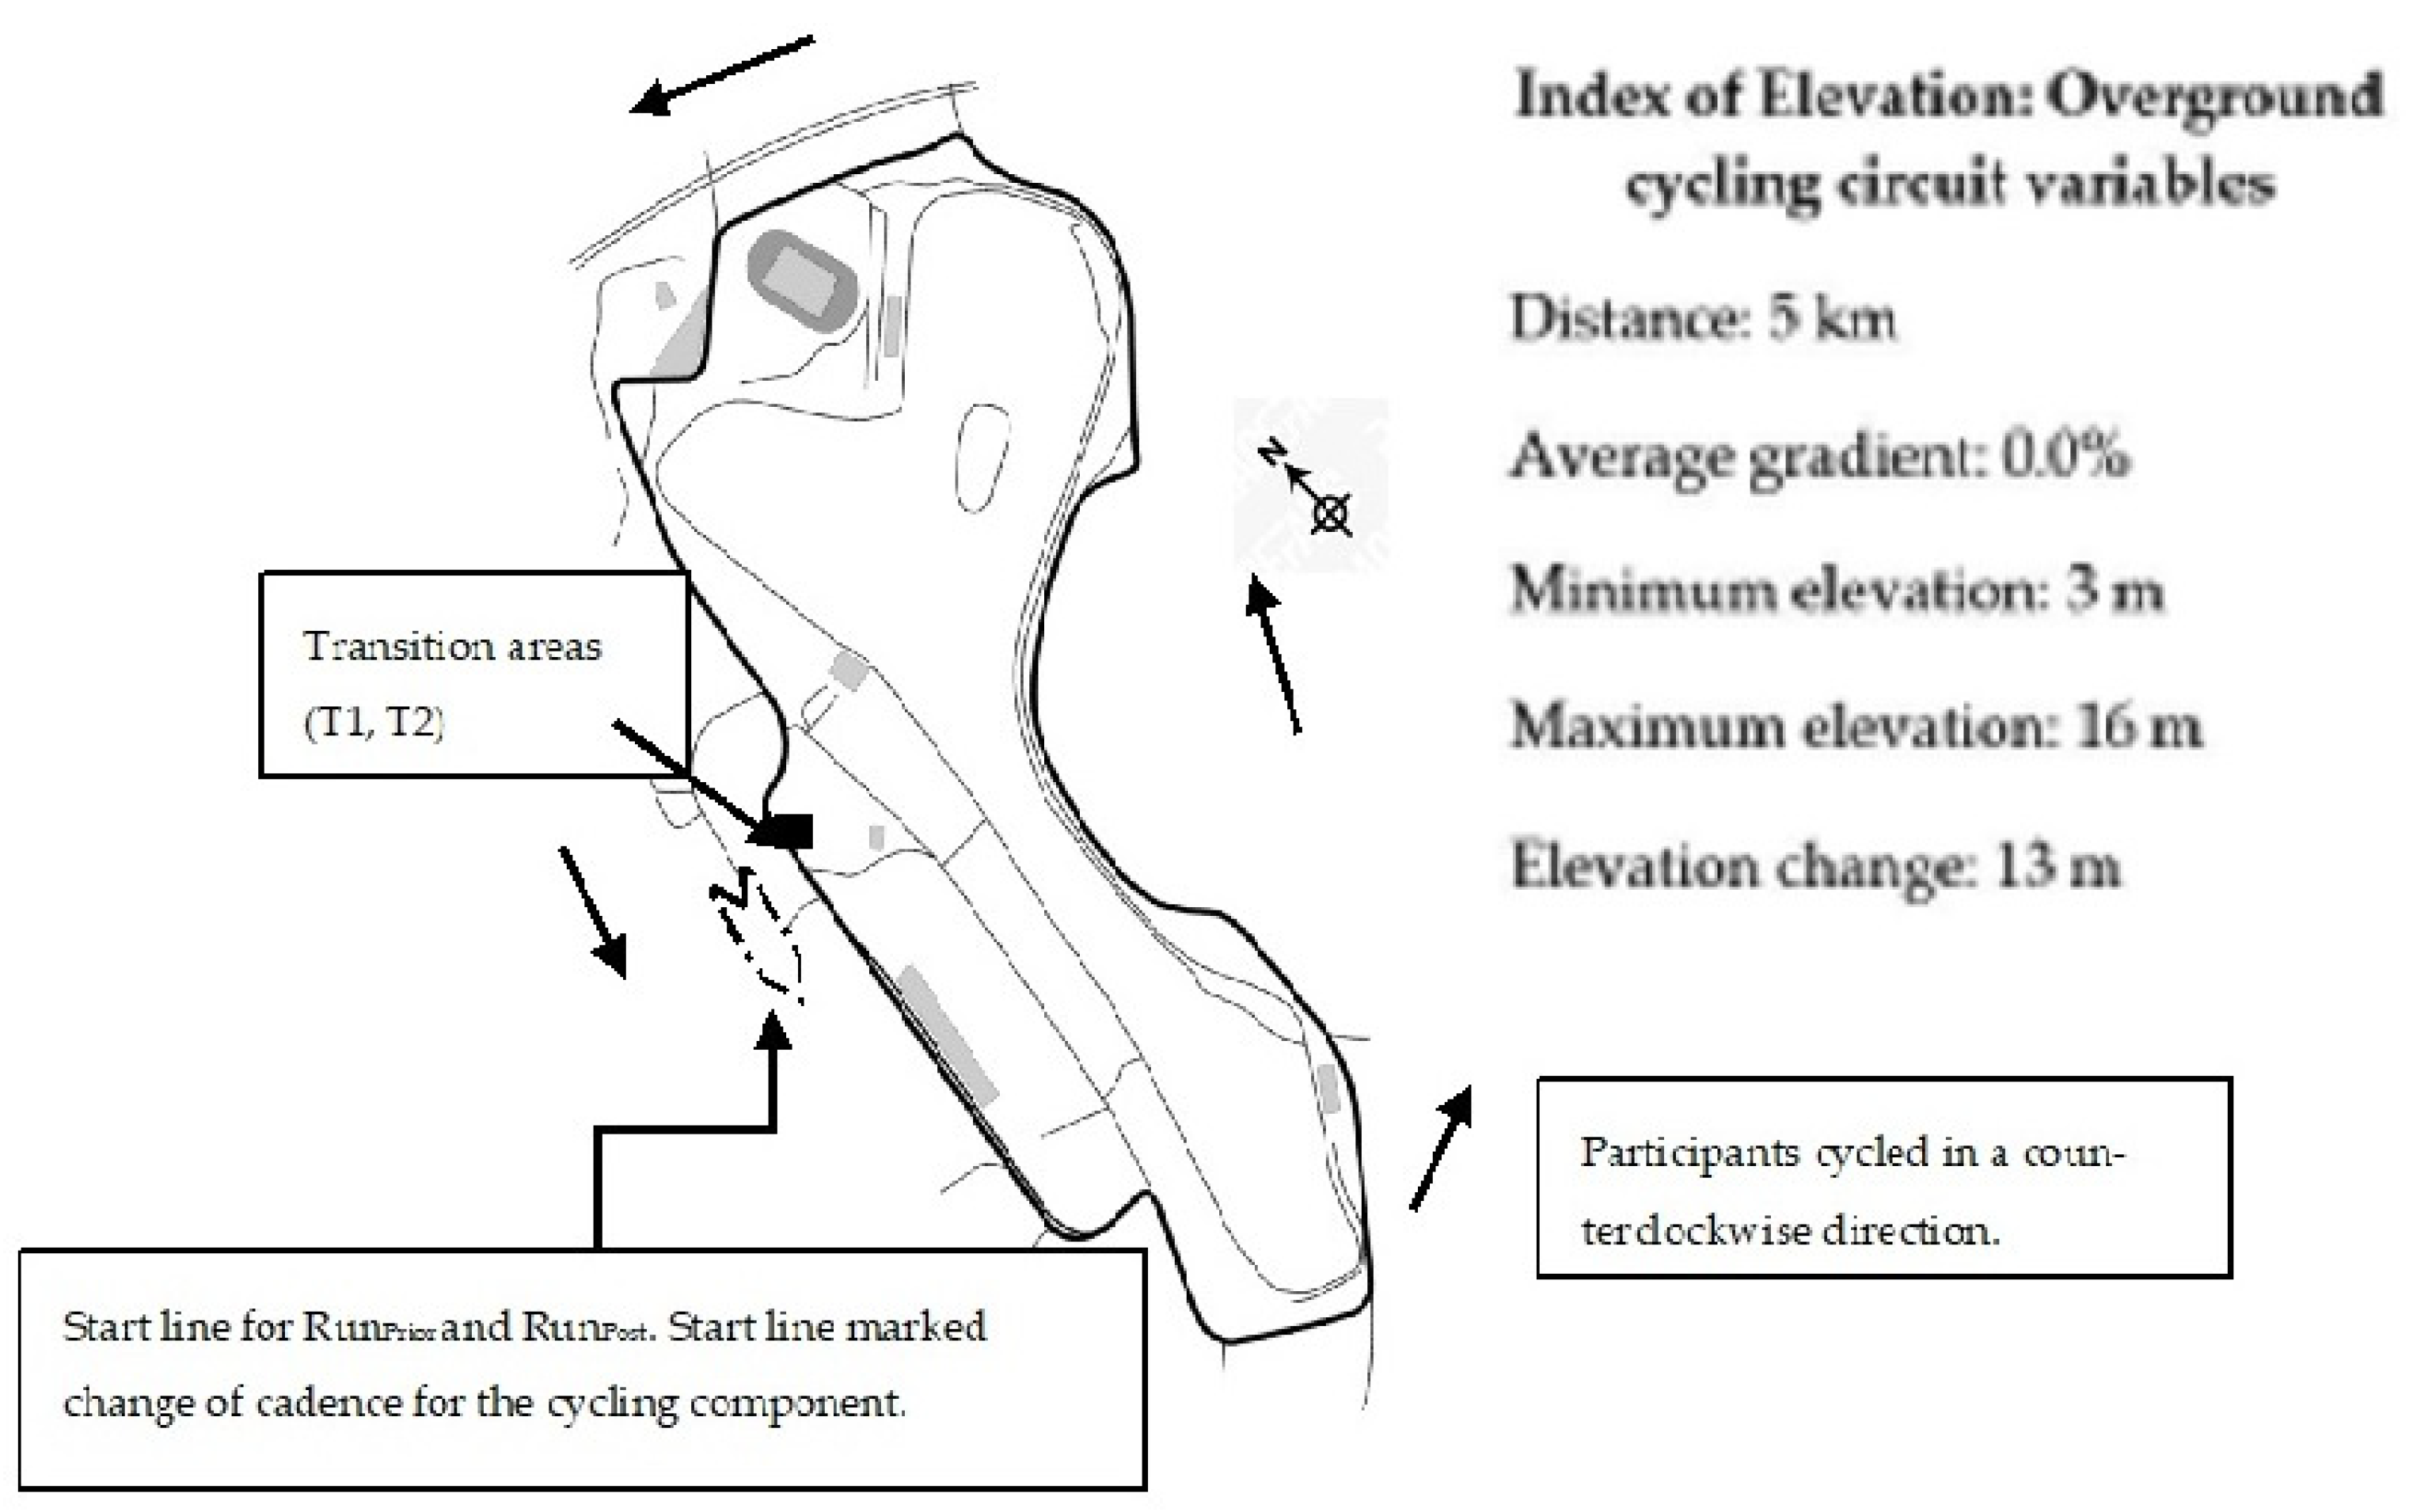
2.3. Cycling
2.4. Perceived Exertion
2.5. Transitions (T1 and T2)
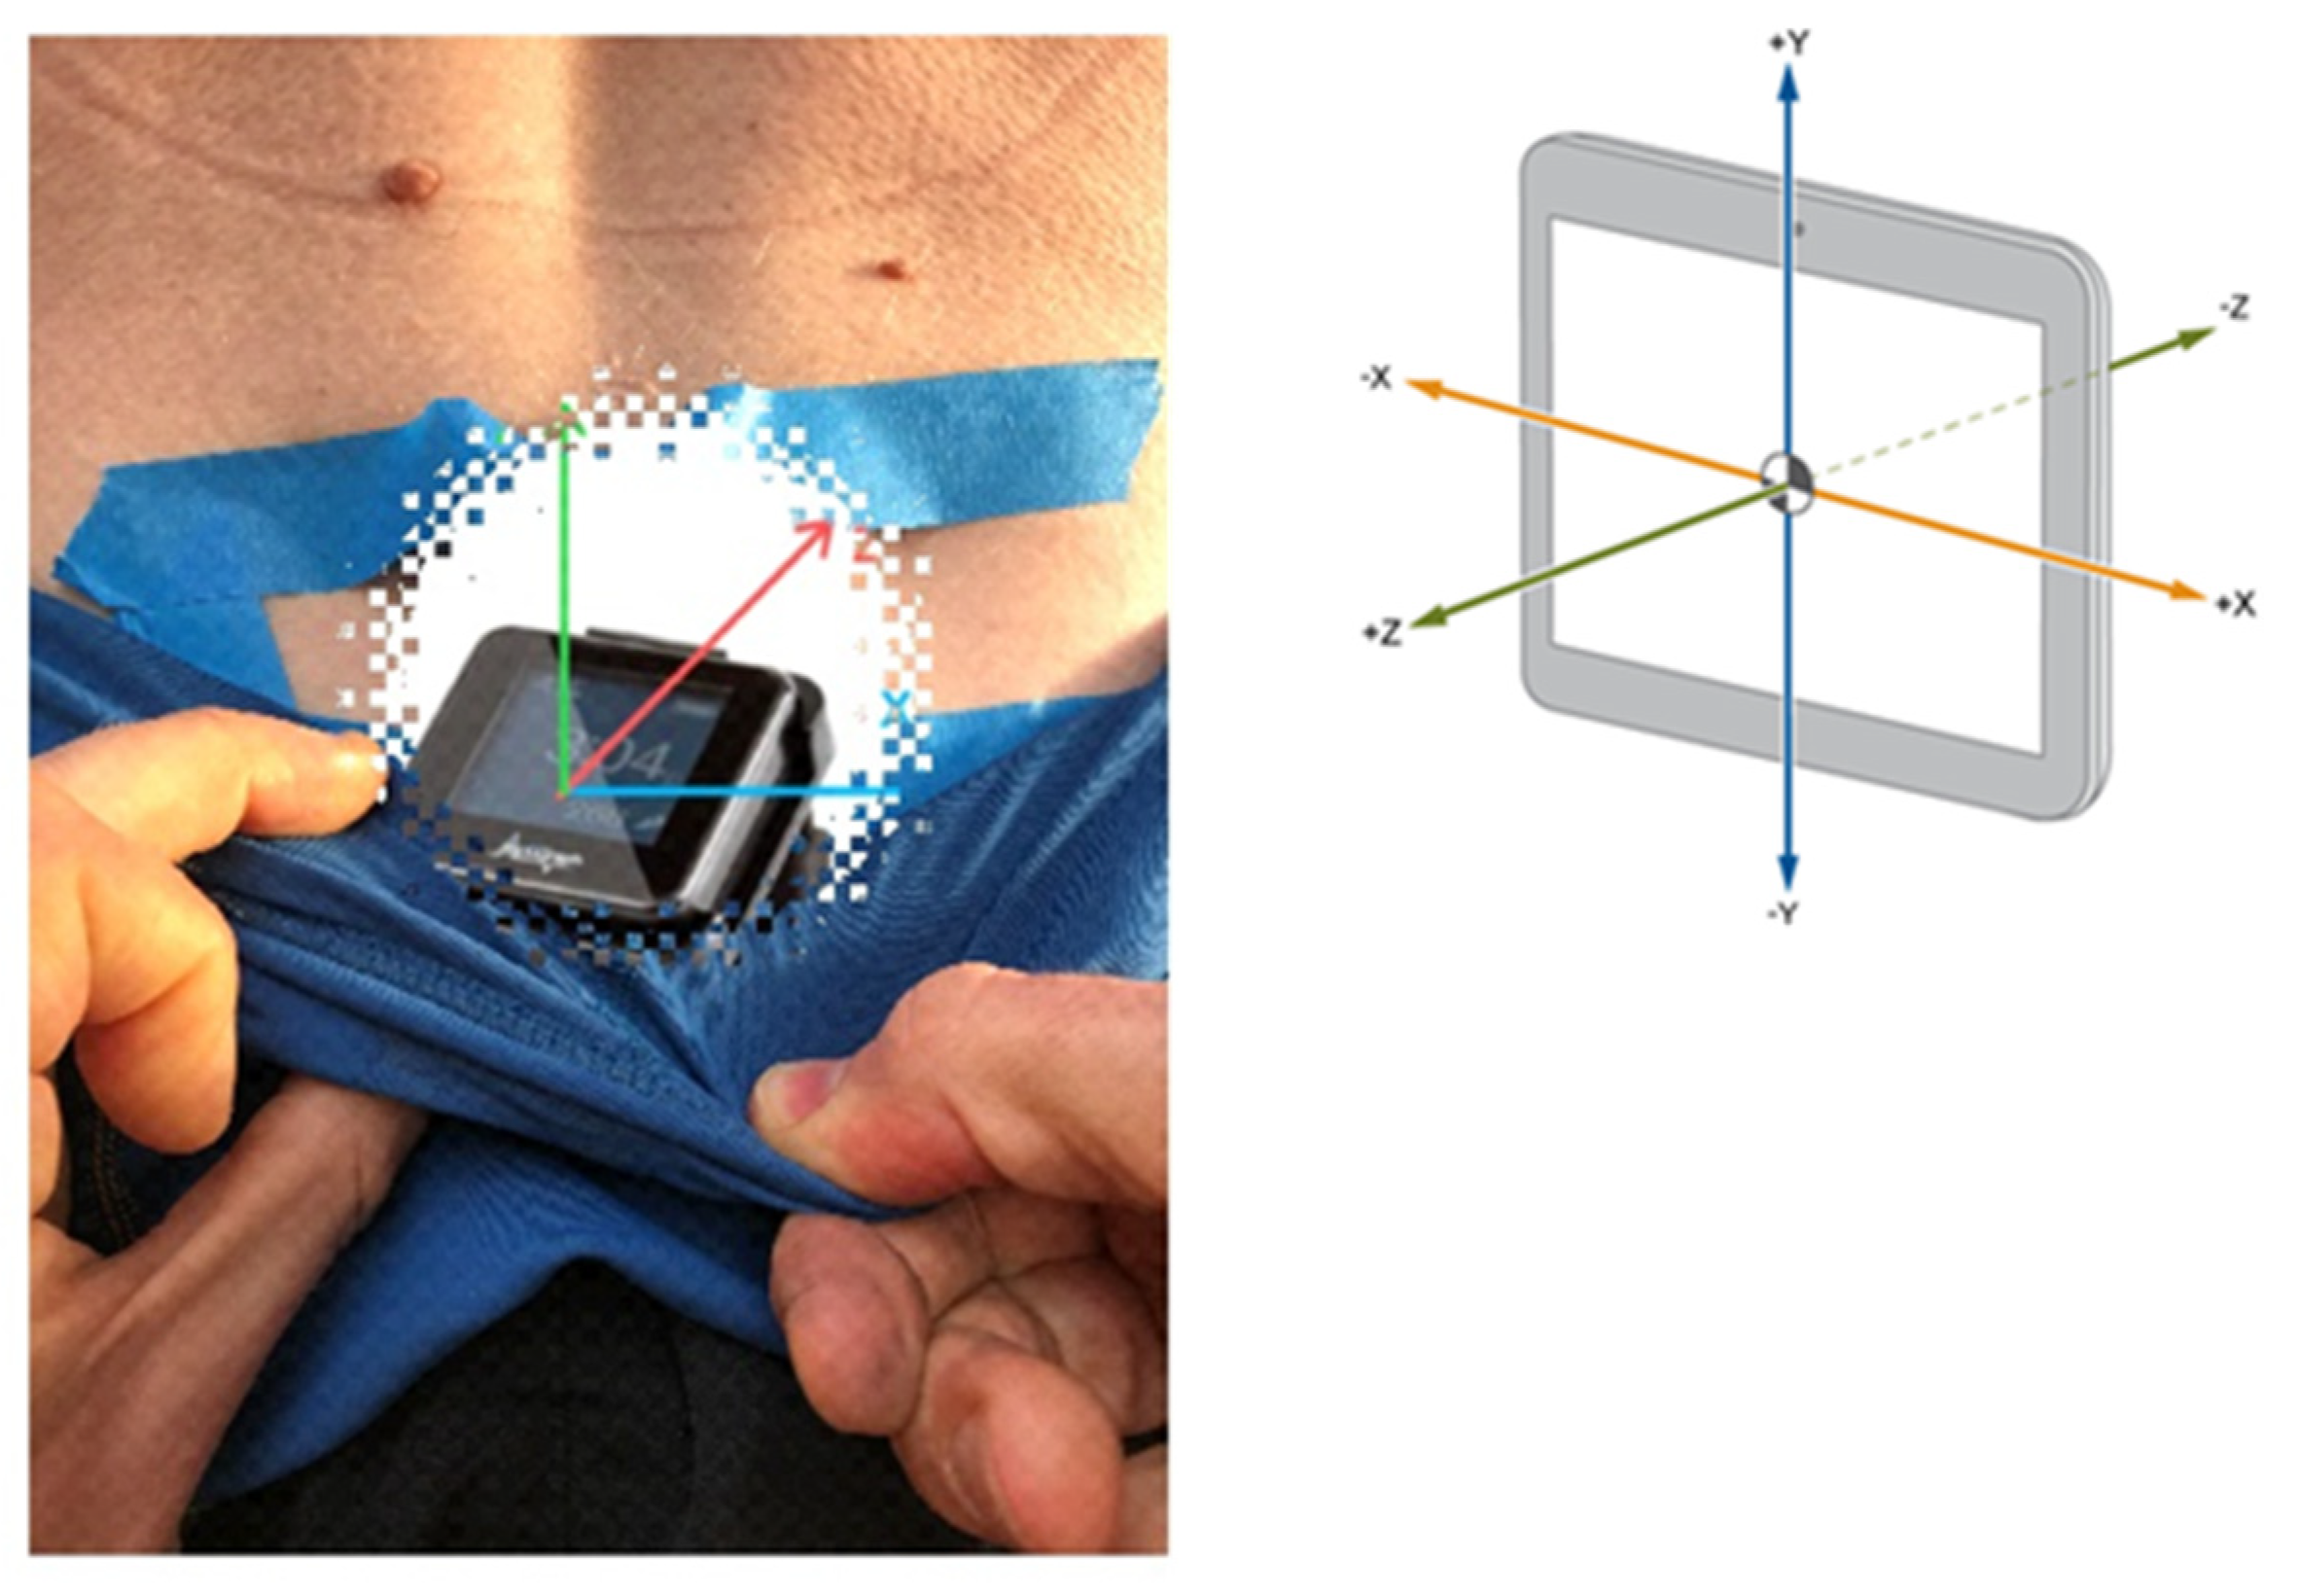
2.6. Instrumentation and Measurement
2.7. Data Analysis
2.8. Statistical Analysis
3. Results
3.1. Running Prior to Cycling (RunPrior)
3.2. Cycling
3.3. Running Prior to Cycling (RunPost)
3.4. Comparison of Running Pre- and Post-Cycling
4. Discussion
4.1. Running Pre-Cycling (RunPrior)
4.2. Cycling
4.3. Run Post-Cycling (RunPost)
5. Summary and Conclusions
Author Contributions
Funding
Institutional Review Board Statement
Informed Consent Statement
Data Availability Statement
Acknowledgments
Conflicts of Interest
References
- Landers, G.J.; Blanksby, B.A.; Ackland, T.R.; Smith, D. Morphology and performance of world championship triathletes. Annals Hum. Biology 2000, 27, 387–400. [Google Scholar] [CrossRef] [PubMed]
- Vleck, V.E.; Bürgi, A.; Bentley, D.J. The consequences of swim, cycle, and run performance on overall result in elite Olympic distance triathlon. Int. J. Sports Med. 2006, 27, 43–48. [Google Scholar] [CrossRef] [PubMed]
- Sparks, S.A.; Cable, N.T.; Doran, A.; Maclaren, P.M. The influence of environmental temperature on duathlon performance. Ergonomics 2007, 48, 1558–1567. [Google Scholar] [CrossRef] [PubMed]
- Millet, G.P.; Vleck, V. Physiological and biomechanical adaptations to the cycle to run transition in Olympic triathlon: Review and practical recommendations for training. Br. J. Sports Med. 2000, 34, 384–390. [Google Scholar] [CrossRef]
- Suriano, R.; Vercruyssen, F.; Bishop, D.; Brisswalter, J. Variable power output during cycling improves subsequent treadmill run time to exhaustion. J. Sci. Med. Sport. 2007, 10, 244–251. [Google Scholar] [CrossRef]
- Bernard, T.; Vercruyssen, F.; Grego, F.; Housswirth, C.; Lepers, R.; Vallier, J.-M.; Brisswalter, J. Effect of cycling cadence on subsequent 3 km running performance in well trained triathletes. Br. J. Sports Med. 2003, 37, 154–158. [Google Scholar] [CrossRef]
- Chapman, A.R.; Vicenzino, B.; Blanch, P.; Dowlan, S.; Hodges, P.W. Does cycling effect motor coordination of the leg during running in elite triathletes? J. Sci. Med. Sport 2008, 11, 371–380. [Google Scholar] [CrossRef]
- Weich, C.; Jensen, R.L.; Vieten, M. Triathlon transition study: Quantifying differences in running movement pattern and precision after bike-run transition. Sports Biomech. 2019, 18, 215–228. [Google Scholar] [CrossRef]
- Bonacci, J.; Saunders, P.U.; Alexander, M.; Blanch, P.; Vicenzino, B. Neuromuscular control and running economy is preserved in elite international triathletes after cycling. Sports Biomech. 2011, 10, 59–71. [Google Scholar] [CrossRef]
- Hue, O.; Le Gallais, D.; Boussana, A.; Chollet, D.; Prefaut, C. Ventilatory responses during experimental cycle-run transition in triathletes. Med. Sci. Sports Exer. 1999, 31, 1422. [Google Scholar] [CrossRef]
- Millet, G.P.; Millet, G.Y.; Hofmann, M.; Candau, R. Alterations in running economy and mechanics after maximal cycling in tri-athletes: Influence of performance level. Int. J. Sports Med. 2000, 21, 127–132. [Google Scholar] [CrossRef] [PubMed]
- Evans, S.A.; James, D.A.; Rowlands, D.; Lee, J.B. Assessment of accelerometer-derived data in the context of seat height changes in cycling and the impact on running in triathlon. Proc. Inst. Mech. Eng. Part. P J. Sports Eng. Tech. 2023, 237, 252–262. [Google Scholar] [CrossRef]
- Quigley, E.J.; Richards, J.G. The effects of cycling on running mechanics. J. Appl. Biomech. 1996, 12, 470–479. [Google Scholar] [CrossRef]
- Millet, G.P.; Vleck, V.E.; Bentley, D.J. Physiological differences between cycling and running: Lessons from triathletes. Sports Med. 2009, 3, 179–206. [Google Scholar] [CrossRef] [PubMed]
- Gohlitz, D.; Große, S.; Witt, M. Darstellungen von Veränderungen der Schrittlänge und Schrittfrequenz beim Übergang vom Radfahren zum Laufen zur Kennzeichnung der Dauer von Übergangsphasen im Duathlon (Pilotuntersuchung). In Triathlon—Medizinische und Methodische Probleme des Trainings; Engelhardt, M., Franz, B., Neumann, G., Pfützner, A., Eds.; Triathlon und Sportwissenschaft; Czwalina: Hamburg, Germany, 1994; ISBN 978-3-88020-249-8. [Google Scholar]
- Connick, M.J.; Li, F.-X. Prolonged cycling alters stride time variability and kinematics of a post-cycle transition run in triathletes. J. Electromyogr. Kinesiol. 2015, 25, 34–39. [Google Scholar] [CrossRef] [PubMed][Green Version]
- Chapman, A.; Vicenzino, B.; Blanch, P.; Hodges, P. Is running less skilled in triathletes than runners matched for running training history? Med. Sci. Sports Exerc. 2008, 40, 557–565. [Google Scholar] [CrossRef]
- Vieten, M.M.; Sehle, A.; Jensen, R.L. A novel approach to quantify time series differences of gait data using attractor attributes. PLoS ONE 2013, 8, e71824. [Google Scholar] [CrossRef]
- Barnes, K.R.; Kilding, A.E. Running economy: Measurement, norms, and determining factors. Sports Med. Open 2015, 1, 8. [Google Scholar] [CrossRef]
- Lai, A.; James, D.; Hayes, J. Semi-automatic calibration technique using six inertial frames of reference. SPIE 2004, 5274, 531–542. [Google Scholar]
- Kobsar, D.; Osis, S.; Hettinga, B.; Ferber, R. Classification accuracy of a single tri-axial accelerometer for training background and experience level in runners. J. Biomech. 2014, 47, 508–2511. [Google Scholar] [CrossRef]
- Seshadri, D.R.; Li, R.T.; Voos, J.E.; Rowbottom, J.R.; Alfes, C.M.; Zorman, C.A.; Drummond, C.K. Wearable sensors for monitoring the internal and external workload of the athlete. NPJ Digit. Med. 2019, 29, 71. [Google Scholar] [CrossRef]
- Jackson, A.S.; Pollock, M.L. Practical assessment of body composition. Physic. Sport. Med. 1985, 13, 76–90. [Google Scholar] [CrossRef]
- Evans, S.A.; James, D.A.; Rowlands, D.; Lee, J.B. The effect of cleat position on running using acceleration-derived data in the context of triathlons. Sensors 2021, 21, 5899. [Google Scholar] [CrossRef]
- Gregor, R.J.; Broker, J.P.; Ryan, M.M. The biomechanics of cycling. Exerc. Sport Sci. 1991, 19, 127–169. [Google Scholar] [CrossRef]
- Chapman, A.R.; Vicenzino, B.; Hodges, P.W.; Blanch, P.; Hahn, A.G.; Milner, T.E. A protocol for measuring the direct effect of cycling on neuromuscular control of running in triathletes. J. Sports Sci. 2009, 27, 767–782. [Google Scholar] [CrossRef] [PubMed]
- Bonacci, J.; Chapman, A.; Blanch, P.; Vicenzino, B. Neuromuscular adaptations to training, injury and passive interventions: Implications for running economy. Sports Med. 2009, 39, 903–921. [Google Scholar] [CrossRef] [PubMed]
- Borg, G. Borg’s Perceived Exertion and Pain Scales; Human Kinetic: Champaign, France, 1998. [Google Scholar]
- Bini, R.R.; Hume, P.A.; Croft, J. Cyclists and triathletes have different body positions on the bicycle. Eur. J. Sports Sci. 2014, 14, S109–S115. [Google Scholar] [CrossRef]
- Cohen, J. Statistical Power Analysis for the Behavioral Sciences, 2nd ed.; Lawrence Erlbaum Associates: Hillside, NJ, USA, 1988. [Google Scholar]
- Lee, J.B.; Sutter, K.J.; Askew, C.D.; Burkett, B.J. Identifying symmetry in running gait using a single inertial sensor. J. Sci. Med. Sport. 2010, 13, 559–563. [Google Scholar] [CrossRef] [PubMed]
- Turnwald, J.; Sousa, C.V.; Andrade, M.S.; Thuany, M.; Cuk, I.; Nikolaidis, P.T.; Weiss, K.; Knechtle, B. Participation and performance trends in short-, medium, and long-distance duathlon. Sci. Rep. 2023, 13, 9303. [Google Scholar] [CrossRef] [PubMed]
- Nikolaidis, P.T.; Villiger, E.; Victor Sousa, C.; Rosemann, T.; Knechtle, B. The effect of aging on pacing strategies in short and long-distance duathlon. Exp. Aging Res. 2019, 45, 223–233. [Google Scholar] [CrossRef] [PubMed]
- Abbiss, C.R.; Peiffer, J.J.; Laursen, P.B. Optimal cadence selection during cycling. Int. Sports Med. 2009, 10, 1–15. [Google Scholar]
- De Vito, G.; Bernardi, M.; Sproviero, E.; Figura, F. Decrease of endurance performance during Olympic triathlon. Int. J. Sports Med. 1995, 16, 24–28. [Google Scholar] [CrossRef] [PubMed]
- Kibler, W.B.; Press, J.; Sciascia, A. The role of core stability in athletic function. Sports Med. 2006, 36, 189–198. [Google Scholar] [CrossRef] [PubMed]
- Saeterbakken, A.H.; Andersen, V.; Behm, D.G.; Cumming, K.T.; Prieske, O.; Solstad, T.E.J.; Shaw, M.; Stien, N. The role of trunk training for physical fitness and sport-specific performance. Protocol for a meta-analysis. Front. Sports Act. Living 2021, 3, 625098. [Google Scholar] [CrossRef]
- Tesio, L.; Rota, V. The motion of body center of mass during walking: A review oriented to clinical applications. Front. Neurol. 2019, 10, 999. [Google Scholar] [CrossRef]
- Evans, S.A.; James, D.A.; Rowlands, D.R.; James, J.B.; Gleadhill, S. Cycling effects vertical acceleration of the center of mass in running in triathletes. J. Phys. Fit. Treat. Sports 2020, 8, 555737. [Google Scholar]
- Wille, C.M.; Lenhart, R.L.; Wang, S.; Thelen, D.G.; Heiderscheit, B.C. Ability of sagittal kinematic variables to estimate ground reaction forces and joint kinetics in running. J. Orthop. Sports Phys. Ther. 2014, 44, 825–830. [Google Scholar] [CrossRef]
- Bentley, D.; Millet, G.P.; Vleck, V.E.; McNaughton, L.R. Specific aspects of contemporary triathlon: Implications for physiological analysis and performance. Sports Med. 2002, 32, 345–359. [Google Scholar] [CrossRef]
- Vallier, J.M.; Mazure, C.; Hausswirth, C.; Bernard, T.; Brisswalter, J. Energy cost of running during a specific transition in duathlon. Can. J. Appl. Physiol. 2003, 28, 673–684. [Google Scholar] [CrossRef] [PubMed]
- Barnes, K.R.; Kilding, A.E. Strategies to improve running economy. Sports Med. 2015, 45, 37–56. [Google Scholar] [CrossRef] [PubMed]
- Marsh, A.P.; Martin, P.E. Effect of cycling experience, aerobic power, and power output on preferred and most economical cycling cadences. Med. Sci. Sports Exerc. 1997, 29, 1225–1232. [Google Scholar] [CrossRef] [PubMed]
- Coast, J.R.; Welch, H.G. Linear increase in optimal pedal rate with increased power output in cycle ergometry. Eur. J. Appl. Physiol. 1985, 53, 339–342. [Google Scholar] [CrossRef] [PubMed]
- Macintosh, B.R.; Neptune, R.R.; Richard, R.; Horton, J.F. Cadence, power, and muscle activation in cycle ergometry. Med. Sci. Sports Exerc. 2000, 32, 1281–1287. [Google Scholar] [CrossRef] [PubMed]
- Evans, S.A.; Ballhause, K.; James, D.A.; Rowlands, D.; Lee, J.B. The development and validation of an inertial sensor for measuring cycling kinematics: A preliminary study. J. Sci. Cycl. 2021, 10, 34–44. [Google Scholar] [CrossRef]
- Maneiro, R.; Losada, J.L.; Casal, C.A.; Papadopoulou, S.; Sarmento, H.; Ardá, A.; Iglesias, X.; Amatria, M. Editorial: Advances in Sport Science: Latest Findings and New Scientific Proposals. Front. Psychol. 2022, 13, 891906. [Google Scholar] [CrossRef]


 Significant at p < 0.05; d > 1.9 (extremely large).
Significant at p < 0.05; d > 1.9 (extremely large).
Significant at p < 0.05; d > 1.9 (extremely large).

| Participants (n = 10) | Mean ± SD | Min | Max |
|---|---|---|---|
| Ages (years) | 30.25 ± 2.3 | 26 | 37 |
| Mass (kg) | 68.24 ± 1.9 | 61 | 79 |
| Body height (cm) | 175.7 ± 2.3 | 169 | 186 |
| Weekly training (hours per week) | 9.45 ± 1.7 | 7 | 12 |
| Training experience (years) | 9.15 ± 5.2 | 7 | 10 |
| Running Distance | Mean Running Pace (km/h1) | x (G) | p | y (G) | p | z (G) | p | Resultant Vector | RPE |
|---|---|---|---|---|---|---|---|---|---|
| Kilometre 1 | 4.06 ± 0.3 | 0.56 ± 0.2 | 0.05 | 3.23 ± 0.3 | 0.05 | 1.69 ± 0.1 | 0.05 | 1.93 ± 0.38 | 6 ± 0.1 |
| Kilometre 2 | 4.05 ± 0.1 | 0.35 ± 0.1 | 0.05 | 3.25 ± 0.2 | 0.05 | 1.79 ± 0.1 | 0.05 | 5.11 ± 1.19 | 6 ± 0.1 |
| Kilometre 3 | 4.08 ± 3.0 | 0.58 ± 0.2 | <0.01 ** | 3.28 ± 0.5 | <0.01 ** | 1.81 ± 0.2 | <0.01 ** | 6.44 ± 0.7 | 7 ± 0.2 |
| 500 m ≠ | 4.09 ± 2.8 | 0.61 ± 0.2 | <0.01 ** | 3.35 ± 0.5 | <0.01 ** | 1.80 ± 0.2 | <0.01 ** | 7.20 ± 0.8 | 7 ± 0.1 |
| Kilometre 4 ≠ | 4.09 ± 2.9 | 0.62 ± 0.1 | <0.01 ** | 3.32 ± 0.8 | <0.01 ** | 1.76 ± 0.3 | <0.01 ** | 7.19 ± 0.9 | 7 ± 0.3 |
| Kilometre 5 ≠ | 4.09 ± 2.8 | 0.71 ± 0.8 | <0.01 ** | 3.33 ± 0.8 | <0.01 ** | 1.78 ± 0.2 | <0.01 ** | 7.72 ± 0.9 | 8 ± 0.4 |
| Distance | Cadence (rev/min1) | x (G) | p | y (G) | p | z (G) | p | RPE | Resultant Vector |
|---|---|---|---|---|---|---|---|---|---|
| Transition (T1) 1.23 (mm:ss) ± 0.4 | 0.05 | 6 ± 0.2 | - | ||||||
| Kilometre 0–5 | Self-selected | 0.95 ± 0.1 | 0.05 | 0.99 ± 0.2 | 0.05 | 0.59 ± 0.2 | 0.05 | 6 ± 0.1 | 1.93 ± 0.3 |
| Kilometre 5–10 | 55–60 rev/min1 | 0.99 ± 0.2 | 0.05 | 0.77 ± 0.2 | 0.05 | 0.65 ± 0.4 | 0.05 | 7 ± 0.2 | 5.11 ± 0.4 |
| Kilometre 10–15 | 75–80 rev/min1 | 1.21 ± 0.2 | 0.05 | 0.88 ± 0.3 | 0.05 | 0.89 ± 0.1 | 0.05 | 9 ± 0.1 | 5.79 ± 0.4 |
| Kilometre 15–20 | 75–80 rev/min1 | 1.64 ± 0.8 | <0.01 ** | 0.81 ± 0.6 | <0.01 ** | 0.88 ± 0.3 | <0.01 ** | 10 ± 0.2 | 6.51 ± 0.4 |
| Running Distance | Mean Running Pace km/h1 | x (G) | p | y (G) | p | z (G) | p | RPE | Resultant Vector | p |
|---|---|---|---|---|---|---|---|---|---|---|
| Transition 2 (T2) 2.03 (mm: ss) ± 0.5 | 0.05 | 10 ± 0.2 | 0.05 | |||||||
| Kilometre 1 | 4.09 ± 0.8 | 0.66 ± 0.3 | 0.05 | 4.25 ± 0.4 | <0.01 ** | 2.01 | 0.05 | 5 ± 0.1 | 6.40 ± 0.6 | |
| Kilometre 2 | 4.08 ± 0.8 | 0.71 ± 0.6 | 0.05 | 3.95 ± 0.2 | <0.01 ** | 1.99 | 0.05 | 6 ± 0.1 | 6.29 ± 0.6 | |
| 500 m | 4.07 ± 0.9 | 0.69 ± 0.7 | <0.01 ** | 3.92 ± 0.9 | <0.01 ** | 1.92 | <0.01 ** | 8 ± 0.2 | 6.21 ± 0.5 |
Disclaimer/Publisher’s Note: The statements, opinions and data contained in all publications are solely those of the individual author(s) and contributor(s) and not of MDPI and/or the editor(s). MDPI and/or the editor(s) disclaim responsibility for any injury to people or property resulting from any ideas, methods, instructions or products referred to in the content. |
© 2024 by the authors. Licensee MDPI, Basel, Switzerland. This article is an open access article distributed under the terms and conditions of the Creative Commons Attribution (CC BY) license (https://creativecommons.org/licenses/by/4.0/).
Share and Cite
Evans, S.; James, D.A. The Effects of a Simulated Duathlon on Trunk Motion: A Sensor Based Approach. Appl. Sci. 2024, 14, 1437. https://doi.org/10.3390/app14041437
Evans S, James DA. The Effects of a Simulated Duathlon on Trunk Motion: A Sensor Based Approach. Applied Sciences. 2024; 14(4):1437. https://doi.org/10.3390/app14041437
Chicago/Turabian StyleEvans, Stuart, and Daniel Arthur James. 2024. "The Effects of a Simulated Duathlon on Trunk Motion: A Sensor Based Approach" Applied Sciences 14, no. 4: 1437. https://doi.org/10.3390/app14041437
APA StyleEvans, S., & James, D. A. (2024). The Effects of a Simulated Duathlon on Trunk Motion: A Sensor Based Approach. Applied Sciences, 14(4), 1437. https://doi.org/10.3390/app14041437