Article

Quantitative Characterization and Disturbance Law of Key Parameters Influencing Deformation of Overlying Strata during Strip Filling in a Goaf

1
College of Energy and Mining Engineering, Shandong University of Science and Technology, Qingdao 266590, China
2
State Key Laboratory of Mining Disaster Prevention and Control Co-Founded by Shandong Province and the Ministry of Science and Technology, Shandong University of Science and Technology, Qingdao 266590, China
*
Author to whom correspondence should be addressed.
Appl. Sci. 2024, 14(3), 996; https://doi.org/10.3390/app14030996
Submission received: 2 January 2024 / Revised: 17 January 2024 / Accepted: 22 January 2024 / Published: 24 January 2024
(This article belongs to the Special Issue Smart Geotechnical Engineering)

Abstract

:
Strip filling mining in a goaf is of great significance for solving the ‘three under’ coal-pressure and mining-area ecological environment problems in Central and Eastern China, but the disturbance characteristics of filling parameters on overlying rock are not clear at present. Taking the geological conditions of the CT30101 working face in Mahuangliang coal mine and the short-wall interval strip filling as a background, the strength parameters (cohesion and friction angle), deformation parameters (elastic modulus and Poisson’s ratio), and structural parameters (strip width and spacing) of the filling body were selected as experimental factors, and the maximum settlement of the direct roof and the ground surface was taken as the evaluation index. The influence degree of each factor was quantitatively characterized via a variance analysis and an F test, and the main control factors of the strip filling overburden settlement were proposed. The roof and surface displacement, the stress evolution law of the filling body, and the shape change of the surrounding rock plastic zone under different levels of main control factors in the entire process of mining filling coupling were analyzed in detail. The results showed that the cohesion of the backfill had a highly significant impact on the direct roof settlement, the strip spacing and the friction angle of backfill had a significant impact on it, the cohesion of the backfill and the strip spacing had a certain impact on the surface settlement, and the two had a cross-coupling effect. In the process of mining and filling, the stress evolution of the filling body was extremely complex, and it finally presented a saddle shape that was high on both sides and low in the middle; the majority of the strata and the filling body primarily exhibited shear damage, with a small amount of tensile failure zones appearing only in the direct roof and mid-section of the filling body. The above conclusions have a certain guiding significance for the optimal design of strip filling in a goaf.

1. Introduction

For an extended period, the persistent and high-intensity exploitation of coal resources has led to surface fissures, land subsidence, solid waste accumulation, and water resource contamination, significantly impacting ecological and environmental security. The need for environmentally conscious mining practices with minimal resource damage is increasingly evident [1,2,3]. Strip filling mining employs supporting filling materials to stabilize the overlying strata, preventing the extensive subsidence and deformation of the overlying rock layers, thus accomplishing the objectives of controlling land subsidence and safeguarding the environment. This approach holds considerable practical value in terms of reducing fill costs, enhancing coal utilization efficiency, preserving the ecological environment, and prolonging the mine’s operational lifespan. It has emerged as the future direction of eco-friendly mining and represents an optimal solution to address the pressing concerns associated with coal pressure and ecological issues in Central and Eastern Chinese mining regions [4,5,6]. And it can effectively reduce the displacement of the overlying strata after coal seam mining. Nonetheless, due to the complexities inherent in rock layer and coal seam occurrences, numerous factors influence surface subsidence and coal mining roof stability in strip filling mining. Determining the relative importance of each factor is crucial for optimizing filling strategies, managing surface subsidence, and regulating rock movement.
Owing to the intricate nature of coal seam occurrences, numerous factors influence the stability of overlying strata during the coupled processes of mining and filling. Estimating the relative significance and hierarchy of these factors solely through theoretical analysis or on-site monitoring is challenging. The orthogonal design of experiments enables the attainment of results comparable to comprehensive tests while minimizing the number of tests conducted. This approach is widely employed for scheme optimization and parameter influence analysis in mining engineering [7]. In recent years, numerous scholars have utilized orthogonal experimental methods to investigate the influence of the optimal mix ratio of filling materials on the strength performance of filling bodies [8,9,10,11,12], emphasizing the enhancement of their mechanical properties. However, due to the limited control range of strip filling on the immediate roof, an ill-conceived design of the filling body width and spacing may result in the excessive bending deformation or even breakage of the immediate roof [13]. Consequently, the structural parameters of the mining site also play a crucial role in influencing surface subsidence and coal mining roof stability. Chi [14] determined the optimal structural parameters of strip filling stopes through orthogonal test simulations; Wang [15] conducted numerical simulation orthogonal calculations on roof stability under multiple factors’ influence, obtaining the influence laws of various factors on roof tensile stress; Dong [16] achieved optimization decisions on the structural parameters of strip filling stopes by establishing an orthogonal numerical model; Guo [17] examined the sensitivity of coal seam dip angle, extraction width, extraction thickness, and filling rate to surface subsidence in strip filling mining; Dmytro [18] studied the stability of the roof and floor during longwall mining through numerical simulation and experimental testing, and the author identified various factors that affect the state of the roadway. Numerical simulation research on filling stopes based on orthogonal experimental design not only overcomes the shortcomings of overly idealized theoretical analyses but also conserves experimental costs. However, the number of factors and levels selected in existing studies is relatively limited, hindering a comprehensive reflection of the impact of filling body strength and stope structural parameters. Additionally, the influence degree of factors on indicators has not been quantitatively compared. Furthermore, due to the vast regional geological variations, the optimization parameters of stope structures are not universally applicable.
The integration of orthogonal design of experiments and numerical calculations offers a novel approach to discern the influence modes and relative weight of various parameters on overburden stability. Consequently, this paper first establishes a numerical calculation model for strip filling, utilizes the orthogonal design of experiments, and comprehensively evaluates the impact of the deformation, strength, and structural parameters of the filling body on overburden and surface displacement. Furthermore, the paper proposes a quantitative method for determining the influence degree of each factor and unveils the governing principles of key factors on the mechanical properties of rock layers and the filling body. This analysis aims to provide valuable insights for optimizing the design of strip mining in the goaf.

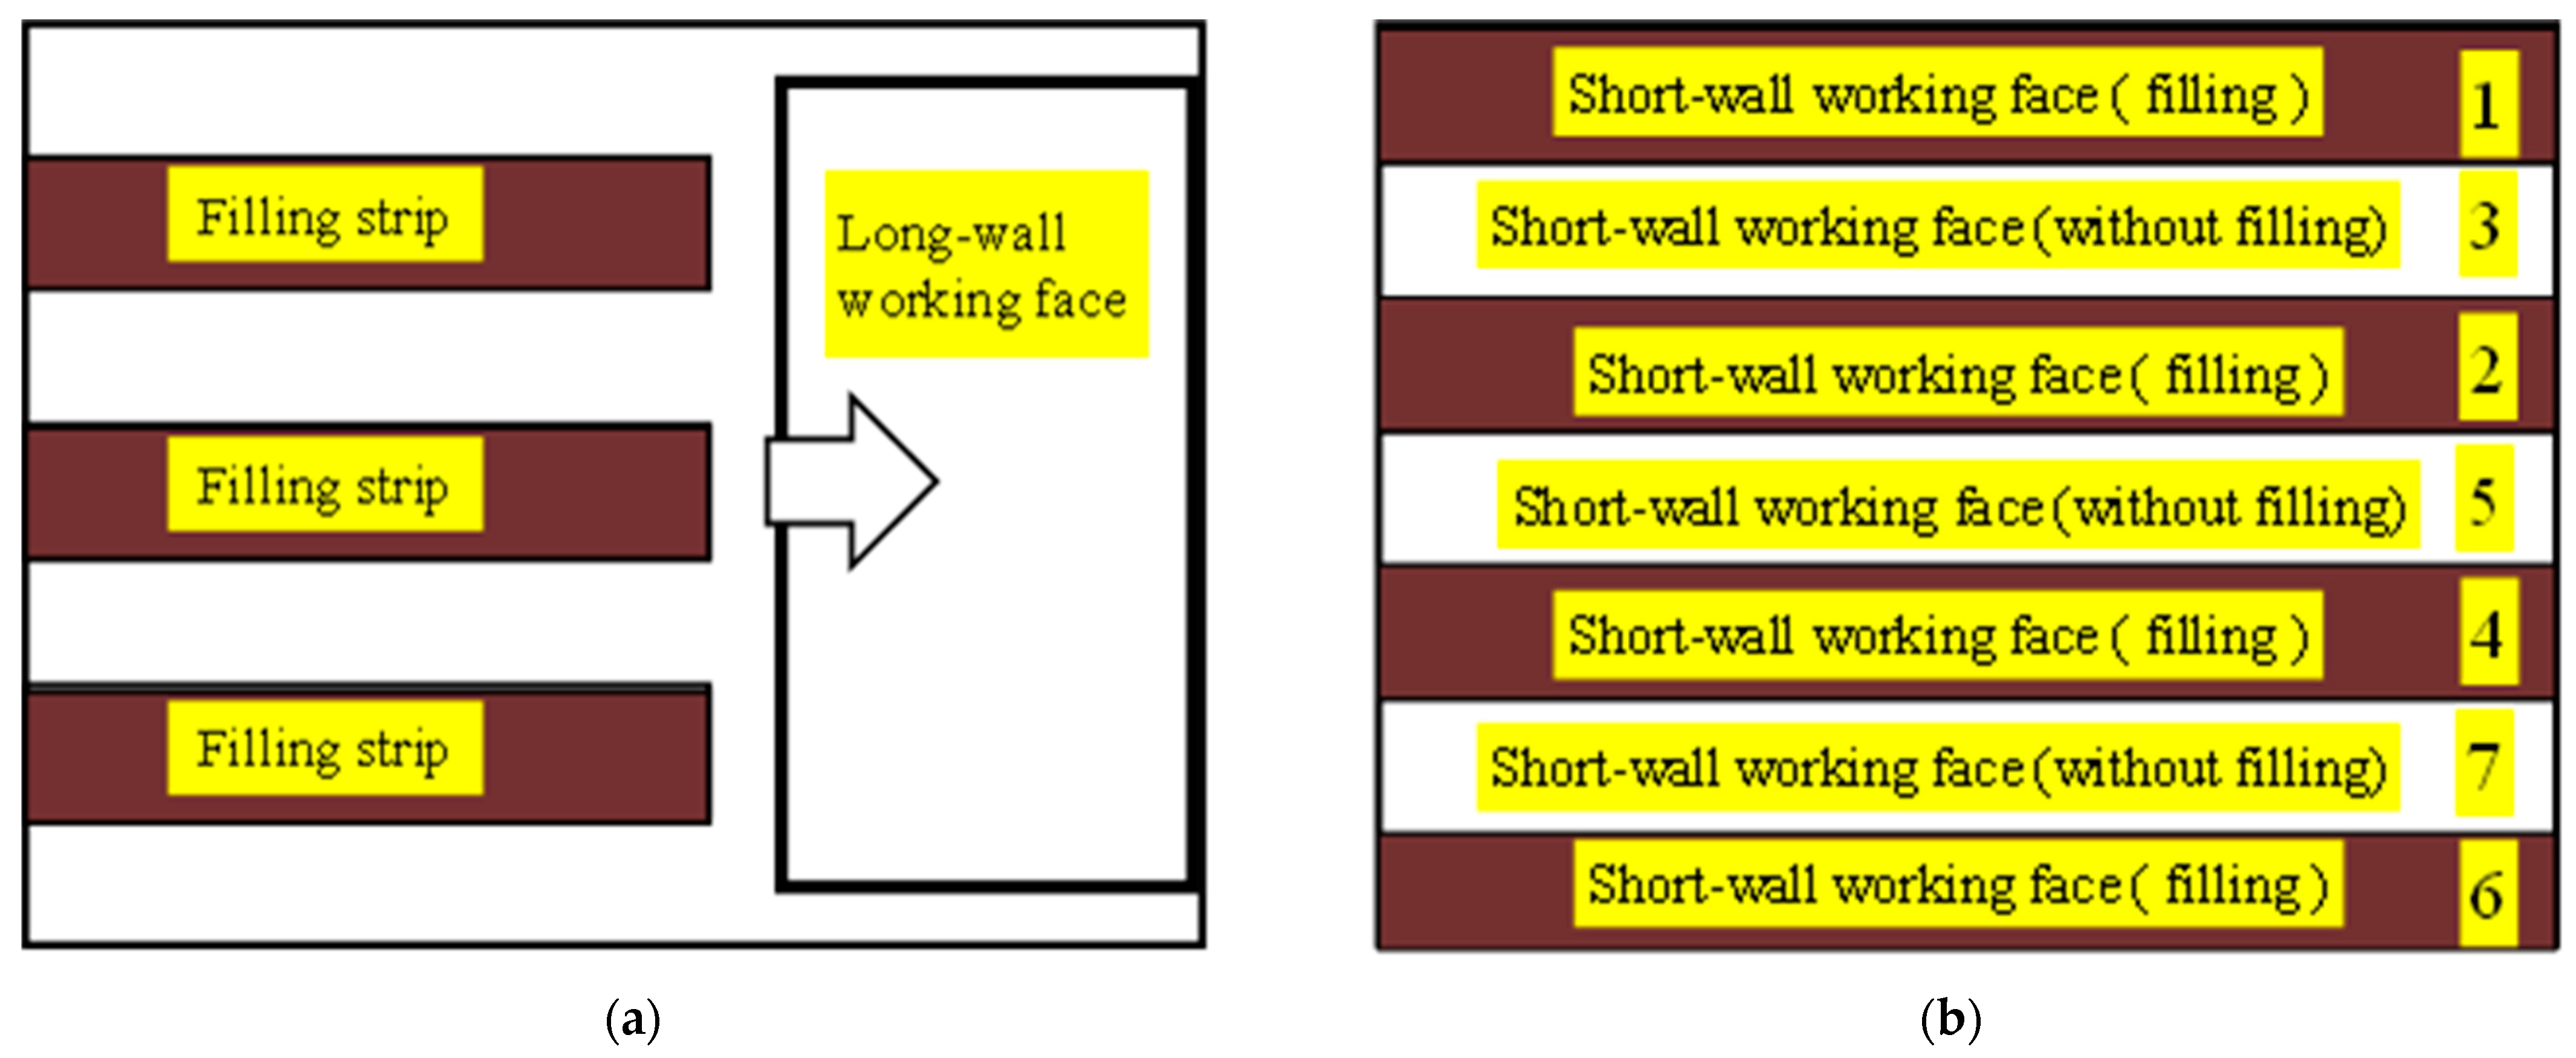
2. Goaf Strip Filling Mining Technique

The strip filling mining technique mitigates surface subsidence by managing the principal key layer, and its underlying principle can be encapsulated as follows [19]: by utilizing strip filling bodies to supplant the coal pillars left in strip mining, and ensuring that the width of the unfilled goaf remains less than the initial breaking span of the main key layer of the overlying rock, the structural integrity of the main key layer is maintained. Consequently, the filling strip can achieve long-term stability, effectively controlling surface subsidence.
The strip filling technology comprises two distinct approaches. The first approach entails long-wall strip filling mining, wherein the working face is configured to extract from an expanding wall face. Filling strips are constructed alternately within the voids, following the advancing direction, as depicted in Figure 1a. The second approach involves short-wall interval strip filling mining, during which the working face is organized for short-wall strip extraction, with one working face being filled for each subsequent working face, as illustrated in Figure 1b. The sequence of mining and filling for each working face aligns with the order displayed in the figure. Generally speaking, it takes 5–6 days to complete a section of coal pillar mining, and 1–2 days to backfill a filling strip.

3. Numerical Model for Short-Wall Spacing Strip Filling

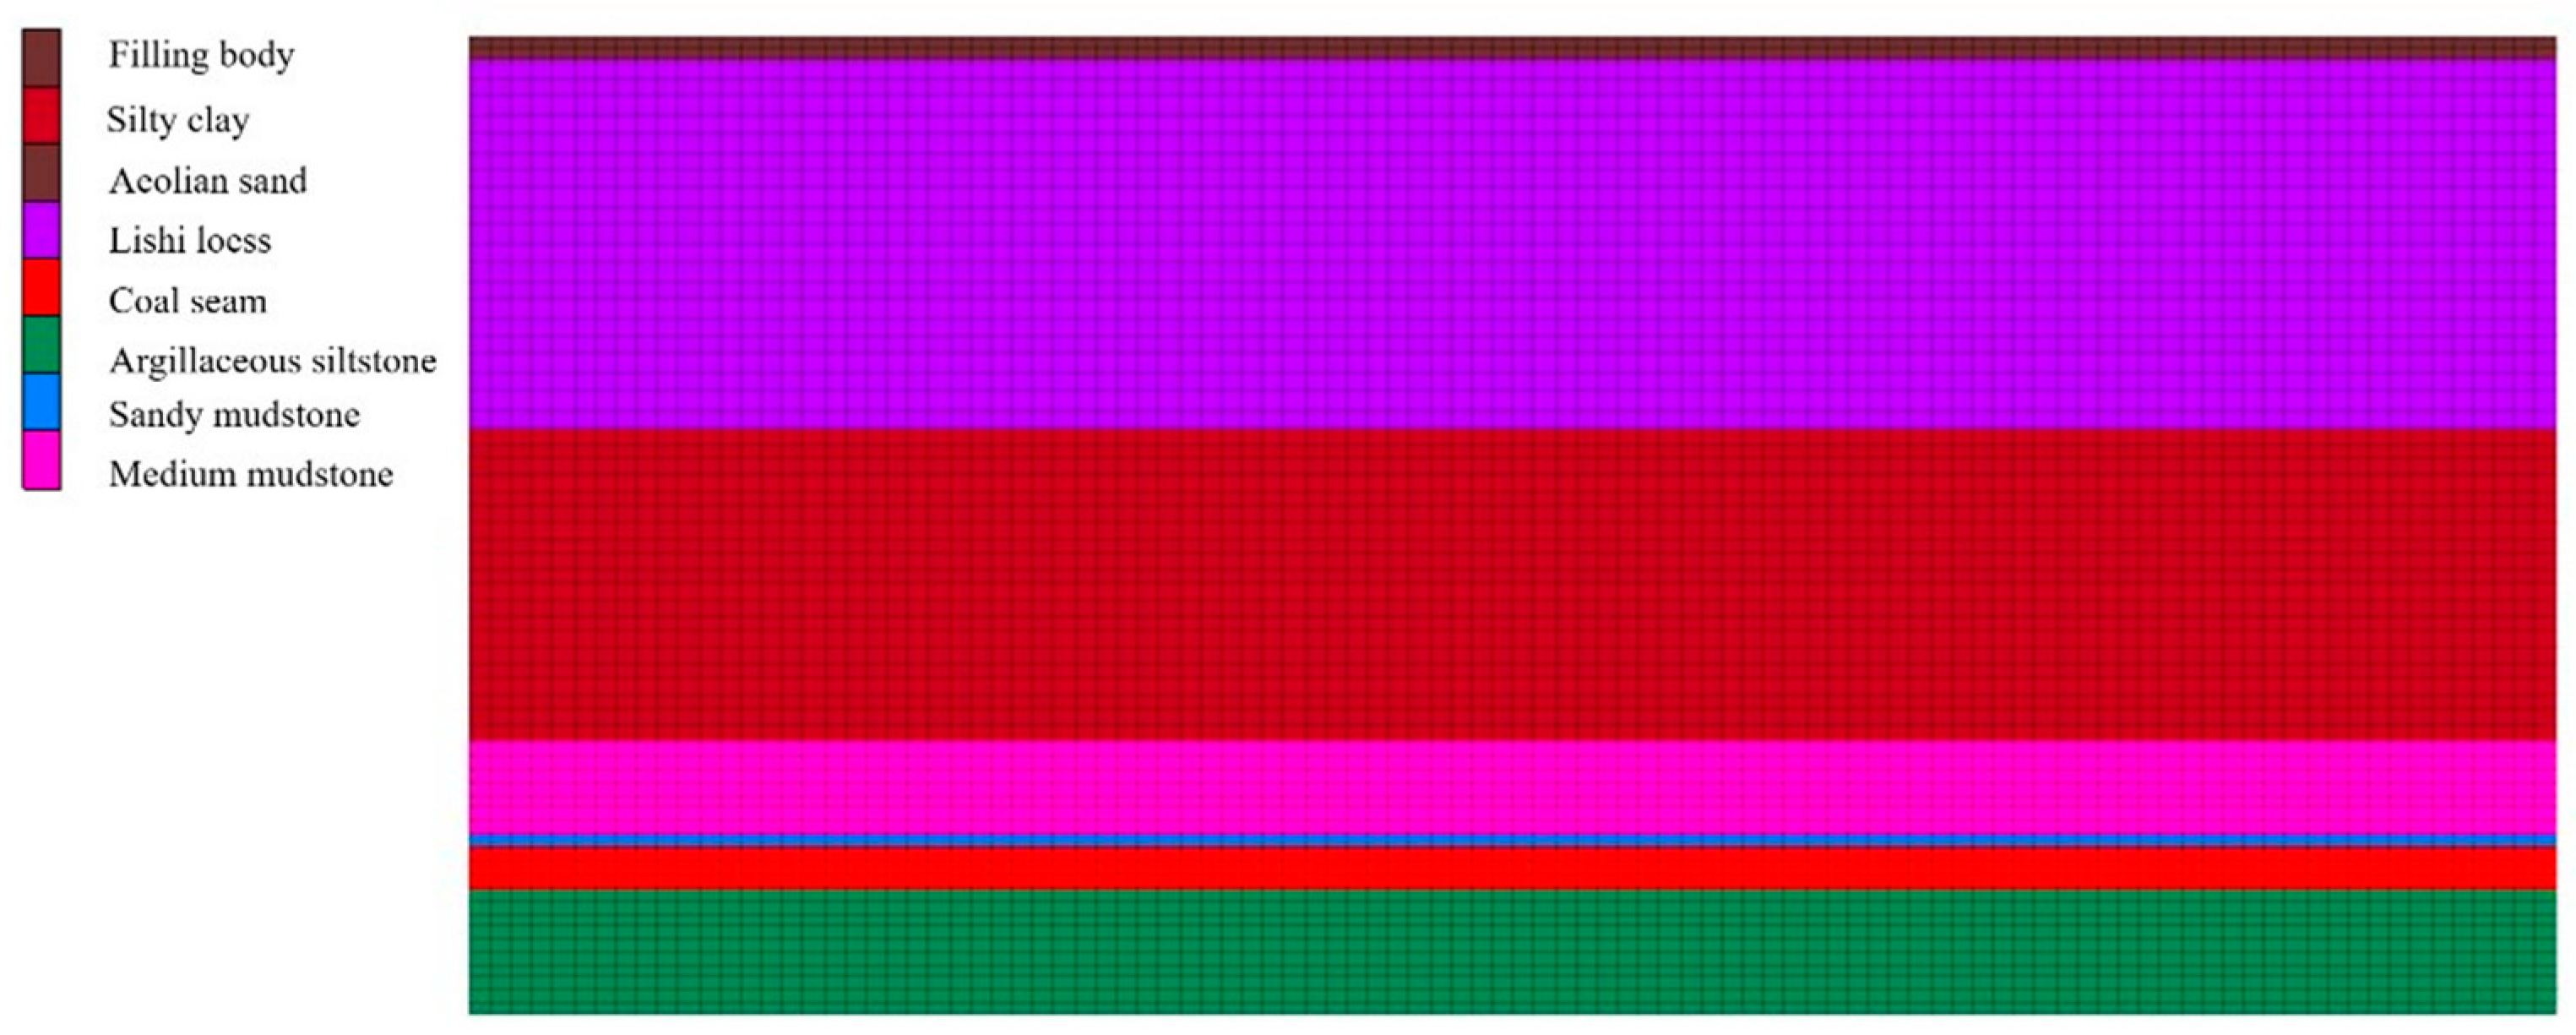
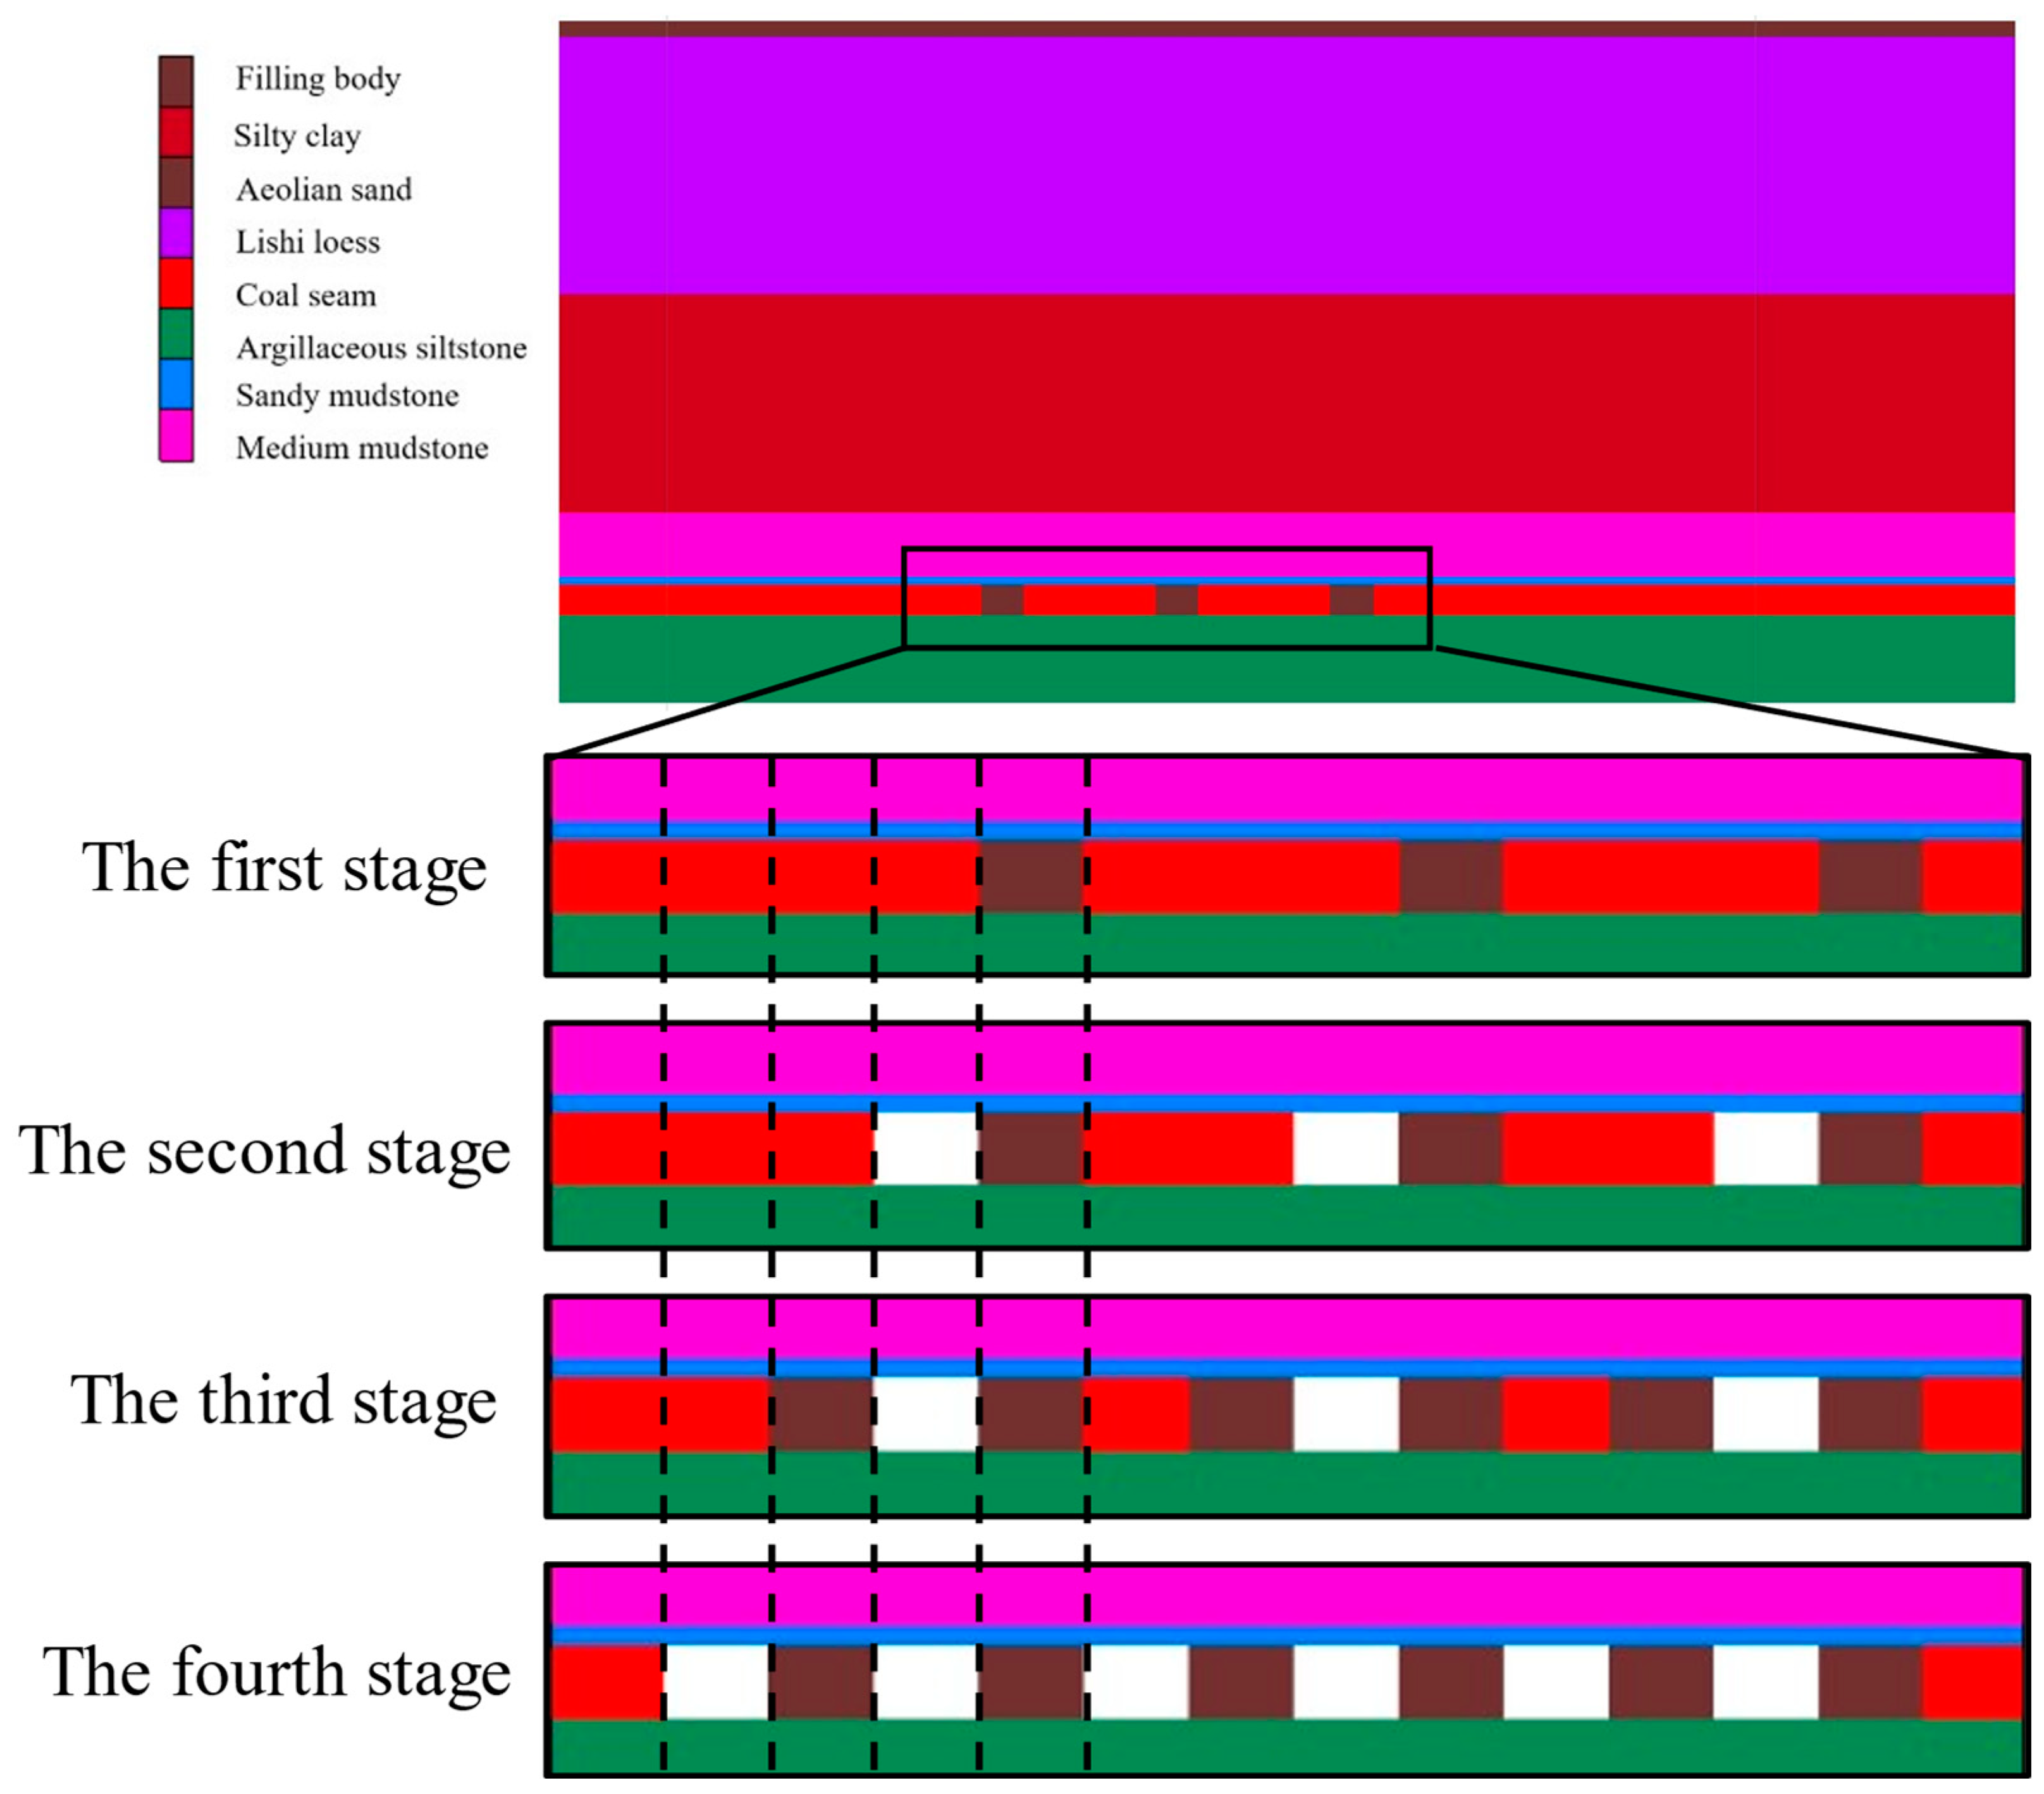
3.1. Numerical Model and Simulation Procedure for Mining and Filling

Due to its ability to perform a nonlinear large deformation analysis of continuous media and its relatively simple data and image processing, FLAC3D has been widely used and widely recognized in the field of geotechnical engineering. Based on the geological conditions of the CT30101 working face in Mahuangliang coal mine [20] and the short-wall interval strip filling process, without considering the influence of coal seam dip angle, a two-dimensional calculation model was established using FLAC3D, as shown in Figure 2. The model size is 350 m × 234 m, a 100 m long coal pillar model is retained on both sides of the working face with fixed horizontal and vertical constraints at the bottom, and the horizontal displacement is limited on both sides. The top is a free boundary.
According to the assumptions, the filling strip’s width and spacing are denoted by ‘a’ and ‘b’, respectively. The coal seam mining and filling simulation process is segmented into four phases, as depicted in Figure 3. The specific process unfolds as follows: in the initial phase, a coal pillar with width ‘a’ is mined and backfilled, with the remaining coal pillar having a width of ‘a + 2b’ on the left side. During the second phase, a coal pillar with width ‘b’ is extracted from the right side of the ‘a + 2b’-wide coal pillar, leaving behind a coal pillar with a width of ‘a + b’. In the third phase, a coal pillar with a width of ‘a’ is mined and backfilled from the right side of the ‘a + b’-wide coal pillar, leaving a coal pillar with a width of ‘b’. The final phase entails mining the remaining coal pillar. Following this pattern, the simulation encompasses a total of six filling strips and six mining strips.

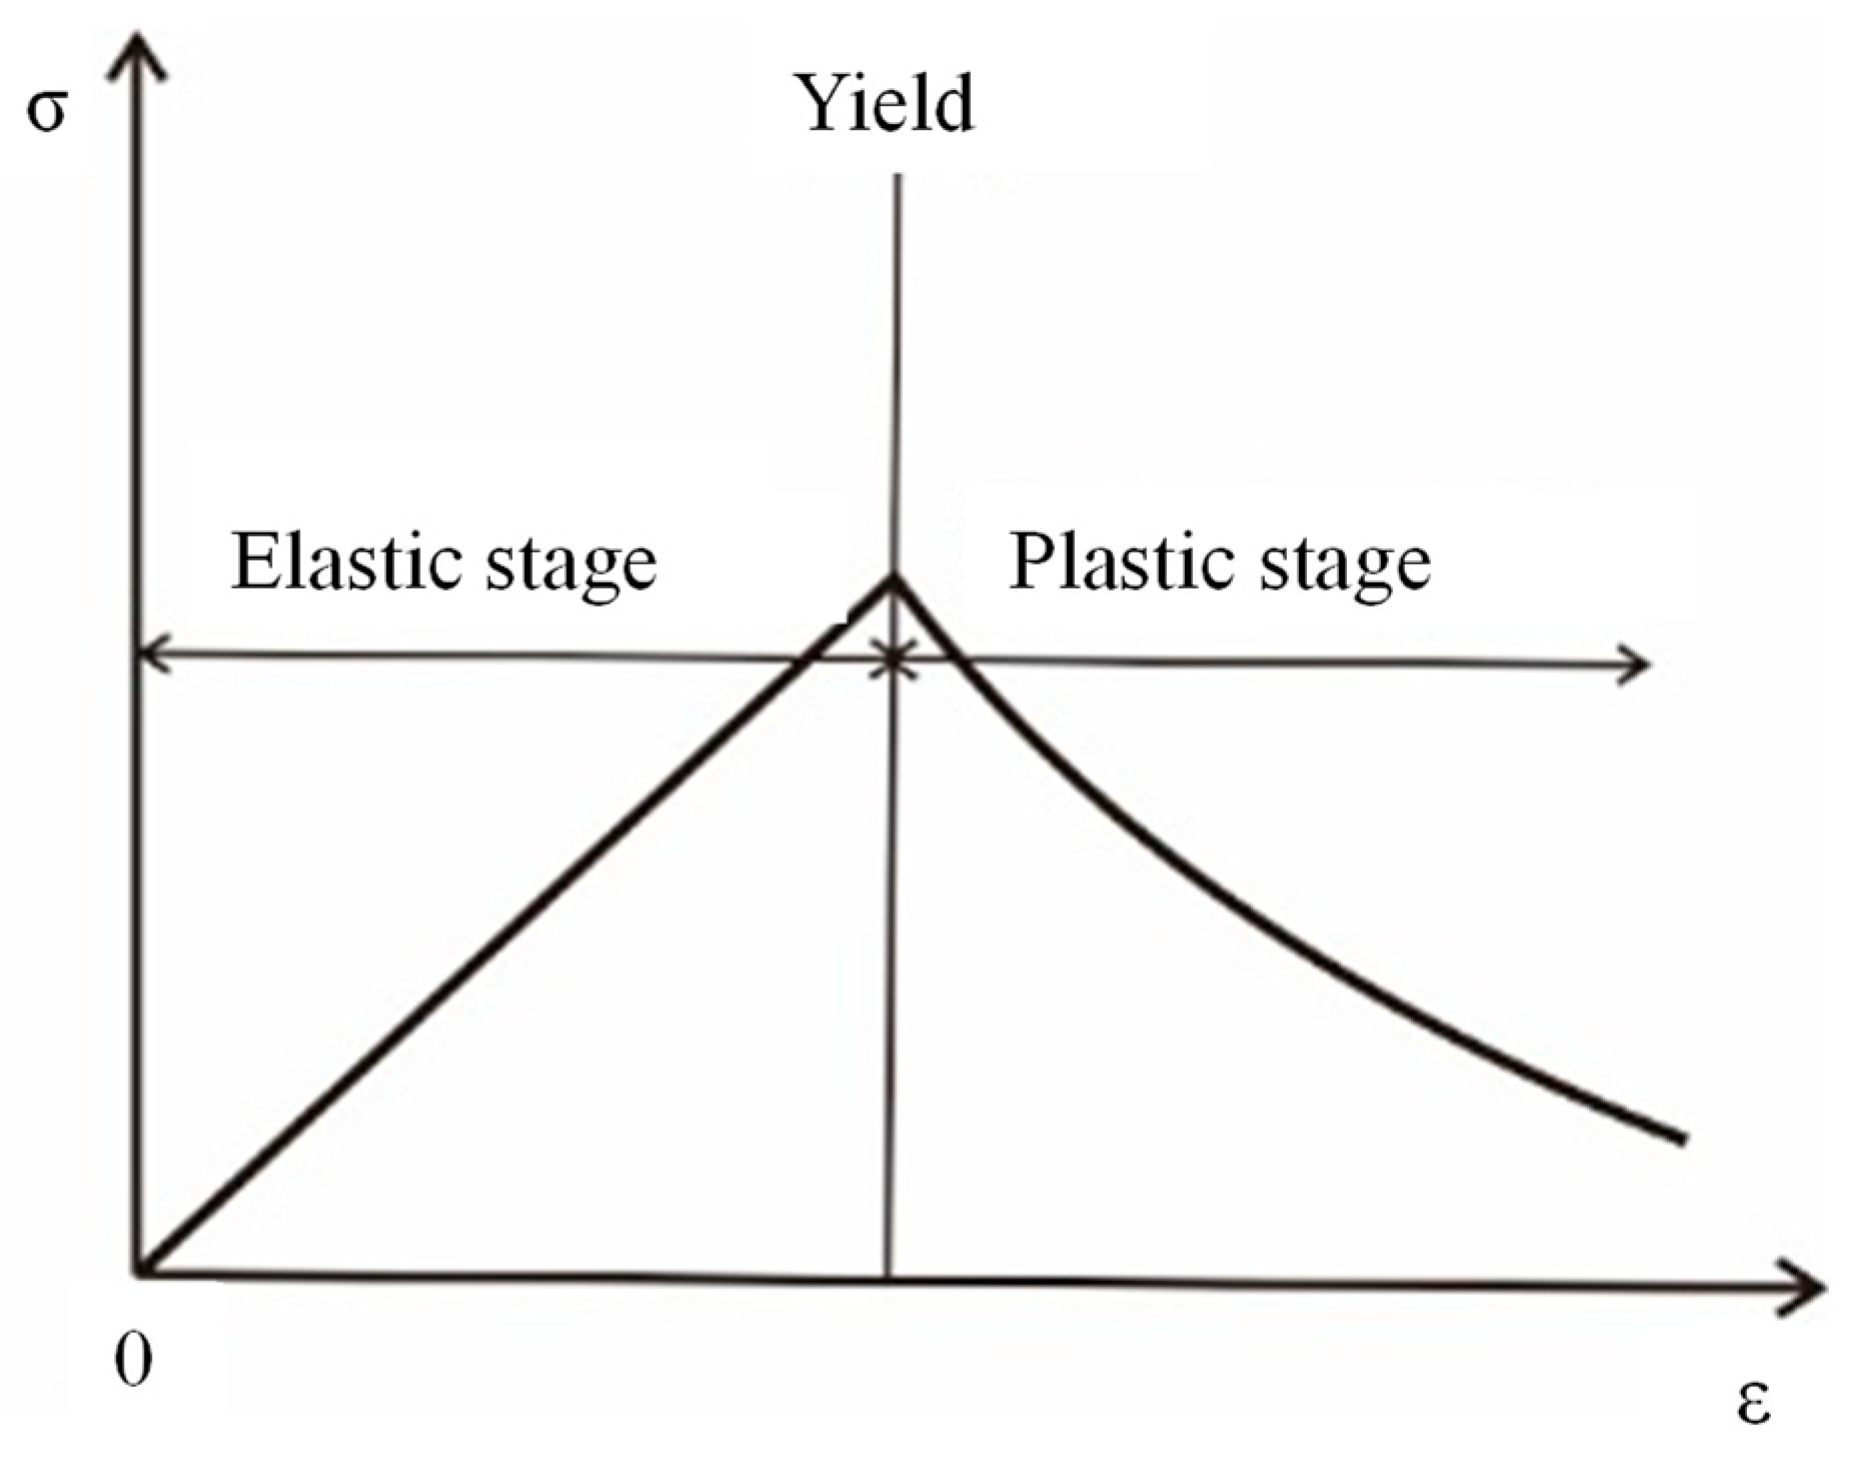
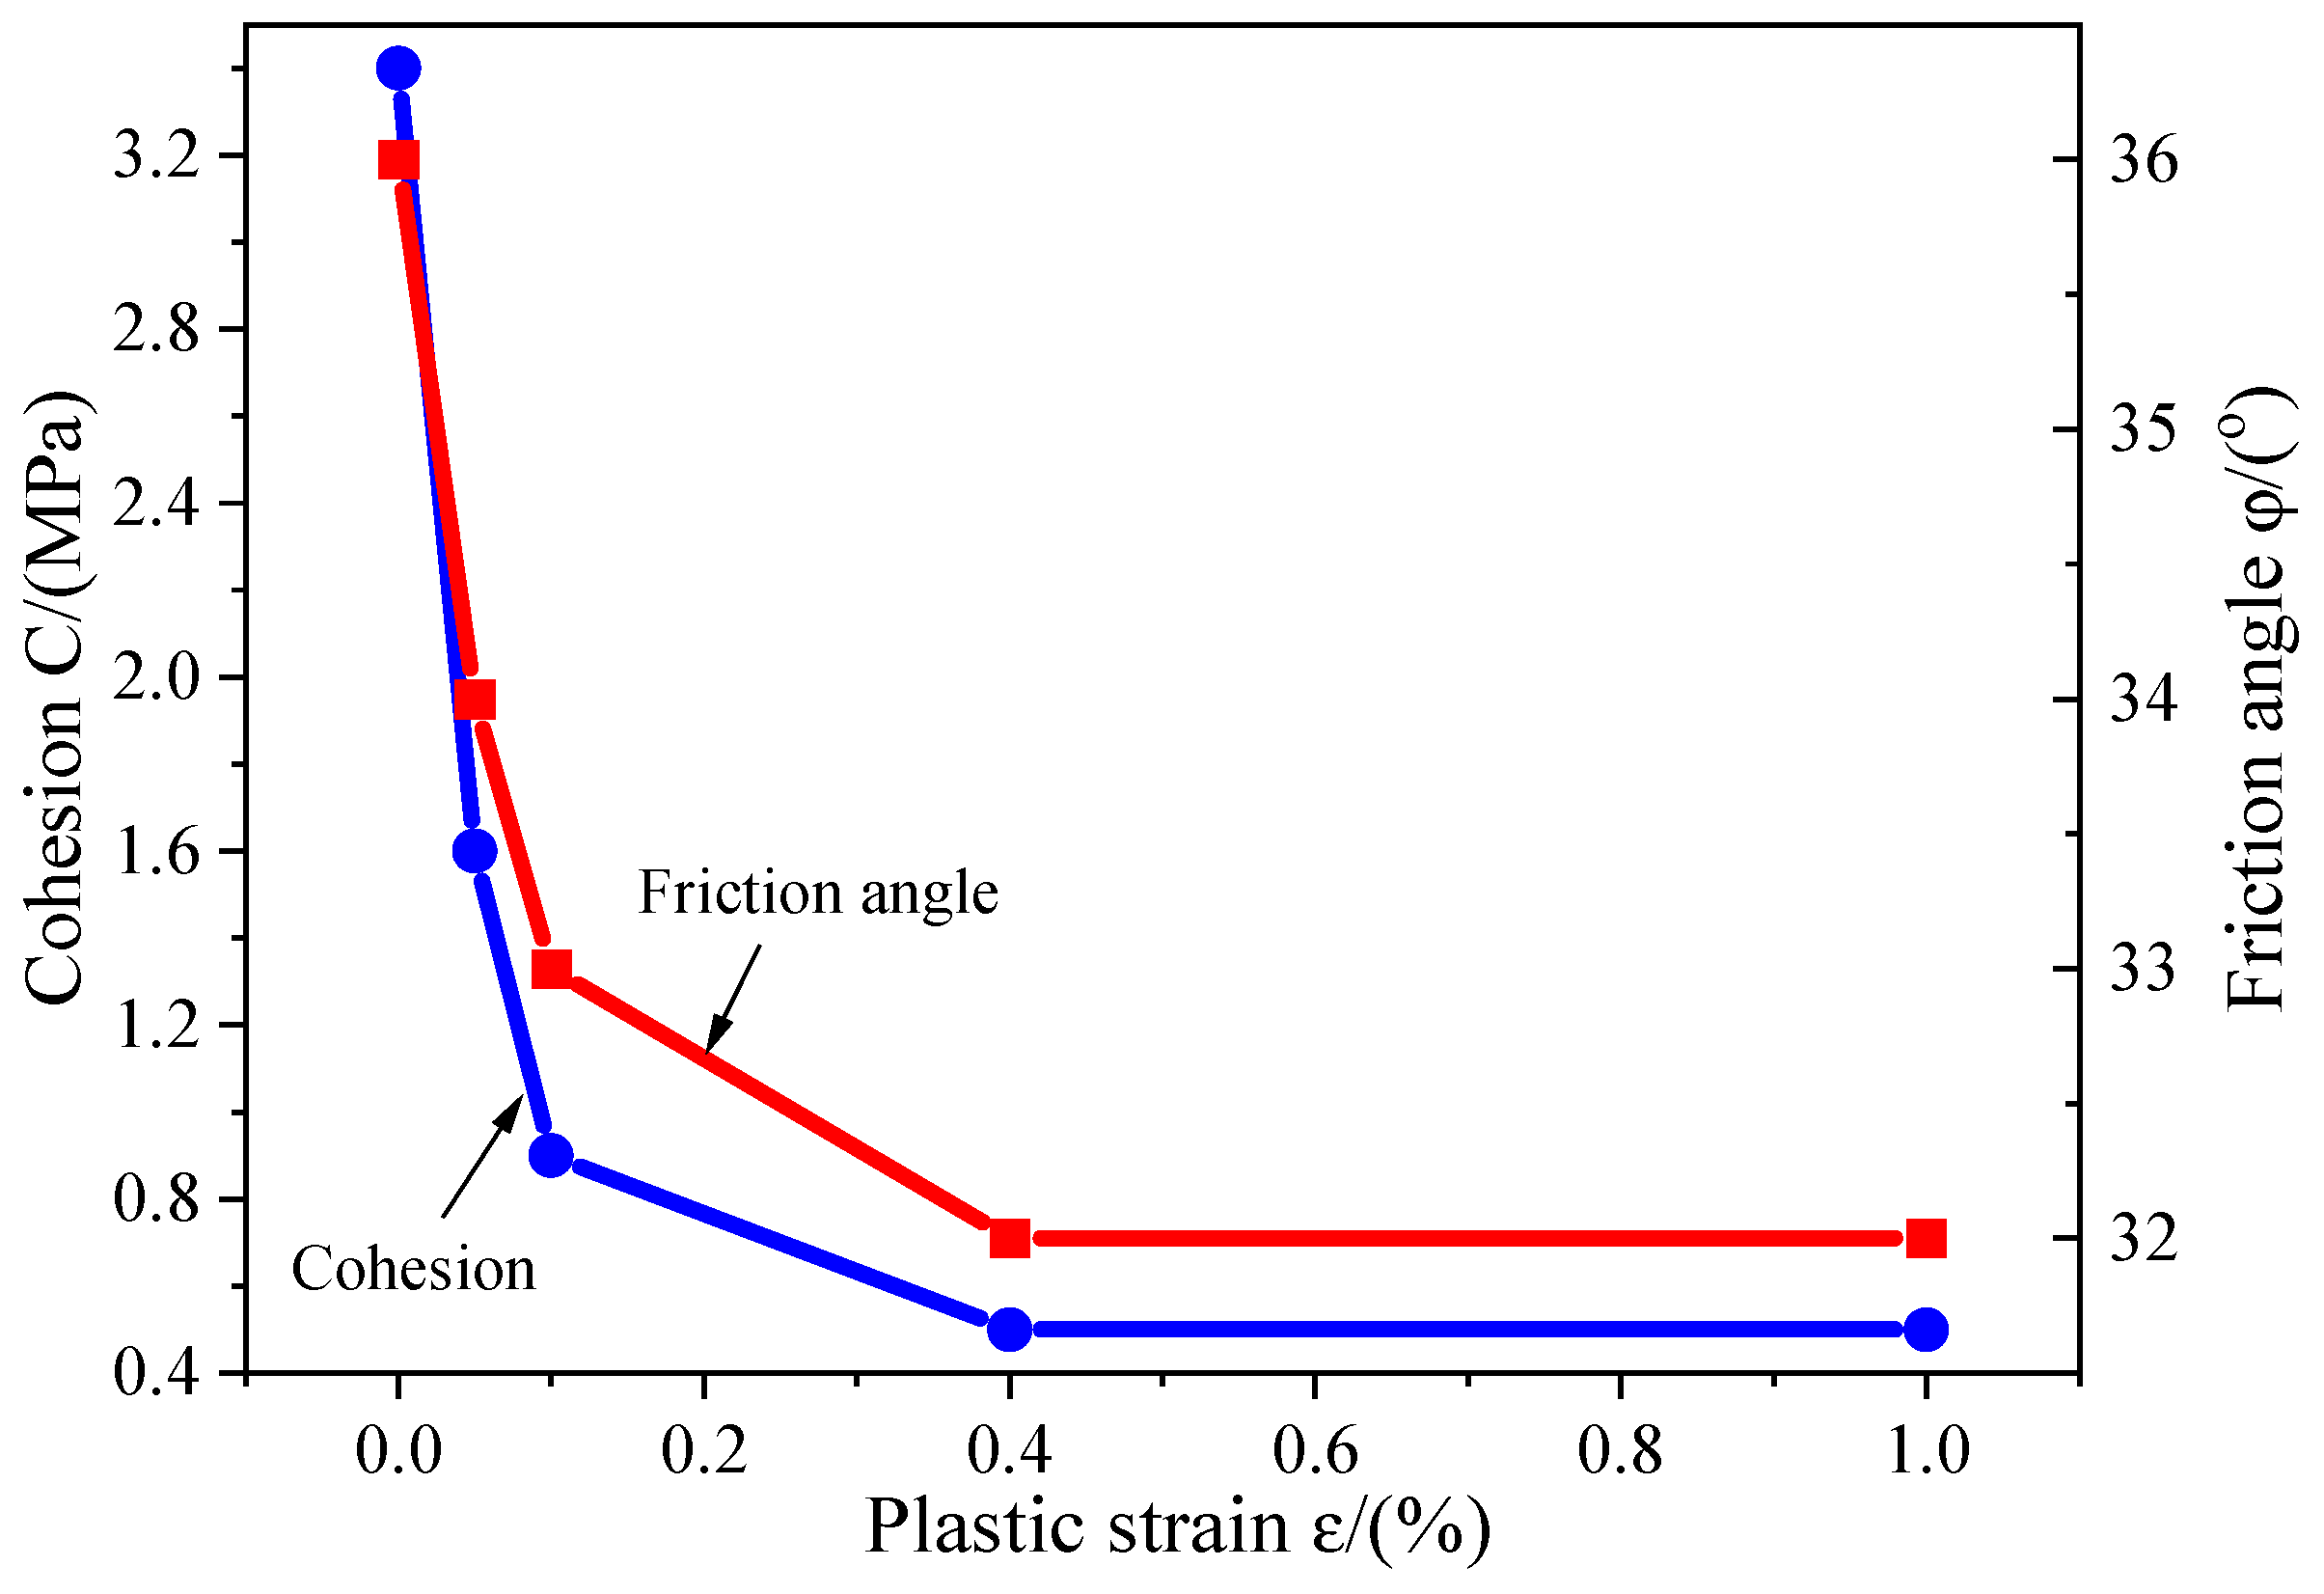
3.2. Constitutive Model and Mechanical Parameters

Employing the Mohr–Coulomb yield criterion, inclusive of tensile truncation, for each distinct layer of overburden rock, the corresponding yield function is as follows [21]:
F s = σ 1 σ 3 Φ + 2 C Φ F t = σ 3 σ t
where Φ = (1 + sinφ)/(1 − sinφ); FS is the shear yield function; Ft is the tensile yield function; C, φ, σt represents the cohesion, internal friction angle, and tensile strength of the rock layer.
The coal seam utilizes a strain-softening model, with the stress–strain curve illustrated in Figure 4. Figure 5 delineates the diminution of the coal’s post-peak shear strength parameters as they correlate with plastic strain.
Characterized as a low-cohesion granular substance, the filling paste experiences an irreversible volume reduction when bearing the load imposed by the overburden rock stratum. Consequently, the double-yield plastic model [23,24] is employed to scrutinize its yielding behavior. This model accounts for volumetric yield stemming from enduring volumetric alterations, in addition to considering shear and tensile yields. The yield criterion is expressed as follows:
f s = σ 1 σ 3 Φ b + 2 C b Φ b f t = σ tb σ 3 f N = 1 3 ( σ 1 + σ 2 + σ 3 ) + p c
where Φb = (1 + sinφb)/(1 − sinφb); ft is the shear yield function; ft is the tensile yield function; Cb, φb, σtb, and pc are the cohesion, friction angle, tensile strength, and isotropic consolidation pressure of filling body, respectively.
The hardening attributes of filling materials correlate with volumetric plasticity, and their hardening conduct is ascertained through the subsequent empirical formula [24]:
p c = 1.15 × 10 7 ( e pv 0.28 e pv ) 1.5 + 10 4
where epv is the plastic volume strain.
According to the geological survey results, the parameter values of each layer are shown in Table 1.

4. Orthogonal Experimental Design

During strip mining operations, as the workface progresses, the stress equilibrium within the rock strata is disrupted, leading to a complex, spatiotemporal evolution of strata subsidence. Reference [25] emphasizes that the primary factors influencing strata settlement in strip mining can be categorized into inherent geological aspects, fill material properties, and mining intensity elements. As a valuable extension to existing accomplishments, this paper centers on exploring the effect of the fill material’s mechanical and structural characteristics on the displacement of the surface and the overlying strata. To this end, a total of six parameters were selected as experimental factors, including the fill material’s strength parameters such as cohesion (Cb) and friction angle (φb); deformation parameters comprising elastic modulus (Eb) and Poisson’s ratio (μb); and mining site structural parameters like fill strip width (a) and fill strip spacing (b). The maximum surface subsidence (vg) and direct roof settlement (vr) were chosen as evaluation indicators.
Drawing upon geological data and relevant experimental findings from the Mahuangliang Coal Mine, the value ranges for the aforementioned factors were determined, with each factor having three equidistant levels within its range. Given that a fill strip width-to-height ratio below 0.8 is detrimental to the stability of the fill strip itself [26], this study focused solely on scenarios where the ratio exceeded 0.8. The experimental factors and their respective level values are presented in Table 2.
Incorporating the assessment factors and associated level values, the L18(36) orthogonal array was chosen to devise 18 distinct computational arrangements. The parameters characterizing each arrangement can be found in Table 3.

5. Analysis of Dominant Factors Influencing Surface and Roof Settlement

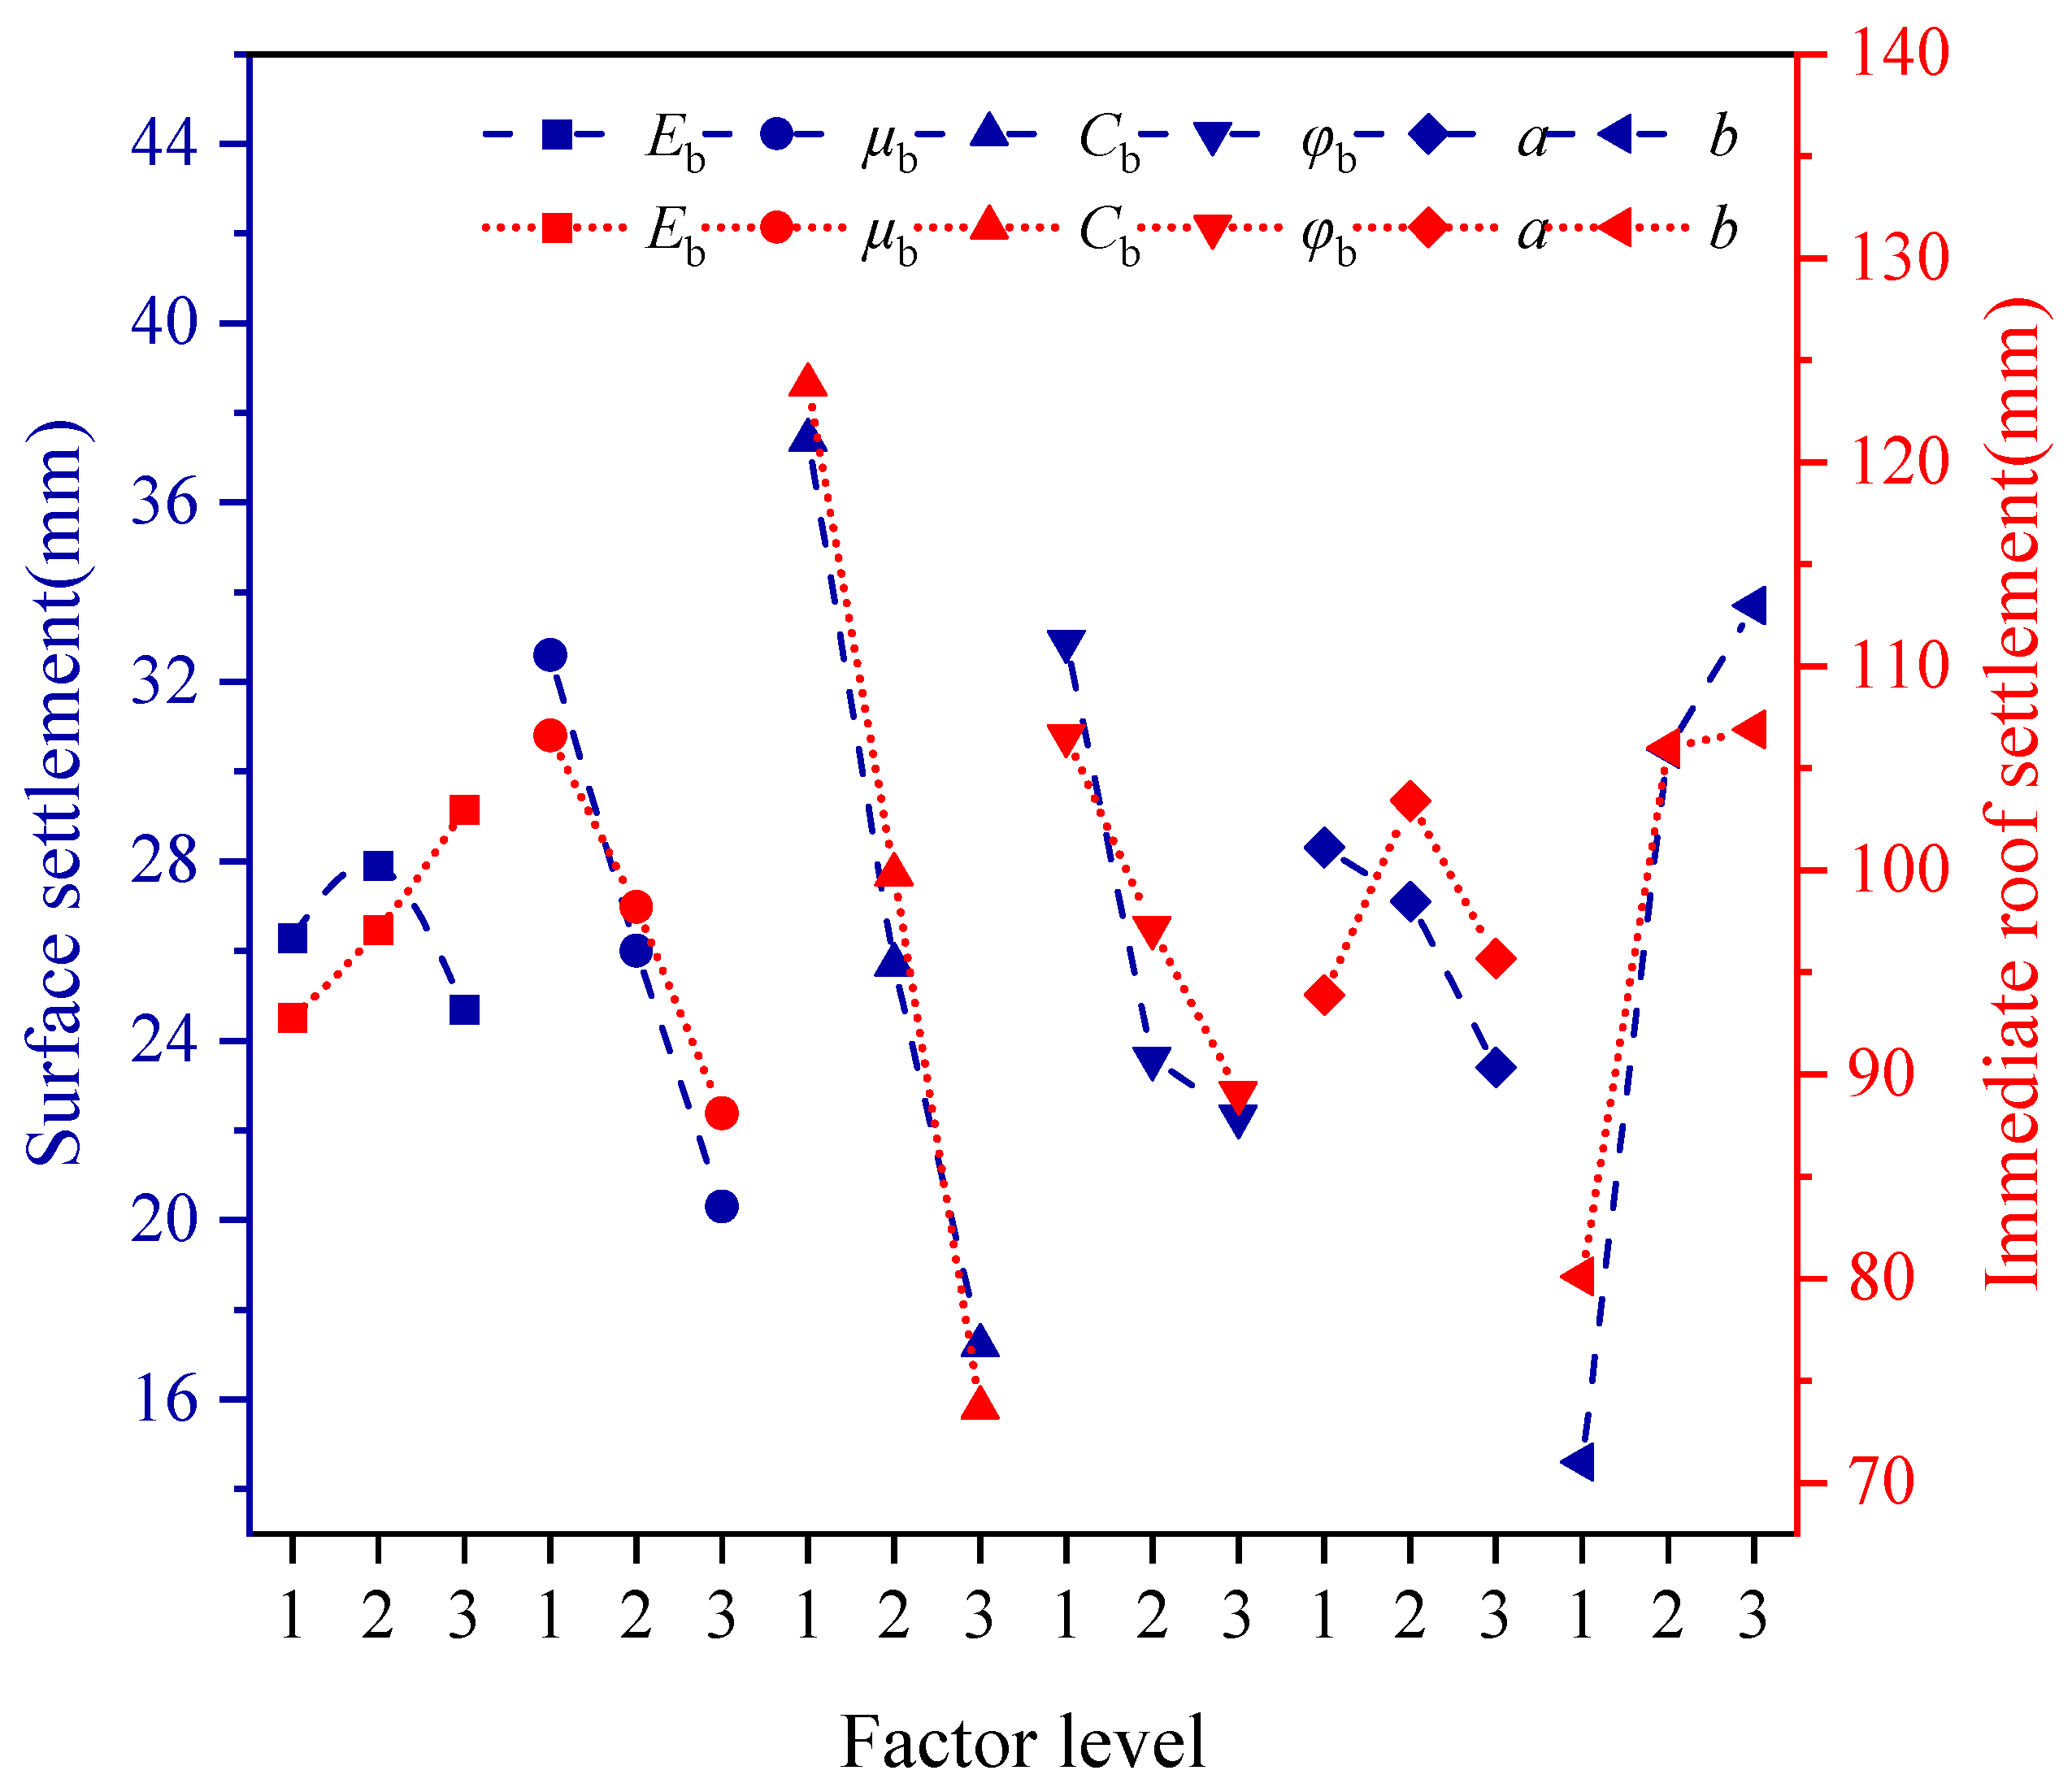
5.1. Impact of Diverse Filling Parameters on Range Analysis

The maximum surface subsidence and maximum direct top subsidence under different schemes are presented in Table 3. By taking the different levels of each factor as the horizontal axis and the average value of the corresponding evaluation indicators as the vertical axis, the relationships between each factor and the average values of maximum direct top subsidence and maximum surface subsidence were obtained, as shown in Figure 6. From Figure 6, it can be observed that the factors significantly influencing surface subsidence and direct top subsidence include the cohesive force of the fill material, the spacing between filling strips, the friction angle, and the Poisson’s ratio. The specific influence ranking are presented in the variance analysis section. The strength parameters of the fill material and Poisson’s ratio are negatively correlated with the subsidence values, while the spacing between filling strips is positively correlated. The influence of the fill material’s elastic modulus and the width of filling strips on subsidence values is relatively minor, with variations occurring only within a narrow range.

5.2. Quantification of Influential Factors and Analysis of Dominant Variables

Variance analysis can decompose the total sum of squares of deviations in experimental results into the sum of squares of deviations due to factors and the sum of squares of deviations due to experimental errors. By constructing the F-statistic and conducting an F-test, the magnitudes of the influence of various factors on the target indicators can be quantified [17].
We define the null hypothesis H0 as follows [27]: if there is no significant difference in the mean values of the observed variable under different levels of the control variable, then the effects at different levels of the control variable are simultaneously zero, denoted as
H 0 : α 1 = α 2 = = α r = 0
In other words, the variation in the control variable at different levels does not have a significant impact on the observed variable. The alternative hypothesis H1 posits that the effects are not simultaneously zero.
Utilizing the F-statistic, its mathematical definition is [27]:
F = S S A / ( k 1 ) S S E / ( n k ) = M S A M S E
where n represents the total sample size, k − 1and nk are the degrees of freedom for SSA and SSE, MSA is the mean square between groups, and MSE is the mean square within groups. The purpose is to eliminate the impact of the number of levels and sample size on the analysis.
The rejection region for H0 is [28]:
W = { f < F α / 2 ( k 1 , n k ) ,   o r f > F 1 α / 2 ( k 1 , n k ) }
Here, f represents the observed value of the F-statistic in the test. Its corresponding p-value is:
P = 2 min P H 0 { F > f } , P H 0 { F < f }
Using significance levels α = 0.01, 0.05, and 0.1, the influence of each factor was quantified into four levels: highly significant, significant, somewhat influential, and no influence. The observed values of the F-statistic and the corresponding probability p-values were calculated using SPSS Statistics 26 software. If the probability p-value was less than the significance level α, the null hypothesis was rejected, and it was concluded that the different levels of the control variable have an impact on the observed variable. Conversely, if the p-value was greater than the significance level, the null hypothesis was accepted, and it was assumed that the different levels of the control variable had no impact on the variable.
Table 4 and Table 5 present the quantified impact of fill parameters on ground surface and immediate roof displacements, respectively. The factors influencing ground subsidence, in descending order of impact, are fill cohesion, strip spacing, fill friction angle, fill Poisson’s ratio, fill strip width, and fill elastic modulus. Notably, fill cohesion and strip spacing have a considerable effect on ground subsidence. Regarding immediate roof subsidence, the factors’ impact decreases in the following order: fill cohesion, strip spacing, fill friction angle, fill Poisson’s ratio, fill elastic modulus, and fill strip width. Fill cohesion has a highly significant influence, while strip spacing and friction angle have a substantial effect. Since the fill undergoes plastic deformation after bearing overburden load, the influence of the fill’s elastic modulus is minimal. Additionally, the fill strip width primarily affects the fill’s stability, and the immediate roof subsidence mainly occurs above the extracted area; thus, the fill width has a marginal impact on the immediate roof subsidence. Consequently, to control the immediate roof and ground surface subsidence within a limited range, the fill strength parameters must meet specific requirements, and the mine structure parameters must be rationally designed.
In summary, the influence of fill strength parameters, deformation parameters, and structural parameters on ground surface subsidence and immediate roof subsidence follows a similar order. Comparatively, the fill strength parameter cohesion and the fill structure parameter, namely, fill width, have the most significant impact and serve as the primary controlling factors for roof overburden and ground subsidence. In fill mining engineering, the fill and immediate roof exhibit contact-coupling effects; thus, the influence on immediate roof displacement is more pronounced than on ground surface subsidence.

6. The Disturbance Law of Main Control Factors on Roof Overburden Rock

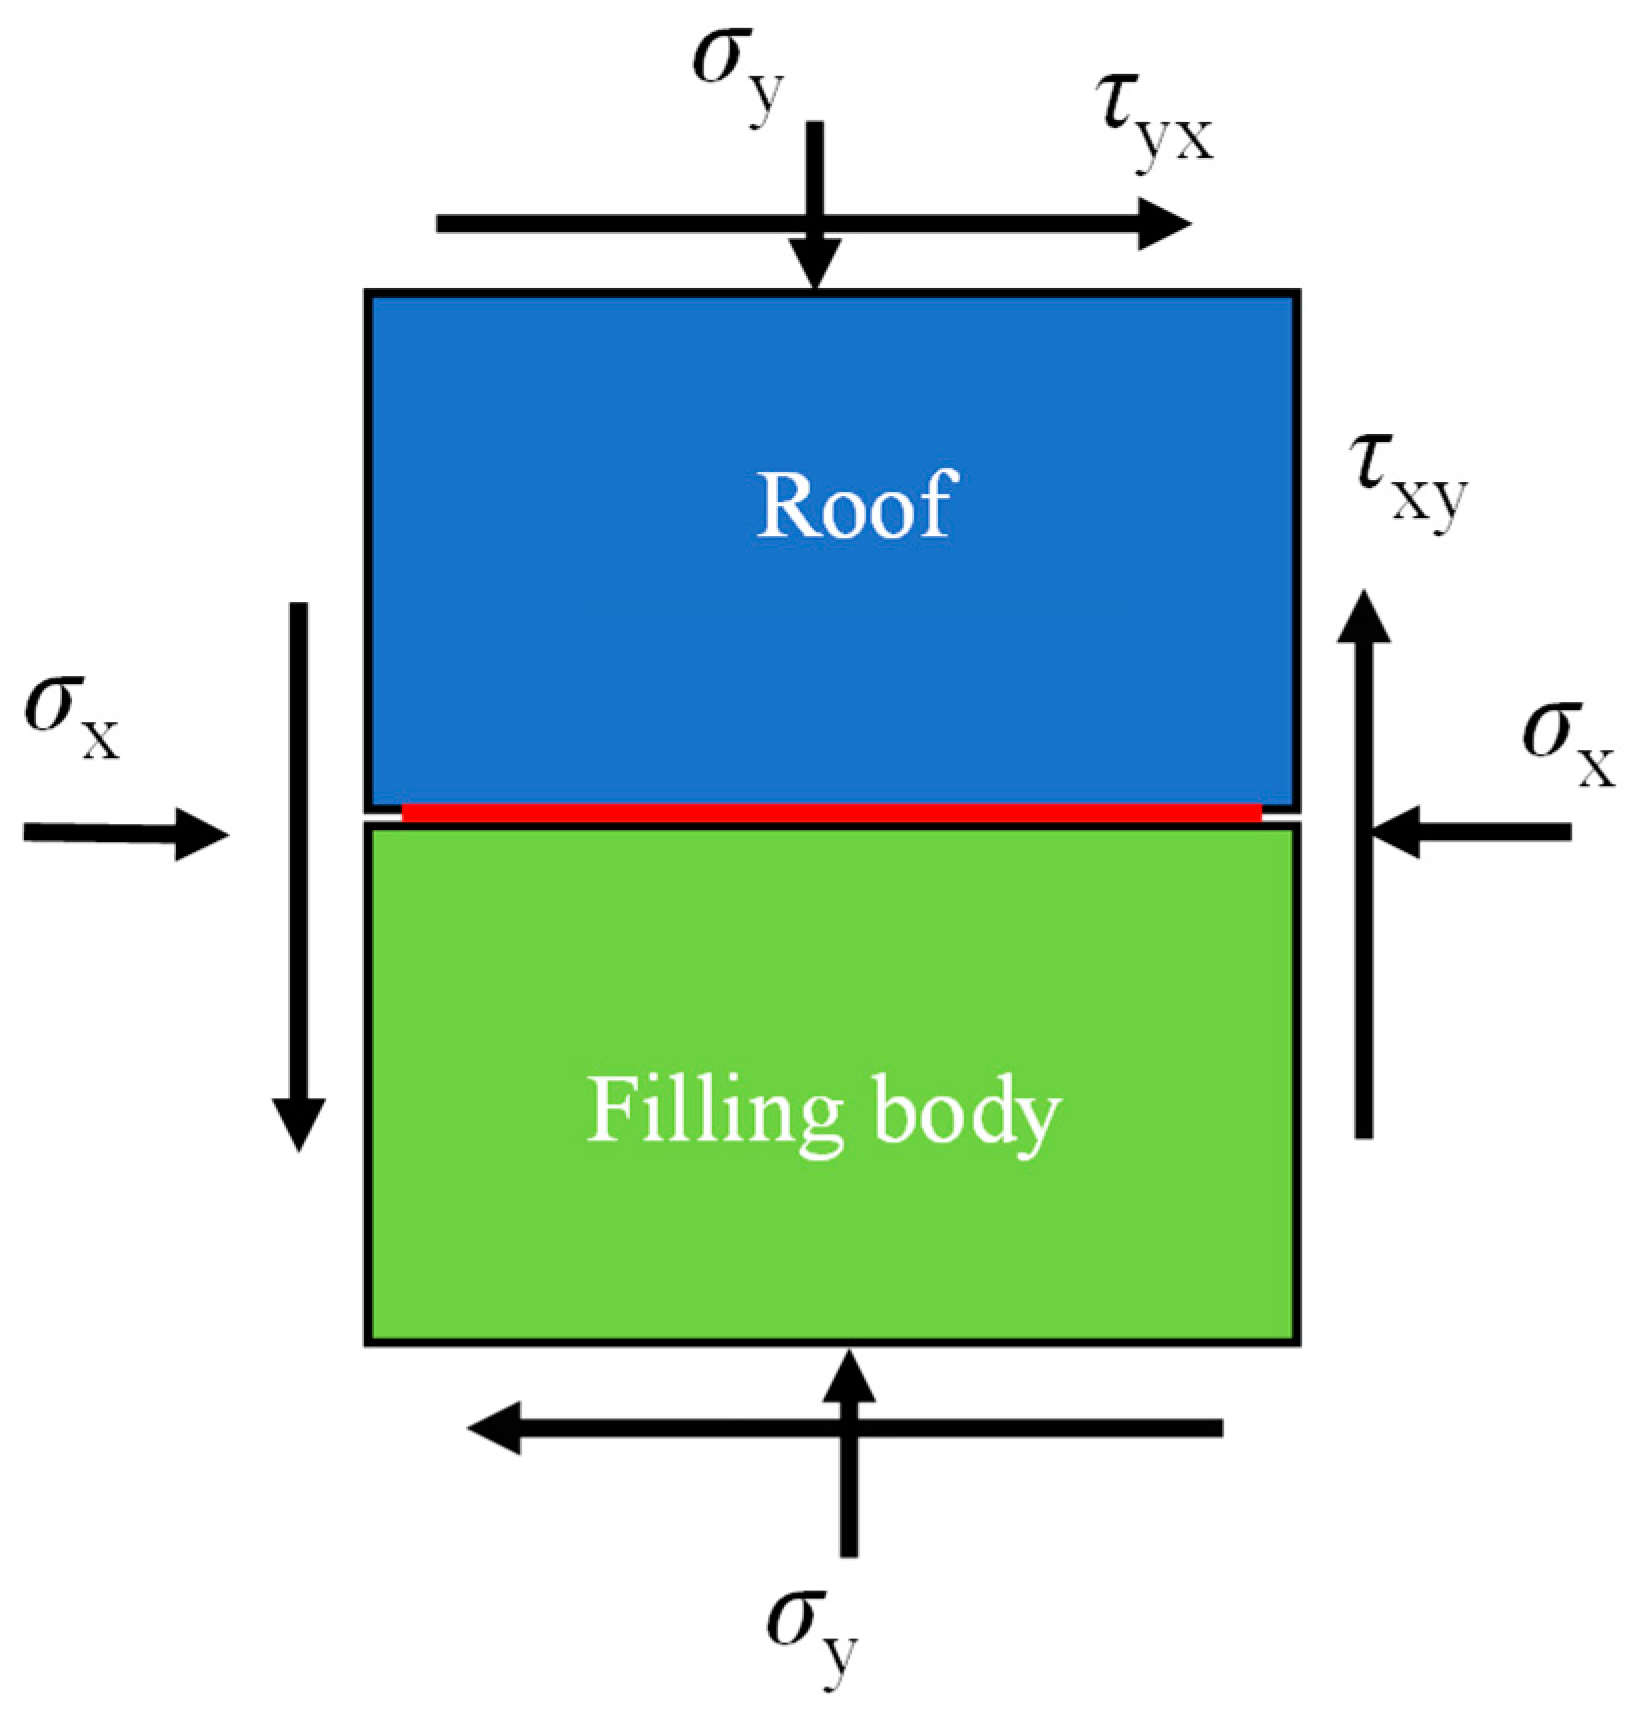
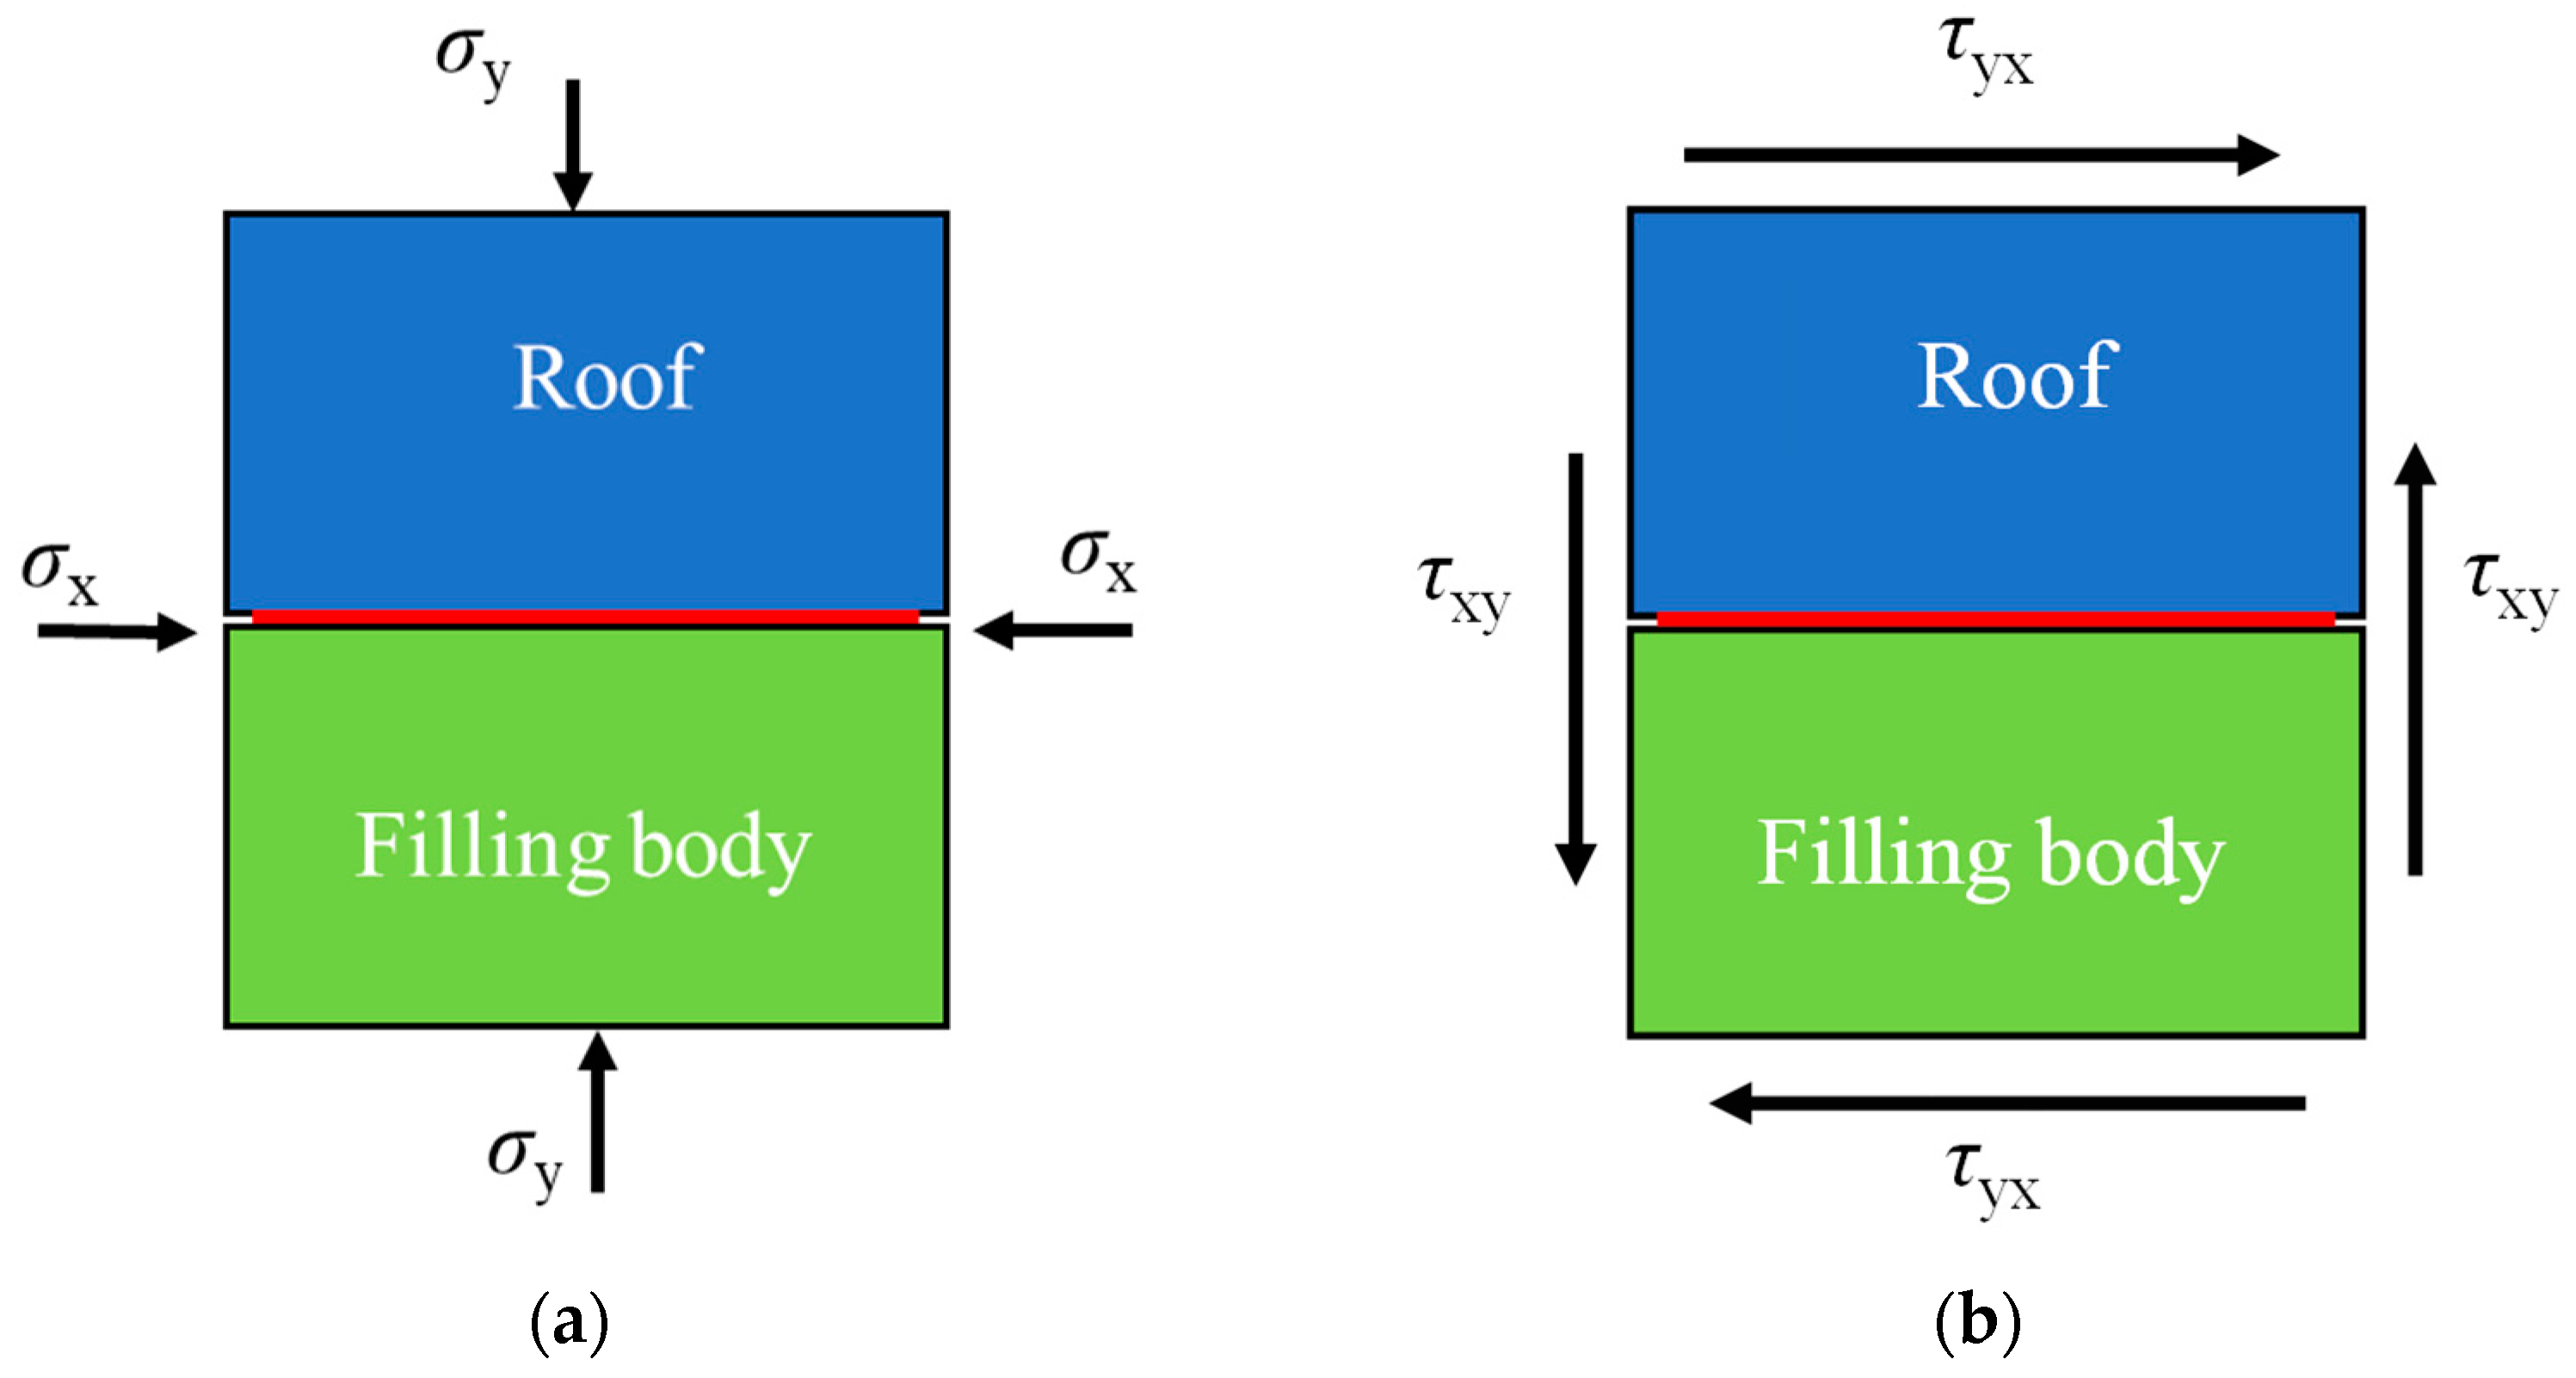
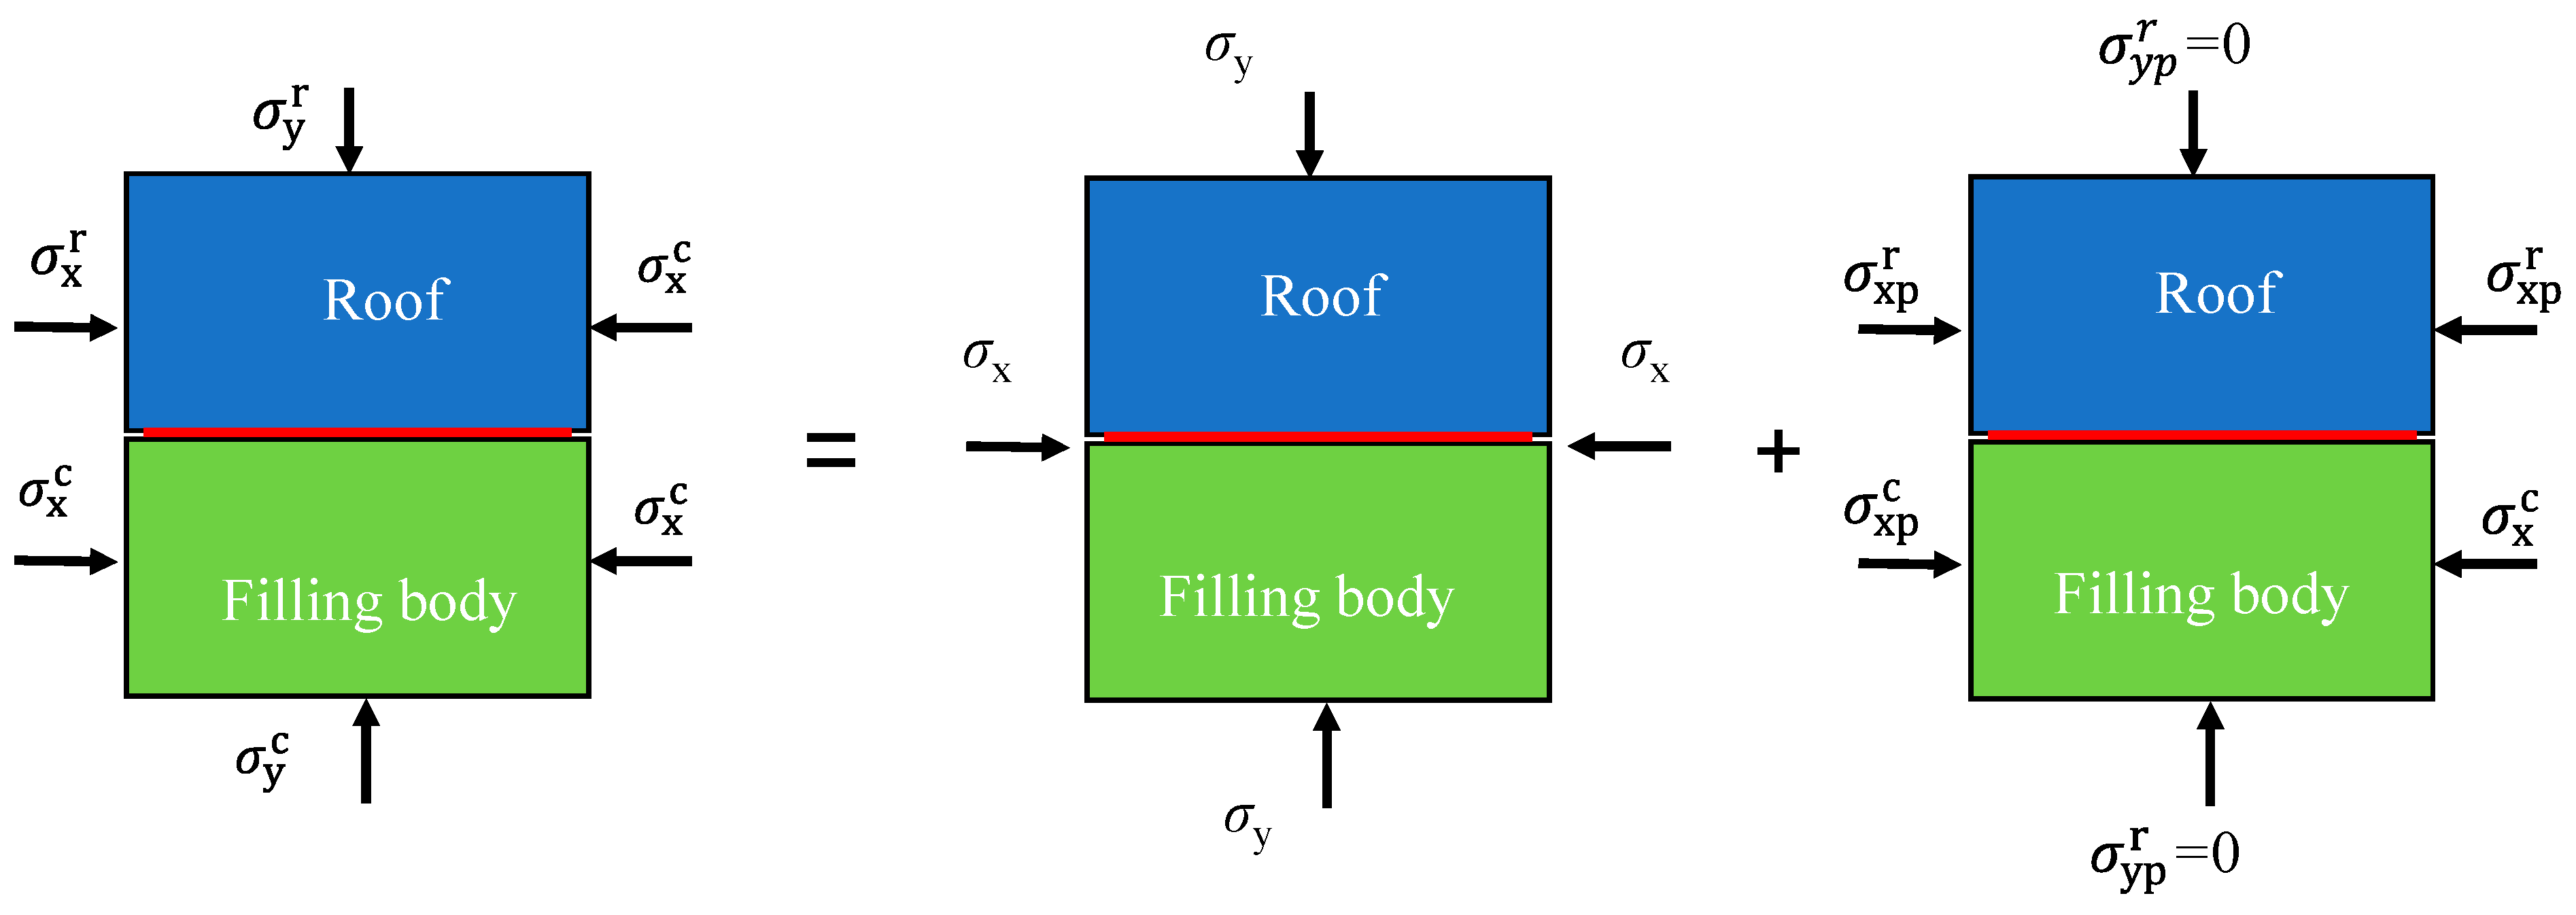
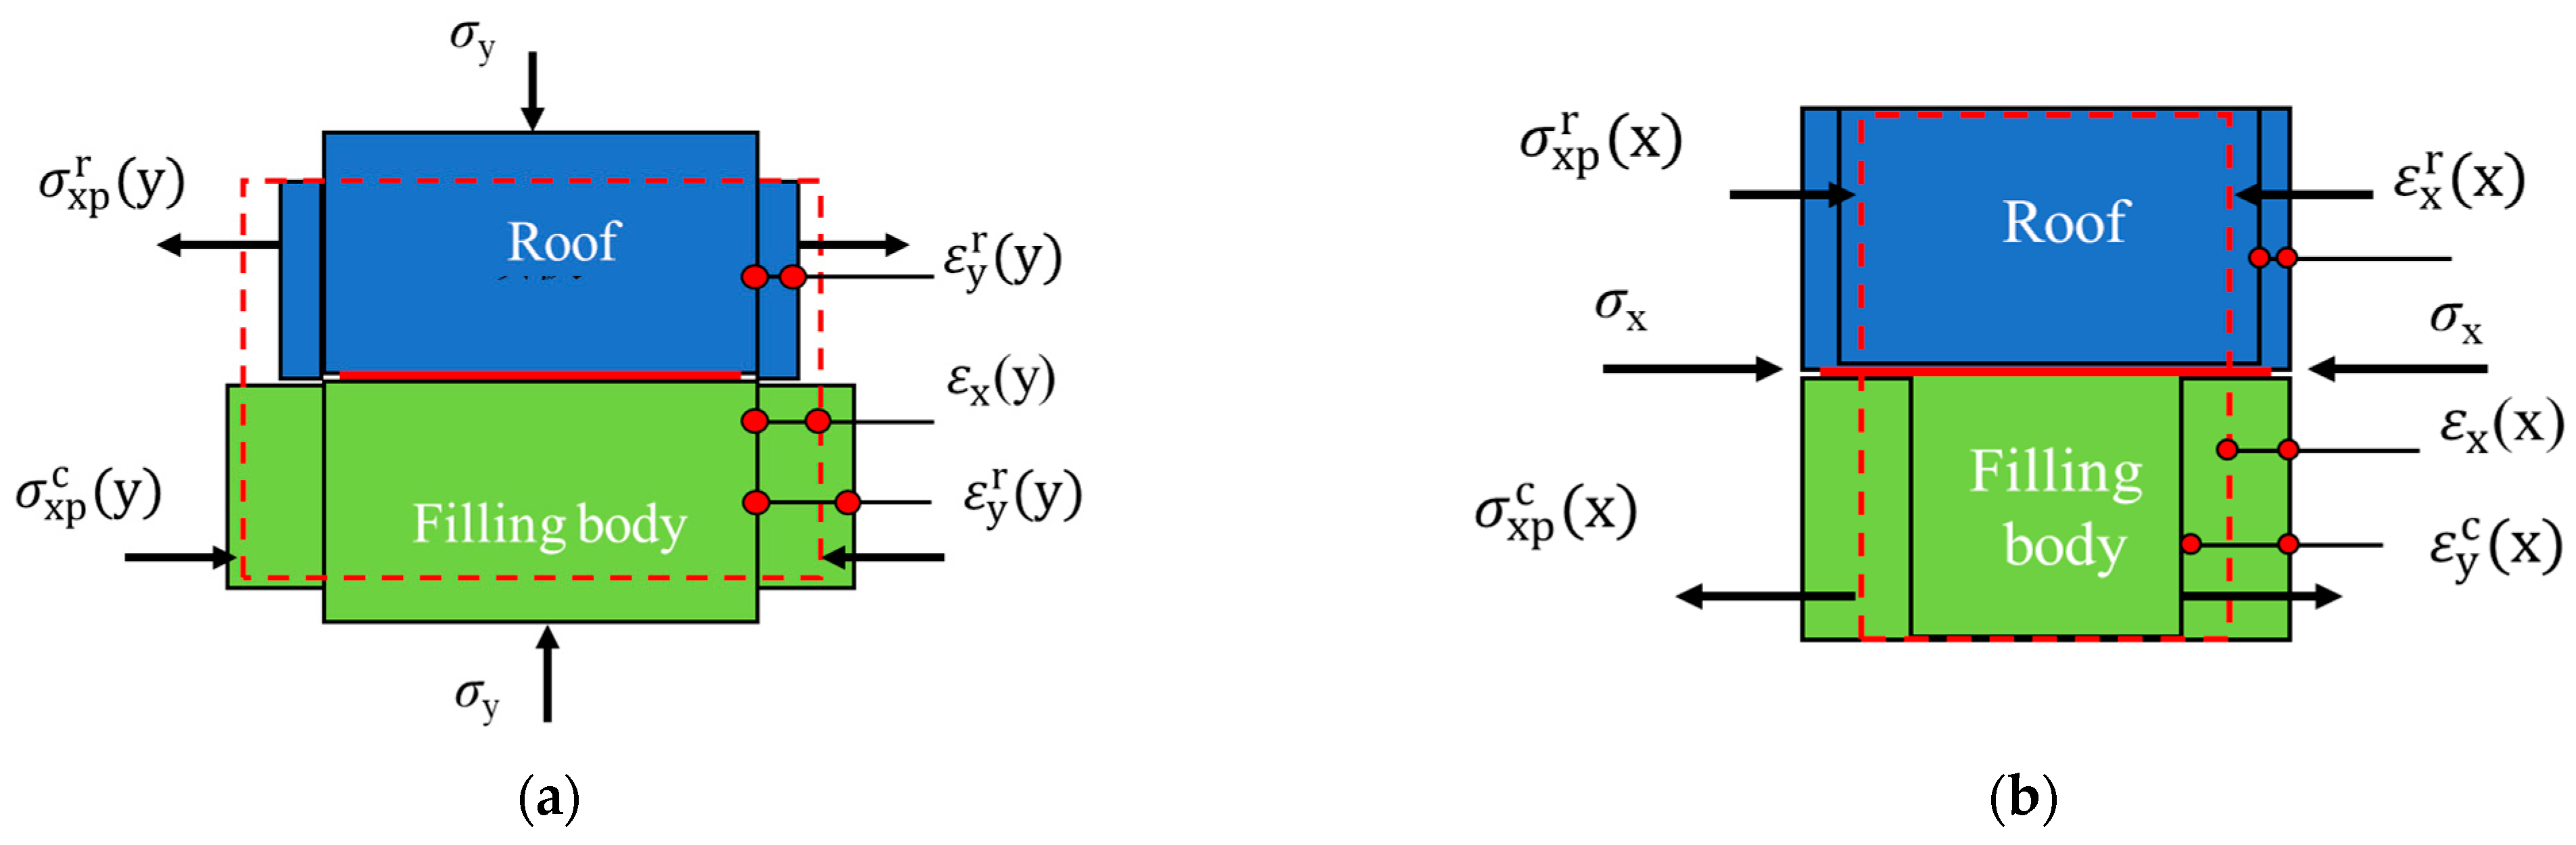
6.1. Analysis of Interface Coupling between Top and Bottom Plates and Strip Backfill

As can be seen from the previous section, the coupling effect between the top plate and the filling body is the key factor for direct roof settlement. However, in the previous failure analysis of the filling strip overlying rock top plate, the top plate filling body was not considered as the overall bearing structure, and the rock type of the top plate was not included in the failure analysis of the filling body. In view of this, this section describes an analysis of the coupling effect between the roof and the filling body, and the occurrence state of the filling body and rock layer in strip filling mining is shown in Figure 3.
In order to analyze the influence of the interface effect of the roof-filling body on the stress state of the two, a variable parameter micro-element A was taken near the interface of the roof-filling body, and the stress state is shown in Figure 7.
It was assumed that there is no frictional sliding at the interface of the composite body. Due to the constraint effect of the interface, the deformation of the filling body and the top plate is limited, which induces derived stress near the interface area of the two bodies, resulting in a change in the stress state of the two bodies near that area. Assuming that the elastic moduli of the top plate and filling body are Er, Ec, and the Poisson’s ratio is μr, μc, respectively. Due to the difference in elastic constants, two bodies will inevitably undergo different deformations under the same force conditions as shown in the diagram. In order to maintain the bond between the two bodies as a whole and ultimately produce the same deformation, stress will inevitably be derived at the junction layer, which will constrain the deformation of the two bodies in that area. There will be stress discontinuity on both sides of the interface, but displacement will remain continuous.
To analyze the derived stress, the stress state of the microelement in Figure 7 is divided into two parts using the superposition principle: normal stress and shear stress, as shown in Figure 8.
For the convenience of analysis, we set Er > Ec, μr < μc, and β1 = Er/Ec, β2 = μr/μc, specifying that the compressive stress is positive. Under normal stress, no shear stress will be derived. The normal stress on each surface should be the superposition of the original normal stress and the normal stress derived from interlayer constraints (as shown in Figure 9). According to the superposition principle, there exists
σ y r = σ y , σ y c = σ y σ x r = σ x + σ xp r , σ x c = σ x + σ xp c
where r, c represent the top plate and filling body, and p represents the derived stress caused by interlayer constraints.
As shown in Figure 10a, when σy acts alone, the top plate and filling body expand outward laterally, and the filling body experiences tensile strain ε c x (y) in the x direction. Similarly, the top plate also experiences tensile strain ε r x (y) in the x direction, where the x in parentheses represents the direction of normal stress. However, due to Er > Ec and μr < μc, the lateral strain relationship between the two bodies is ε r x (y) < ε c x (y). Due to the interface bonding effect, there is no sliding between them. In order to maintain lateral strain coordination near the interface, the final lateral strain in the x direction should be εx(y). Therefore, under the action of σy, the compressive stress σ c x p (y) is derived in the x direction in the filling body near the interface area, while the tensile stress σ r x p (y) is derived in the top plate. According to the static relationship, σ c x p (y) = σ r x p (y) should be obtained. For the convenience of analysis, it is uniformly referred to as σxp(y).
As shown in Figure 10b, when σx acts alone, the two bodies generate compressive strains ε c x (x) and ε r x (x) in the x direction, respectively, and ε c x (x) > ε r x (x). Due to the bonding constraint, the coordinated transverse strain in the x direction should be εx(x), resulting in tensile stress σ x p c (x) in the filling body and compressive stress σ r x p (y) in the top plate, and σ c x p (x) = σ r x p (y), denoted as σxp(x).
From the above analysis, it can be seen that when a certain normal stress acts alone, it derives other directions of normal stress in the top-plate filling body, thereby changing the stress state of the two bodies near the area. Based on the above analysis, there exists the following deformation geometric relationship when each normal stress acts alone:
ε x r ( y ) = ε x c ( y ) = ε x ( y ) ε x r ( x ) = ε x c ( x ) = ε x ( x )
Using the generalized Hooke’s law, we derive the normal stress by solving the above equation
σ xp ( y ) = β 1 β 2 β 1 + 1 μ c σ y σ xp ( x ) = β 1 1 β 1 + 1 σ x
Substituting the above equation into Equation (8), the normal stress of the microelements in the top-plate filling body near the interface between the two bodies is
σ y r = σ y , σ y c = σ y σ x r = a 1 σ x a 3 σ y σ x c = a 2 σ x + a 3 σ y
where a 1 = 2 β 1 β 1 + 1 , a 2 = 2 β 1 + 1 , a 3 = β 1 β 2 β 1 + 1 ν m .
Due to the lack of consideration for the anisotropy of the filling body and the roof, only the shear stress related to the transverse deformation of the interface in Figure 8b derives other shear stresses under the action of shear stress alone. τxy and τyx do not derive other shear stresses. In summary, due to the bonding constraint effect at the interface between the filling body and the top plate, the stress state in the filling body and the top plate is changed. At the interface, the strain of the two bodies remains coordinated, but due to the difference in deformation constants, some stresses are not continuous. If β1 = β2 = 1, that is, the deformation coefficient of the top plate combination of the filling body is the same, no derived stress is generated at the interface. The model established in this article assumes ideal conditions, where the filling body is in contact with the direct roof, without considering some unsupported spaces due to the technical and compaction properties of the backfill material.

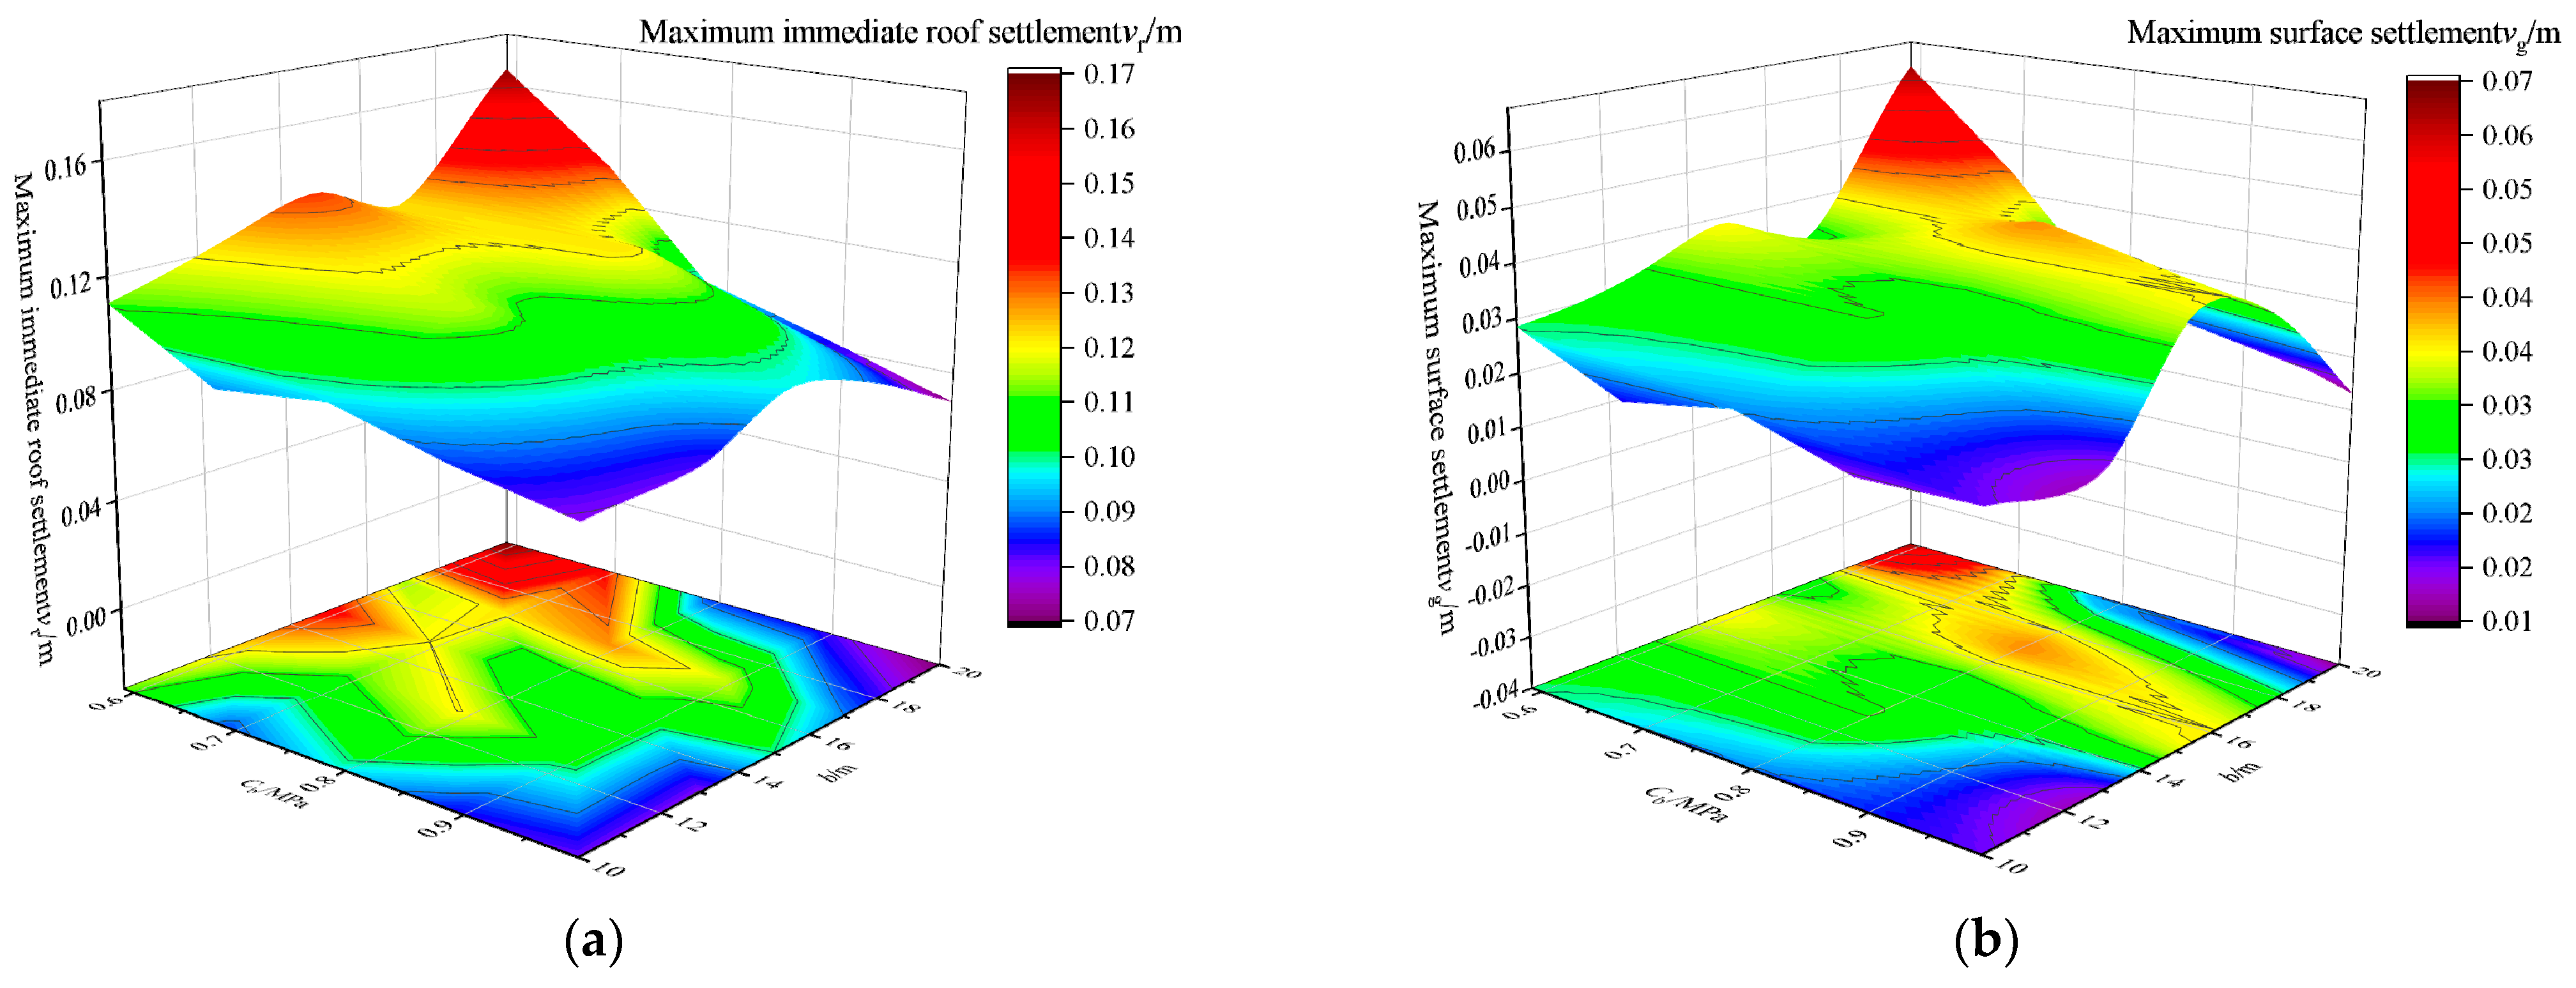
6.2. The Influence of Various Combinations of Key Factors on Evaluation Indicators

To determine the influence of varying cohesive forces of backfill material and inter-strip spacing on maximum surface and immediate roof subsidence, five distinct levels of Cb and b were assessed within their respective value ranges. The other factors were held constant at their median values, as shown in Table 2. A total of 25 simulations were conducted, and the results were plotted as a three-dimensional mapping surface, depicted in Figure 11. It can be observed that the maximum surface and immediate roof subsidence follow similar trends in response to changes in the controlling factors. As the strip spacing increases, the subsidence values of both the immediate roof and the surface exhibit a fluctuating upward trend, primarily due to the increased exposure length of the immediate roof and the consequent weakening of its resistance to bending deformation. With the augmentation of the cohesive force, the load-bearing capacity of the backfill material is enhanced, significantly reducing the subsidence values of the immediate roof and surface. Moreover, as the strip spacing changes, the trend shifts from a fluctuating increase to a parabolic shape. Consequently, under the premise that the backfill material strength satisfies design requirements, it is advisable to moderately increase the strip spacing width to improve mining efficiency.

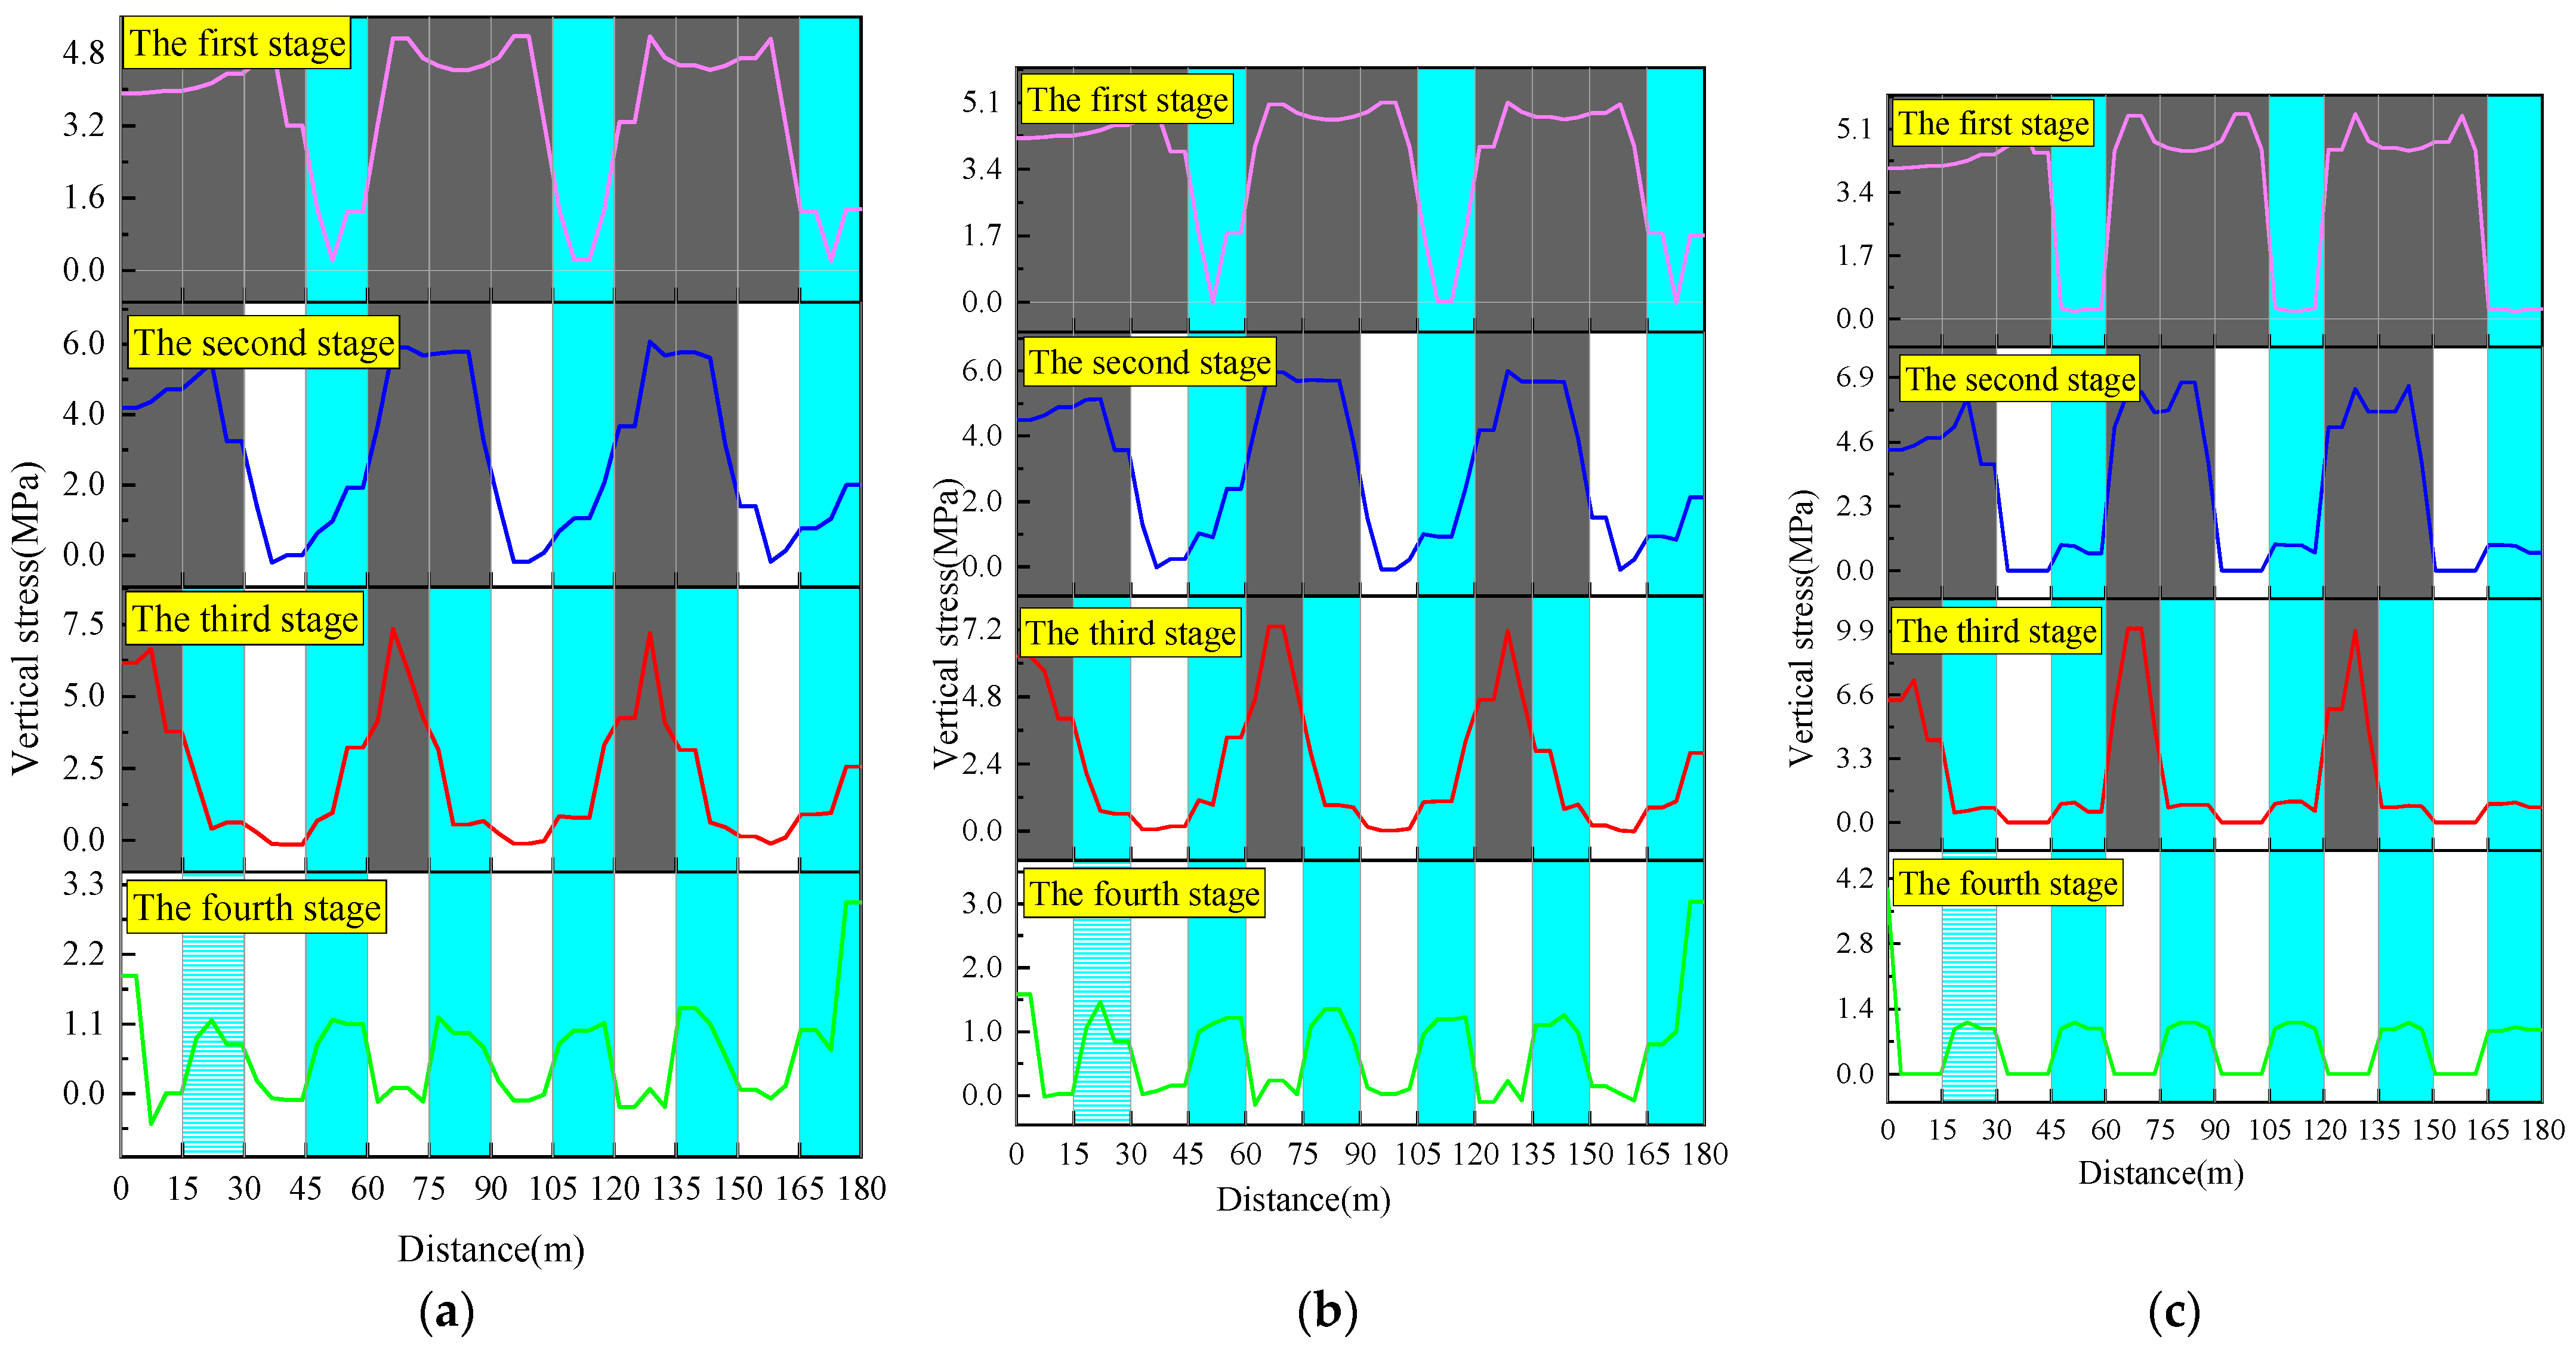
6.3. Stress Evolution Law of Filling Body and Coal Pillar

Coal seam mining and filling can cause a redistribution of stress in the surrounding rock layers of the goaf and filling body. Calibrating the stress distribution patterns of the filling body and coal pillar at different stages is of great significance for the design of the filling body. The values of each factor in the 9th experiment are all at the middle horizontal level, at which a = 15 m and b = 15 m. The vertical stress along the length of the coal pillar and the top, bottom, and waist of the filling body is shown in Figure 12. The dark gray, cyan, and white parts in the figure represent the coal pillar, filling body, and goaf, respectively. In the first stage of mining and the filling strip, the vertical stress is generally small, and the stress of coal pillar on both sides increases. The stress of the filling strip is distributed in a parabola shape (low in the middle and high on both sides). At this time, the overburden load is mainly borne by the coal pillar. In the second stage, the adjacent coal pillar on the left side of the filling body was mined, resulting in the increase in the stress of the nearby coal pillar and the filling body. The tensile stress appears on the direct top of the goaf, and the stress distribution on the top and bottom of the filling body changes from a parabolic shape to a smaller one near the goaf and a larger linear distribution near the coal pillar. The waist stress of the filling body fluctuates, but the stress value is small. In the third stage, the coal pillar on the left side of the goaf is mined and filled, and the stress value of the remaining coal pillar is further increased. The stress between the two interval coal pillars is in a symmetrical parabolic distribution. Due to the existence of the goaf, the disturbance effect of the coal pillar mining and filling in this stage on the existing filling body is less than that of the adjacent coal pillars, but it still causes a certain amount of increase in the stress value of the existing filling body, and the stress distribution form is basically the same as that in the second stage. In the fourth stage of mining the remaining coal pillar, at this time, the overlying strata load is completely borne by the filling body, the filling body stress increases, and the stress distribution form is a saddle-shaped distribution (high in the middle and low on both sides), which is consistent with the conclusion of Du [17] that the stress concentration position of the filling strip appears in the center. In addition, the stress evolution law transmitted from the roof to the filling body during the mining filling coupling process is extremely complex, but the evolution laws of the top, bottom, and waist of the filling body are basically the same. The vertical stress of coal pillar gradually increases with the development of mining. The vertical stress distribution forms of the coal pillars in different positions are different. The vertical stress of the coal pillar near the filling body and goaf has a linear distribution, and it has a horizontal distribution in the distance. The evolution law of the vertical stress distribution form of the filling body is a parabolic distribution (high on both sides and low in the middle), linear distribution, and saddle-shaped distribution (low on both sides and high in the middle).

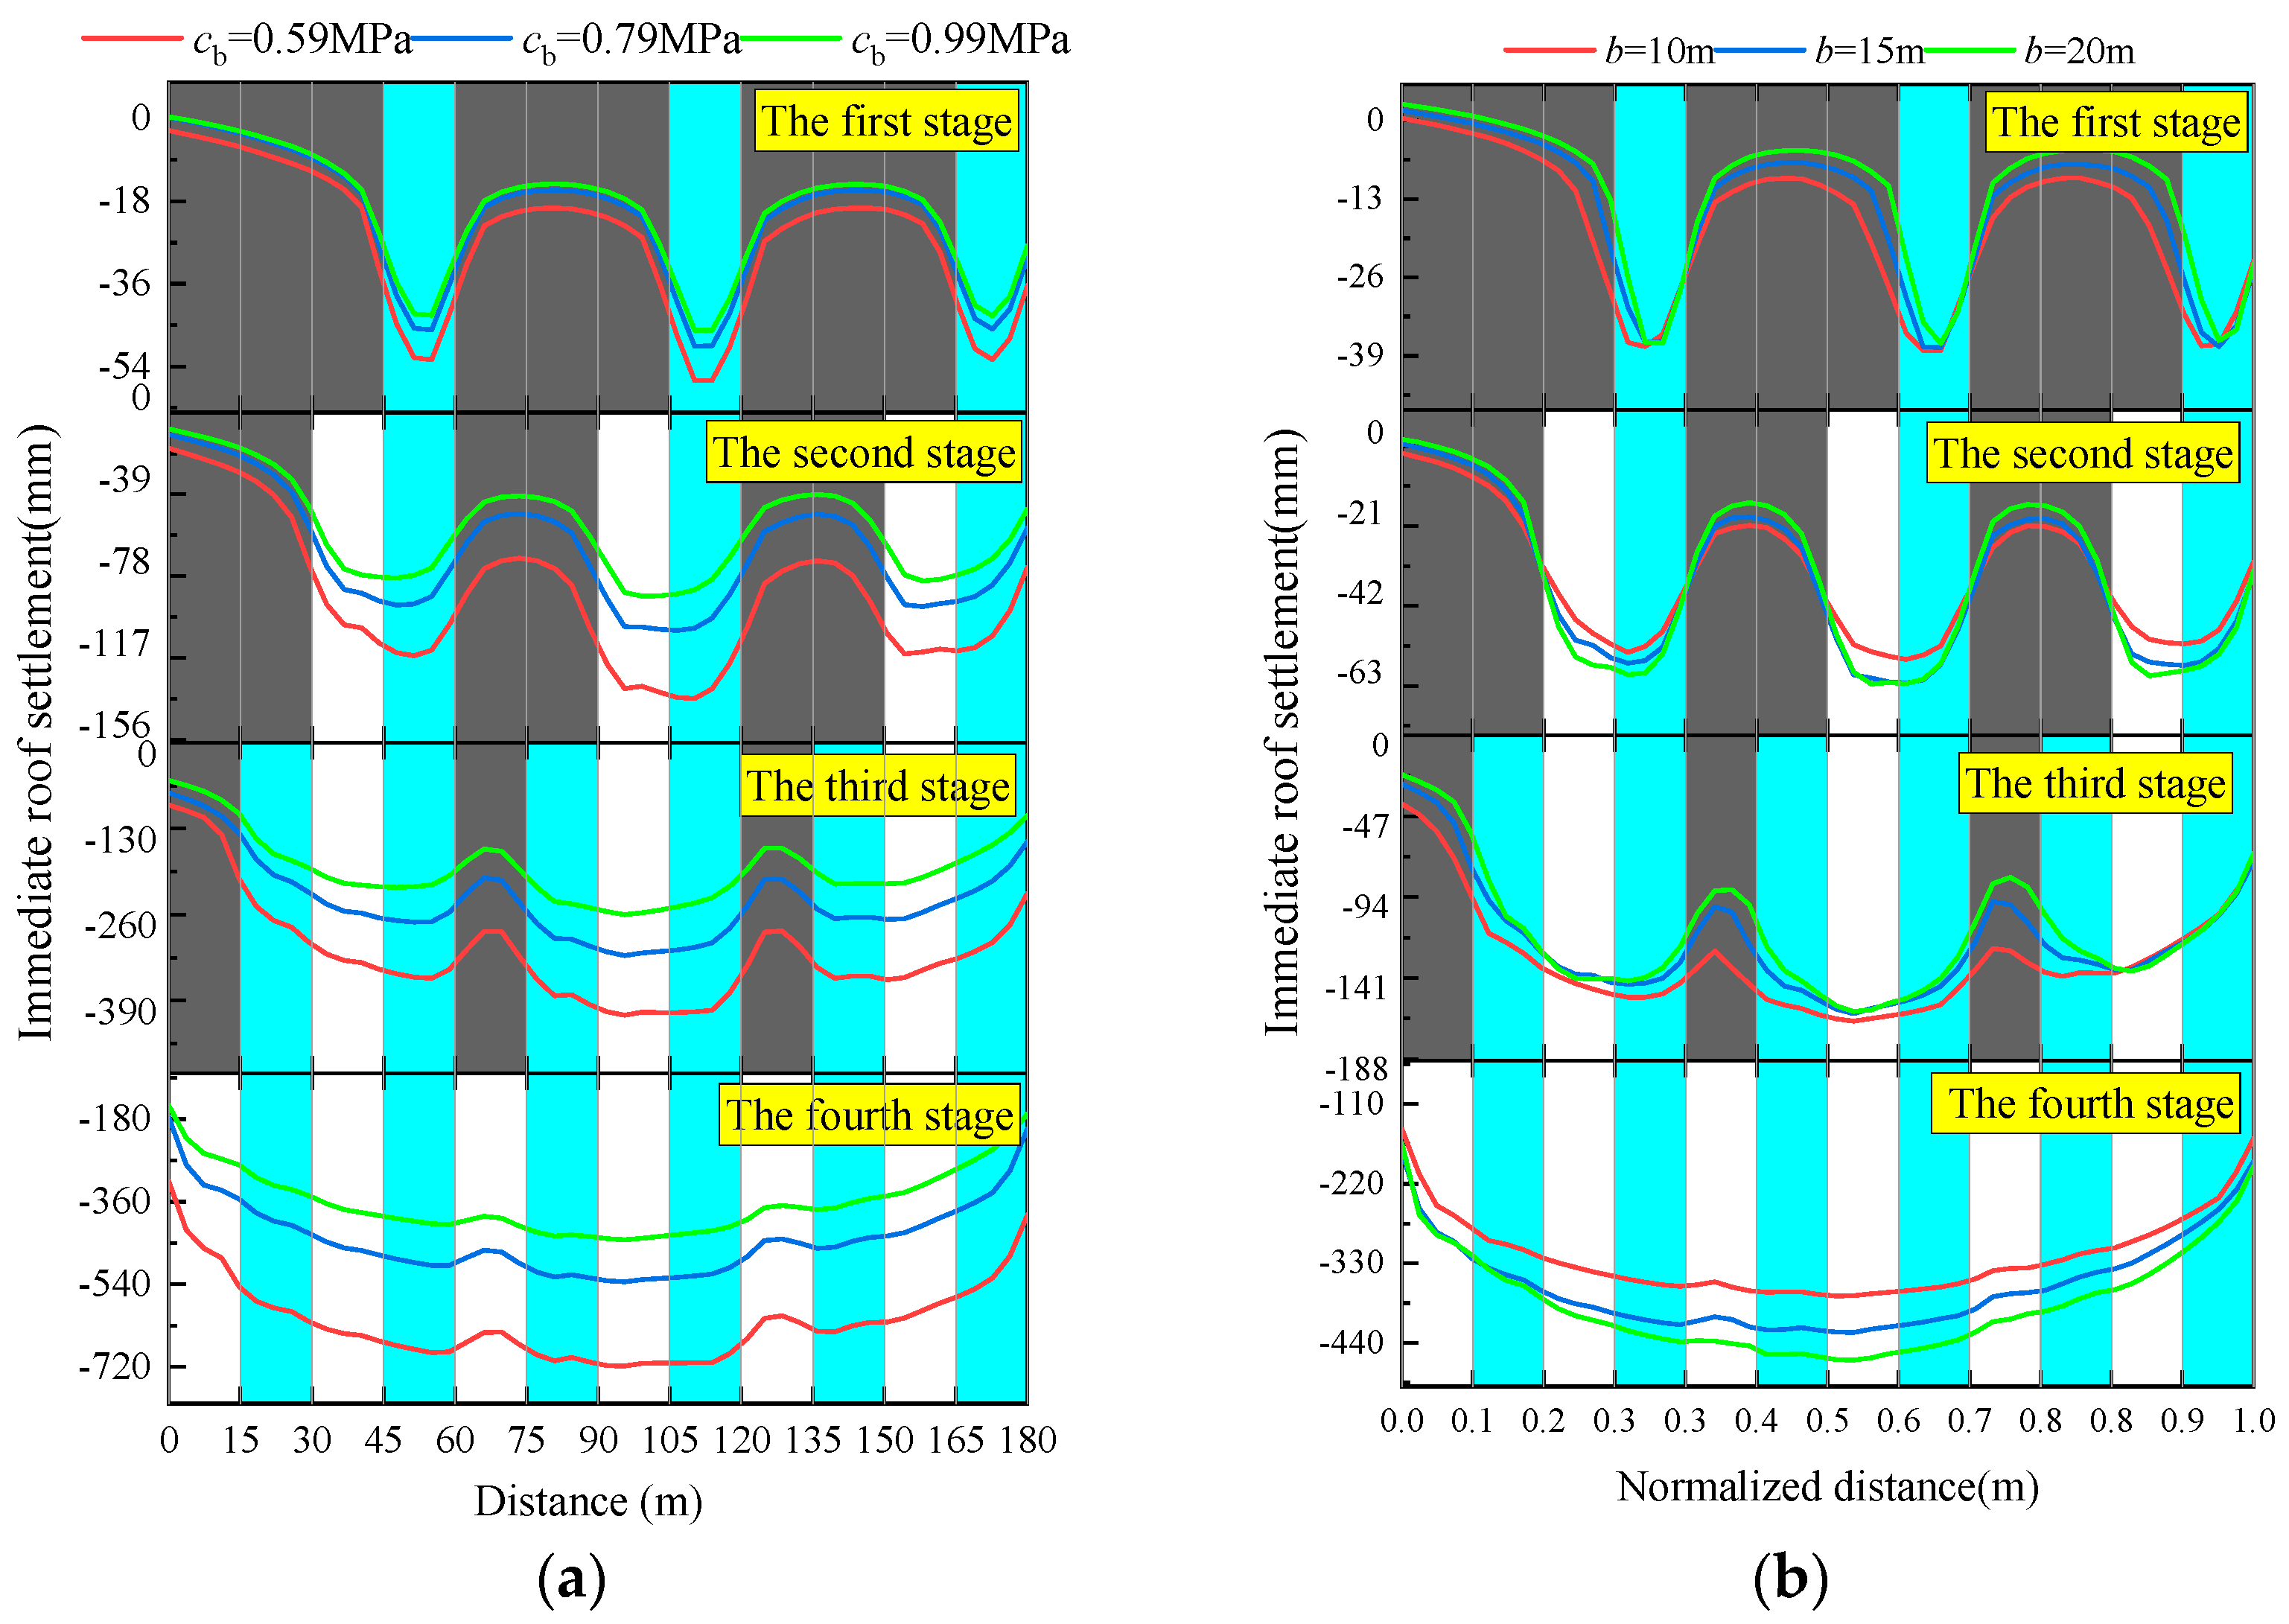
6.4. Evolution Law of Direct Roof Settlement under Different Main Control Factors

Only changing the cohesion of the ninth test or the filling strip spacing value, the direct roof settlement curve of the main control factor at different levels is shown in Figure 13. Because the working face length is different when the strip spacing is different, the working face distance on the horizontal axis in Figure 13b is normalized as follows:
x n = x m 6 a + 6 b
where xn represents the normalized distance, and xm represents the working face distance.
In the first stage, the direct roof is bent and deformed. The deformation starts from the edge of the coal pillar. The direct roof above the filling strip and the direct roof above the coal pillar have different degrees of settlement. The former has a large settlement during coal pillar mining, so the settlement distribution after the end of this stage is similar to that of the traditional mining subsidence basin. In the second stage, the direct roof further subsides, and the direct roof settlement above the filling body is connected to the direct roof settlement above the goaf, and the curve shape is superimposed from several small basins to form a larger and wider subsidence basin. In the third stage, the direct roof subsidence continues to increase, but there is an inflection point above the coal pillar, and the subsidence curve of the direct roof above the interval coal pillar forms a large-scale subsidence basin. Because the subsidence of one side of the direct roof above the coal pillar in the working face is greater than that of the direct roof above the coal pillar on both sides, the subsidence basin formed between the two has a skewed distribution. In the fourth stage, the residual coal pillar is mined, the direct roof subsidence is further increased, and the overall subsidence basin is completely formed.
By comparing the settlement curves of the direct roof with different values of cohesion (Cb) or strip spacing (b), it can be seen that with the progress of mining and filling activities, the settlement curves are gradually separated from the overlap, and the influence of the change in the value of the reflecting factors on the settlement of the direct roof is gradually increasing. This trend is particularly obvious when the cohesion is different, which corresponds to the conclusion that the cohesion has a highly significant impact on the settlement of direct roof obtained in the analysis of variance. Due to the different cohesion of the filling strip, the settlement curve of Figure 13a begins to separate at the immediate roof of the filling strip in the first stage, and a different strip spacing appears after the coal pillar mining in the second stage; therefore, the settlement curve of Figure 13b begins to separate at the immediate roof of the goaf in the second stage. Simultaneously, it can be observed that the degree of curve separation is more prominent when the factors vary within a range unfavorable for settlement control (low cohesion level and high filling strip spacing), and this separation diminishes within a range favorable for settlement control (high cohesion level and low filling strip spacing). This indicates the presence of a marginal effect in the control exerted by both the cohesion (Cb) and the strip spacing (b) on the direct roof settlement. Taking into account the filling cost and mining efficiency, the filling material design parameters and the mining field structural parameters should be rationally selected.

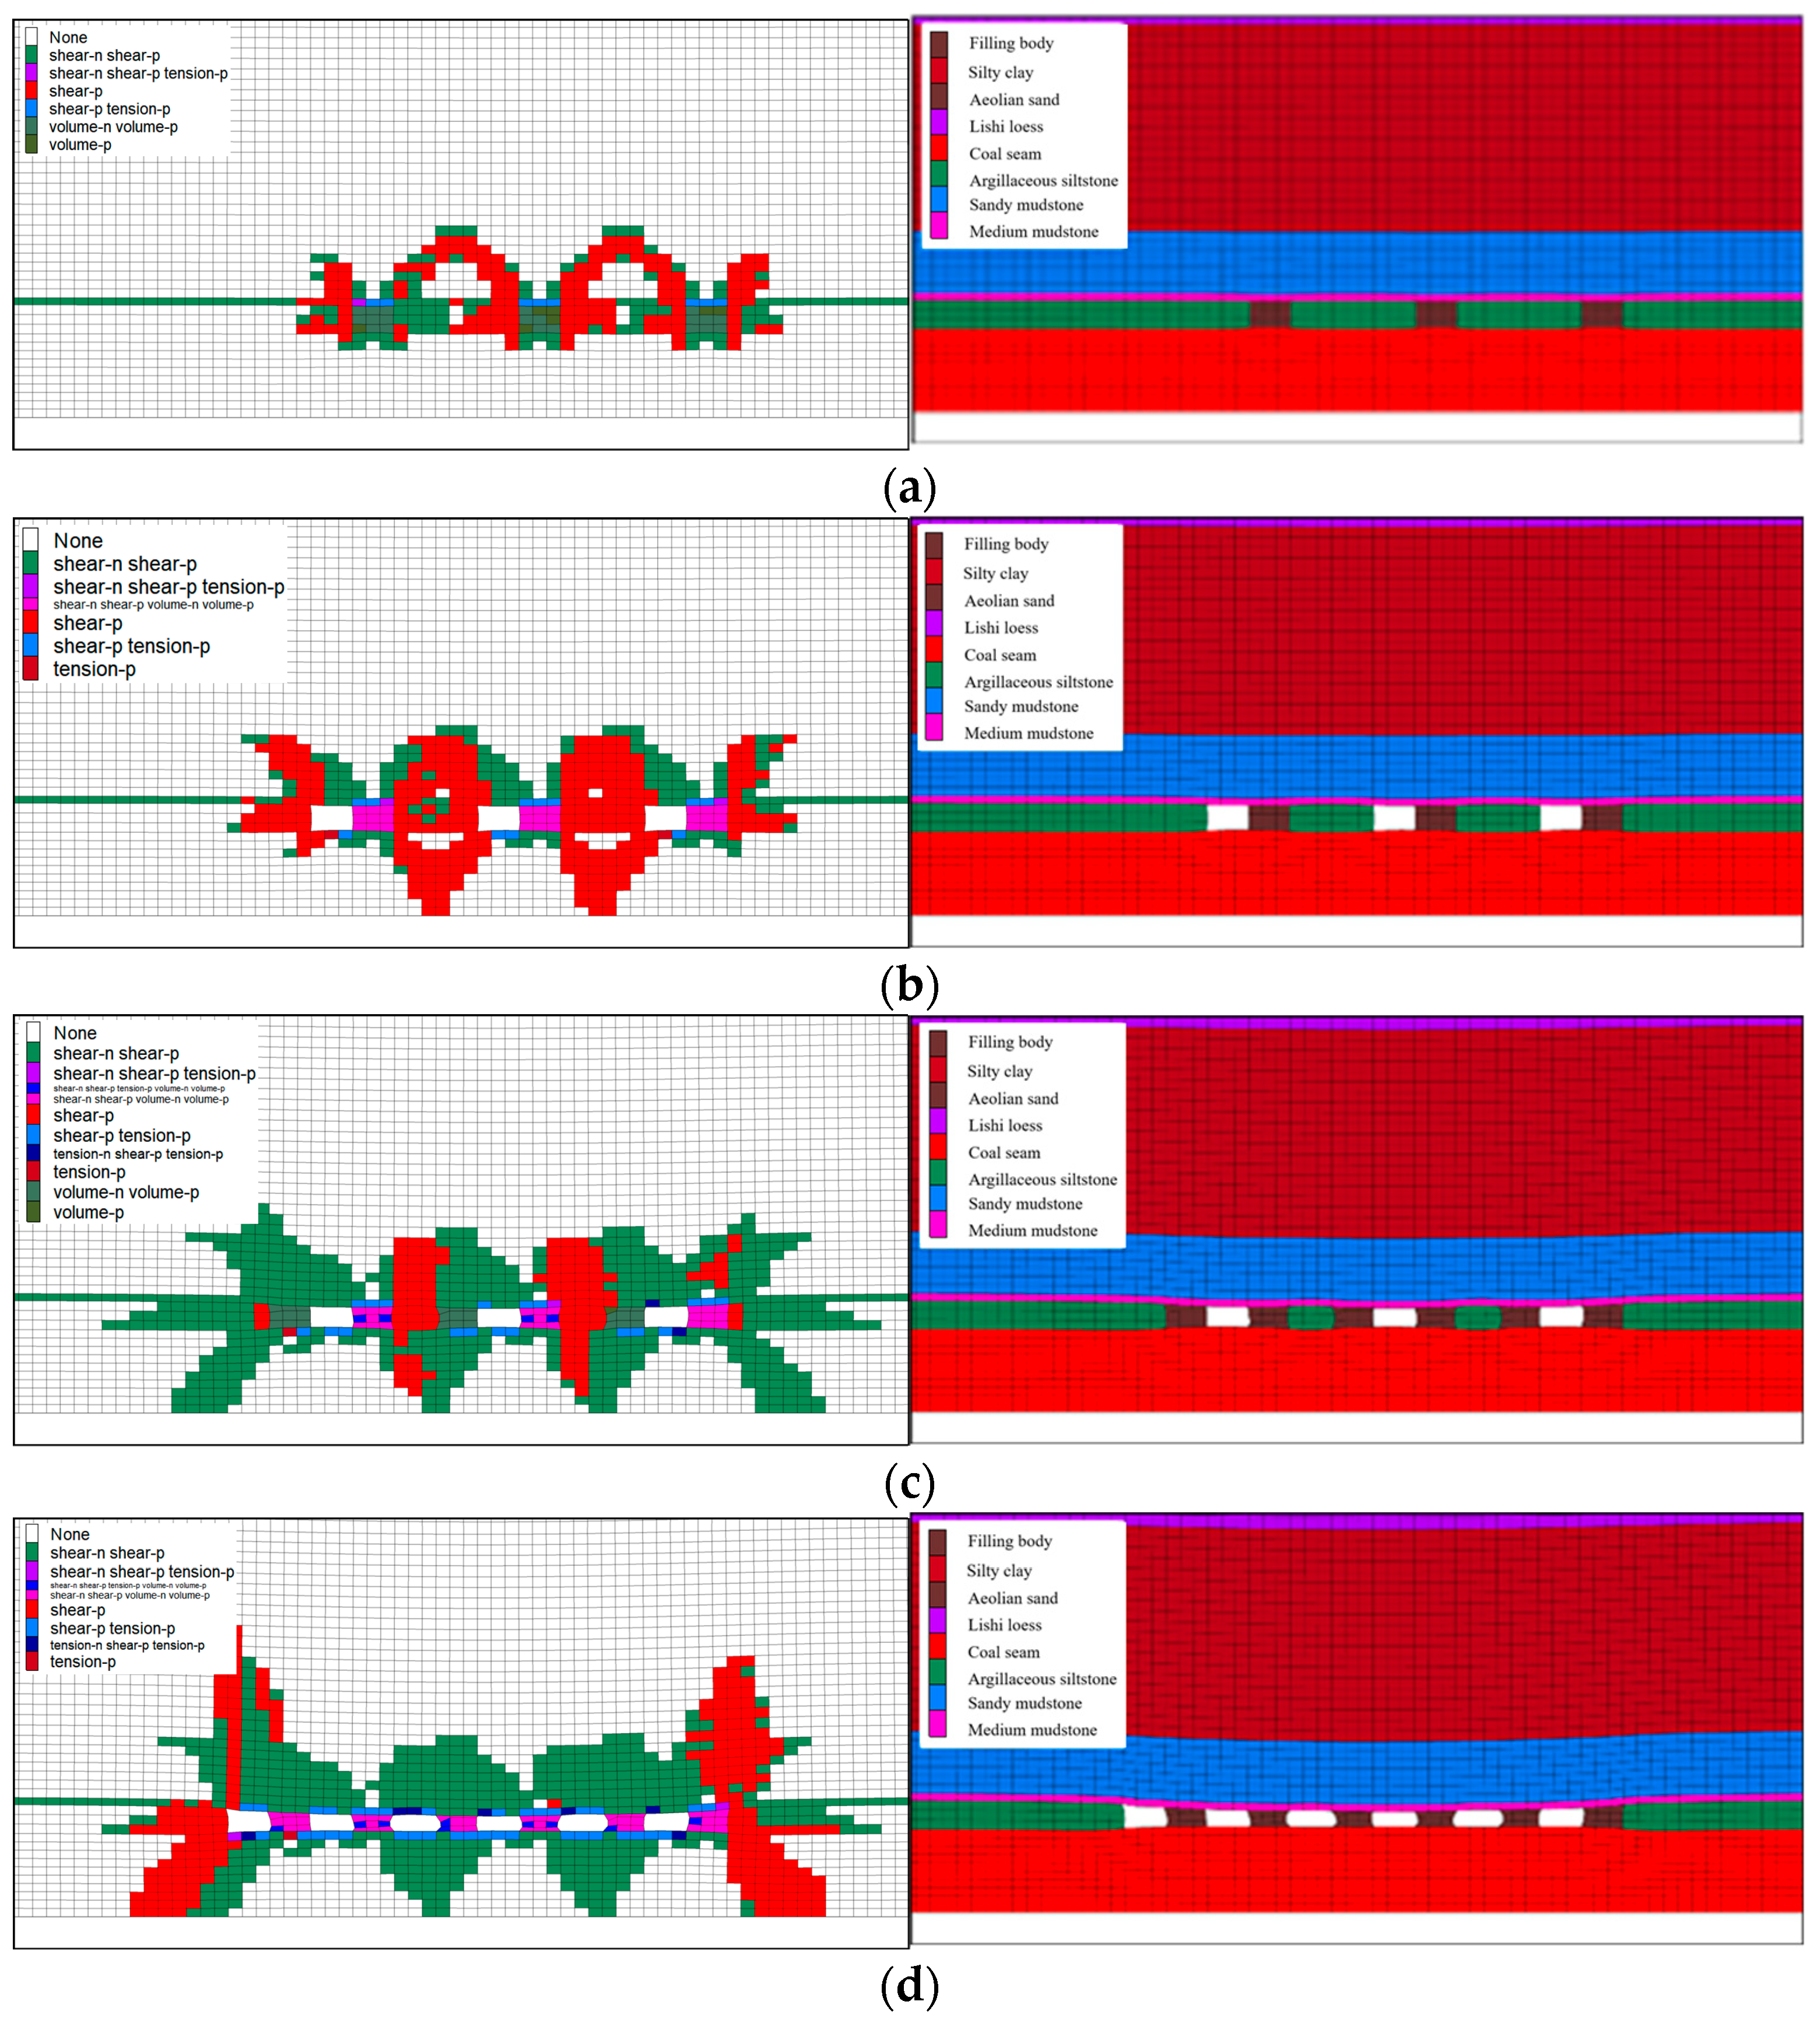
6.5. Failure Evolution Law of Overburden and Backfill in Strip Filling Mining

In order to further analyze the failure characteristics of rock strata and filling bodies in the process of strip filling, Figure 14 shows the evolution law of the plastic zone morphology of the strata near the working face at different mining and filling stages. As the direct roof is sandy mudstone with poor lithology, after the first stage, the direct roof bends and sinks, resulting in a tensile failure zone, and a shear yield zone appears at the top corner of the filling strip and the coal pillars on both sides. The shear yield zone extends through the basic roof, but the basic roof is medium coarse sandstone with high shear strength, so there is no large-scale failure. According to the distribution of the plastic zone of the filling strip at this stage, the upper boundary of the filling body can be designed as a trapezoidal boundary high in the middle and low on both sides. The range of plastic zone in the second stage is significantly larger than that in the first stage. A large area of a shear failure zone appears in the direct top and basic top above the goaf, and two obvious shear zones appear in the direct bottom corner of the goaf. The bottom heave and tensile failure occur in the middle of the direct bottom under the extrusion effect. After the completion of the third stage of mining and filling, the existing filling strip is severely deformed, its horizontal displacement direction points to the inside, and its contour is distorted from a rectangle to a left-right asymmetric dumbbell shape. The basic top shear failure zone extends to the upper silty clay layer, and the coal pillar on both sides and the direct bottom plastic zone also expand to varying degrees. After the end of the fourth stage of mining, the distortion of the filling body is more serious, and the bending deformation on both sides of the waist induces greater tensile stress, resulting in tensile failure in this area. In general, most of the strata and filling body are mainly shear failure, and only a few tensile failure areas appear in the direct top and the waist of the filling body. In addition, after the mining is completed, the filling body and rock layer undergo creep deformation under the action of an overburden load, causing structural instability. Therefore, a further long-term stability analysis of strip filling mining tunnels is of great significance.

7. Conclusions

The surface and direct roof settlement values are negatively correlated with cohesion, friction angle, and Poisson’s ratio, and positively correlated with the spacing of filling strips. Therefore, strip filling mining should ensure that the strength of the filling body meets the design requirements and appropriately reduce the spacing of filling strips.
The results of a variance analysis and significance test show that the cohesion of the backfill has a highly significant impact on the direct roof settlement, the strip spacing and friction angle have a significant impact on it, and the cohesion of the backfill and the strip spacing have a certain impact on the surface settlement.
With the increase in strip spacing, the direct top and surface settlement values showed a fluctuating upward trend. With the increase in cohesion, the settlement values of the direct roof and ground surface decreased significantly, and with the change in strip spacing, the trend changed from a fluctuation to a parabola. Additional explanation was provided on the specific settlement value and range of the direct roof: the direct roof settlement range caused by changes in the filling body is between 400 mm and 720 mm, and the direct roof settlement range caused by strip spacing is between 360 mm and 475 mm.
The stress evolution law of the roof transferred to the filling body in the process of mining filling coupling is extremely complex. After mining, the stress distribution of the filling body presents a saddle shape distribution (large in the middle and small on both sides). The direct roof subsidence is a subsidence basin formed between coal pillars, and as extraction progresses, these subsidence basins gradually interconnect, culminating in a comprehensive subsidence basin. The majority of the strata and the filling body primarily exhibit shear damage, with a small amount of tensile failure zones appearing only in the direct roof and mid-section of the filling body.

Author Contributions

Conceptualization, Z.Z.; writing—original draft preparation, Z.M.; writing—review and editing, Z.Z.; visualization, Z.M.; supervision, Z.Z., L.L., H.L., J.D. and T.L.; project administration, Z.Z.; funding acquisition, Z.Z. All authors have read and agreed to the published version of the manuscript.

Funding

This research was funded by the Shandong Provincial Natural Science Foundation [No. ZR2023ME086].

Institutional Review Board Statement

Not applicable.

Informed Consent Statement

Not applicable.

Data Availability Statement

Data are contained within the article.

Acknowledgments

This research is supported by the Shandong Provincial Natural Science Foundation, which is gratefully acknowledged.

Conflicts of Interest

The authors declare no conflicts of interest.

References

  1. Zhang, J.; Zhang, Q. Research progress and prospect of coal based solid waste backfilling mining technology. J. China Coal Soc. 2022, 47, 4167–4181. [Google Scholar]
  2. Hu, B.; Liu, P. Review and development status of backfill coal mining technology in China. Coal Sci. Technol. 2020, 48, 39–47. [Google Scholar]
  3. Yang, K.; Wei, X. Theory and technology of green filling of solid waste in undergroundmine at coal power base of Yellow River Basin. J. China Coal Soc. 2021, 46, 925–935. [Google Scholar]
  4. Xu, J.; Zhu, W. Study of the Technology of Partial-Filling to Control Coal Mining Subsidence. J. Min. Saf. Eng. 2006, 23, 6–11. [Google Scholar]
  5. Xie, W.; Shi, Z. Analysis of Surrounding Rock Activities in Partial Backfill Mining. J. China Univ. Min. Technol. 2004, 33, 38–41. [Google Scholar]
  6. Feng, G.; Du, X. Basic theory of constructional backfill mining and the underground space utilization concept. J. China Coal Soc. 2019, 44, 74–84. [Google Scholar]
  7. Ge, Y.; Tang, H. Effect of Sliding Plane Mechanical Parameters on Landslide Stability—A Case Study of Jiweishan Rockslide in Wulong hongqing. Chin. J. Rock Mech. Eng. 2014, 33, 3873–3884. [Google Scholar]
  8. Nan, Q. Research on Optimum Mix Proportion and Modification Mechanism of Backfill Materials Based on Orthogonal Tests. Saf. Coal Mines 2020, 51, 52–56. [Google Scholar]
  9. Wu, L.; Wang, Y. Ratio Optimization of Red Mud-Fly Ash Paste Filling Material Based on Orthogonal Experiment. Ming Res. Dev. 2020, 40, 45–49. [Google Scholar]
  10. Liu, S.; Liu, G. Study on Fluidity of Paste Slurry and Strength of Backfill Based on Orthogonal Design. Ming Res. Dev. 2020, 40, 33–37. [Google Scholar]
  11. Zhao, F.; Hu, J. Optimization research of base-phosphogypsum cemented backfill ratio based on orthogonal test. Chin. J. Nonferrous Met. 2021, 31, 1096–1105. [Google Scholar]
  12. Wu, F.; Gao, Q. Spatio-temporal coordinated mining pattern andstrata control mechanism of multiple coal seams. Chin. J. Nonferrous Met. 2021, 31, 2269–2278. [Google Scholar]
  13. Du, X.; Feng, G. Roof stability analyses of ‘water-preserved and water-stored’ coal mining with constructional backfill mining. J. China Coal Soc. 2019, 44, 821–830. [Google Scholar]
  14. Chi, X.; Wang, P. Optimization on Stope Structural Parameters of Strip-filling Method for Gently Inclined Phosphate Ore. Ming Res. Dev. 2016, 36, 17–20. [Google Scholar]
  15. Wang, X.; Guo, P. Stability calculation of backfill roof in downward roadway under multifactor influence. Rock Soil Mech. 2022, 43, 3453–3462. [Google Scholar]
  16. Dong, L.; Gao, Q. Optimization Design of Excavating-filling Engineering Parameters in South of Sijiaying Mine. Metal Mine 2011, 16, 20–24. [Google Scholar]
  17. Guo, C.; Yu, S. Orthogonal Experimental on Influencing Factors of Surface Subsidence in Filling Mining. Beijing Surv. Mapp. 2021, 35, 543–547. [Google Scholar]
  18. Babets, D.; Sdvyzhkova, O. Multifactorial analysis of a gateroad stability at goaf interface during longwall coal mining—A case study. Min. Miner. Depos. 2023, 17, 9–19. [Google Scholar] [CrossRef]
  19. Xu, J.; You, Q. Theorectical study of strip-filling to control mining subsidence. J. China Coal Soc. 2007, 32, 119–122. [Google Scholar]
  20. Chang, Q.; Yao, X. Strata Movement of the Thick Loose Layer under Strip-Filling Mining Method: A Case Study. Appl. Sci. 2021, 11, 11717. [Google Scholar] [CrossRef]
  21. Zhao, Z.; Wang, W. The Orthogonal Test Analysis of the Minimum Buried Depth of a Shallow Shield Tunnel. Mod. Tunn. Technol. 2014, 51, 144–151. [Google Scholar]
  22. Itasca Consulting Group, Inc. Fast Language Analysis of Continua in 2 Dimensions, Version 5.0, User’s Manual; Itasca Consulting Group, Inc.: Minneapolis, MN, USA, 2005. [Google Scholar]
  23. Qian, Z. Simulation Study on Strata Movement Regularity of Strip Pillar Mining with Solid Waste Compacted Filling; China University of Mining and Technology: Xuzhou, China, 2014. [Google Scholar]
  24. Qiang, H.; Zhou, H. Numerical Simulation of Paste Filling Based on Double-Yield Model. Ming Res. Dev. 2007, 27, 6–7. [Google Scholar]
  25. Hu, B.; Yan, B. Main Control Factors and Influence Rule of Mining Subsidence by Backfill Mining. Coal Min. Technol. 2016, 21, 57–59. [Google Scholar]
  26. Xie, W.; Yin, S. The key problem study about gob-side entry retaining in top-coal caving mining face. J. China Coal Soc. 2004, 16, 146–149. [Google Scholar]
  27. Yuan, D.; An, J. Probability and Statistics; Higher Education Press: Beijing, China, 2016. [Google Scholar]
  28. Xue, W. Data Analysis Based on SPSS; China Renmin University Press: Beijing, China, 2014. [Google Scholar]
Figure 1. Two modes of mining with strip-filling: (a) long-wall strip filling; (b) short-wall strip filling.
Applsci 14 00996 g001
Figure 2. Numerical calculation model.
Applsci 14 00996 g002
Figure 3. Mining and filling schematic diagram.
Applsci 14 00996 g003
Figure 4. Strain softening model stress–strain relationship [22].
Applsci 14 00996 g004
Figure 5. Relations between plastic strain, friction angle, and cohesion of coal.
Applsci 14 00996 g005
Figure 6. Comparison of surface and immediate roof settlement range under different factor levels.
Applsci 14 00996 g006
Figure 7. Analysis model of micro element.
Applsci 14 00996 g007
Figure 8. Stress decomposition diagram for analysis model: (a) normal stress acting alone; (b) shear stress acting alone.
Applsci 14 00996 g008
Figure 9. The normal stress distribution of analysis model.
Applsci 14 00996 g009
Figure 10. The transverse strain relationship near contact interface under normal stress: (a) σy acts alone; (b) σx acts alone.
Applsci 14 00996 g010
Figure 11. The influence of cohesion and strip spacing on the index: (a) the influence of cohesion and strip spacing on the maximum immediate roof settlement; (b) the influence of cohesion and strip spacing on the maximum surface settlement.
Applsci 14 00996 g011
Figure 12. Vertical stress of filling body and coal pillar: (a) immediate roof; (b) direct bottom; (c) direct waist.
Applsci 14 00996 g012
Figure 13. Direct roof settlement with different cohesion and filling strip spacing: (a) direct roof settlement with different cohesion; (b) direct roof settlement with different filling strip spacing.
Applsci 14 00996 g013
Figure 14. Evolution law of plastic zone: (a) the first stage; (b) the second stage; (c) the third stage; (d) the fourth stage.
Applsci 14 00996 g014
Table 1. Formation mechanical parameters.
Rock FormationThickness
/m
Density
/kg/m3
Bulk
Modulus
/MPa
Shear
Modulus
/MPa
Tensile
Strength
/MPa
Friction
Angle
Cohesion
/MPa
Aeolian sand5.51650133790.0080.00
Lishi loess88.219502331850.20100.01
Silty clay7522406094691.20250.02
Medium mudstone22.42250143610622.50402.81
Sandy mudstone2.62430104710280.85411.93
Coal seam10.41420340300.50363.40
Argillaceous siltstone3027607804023.90393.14
Table 2. Factors and levels.
FactorEb/MPaμbCb/MPaφba/mb/m
Level 14990.10.59201010
Level 25990.240.79241515
Level 36990.340.99282020
Table 3. Orthogonal experimental design table.
Order NumberEb/MPaμbCb/MPaφba/mb/mIndex
vg/mmvr/mm
14990.10.5920101071.59146.72
24990.10.792420209.6276.89
34990.240.5928201524.70101.39
44990.240.9920152013.7372.96
54990.340.7928151023.5488.85
64990.340.9924101514.3569.91
75990.10.5928152028.03113.77
85990.10.9920201538.08107.50
95990.240.7924151537.90111.78
105990.240.9928101024.2474.27
115990.340.5924201033.91122.68
125990.340.992010204.9652.78
136990.10.7928101528.38106.17
146990.10.9924151019.8088.51
156990.240.5924102026.09113.72
166990.240.7920201029.07115.22
176990.340.5920151539.88144.40
186990.340.992820205.1050.27
Table 4. Analysis of variance with the maximum surface subsidence as the index.
Source of VarianceSquaresFreedomMean SquareF RatioP RatioSignificance
Cb0.00123520.0006174.6100830.07331*
b0.00104520.0005233.9035840.095234*
φb0.00047920.000241.7886180.259452
μb0.00036120.0001811.3494370.339905
a0.0001125.48 × 10−50.4094550.684417
Eb5.64 × 10−522.82 × 10−50.2105210.816993
Summation0.00150.000
Error0.01718
Note: ‘*’ denotes a p-value < 0.1, suggesting a moderate influence of the factor on the metric; and the absence of any symbol implies that the factor has a negligible effect on the metric.
Table 5. Analysis of variance with the maximum direct roof settlement as the index.
Source of VarianceSquaresFreedomMean SquareF RatioP RatioSignificance
Cb0.00720.00436.8600.001***
b0.00220.0019.7900.019**
φb0.00120.0016.6510.039**
μb0.00120.0003.1550.130
a0.00020.0001.7540.265
Eb0.00029.559 × 10−50.9580.444
Summation0.00059.980 × 10−5
Error0.18518
Note: ‘***’ indicates a p-value < 0.01, signifying a highly significant impact of the factor on the metric; ‘**’ represents a p-value < 0.05, indicating a significant impact of the factor on the metric.
Disclaimer/Publisher’s Note: The statements, opinions and data contained in all publications are solely those of the individual author(s) and contributor(s) and not of MDPI and/or the editor(s). MDPI and/or the editor(s) disclaim responsibility for any injury to people or property resulting from any ideas, methods, instructions or products referred to in the content.

