Abstract
High-resolution remote sensing images (HRRSI) have important theoretical and practical value in urban planning. However, current segmentation methods often struggle with issues like blurred edges and loss of detailed information due to the intricate backgrounds and rich semantics in high-resolution remote sensing images. To tackle these challenges, this paper proposes an end-to-end attention-based Convolutional Neural Network (CNN) called Double Hybrid Attention U-Net (DHAU-Net). We designed a new Double Hybrid Attention structure consisting of dual-parallel hybrid attention modules to replace the skip connections in U-Net, which can eliminate redundant information interference and enhances the collection and utilization of important shallow features. Comprehensive experiments on the Massachusetts remote sensing building dataset and the Inria aerial image labeling dataset demonstrate that our proposed method achieves effective pixel-level building segmentation in urban remote sensing images by eliminating redundant information interference and making full use of shallow features, and improves the segmentation performance without significant time costs (approximately 15%). The evaluation metrics reveal significant results, with an accuracy rate of 0.9808, precision reaching 0.9300, an F1 score of 0.9112, a mean intersection over union (mIoU) of 0.9088, and a recall rate of 0.8932.
1. Introduction
High-resolution remote sensing images encapsulate crucial information, and the segmentation of buildings proves valuable in diverse applications, including urban growth forecasting [1], disaster management [2], traffic management [3], and map updating [4]. Traditional segmentation methods, including edge-based [5], threshold processing [6], and graph theory [7] approaches, often require manual intervention and suffer from limitations in parameter selection and feature extraction. The traditional feature extraction methods result in increased within-group variance and decreased between-group variance in the input image, leading to suboptimal classification results.
In recent years, deep learning, especially Convolutional Neural Networks (CNNs), has become increasingly prominent in the analysis of remote sensing images. AlexNet [8] introduced a revolutionary approach to deep learning in image applications, and subsequent advancements led to the development of various studies in remote sensing images, such as object detection [9,10,11,12,13], semantic segmentation [14,15,16,17], road extraction [18], and environmental protection [19]. Fully Convolutional Networks (FCNs) [20] addressed the limitations of traditional CNNs by preserving spatial information and performing pixel-level inference. However, FCNs do not capture pixel relationships during upsampling, resulting in information loss and suboptimal performance at object boundaries. To overcome these limitations, researchers have developed improved variants based on FCN, including U-Net [21], HRNet [22], SegNet [23], etc. These networks tackle the challenge of uncorrelated feature information across layers and locations, as well as the inability to directly integrate feature maps at different locations. U-Net, proposed by Ronneberger et al. [21] has played a pivotal role in image segmentation. By combining information from downsampled shallow convolutional layers and employing skip connections, U-Net effectively retains crucial shallow information during the upsampling process, preserving both semantic and spatial details. Inspired by the symmetric structure of U-Net, Badrinarayanan et al. [23] introduced SegNet, adopting an encoder–decoder architecture. The encoder progressively decreases the size of the input feature map through pooling layers, while the decoder, symmetric to the encoder, recovers image details and feature map size using deconvolution operations. The exceptional performance of U-Net in image segmentation has stimulated extensive research, leading to the development of several outstanding networks. For example, MFU-Net [24] incorporates a novel multi-scale feature extraction module that captures shallow information from different scales, reducing the semantic gap in building segmentation by replacing U-Net’s skip connections. Dong et al. [25] introduced a DenseU-Net, a model that integrates a focal loss function (MFB_Focalloss) weighted by median frequency balance to improve the overall accuracy of small object class segmentation. However, these methods face challenges in effectively integrating global pixel information, leading to information loss, and they do not adequately utilize contextual information between different categories, resulting in confusion in the segmentation results and reduced between-group differences.
For high-resolution remote sensing images, segmenting large targets poses significant challenges due to the complexity of scenes, as well as the influence of illumination and imaging angles. These challenges arise from two main factors: (1) Large within-group differences: Targets within the same category exhibit substantial variations in characteristics across different times and locations. For instance, in urban areas, different types of buildings such as neighborhood housing, shopping malls, and self-built houses possess distinct spectral characteristics due to the subjective influence of designers. Similarly, farming land on plains and in mountainous regions display different spectral properties, despite both falling under the farming land category. (2) Limited between-group distinction: Different categories often lack distinct features, leading to potential confusion during segmentation. For example, roads in urban areas can be easily mistaken for building shadows, while gardens surrounding houses may be erroneously classified as buildings. These factors contribute to the difficulty of accurately determining the category information of object boundary pixels, resulting in blurred boundaries and inaccurate target segmentation. The simple superposition convolution method faces challenges in obtaining precise category information for object boundaries and fail to achieve accurate target segmentation.
To solve the above problems, researchers have turned to the attention mechanism and developed numerous innovative image segmentation models, building upon the strong segmentation performance of U-Net. Attention U-Net [26] proposed the attention gate (AG) model, which automatically learns to concentrate on target structures of varied shapes and sizes. It suppresses irrelevant regions in the input image while accentuating features crucial for a specific task. The multiscale attention module in MACU-Net [27] can unify the semantic features contained in low-level and high-level feature maps at different scales. MANet [28] extracts contextual dependencies through multiple effective attention modules. UNet-scAG [29] proposes a spatial channel attention gate (scAG) that addresses the common limitation of insufficient contextual information extracted by skip connections. MAResU-Net [30] improved skip connections for U-Net based on the linear attention mechanism (LAM) and residual network. Yu et al. [31] introduced an innovative attention gate module (AG) that modifies the position of the “Resampler” in the attention gate to a Sigmoid function. This adjustment aims to bridge the gap between high-level and low-level features. They further presented AGs-Unet, a novel attention-based UNet architecture. Xu et al. [32] proposed the holistic nested attentional U-Net (HA U-Net). It incorporates attention mechanisms and multi-scale nested modules for supervised prediction, enhancing the extraction of edge details in high-resolution remote sensing image segmentation tasks.
However, the existing attention models proposed for the remote sensing image building segmentation task still still encounter challenges in preserving fine-grained details and maintaining sharp boundaries in the segmentation results. Particularly, when confronted with more complex scenes that involve additional elements such as cars, parking spaces, hay fields, sand, tree shadows, and other interferences, the extraction of accurate building information becomes insufficient, leading to numerous incorrect segmentations. Therefore, in this paper, we introduce a novel attention module named Dual Hybrid Attention (DHA) and propose the corresponding architecture, DHAU-Net, which is specifically tailored for building segmentation in High-Resolution Remote Sensing Images (HRRSI). The primary contributions of this study are outlined as follows.
- (1)
- Taking advantage of the attention mechanism in both the channel and spatial domains, this paper designs a novel feature extraction module named DHA. DHA combines the channel and spatial attention, processing feature maps separately through distinct attention mechanisms. This effectively harnesses the strengths of each attention mechanism, boosting the information screening capability. The result is a more precise and comprehensive feature extraction.
- (2)
- We introduced DHAU-Net by enhancing the skip connection approach in U-Net to tackle the disparities between lower-level and higher-level feature maps. In U-Net, lower-level feature maps contain more detailed spatial location information but weaker semantic details, while higher-level feature maps have stronger semantic information but less precise spatial location details. To bridge this gap, we replace the original simple skip connection with the DHA module. By applying the DHA module to process shallow feature maps and fuse them with deeper feature maps, the network focuses more on foreground building information while disregarding the background interference. This refinement narrows the within-group gap between buildings, leading to improved segmentation accuracy.
The rest of this paper is organized as follows. Section 2 begins with an overview of the DHA module, outlining its structure and key features. Subsequently, the proposed attention module is incorporated into U-Net, and a attention-based neural network is constructed for building segmentation in remote sensing images. Section 3 outlines the experimental setup, including details about the datasets used (Massachusetts Buildings Dataset [33] and Inria aerial image labeling dataset [34]), the experimental environment, and the evaluation metrics employed. In Section 4, we present the results of applying DHAU-Net to the segmentation of urban buildings. Finally, in Section 5, we draw conclusions based on extensive experiments.
2. Methodology
2.1. DHA Module
In order to effectively segment urban buildings in remote sensing images and accurately mask the background information, such as roads, grass, trees, and cars, this paper adopts the attention mechanism as the key approach. The attention mechanism not only helps determine where the model should focus its attention but also enhances the representativeness of relevant information, emphasizing target features while suppressing irrelevant ones. To address the problems of confusing segmentation results, the insufficient extraction of building information and numerous false segmentations, we propose a novel model called Dual Hybrid Attention (DHA) in this paper that is specifically designed for the complex and variable nature of remote sensing images.
The DHA model comprises two parallel hybrid attention modules, each consisting of the channel attention and spatial attention in series. The channel attention uses a global set and a multi-layer perceptron to select a representative value for each channel. The spatial attention uses a channel-based global set whose results are then processed by a multilayer perceptron to provide spatial matrix transformations for all layers. The DHA model’s structure is depicted in Figure 1.
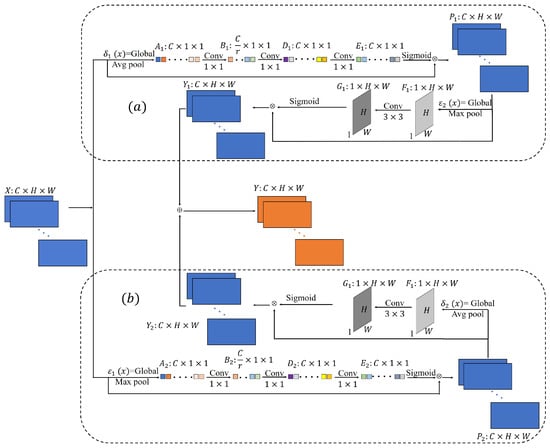
Figure 1.
DHA model structure. (a) HAM-1; (b) HAM-2.
Figure 1a shows a hybrid attention structure in the DHA module, called HAM-1. The channel attention mechanism reshapes the input X into a feature map of size by globally averaging pooling across all channels to consolidate the spatial information of the input, where X represents a input layer and represents a layer. Subsequent layers like follow a similar pattern. The globally averaged pooled feature map is compressed by a multilayer perceptron with a compression rate of r. Then, the channel attention feature value is determined by the multilayer perceptron and the Sigmoid activation function. Each value in represents the weight of the channel used for feature extraction, which is multiplied by the input feature map X to obtain the spatial attention input feature map , and the mathematical expression of is shown in Equation (1). The spatial attention mechanism selects the maximum value of all channel feature maps located at pixel position by global maximum pooling, forming a single feature map of size . After performing the convolution processing (filter size , step size 1) and Sigmoid activation function processing on , a weight map with one channel is obtained. is multiplied by the input feature map of the spatial attention graph to obtain the feature map output, whose mathematical expression is shown in Equation (2).
Figure 1b shows another hybrid attention structure in the DHA module, called HAM-2, which has the same structure to HAM-1, but differs in how it processes the input data. For the channel attention in HAM-2, instead of using global average pooling as in HAM-1, it utilizes global maximum pooling. This means that the maximum value for each channel is extracted to represent the channel-wise information. For spatial attention in HAM-2, it employs global average pooling, whereas HAM-1 uses global maximum pooling. The expressions of the output and of the channel, and spatial attention in the HAM-2, are shown in Equations (3) and (4).
Finally, the outputs and of the HAM-1 and the HAM-2 are superimposed to obtain the output Y of the DHA module. The expressions are presented in Equation (5).
where , , and denote convolutional kernels of size and denotes convolutional kernels of size . , denote the two feature extraction method, global average pooling and global maximum pooling, relying on a single feature map, respectively, to form a spatial squeezing map on each channel. , denote the global average pooling and global maximum pooling interspersed in each feature map located at the pixel position , respectively. The expressions , , , are shown in Equations (6)–(9).
where the specific meaning is as follows, given the set of input feature channels , , where , denotes any of the channel feature maps. The variables H, W and C are the spatial height, spatial width, and the number of input channels, respectively.
The design of the DHA module takes into consideration the following two points: (1) The error induced in the feature extraction process mainly comes from two aspects, the increase in the variance of the estimate caused by the limited size of the relevant neighborhood, and the deviation of the estimated mean caused by the error of the convolution layer parameters. The average pooling method can reduce the within-group variance and retain more image foreground information, while the maximum pooling method can increase the between-group variance and retain more texture information. From the overall view of the DHA module, the two parallel models have the same structure, but their respective channel attention and spatial attention pooling methods are different, which aim to extract and collect more channel and spatial detail information from different pooling perspectives to improve the accuracy of building segmentation. (2) The DHA model focuses on highlighting channels that contain crucial target information in the feature map, as well as important spatial locations. This is accomplished by linking the channel attention and spatial attention in a series. The input channel importance is first assessed, followed by spatial matrix operations on the feature map. This enhances the channel information first and then the spatial information changes, which significantly improves the extraction and utilization of the building information, enhances the recognition of buildings by the network, preserves more detailed building edge information, and reduces the proportion of the background information.
2.2. DHAU-Net Structure
A notable advantage of the U-Net architecture is the incorporation of skip connections between the encoder and decoder. This effectively addresses the problem of the loss of detailed information during the compression and transmission from the encoder to the decoder. However, in the traditional skip connections, all transmitted shallow vector information is treated equally. No useful information that is important to the target task is further screened in the shallow information, and no disturbance information, such as noise, is weakened. As a result, it leads to insufficient segmentation accuracy and significant noise interference in the final results. An attention mechanism can effectively imitate the human visual information processing system, focusing on processing the commands given by objects stimulated by the neural system of the brain, which ignores irrelevant background information, and improves the efficiency of information extraction, allowing for more efficient feature extraction. Therefore, based on U-Net, this paper assigns corresponding weights to different shallow information, which is denoted by replacing the skip connections of U-Net with channel and spatial attention mechanisms, in order to identify the most relevant aspects of the target segmentation task. The proposed approach enables one to focus on extracting significant and useful information from the input data that is directly related to the current output, thereby improving the quality of the segmentation results. Additionally, the attention mechanism helps disregard noise and redundancy in the input, further enhancing the segmentation accuracy and reducing interference from irrelevant information.
DHAU-Net is an end-to-end deep CNN (DCNN) based on the U-Net architecture. DHAU-Net contains two subnetworks and an attention model: a downsampling network for extracting building feature maps from RGB images, an upsampling network is employed to reconstruct the extracted feature maps, generating an output image of the same size as the input image. And, a DHA model structure connected between the two network architectures. At the end of the network, we use a convolutional layer with a kernel size of 1 × 1 to obtain the final segmentation result. Figure 2 shows the detailed architecture of the DHAU-Net network.
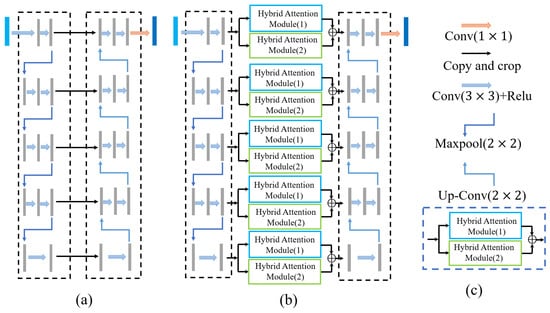
Figure 2.
Net architecture. (a) U-Net; (b) DHAU-Net; (c) DHA extraction module.
In the downsampling network, we choose RGB remote sensing images of size as the input feature images. First, the images pass through two convolutional layers; the padding is 1, the stride is , and the filter size is . On one hand, the output feature image is input into the DHA feature extraction module and then transmitted to the corresponding upsampling block. On the other hand, the feature map undergoes a max-pooling operation, reducing its size by half. This combined convolution and max-pooling operation is reiterated four times, resulting in a final layer count increased from the initial value of 3 to 512. The image size is finally of the original size. Finally, at the bottom layer of the network, after the feature images pass through a convolutional layer with a filter size of , the number of feature image layers is increased to 1024, and then the images are processed through the DHA extraction module as the inputs of the upsampling block. Four consecutive downsampling blocks are used to extract deeper image features for model training and generate more accurate classifications.
In the upsampling block of DHAU-Net, each feature map is first passed through a convolutional layer with a filter size of to reduce the feature maps from 2048 layers to 512 layers. The 512-layer feature maps are then processed through a deconvolution layer with a filter size of , keeping the number of feature layers the same while doubling the image size. This ensures that the input image size is consistent with the output image size in the corresponding downsampling block. Following that, we concatenate the feature map processed by the DHA module with the output feature map of the deconvolution layer in the corresponding downsampling block. This combined result serves as the input for the subsequent convolutional layer in the upsampling block. The concatenated input feature maps are passed through two convolutional layers (with a padding of 1, a stride of , and a filter size of ), keeping the number and sizes of the 512-layer feature maps unchanged. After another deconvolution layer, the number of layers in the feature images is reduced to 256 layers, and the image size is doubled. By repeating this pair of convolution and deconvolution operations four times, the number of layers in the feature maps is reduced to 64, and the feature image size becomes the initial input size () of the downsampling block. Finally, the feature maps are passed through a fully connected layer with a filter size of , which outputs the same number of feature maps as the number of classification categories, and the size of each layer remains the same (). Once all convolution computations with a filter size of throughout the entire network are finished, a rectified linear unit (ReLU) activation function operation is applied to expedite the convergence of the gradient descent process.
3. Experiment
3.1. Experimental Data
We perform comprehensive experiments on the two publicly available datasets, Massachusetts Buildings Dataset (https://www.cs.toronto.edu/~vmnih/data/, accessed on 1 June 2021) and Inria Aerial Image Labeling Dataset (https://project.inria.fr/aerialimagelabeling/, accessed on 1 June 2021). Thirty-two aerial photographs of buildings in Massachusetts, each with a size of , were chosen. Among them, 26 images served as the training set, and the remaining 6 were allocated for the test set. The training dataset and the test dataset are finally processed via random cropping and the addition of random noise, forming 800 training datasets containing images of size and 200 test datasets with images of the same size. The Inria Aerial Image Labeling Dataset selects 48 and 24 images with a size of for training and testing, respectively. The data preprocessing is the same as the Massachusetts dataset, and finally, 800 and 200 training and testing sets are generated.
3.2. Experimental Environment
Both DHAU-Net and the comparison methods use PyTorch to implement their network backbones. All models employ a cross-entropy loss function (CE_loss) to quantify the disparity between the predicted and actual values. Adaptive momentum estimation (Adam) is utilized for updating the network weights. The number of iterations is set to 150, the learning rate is 0.0001 during training, the batch size is 4, the weight decay is 0 by default, and the beta parameters are 0.5 and 0.9999. All experiments are implemented using an Intel(R) Core i7-9700k CPU 3.60 GHz and an NVIDIA GeForce RTX 2060 GPU.
3.3. Evaluation Indicators
In order to provide a clearer understanding of the mathematical implications of evaluation metrics, let us introduce the concept of a confusion matrix. In the field of machine learning, a confusion matrix—also referred to as a possibility matrix or an error matrix—serves as a visual tool that is commonly utilized in supervised learning. Particularly in image accuracy assessment, it is instrumental in comparing predicted values against actual values, presenting the classification results’ accuracy within the matrix. Its key aspects can be summarized as follows: (1) Each column of the confusion matrix signifies a predicted category, with the total in each column representing the number of data predicted as that category. (2) Each row corresponds to the true class of the data, and the total in each row signifies the number of instances of data belonging to that class. (3) The values within each column indicate the number of true data predicted as that class. The typical structure of a confusion matrix is illustrated in Table 1.

Table 1.
Confusion Matrix Structure.
To better express these concepts, we have the following abbreviations: (1) True Positive (TP): Instances where the sample’s true class is positive, and the model correctly identifies it as positive. (2) False Negative (FN): Instances where the sample’s true class is positive, but the model incorrectly identifies it as negative. (3) False Positive (FP): Instances where the sample’s true class is negative, but the model incorrectly identifies it as positive. (4) True Negative (TN): Instances where the sample’s true class is negative, and the model correctly identifies it as negative.
From the confusion matrix, more advanced classification metrics can be derived: Accuracy, mIoU (mean Intersection over Union), Precision, Recall, and F1 Score. The following elaborates on these five evaluation metrics:
Accuracy: Accuracy is the most commonly used metric for classification performance. It represents the precision of the network model, indicating the ratio of correct model identifications to the total number of samples. In general, higher accuracy implies better model performance. Accuracy evaluates the overall precision of the classifier. Its formula (Equation (10)) is expressed as follows:
Precision: Also known as the positive predictive value, the precision indicates the proportion of true positive samples among those identified as positive by the model. Generally, a higher precision suggests a better model performance. Precision is a precise evaluation of the classifier’s predictions for a specific category. Its formula (Equation (11)) is expressed as follows:
Recall: Also known as sensitivity or the true positive rate, recall represents the ratio of correctly identified positive samples to the total number of positive samples. Generally, a higher recall indicates that more positive samples are correctly predicted by the model, suggesting a better model performance. Its formula (Equation (12)) is expressed as follows:
Precision and recall are typically trade-off metrics. In general, when precision is high, recall tends to be low, and vice versa.
: The physical meaning of is a weighted average of precision and recall. In the merging process, the weight of recall is times that of precision, which is designed to balance the two criteria. When is equal to 1, it corresponds to the commonly used (Dice score). considers recall and precision to be equally important. considers recall to be twice as important as precision, while considers recall to be half as important as precision. is commonly used. Its formulas (Equations (13) and (14)) are expressed as follows:
Mean Intersection over Union (mIoU): mIoU calculates the ratio of the intersection to the union between two sets. In the context of image segmentation, it refers to the two sets of true values and predicted values. It can be expressed as the ratio of the sum of TP to the sum of TP, FN, and FP. The calculation involves first computing the intersection over union for each class and then determining the mean. Its formula (Equation (15)) is expressed as follows:
Therefore, Precision and Recall focus on assessing specific characteristics of a particular classification, while Accuracy, mIoU, and serve as overall criteria for judging the classification model. Hence, we evaluate the segmentation model in this paper by considering these five metrics. These metrics are widely employed for assessing the performance of building segmentation methods, facilitating quantitative comparisons and analyses of segmentation results.
4. Results and Analysis
In this section, we present the training details and experimental results. We explore the performance of the DHAU-Net and DHA module in three scenarios: (1) Comparative experiments involving DHAU-Net and SegNet, U-Net, and HRNet; (2) comparison among the DHA module with other similar channel and spatial attention mechanisms; and (3) exploration of the migration capability of the DHA module.
4.1. Massachusetts Dataset
4.1.1. Model Comparison Experiment
To evaluate the performance of DHAU-Net, this paper conducts comprehensive experiments on the Massachusetts Remote Sensing Building Image dataset. We selected three existing state-of-the-art deep learning methods (i.e., SegNet, U-Net and HRNet) and 5 advanced neural networks (i.e., MANet, MACU-Net, MAResU-Net, AttentionUNet, and UNet_scAG) are selected for comparison under the same experimental setting. Each network was trained from scratch without using pre-trained models, and all networks converged during training, as illustrated in the iterative mIoU training plot in Figure 3. Our proposed DHAU-Net are superior to the existing comparison models. The specific quantitative experimental results are presented in Table 2, and the visual comparison effects are shown in Figure 4 and Figure 5.
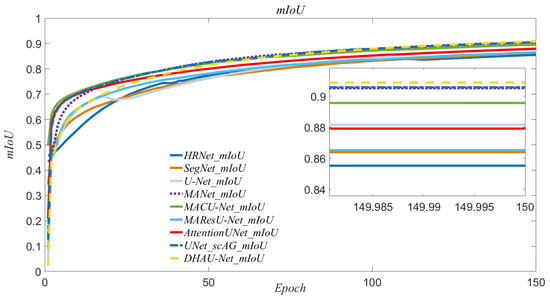
Figure 3.
mIoU curves of HRNet, SegNet, U-Net, e MANet, MACU-Net, MAResU-Net, AttentionUNet, UNet_scAG and DHAU-Net on the Massachusetts dataset.
Table 2.
Specific quantitative experimental results of DHAU-Net and comparative methods on the Massachusetts dataset.
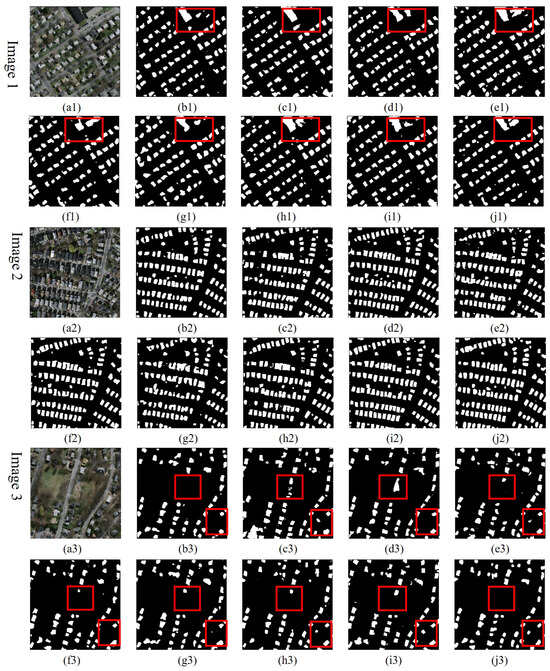
Figure 4.
Visualization of the experimental prediction results of DHAU-Net and contrastive methods on images with random noise on the Massachusetts dataset. (a) Original, (b) HRNet, (c) SegNet, (d) U-Net, (e) MANet, (f) MACU-Net, (g) MAResU-Net, (h) AttentionUNet, (i) UNet_scAG, and (j) DHAU-Net.

Figure 5.
Visualization of the experimental prediction results of DHAU-Net and contrastive methods on images with complex environments on the Massachusetts dataset. (a) Original, (b) HRNet, (c) SegNet, (d) U-Net, (e) MANet, (f) MACU-Net, (g) MAResU-Net, (h) AttentionUNet, (i) UNet_scAG, and (j) DHAU-Net.
From Table 2, DHAU-Net achieves a higher performance across various evaluation metrics compared to the comparison methods. Specifically, for DHAU-Net, the accuracy rate (Accuracy), precision rate (Precision), recall rate (Recall), F1 score and mIoU are 0.9808, 0.9300, 0.8932, 0.9112, and 0.9088, respectively. This indicates the effectiveness of the proposed DHAU-Net in enhancing information screening and reinforcement through skip connections. On the basis of retaining the original feature information provided by the skip connections, different pieces of spatial and channel information are further extracted from the shallow network. This increases the edge detail information and anti-noise ability of the network for building segmentation and reduces the misjudgments and missed classifications regarding large-area buildings in remote sensing images. The five evaluation metrics of HRNet which performs the multi-scale fusion via repeated cross-parallel convolution, and SegNet which uses pooling indices, are lower than those of our method. U-Net achieves a slightly lower performance compared to our method, with a difference of 0.0272, 0.0395, and 0.0279 in mIoU, recall, and F1 score, respectively. This illustrates the effectiveness of the enhancements introduced in this paper, leveraging the U-Net architecture. The improvements contribute to enhanced building segmentation results in urban remote sensing images.
Figure 3 shows the mIoU curves obtained during the training process of HRNet, SegNet, U-Net, MANet, MACU-Net, MAResU-Net, AttentionUNet, UNet_scAG and DHAU-Net approaches. The graph illustrates the convergence behavior of the nine methods, showing that all approaches achieve stability without significant fluctuations. This indicates that the selected loss function, training optimizer, and parameter configurations are suitable for the training process of each method. The smooth and consistent nature of the curves suggests that the models effectively learn from the training data and converge towards optimal solutions.
In Figure 4 and Figure 5, we present visual comparisons of the prediction results from different methods, highlighting various aspects such as the noise interference, uniform building distributions, dense building distributions, and complex urban environments. The visual analysis is conducted to showcase the superior segmentation performance of the proposed method. This is evidenced by the method’s effectiveness in retaining building edge contours, reducing misclassifications, and minimizing instances of missed classifications. Figure 4 and Figure 5 show a total of six prediction plots. Each image consists of five columns. Column (a) is the original image, and columns (b) to (j) correspond to visualizations of the prediction results provided by the HRNet, SegNet, U-Net, MANet, MACU-Net, MAResU-Net, AttentionUNet, UNet_scAG and DHAU-Net, respectively. By comparing the visual outputs, we can observe the effectiveness of the proposed method in accurately segmenting buildings and producing detailed and precise predictions across various challenging scenarios.
Figure 4 mainly shows the image segmentation effects achieved by adding random noise to the remote sensing image. As shown in the red box in Image 1, the segmentation results of HRNet and SegNet have obvious missing points. Although U-Net can recognize the existence of buildings, its segmentation results are not as complete as those of our proposed method. In Image 2, due to the noise interference in the test images, the segmentation results of HRNet and SegNet are visually confusing, and the segmentation accuracy is insufficient. Our DHAU-Net weakens the interference of irrelevant information by adding a channel attention mechanism in the skip connections so that the segmented images have stronger anti-interference ability. In Image 3, despite a large area of grass that is contained in the image, DHAU-Net still performs well by accurately segmenting the building without misclassifying the grass as a building. In contrast, HRNet, SegNet, and U-Net have obviously incorrect segmentation results, as shown in the red boxes in Image 3. It demonstrates the robustness and accuracy of the proposed DHAU-Net in handling noise interference, preserving building details, and avoiding misclassifications in complex urban environments.
Figure 5 shows some urban remote sensing image segmentation results obtained in more complex environments. In Image 4 and Image 6, there are many trees, gray grassy areas, and concrete road disturbances. Our DHAU-Net can accurately remove these disturbances as well as keep the edge details of the building segmentation intact. In contrast, the segmentation results of HRNet, SegNet, and U-Net have some missing and misclassified buildings, as highlighted by the red boxes in Image 4 and Image 6. There is an obvious interference situation and a large sports field presented in the green box in Image 5, which HRNet mistakenly identifies as a building. Overall, the segmentation results of our proposed method are relatively complete, while SegNet and U-Net exhibit noticeable misclassifications, and their segmentation results for larger buildings lack completeness. The DHAU-Net effectively handles complex environments by accurately segmenting buildings and removing unwanted interference, showcasing its superior performance compared to the other methods.
4.1.2. Comparison Experiment for the Attention Module
To further illustrate the advantages of the DHA module, we compare it with other attention modules, namely CBAM and squeeze-and-excitation (SE), when integrated into the U-Net architecture. We explore the contributions of the DHA module and other attention modules to the performance of urban remote sensing building image segmentation. The training is conducted under the same experimental conditions, and the training parameters are unified. All networks are trained from scratch without using pretrained models. The training results of our proposed DHA module are superior to those of the existing comparison models. The specific quantitative experimental results are shown in Table 3, and a visual comparison of the network effects is shown in Figure 6.
Table 3.
Specific quantitative experimental results of ablation learning on attention mechanisms on the Massachusetts dataset.
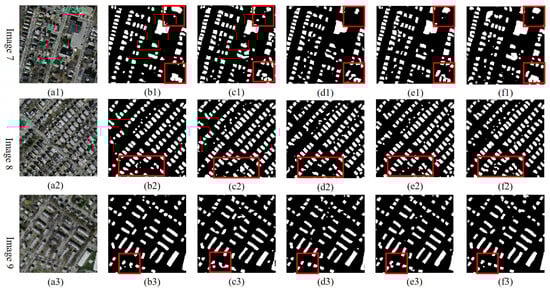
Figure 6.
Visualization of experimental prediction results of ablation learning on attention mechanisms on the Massachusetts dataset. (a) Original, (b) U-Net + CBAM, (c) U-Net + SE, (d) U-Net + HAM-1, (e) U-Net + HAM-2, and (f) DHAU-Net.
Table 3 shows that the U-Net + CBAM does not perform well across various metrics, including accuracy, mIoU, precision, recall, and F1 score. This indicates that the CBAM is not suitable for use in the skip connections of U-Net to process urban remote sensing building image segmentation tasks. The results obtained with the U-Net + SE are slightly worse than our DHAU-Net in all metrics, which further confirms that our DHA module has a strong effect on urban remote sensing building image segmentation.
Figure 6 shows a total of three prediction plots. Each image is divided into four columns. Column (a) is the original image, and columns (b) to (f) correspond to the visualization of the prediction results produced by the U-Net + CBAM, U-Net + SE, U-Net + HAM-1, U-Net + HAM-2 and DHAU-Net architectures.
Figure 6 provides visualization results of the DHA module and the two compared attention modules (the CBAM and SE modules). In Image 7, both U-Net + SE and DHAU-Net achieve comparable accuracy for building segmentation, but DHAU-Net performs better in terms of maintaining the integrity of the building segmentation in certain aspects. All three methods exhibit a strong performance in handling the noise interference, underscoring the effectiveness of spatial and channel attention mechanisms in this regard. In cases involving complex environmental interference, such as sparse buildings and images with pronounced shadow effects as shown in Image 8, U-Net + CBAM and U-Net + SE are still better in terms of accuracy but fail to deliver satisfactory building integrity. In Image 9, where buildings are denser and more evenly distributed, three methods exhibit excellent segmentation effects. However, U-Net + CBAM and U-Net + SE tend to produce more confusing building segmentation results. On the whole, our DHAU-Net not only performs well in cases involving sparse and dense buildings but also yields more accurate segmentation results when the given buildings are seriously disturbed by noise and shadows. The ability of DHAU-Net’s to enhance information screening and reinforce skip connections plays a crucial role in achieving superior segmentation outcomes, particularly in challenging conditions with noise and complex environmental disturbances.
4.1.3. Attention Module-Based Transfer Learning Experiment
To assess the migration ability of the DHA module, we integrate it into the SegNet architecture and evaluate its impact on the segmentation performance. The training process is conducted in the same experimental environment as the other models, utilizing uniform training parameters and training from scratch without pre-trained models. The training results show the excellent transferability of the DHA module. The specific quantitative experimental results are shown in Table 4, and a visual comparison of the network effects is shown in Figure 7.
Table 4.
Specific quantitative experimental results of transfer learning on the DHA module on the Massachusetts dataset.
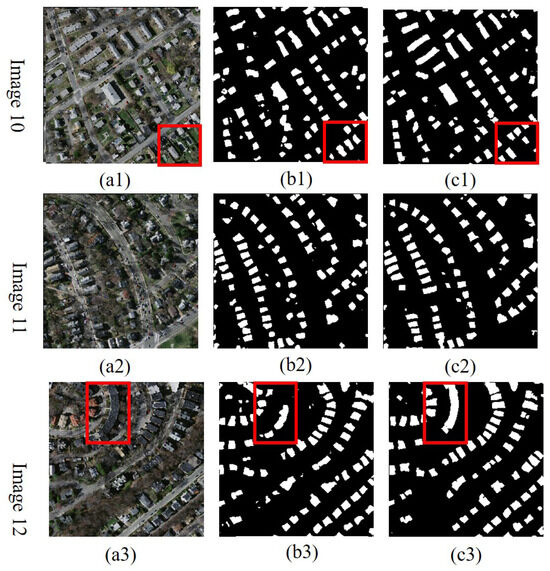
Figure 7.
Visualization of the experimental prediction results. (a) Original, (b) SegNet, and (c) SegNet + DHA.
Compared with the original SegNet network, SegNet + DHA presents great improvements in terms of the accuracy, mIoU, recall, and F1 score metrics, achieving values of 0.9759, 0.8884, 0.8817, and 0.8911, respectively. Figure 8 depicts the accuracy curves during the training processes of SegNet and SegNet + DHA. The smoothness of the curves indicates that the DHA module possesses good transferability, effectively enhancing the segmentation accuracy and enabling quick convergence. These results provide evidence of the substantial improvement achieved by the DHA module when integrated into SegNet, validating its effectiveness in enhancing the segmentation performance for urban remote sensing building images.
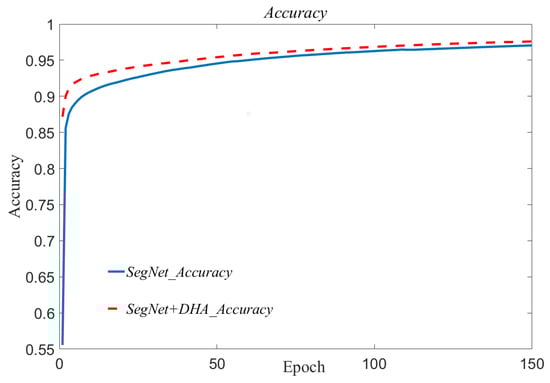
Figure 8.
The iterative training accuracy curves of SegNet and SegNet + DHA.
Figure 7 provides a visualization of test results obtained when migrating the DHA module to SegNet. As shown in the red boxes in Image 10, SegNet and the SegNet + DHA have different degrees of incorrect segmentation, but SegNet + DHA has fewer errors regarding the recognition and segmentation of certain relatively hidden buildings. For some remote sensing images with more complex environments, as shown in Image 11, the addition of the DHA module to SegNet enables it to pay more attention to building information, resulting in better preservation of edge details. Moreover, SegNet + DHA significantly improves the completeness of building segmentation compared to SegNet in Image 11, demonstrating the effectiveness of the proposed DHA module for conducting building segmentation in remote sensing images.
4.2. Inria Aerial Image Labeling Dataset
In this subsection, we investigate the transferability of DHAU-Net by training all models on the Inria Aerial Image Labeling Dataset. All models are completely the same except for the different datasets. The specific quantitative evaluation indicators are shown in Table 5, and the detailed visual effect display diagram is shown in Figure 9.
Table 5.
Specific quantitative experimental results of DHAU-Net and comparative methods on the Inria Aerial Image Labeling Dataset.
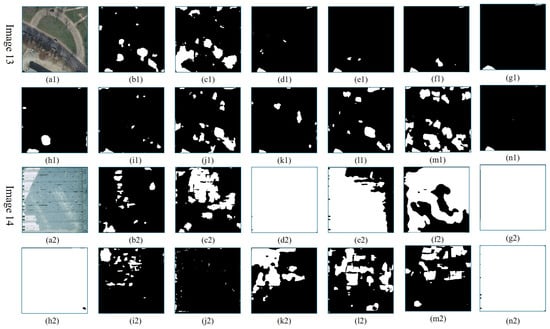
Figure 9.
Visualization of experimental prediction results on the Inria Aerial Image Labeling Dataset. (a) Original, (b) HRNet, (c) SegNet, (d) U-Net, (e) U-Net + HAM-1, (f) U-Net + HAM-2, (g) U-Net + CBAM, (h) U-Net+SE, (i) MANet, (j) MACU-Net, (k) MAResU-Net, (l) AttentionUNet, (m) UNet_scAG, and (n) DHAU-Net.
Table 5 shows the quantitative metrics results of the comparative methods and DHAU-Net on the Inria Aerial Image Labeling Dataset. DHAU-Net achieved accuracy, mIoU, precision, recall, and F1_scores of 0.9688, 0.9089, 0.9519, 0.8897, and 0.9197, respectively. In comparison to the original U-Net, all five quantitative evaluations are directly improved. Among them, U-Net + CBAM achieves the highest recall of 0.8909, but all other methods perform lower than DHAU-Net. These results verify the effectiveness of attention mechanisms in improving the segmentation quality of remote sensing images, with the DHA module demonstrating the best performance in enhancing segmentation effects.
Figure 9 presents two test images (Image 13 and Image 14), each of which is divided into 7 columns and 2 rows with a total of 14 images. (a) to (n) are the segmentation test results of the original test images, HRNet, SegNet, U-Net, U-Net + HAM-1, U-Net + HAM-2, U-Net + CBAM, U-Net + SE, MANet, MACU-Net, MAResU-Net, AttentionUNet, U-Net_scAG and DHAU-Net, respectively. In Image 13, the segmentation results of various methods of remote sensing images are significantly affected by noise and interference from roads, trees, cars, and shadows. Specifically, roads and trees are incorrectly segmented as buildings. U-Net, U-Net + HAM-1, U-Net + HAM-2, U-Net + SE, MANet, and MAResU-Net can accurately identify the buildings in the lower left corner, but there are also a small number of errors in dividing cars and roads into buildings. The segmentation results of U-Net + CBAM and DHAU-Net are comparable, but DHAU-Net is less disturbed by shadows. In Image 14, we explore the visual effect of large-area building coverage segmentation. HRNet, SegNet, MANet, MACU-Net, MAResU-Net, AttentionUNet, and U-Net_scAG do not completely segment large-area buildings, and exhibit a high error rate. Although U-Net + HAM-1 and U-Net + HAM-2 segmented most of the buildings, there were still a few missing segmentations. U-Net, U-Net + CBAM, U-Net + SE show overall better segmentation effects, and they can accurately and completely segment buildings, but they are not as effective as DHAU-Net in terms of detail retention. On the Inria Aerial Image Labeling Dataset, the addition of the DHA module to U-Net improves detail preservation. The DHA module can pay more attention to foreground buildings, ignore background interference information, and eliminate noise interference.
4.3. Time Complexity Discussion
In Figure 10, the training time of each model is compared under the same conditions, measured in hours. On both datasets, the training time of DHAU-Net only slightly increased by 0.6 h compared to the original U-Net. Replacing the skip connection of U-Net with the DHA module does not add much time cost. Considering the improved segmentation performance of DHAU-Net on remote sensing images, the additional time cost is acceptable. Compared to the other comparison methods, the cost difference of DHAU-Net training time is controlled at approximately 1 h, with no significant increase in time cost as a whole. In general, DHAU-Net has a strong segmentation ability in urban remote sensing image buildings, and the improvement in performance is achieved without a significant trade-off in training time. The DHA module proves to be a feasible and effective method for enhancing the network segmentation ability.
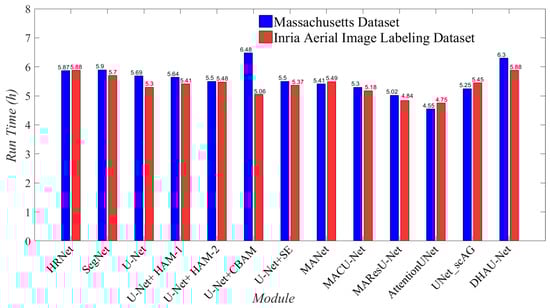
Figure 10.
Time cost histogram.
5. Conclusions
In this paper, we propose a novel Dual Hybrid Attention module and introduce a DHAU-Net for building segmentation in remote sensing images. DHA modules, which replace the skip connections in U-Net, can eliminate redundant information interference and enhances the collection and utilization of important shallow features. We discussed the performance of the DHAU-net and the DHA module in three different scenarios on the Massachusetts dataset, and perform transfer learning of dataset replacement on the Inria Aerial Image Labeling Dataset to explore the generalization of DHAU-Net. The evaluation metrics demonstrate the effectiveness of our proposed method in building segmentation. And the extensive experiments also show the robustness of our method in handling noise interference, preserving building details, and avoiding misclassifications in complex urban environments.
Author Contributions
Conceptualization, J.L., X.L., H.Y., Z.Z. and J.F.; Methodology, J.L., X.L. and Z.Z.; Software, J.L. and H.Y.; Validation, X.L., H.Y. and J.F.; Writing—original draft, J.L. and X.L.; Writing—review and editing, H.Y., Z.Z. and J.F. All authors have read and agreed to the published version of the manuscript.
Funding
This research was funded in part by the Sichuan Science and Technology Program under Grant 2021YJ0351 and 2022YFS0521, in part by the Natural Science Foundation of Sichuan Province under Grant No. 2023NSFSC0020, and in part by the Opening Fund of Geomathematics Key Laboratory of Sichuan Province under Grant scsxdz2019zd03 and Grant scsxdz2021yb02.
Data Availability Statement
The raw data used in this study were obtained from the the Massachusetts Buildings Dataset (https://www.cs.toronto.edu/~vmnih/data/, accessed on 1 June 2021) released by the University of Toronto in 2013, and the Inria Aerial Image Labeling Dataset (https://project.inria.fr/aerialimagelabeling/, accessed on 1 June 2021) released by Emmanuel Maggiori in 2017.
Conflicts of Interest
Author Haolang Yang was employed by the company Chengdu Gas Group Corporation Ltd. The remaining authors declare that the research was conducted in the absence of any commercial or financial relationships that could be construed as a potential conflict of interest.
References
- Mostafa, E.; Li, X.; Sadek, M.; Dossou, J.F. Monitoring and Forecasting of Urban Expansion Using Machine Learning-Based Techniques and Remotely Sensed Data: A Case Study of Gharbia Governorate, Egypt. Remote Sens. 2021, 13, 4498. [Google Scholar] [CrossRef]
- Ünlü, R.; Kiriş, R. Detection of Damaged Buildings after an Earthquake with Convolutional Neural Networks in Conjunction with Image Segmentation. Vis. Comput. 2022, 38, 685–694. [Google Scholar] [CrossRef]
- Reksten, J.H.; Salberg, A.B. Estimating Traffic in Urban Areas from Very-High Resolution Aerial Images. Int. J. Remote Sens. 2021, 42, 865–883. [Google Scholar] [CrossRef]
- Guo, R.; Xiao, P.; Zhang, X.; Liu, H. Updating land cover map based on change detection of high-resolution remote sensing images. J. Appl. Remote Sens. 2021, 15, 044507. [Google Scholar] [CrossRef]
- Wang, J.; Yang, X.; Qin, X.; Ye, X.; Qin, Q. An Efficient Approach for Automatic Rectangular Building Extraction From Very High Resolution Optical Satellite Imagery. IEEE Geosci. Remote Sens. Lett. 2015, 12, 487–491. [Google Scholar] [CrossRef]
- Zhang, X.P.; Desai, M. Segmentation of bright targets using wavelets and adaptive thresholding. IEEE Trans. Image Process. 2001, 10, 1020–1030. [Google Scholar] [CrossRef] [PubMed]
- Felzenszwalb, P.F.; Huttenlocher, D.P. Efficient graph-based image segmentation. Int. J. Comput. Vis. 2004, 59, 167–181. [Google Scholar] [CrossRef]
- Krizhevsky, A.; Sutskever, I.; Hinton, G.E. ImageNet Classification with Deep Convolutional Neural Networks. In Advances in Neural Information Processing Systems; Pereira, F., Burges, C., Bottou, L., Weinberger, K., Eds.; NIPS’12; Curran Associates, Incorporated: Red Hook, NY, USA, 2012; Volume 25, pp. 1097–1105. [Google Scholar]
- Li, K.; Cheng, G.; Bu, S.; You, X. Rotation-Insensitive and Context-Augmented Object Detection in Remote Sensing Images. IEEE Trans. Geosci. Remote Sens. 2018, 56, 2337–2348. [Google Scholar] [CrossRef]
- Xia, G.S.; Bai, X.; Ding, J.; Zhu, Z.; Belongie, S.; Luo, J.; Datcu, M.; Pelillo, M.; Zhang, L. DOTA: A Large-Scale Dataset for Object Detection in Aerial Images. In Proceedings of the 2018 IEEE/CVF Conference on Computer Vision and Pattern Recognition, Salt Lake City, UT, USA, 18–23 June 2018; pp. 3974–3983. [Google Scholar] [CrossRef]
- Wei, Z.; Huang, Y.; Chen, Y.; Zheng, C.; Gao, J. A-ESRGAN: Training Real-World Blind Super-Resolution with Attention U-Net Discriminators. In Proceedings of the PRICAI 2023: Trends in Artificial Intelligence: 20th Pacific Rim International Conference on Artificial Intelligence, PRICAI 2023, Jakarta, Indonesia, 15–19 November 2023; Proceedings, Part III. Springer: Berlin/Heidelberg, Germany, 2023; pp. 16–27. [Google Scholar] [CrossRef]
- Rehman, M.U.; Ryu, J.; Nizami, I.F.; Chong, K.T. RAAGR2-Net: A brain tumor segmentation network using parallel processing of multiple spatial frames. Comput. Biol. Med. 2023, 152, 106426. [Google Scholar] [CrossRef] [PubMed]
- Ryu, J.; Rehman, M.U.; Nizami, I.F.; Chong, K.T. SegR-Net: A deep learning framework with multi-scale feature fusion for robust retinal vessel segmentation. Comput. Biol. Med. 2023, 163, 107132. [Google Scholar] [CrossRef] [PubMed]
- Kemker, R.; Salvaggio, C.; Kanan, C. Algorithms for semantic segmentation of multispectral remote sensing imagery using deep learning. ISPRS J. Photogramm. Remote Sens. 2018, 145, 60–77. [Google Scholar] [CrossRef]
- Li, G.; Jiang, S.; Yun, I.; Kim, J.; Kim, J. Depth-Wise Asymmetric Bottleneck with Point-Wise Aggregation Decoder for Real-Time Semantic Segmentation in Urban Scenes. IEEE Access 2020, 8, 27495–27506. [Google Scholar] [CrossRef]
- Zhang, C.; Sargent, I.; Pan, X.; Li, H.; Gardiner, A.; Hare, J.; Atkinson, P.M. Joint Deep Learning for land cover and land use classification. Remote Sens. Environ. 2019, 221, 173–187. [Google Scholar] [CrossRef]
- Chen, B.; Liu, Y.; Zhang, Z.; Lu, G.; Kong, A.W.K. TransAttUnet: Multi-Level Attention-Guided U-Net with Transformer for Medical Image Segmentation. IEEE Trans. Emerg. Top. Comput. Intell. 2024, 8, 55–68. [Google Scholar] [CrossRef]
- Liu, Y.; Yao, J.; Lu, X.; Xia, M.; Wang, X.; Liu, Y. RoadNet: Learning to Comprehensively Analyze Road Networks in Complex Urban Scenes from High-Resolution Remotely Sensed Images. IEEE Trans. Geosci. Remote Sens. 2019, 57, 2043–2056. [Google Scholar] [CrossRef]
- Samie, A.; Abbas, A.; Azeem, M.M.; Hamid, S.; Iqbal, M.A.; Hasan, S.S.; Deng, X. Examining the impacts of future land use/land cover changes on climate in Punjab province, Pakistan: Implications for environmental sustainability and economic growth. Environ. Sci. Pollut. Res. 2020, 27, 25415–25433. [Google Scholar] [CrossRef]
- Long, J.; Shelhamer, E.; Darrell, T. Fully Convolutional Networks for Semantic Segmentation. arXiv 2014, arXiv:1411.4038. [Google Scholar]
- Ronneberger, O.; Fischer, P.; Brox, T. U-Net: Convolutional Networks for Biomedical Image Segmentation. In Proceedings of the Medical Image Computing and Computer-Assisted Intervention—MICCAI 2015, Munich, Germany, 5–9 October 2015; Springer: Cham, Switzerland, 2015; pp. 234–241. [Google Scholar] [CrossRef]
- Sun, K.; Zhao, Y.; Jiang, B.; Cheng, T.; Xiao, B.; Liu, D.; Mu, Y.; Wang, X.; Liu, W.; Wang, J. High-Resolution Representations for Labeling Pixels and Regions. arXiv 2019, arXiv:1904.04514, [1904.04514]. [Google Scholar]
- Badrinarayanan, V.; Kendall, A.; Cipolla, R. SegNet: A Deep Convolutional Encoder-Decoder Architecture for Image Segmentation. IEEE Trans. Pattern Anal. Mach. Intell. 2017, 39, 2481–2495. [Google Scholar] [CrossRef]
- Wei, Y.; Liu, X.; Lei, J.; Yue, R.; Feng, J. Multiscale feature U-Net for remote sensing image segmentation. J. Appl. Remote Sens. 2022, 16, 016507. [Google Scholar] [CrossRef]
- Dong, R.; Pan, X.; Li, F. DenseU-Net-Based Semantic Segmentation of Small Objects in Urban Remote Sensing Images. IEEE Access 2019, 7, 65347–65356. [Google Scholar] [CrossRef]
- Oktay, O.; Schlemper, J.; Folgoc, L.L.; Lee, M.C.H.; Heinrich, M.P.; Misawa, K.; Mori, K.; McDonagh, S.G.; Hammerla, N.Y.; Kainz, B.; et al. Attention U-Net: Learning Where to Look for the Pancreas. arXiv 2018, arXiv:1804.03999. [Google Scholar]
- Li, R.; Duan, C.; Zheng, S.; Zhang, C.; Atkinson, P.M. MACU-Net for Semantic Segmentation of Fine-Resolution Remotely Sensed Images. IEEE Geosci. Remote Sens. Lett. 2022, 19, 8007205. [Google Scholar] [CrossRef]
- Lu, M.; Zhang, Y.X.; Du, X.; Chen, T.; Liu, S.; Lei, T. Attention-Based DSM Fusion Network for Semantic Segmentation of High-Resolution Remote-Sensing Images. In Proceedings of the International Conference on Natural Computation, Fuzzy Systems and Knowledge Discovery, Xi’an, China, 1–3 August 2020; Volume 88, pp. 610–618. [Google Scholar] [CrossRef]
- Khanh, T.L.B.; Dao, D.P.; Ho, N.H.; Yang, H.J.; Baek, E.T.; Lee, G.; Kim, S.H.; Yoo, S.B. Enhancing U-Net with Spatial-Channel Attention Gate for Abnormal Tissue Segmentation in Medical Imaging. Appl. Sci. 2020, 10, 5729. [Google Scholar] [CrossRef]
- Li, R.; Zheng, S.; Duan, C.; Su, J.; Zhang, C. Multistage Attention ResU-Net for Semantic Segmentation of Fine-Resolution Remote Sensing Images. IEEE Geosci. Remote Sens. Lett. 2022, 19, 8009205. [Google Scholar] [CrossRef]
- Yu, M.; Chen, X.; Zhang, W.; Liu, Y. AGs-Unet: Building Extraction Model for High Resolution Remote Sensing Images based on Attention Gates U Network. Sensors 2022, 22, 2932. [Google Scholar] [CrossRef]
- Xu, L.; Liu, Y.; Yang, P.; Chen, H.; Zhang, H.; Wang, D.; Zhang, X. HA U-Net: Improved Model for Building Extraction From High Resolution Remote Sensing Imagery. IEEE Access 2021, 9, 101972–101984. [Google Scholar] [CrossRef]
- Mnih, V. Machine Learning for Aerial Image Labeling. Ph.D. Thesis, University of Toronto, Toronto, ON, Canada, 2013. [Google Scholar]
- Cordts, M.; Omran, M.; Ramos, S.; Rehfeld, T.; Enzweiler, M.; Benenson, R.; Franke, U.; Roth, S.; Schiele, B. The Cityscapes Dataset for semantic urban scene understanding. In Proceedings of the Proceedings of the IEEE Conference on Computer Vision and Pattern Recognition (CVPR), Las Vegas, NV, USA, 27–30 June 2016; pp. 3213–3223. [Google Scholar]
Disclaimer/Publisher’s Note: The statements, opinions and data contained in all publications are solely those of the individual author(s) and contributor(s) and not of MDPI and/or the editor(s). MDPI and/or the editor(s) disclaim responsibility for any injury to people or property resulting from any ideas, methods, instructions or products referred to in the content. |
© 2024 by the authors. Licensee MDPI, Basel, Switzerland. This article is an open access article distributed under the terms and conditions of the Creative Commons Attribution (CC BY) license (https://creativecommons.org/licenses/by/4.0/).