Article

The Effects of Bee Additives on the Physico-Chemical and Antioxidant Properties of Rapeseed Honey

Department of Food Technology and Assessment, Division of Food Quality Assessment, Institute of Food Sciences, Warsaw University of Life Sciences, Nowoursynowska 159 Street, 02-787 Warsaw, Poland
*
Author to whom correspondence should be addressed.
Appl. Sci. 2024, 14(3), 1292; https://doi.org/10.3390/app14031292
Submission received: 14 December 2023 / Revised: 15 January 2024 / Accepted: 31 January 2024 / Published: 4 February 2024

Abstract

:
The aim of this paper was to conduct a comparative analysis of rapeseed honeys enriched with various bee products: propolis (1%), bee bread (2%), and bee pollen (5%). The parameters examined included water content, electrical conductivity, pH, free acid content, brown pigment content, color analysis, total polyphenol content, sugar content, and antioxidant activity using the DPPH method. The results demonstrated compliance with Polish requirements for commercial honey quality, with one exception: honey containing 1% propolis, which had a water content of 21.15%. The analysis results indicated that the tested bee products exhibited strong antioxidant properties, with rapeseed honey enriched with 5% bee pollen showing the highest antioxidant activity and content.

1. Introduction

Honey is a sweet substance produced by Apis mellifera bees from floral nectar, flowers, or floral secretions [1]. Collected substances are mixed with specific compounds from bees and then deposited by insects in beeswax honeycombs, where they mature [2]. This product is consumed by humans for its unique organoleptic properties and nutritional value, but also for its high functional properties and health benefits [3]. The characteristics of honey vary depending on its botanical origin, geographical location, climatic conditions, as well as processing and storage [4].
The carbohydrate composition of honey is primarily influenced by the type of flowers used by bees for its production, the climate, geographical origin, processing, and storage. Monosaccharides make up approximetely 75.00% of the sugars in honey, with 10.00–15.00% composed of disaccharides and trace amounts of other sugars. These carbohydrates contribute to energy value, hygroscopicity, viscosity, and granulation [5]. Fructose is the dominant sugar in honey, but glucose is found in higher concentrations in certain varieties such as rapeseed and clover honeys, which leads to faster crystallization [6].
Polyphenols found in honey include flavonoids, phenolic acids, and their derivatives, conferring honey with its antioxidant and antibacterial properties [7,8]. Honeys may contain various aromatic and aliphatic carboxylic acids, mainly hydroxy and methoxy derivatives of cinnamic and benzoic acids, contributing to their sensory properties [8].
The classes of flavonoids present in honey include flavonols, flavones, and flavanones [9]. Common flavonoids found in honey are apigenin, kaempferol, quercetin, apigenin, hesperidin, pinocembrin, and isorhamnetin [10]. The most common phenolic acids in honey include benzoic, caffeic, vanillic, coumaric, p-coumaric, salicylic, gallic, p-hydroxybenzoic, phelluric, chlorogenic, and protocatechuic acids [8].
Bee pollen is popular for its nutritional components, comprising carbohydrates (13.00–55.00%), lipids (1.00–13.00%), proteins (10.00–40.00%), fatty acids, enzymes, vitamins, flavonoids, and macro- and microelements. Phenolic compounds, comprising 1.60% of bee pollen composition, are significant, including catechins, flavonoids, and phenolic acids. Among flavonoids, accounting for 1.40%, the main ones are quercetin, kaempferol, and isorhamnetin, while in phenolic acids (0.20%), chlorogenic acid is predominant [11].
Bee bread is obtained from pollen, with the addition of bee digestive enzymes, honey, nectar, and beeswax. The use of bee bread in food formulations is not only attributed to its diverse range of bioactive compounds but also to its ability to control certain food pathogens. It is anticipated that the utilization of bee bread will continue to grow due to its antioxidant properties [12].
Propolis contains higher amounts of phenolic compounds than honeys, exhibiting significantly higher antibacterial and antioxidant activity due to its constituents such as flavonoids (kaempferol, galangin, quercetin), terpenes, and enzymes [13,14]. Propolis is employed as an ingredient in candies and bio-pharmaceuticals, gaining popularity as a natural preservative and source of bioactive compounds for food and beverages, contributing to the improvement of shelf life and consumer health [13].
The addition of bee products to honey has become one way of introducing new products, such as functional food. Several experiments have been conducted to demonstrate the advantages of such products. The findings indicate that incorporating propolis extract into honey significantly increases the concentration of polyphenolic compounds, particularly flavonoids and phenolic acids. Chrysin, pinocembrin, p-coumaric acid, and ferulic acid were identified as the most abundant compounds. The addition of propolis extract, along with an increase in polyphenolic compounds, resulted in enhanced antioxidant, antiradical, and reductive activities. The obtained results suggest that honey enriched with propolis extract can be an excellent source of antioxidants; however, the usefulness of this additive depends significantly on changes in sensory characteristics and consumer acceptance [15].
The incorporation of both propolis and bee bread into lime honey improved its ability to scavenge free radicals, attributed to the interaction between these bee-derived products. Consequently, honey enriched with other bee products may be considered functional food supplements with potent antioxidant properties and robust antibacterial activity, particularly against E. coli [12]. In a study by Miłek et al. 2023 [16], the bioactivity and nutritional value of rapeseed honey enriched with a 10% addition of natural bee bread and its substitutes obtained by bee pollen fermentation in laboratory conditions were compared. Researchers reported a significant increase in antioxidant activity and polyphenol content in the enriched honey samples. Furthermore, all tested honeys demonstrated genoprotective potential against yeast DNA damage. The obtained results affirm the benefits of combining honey with both bee bread and its substitute [16].
The aim of this study was to conduct a comparative analysis of the quality of rapeseed honeys enriched with various bee products: propolis (1%), bee bread (2%), and bee pollen (5%).

2. Materials and Methods

2.1. Test Materials

All four honeys were purchased from a Polish market in February 2022. The materials used for the research were honeys from a single producer—Pogórze Family Apiary of the Gałuszka Family. All products were rapeseed honey (base honey), and according to the producer declaration, the same rapeseed honey was enriched with the addition of 1% of propolis (powdered form), 2% of bee bread, and 5% of bee pollen. The products were purchased through the website of the store (https://pogorzanska-pasieka.pl/) on 15 December 2022. According to the manufacturer’s declaration, the rapeseed honey (base) did not contain any other ingredients, and its shelf life was until 30 June 2025. The next honey was rapeseed honey enriched with 1% propolis (99% rapeseed honey), with a shelf life until 28 February 2024, and it was produced based on the so-called base honey. Subsequently, the rapeseed honey enriched with 2% bee bread had a shelf life until 30 August 2025, and it was also produced based on the base honey. The last product was rapeseed honey with the addition of bee pollen (5%) and a shelf life until 24 February 2024, which was also produced based on the base honey.

2.2. Determination of Water Content in Honey by the Refractometric Method [17]

Approximately 5 ± 0.001 g of honey was weighed into a test tube. The sample was then placed in a water bath and heated to a temperature of 35–45 °C to achieve a liquid consistency. Subsequently, measurements were taken by placing a few drops of honey on the refractometer prism and reading the refractive index on the scale. The water content in the sample was determined from a table expressed in weight percentages, corresponding to the measured refraction, taking into account the ambient temperature other than 20 °C. To obtain a temperature higher than 20 °C, 0.00023 was added to the result for each degree, and in case of temperatures below 20 °C, this value was subtracted. The analysis was conducted in three repetitions.

2.3. Determination of Specific Electrical Conductivity of Honey [17]

An appropriate amount of honey was weighed in a 250 mL beaker, and it was converted to dry mass according to the formula:
M = 20   g 100 m S
where:
M—honey weight [g],
MS—the content of dry matter, which is 100%, minus the water content.
The prepared sample, accurately measured to 0.0001 g, was dissolved in a small volume of distilled water in a 100 mL measuring flask and filled to the mark. Before taking measurements, the conductivity cell constant was determined by placing an electrode and thermometer in a 40 mL solution of potassium chloride 0.1 M. When the solution reached 20 degrees Celsius, the electrical conductivity result was recorded in mS. The cell constant K was calculated using the formula.
K = 11.691 1 G
where:
K—cell constant [cm−1],
G—electrical conductivity [mS], measured using a conductivity cell,
11.691—the sum of the average electrical conductivity value of freshly distilled water expressed in mS × cm−1 and the electrical conductivity of a 0.1 M solution of potassium chloride at 20 °C.
Then, the electrode was rinsed with distilled water. The specific electrical conductivity of honey was determined by placing the conductivity cell electrode in a 40 mL previously prepared sample and calculated using the formula.
S H = K G
where:
SH—electrical conductivity of the honey solution [mS × cm−1];
K—cell constant [cm−1];
G—conductivity [mS].
The analysis was conducted in three repetitions.

2.4. Determination of pH and Free Acids in Honey [17]

About ten grams of honey was dissolved in 75 mL of carbon dioxide-free distilled water in a 250 mL beaker. To ensure thorough mixing, a magnetic stirrer was used, and the pH electrode was immersed in the solution, and the reading was taken. In order to determine the free acidity, a 0.1 M NaOH solution was prepared by dissolving it in a 1000 mL volumetric flask. Such a solution was then titrated with previously prepared basic rapeseed honey samples, and rapeseed honey samples enriched with propolis, bee bread, or bee pollen until a pH of 8.3 was achieved. Free acidity [N] expressed in mval/kg of honey was calculated from the formula:
N = V 0.1 M   N A O H     10
The analysis was conducted in three repetitions.

2.5. Determination of Brown Pigments in Honey Using the Spectrophotometric Method [18]

About one gram of honey was weighed using a technical scale. The sample was then dissolved in 5 mL of distilled water and mixed. Subsequently, the sample was transferred to a cuvette, and the absorbance was measured using a Shimadzu UV mini-1240 spectrophotometer (Shimadzu™, Kyoto, Japan)at a wavelength of 420 nm. The analysis was performed in three repetitions.

2.6. Analyzing the Color of Honey Using the Spectrophotometric Method [19]

About five grams of honey was weighed using a technical scale. The sample was then dissolved in 10 mL of distilled water, mixed, and filtered through a fluted filter. The absorbance was measured at a wavelength of 635 nm using a Shimadzu UV mini-1240 spectrophotometer. The color of the honey was expressed in Pfund units, calculated using the formula:
mm Pfund = −38.70 + 371.39 × Abs
where:
mm Pfund—honey color intensity in Pfund units;
Abs—sample absorbance.
The analysis was performed in three repetitions.

2.7. Determination of the Total Polyphenol Content Using the Folin–Ciocalteu Method—Microplate Method [20]

Preparation of honey extract: 3 ± 0.001 g of honey was weighed into a 50 mL conical flask and dissolved in 30 mL of methanol. In a microplate, using an automatic pipette, the following extracts and reagents were added sequentially: 20 µL of honey extract (in 3 repetitions), 100 µL of Folin–Ciocalteu reagent diluted in a 1:10 ratio, and 75 µL of sodium carbonate 20% (m/v) solution. The prepared samples were then left in the dark at room temperature for 2 h. After the specified time, the absorbance was measured at a wavelength of 740 nm using a microplate reader (SPECTROstar Nano by BMG LABTECH, Offenburg, Germany). A solution of gallic acid was used as a standard to prepare the standard curve (in the range of 0.1–2 µg/100 cm3), and only the reagents used to prepare the proper samples and the standard curve were used for the blank sample. The total content of phenolic compounds was expressed in mg of gallic acid equivalent (GAE) per 100 g of the sample. The analysis was performed in three repetitions.

2.8. Determination of the Antioxidant Capacity of Honey Using the DPPH Free Radical—Microplate Method [21,22]

Preparation of honey extract: 3 ± 0.001 g of honey was weighed into a 50 mL conical flask and dissolved in 30 mL of methanol. Specific determination: In a microplate, using an automatic pipette, the following were added sequentially: 20 µL of honey extract (in 3 repetitions) and 180 µL of DPPH solution in methanol at a concentration of 0.1 mmol/L. Methanol and DPPH solution were used as a control, while methanol was used as a blank sample. The prepared samples were left at room temperature in the dark for 60 min. After the specified time, the absorbance was measured at a wavelength of 515 nm using a microplate reader (SPECTROstar Nano by BMG LABTECH). The antioxidant activity was expressed as AA [%] of the DPPH+ radical and calculated using the formula:
A A   % = 100 %     ( A k A p ) A k
where:
Ak—absorbance of the control sample;
Ap—absorbance of the proper sample.

2.9. Determination of Sugar Content by HPLC Method [23]

Stock standard solutions of fructose, glucose, and sucrose (Sigma Aldrich, St. Louis and Burlington, MA, USA) were prepared in distilled water to achieve a final concentration of 1 mg/mL. For the honey sample solution, 1 g of honey was diluted with water to prepare a 10 mL solution. The honey extract was then vortexed to ensure complete dissolution. Both standards and samples were filtered using a syringe nylon filter before HPLC analysis. HPLC analysis was performed on a Shimadzu LC-40DXR Nexera system equipped with an SCL-40 system controller, SIL-40CXR autosampler, CTO-40C column oven, and ELSD-LT II detector. Chromatographic separations were conducted on a Phenomenex Luna NH2 column (5 μm particle size, 250 mm × 4.60 mm, 100 Å) (Phenomenex, Torrance, CA, USA) with isocratic elution of acetonitrile–water (78:22, v/v). The column oven temperature was set at 30 °C, and the injection volume was 10 μL. The mobile phase was pumped through the HPLC-ELSD system at a flow rate of 1.5 mL/min. Each run was completed within 12 min. The temperature of the evaporative drift tube was set at 40 °C, and nitrogen pressure was regulated to 350 kPa, while the gain and filter values were set at 7 and 10, respectively. Identification of sugars was achieved by comparing the retention times of obtained peaks with the retention times of their chromatographic standards. Triplicate injections were performed, and average peak areas were used for peak quantification. Fructose, glucose, and sucrose were quantified using external standards and their calibration curves.

2.10. Determination of Phenolic Compounds by HPLC Method [23]

Stock standard solutions of 7-hydroxyflavone, gallic acid, quercetin, catechin, and epicatechin gallate (Sigma Aldrich) were dissolved in methanol, the final concentration was 1 mg/mL. Each sample (1 ± 0.2 g) was dissolved in 10 mL methanol–water (80:20, v/v) in a volumetric flask. Extraction was performed on a vortex at room temperature for 1 h. Extracts were filtered through nylon syringe filters with a pore size of 0.45 μm directly into chromatography vials.
HPLC analysis was performed on a Shimadzu LC-40DXR Nexera system equipped with an SCL-40 system controller, SIL-40CXR autosampler, CTO-40C column oven, and an SPD-M40 photo diode array detector (Shimadzu Scientific Instruments, Kyoto, Japan). Chromatographic separation was performed using a Phenomenex Kinetex C18 column (5 μm particle size, 150 mm × 4.60 mm, 100 Å (Phenomenex, USA) with isocratic elution of acetonitrile–0.1% acetic acid (87:13, v/v). The column oven temperature was 22 °C, and the injection volume was 20 μL. The mobile phase was pumped through the HPLC-DAD system at a flow rate of 1 mL/min. Identification of phenolic compounds was performed by comparison of the retention times of obtained peaks with retention times of their chromatographic standards at wavelengths of 272 and 330 nm. Triplicate injections were performed, and average peak areas were used for the peak quantification. Phenolic compounds were quantified with external standards and their calibration curves.

2.11. Statistical Analysis

The obtained results were statistically analyzed using STATISTICA 13.0 software by one-way analysis of variance ANOVA. To determine the significance of the differences between the mean values for example polyphenol content, in particular samples, Tukey’s test was used with a significance level of p = 0.05. Differences at a confidence level of 95% (p ≤ 0.05) were considered statistically significant.

3. Results and Discussion

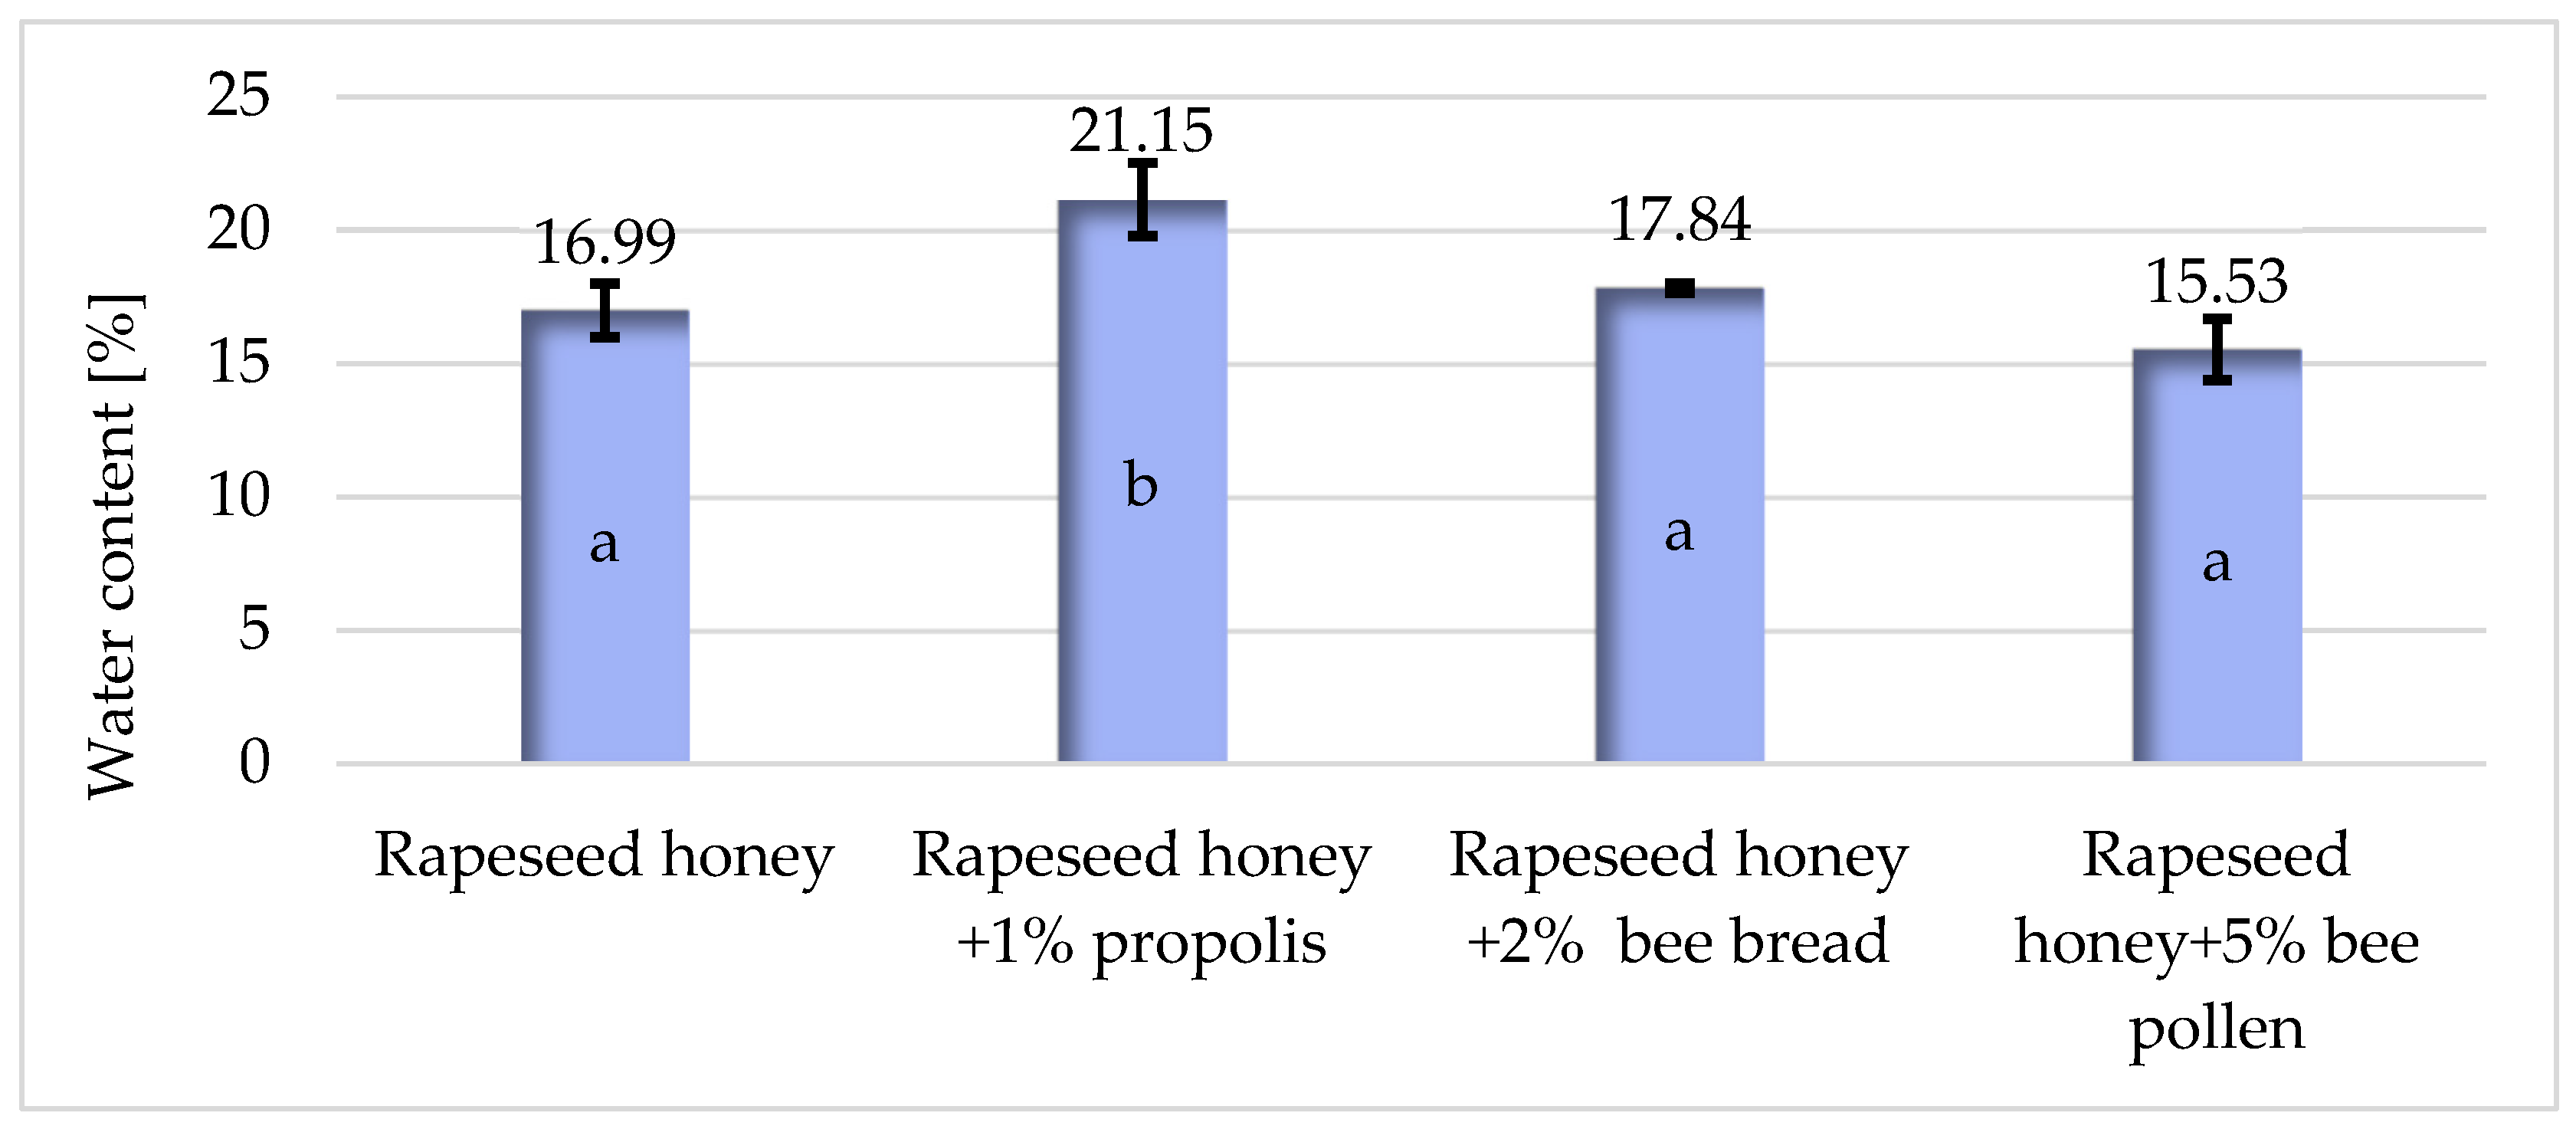
3.1. Water Content in Honeys

The measured water content, depicted in Figure 1 in the examined samples fluctuated within the range of 16.99% to 21.15%. The average water content in the products was 17.88%. Polish legal requirements stipulate that the water content in honey should not exceed 20.00%, with the exception of honeydew and heather honey. Rapeseed honey enriched with 1% propolis exhibited the highest water content, while the lowest was observed in pure rapeseed honey. The elevated water content in honey, attributed to the addition of 1% propolis, may be influenced by the quality of the added propolis, as indicated by Sauri-Duch et al. 2021 [24]. The moisture content in raw propolis, as reported in their study, ranged from 1.96% to 8.26%. Miłek et al., 2023 [16], described that water content in rapeseed honey with 10% of bee bread was between 17.4 and 17.8%, and in honey with 10% bee pollen, it ranged from 16.45% to 17.85% [16].

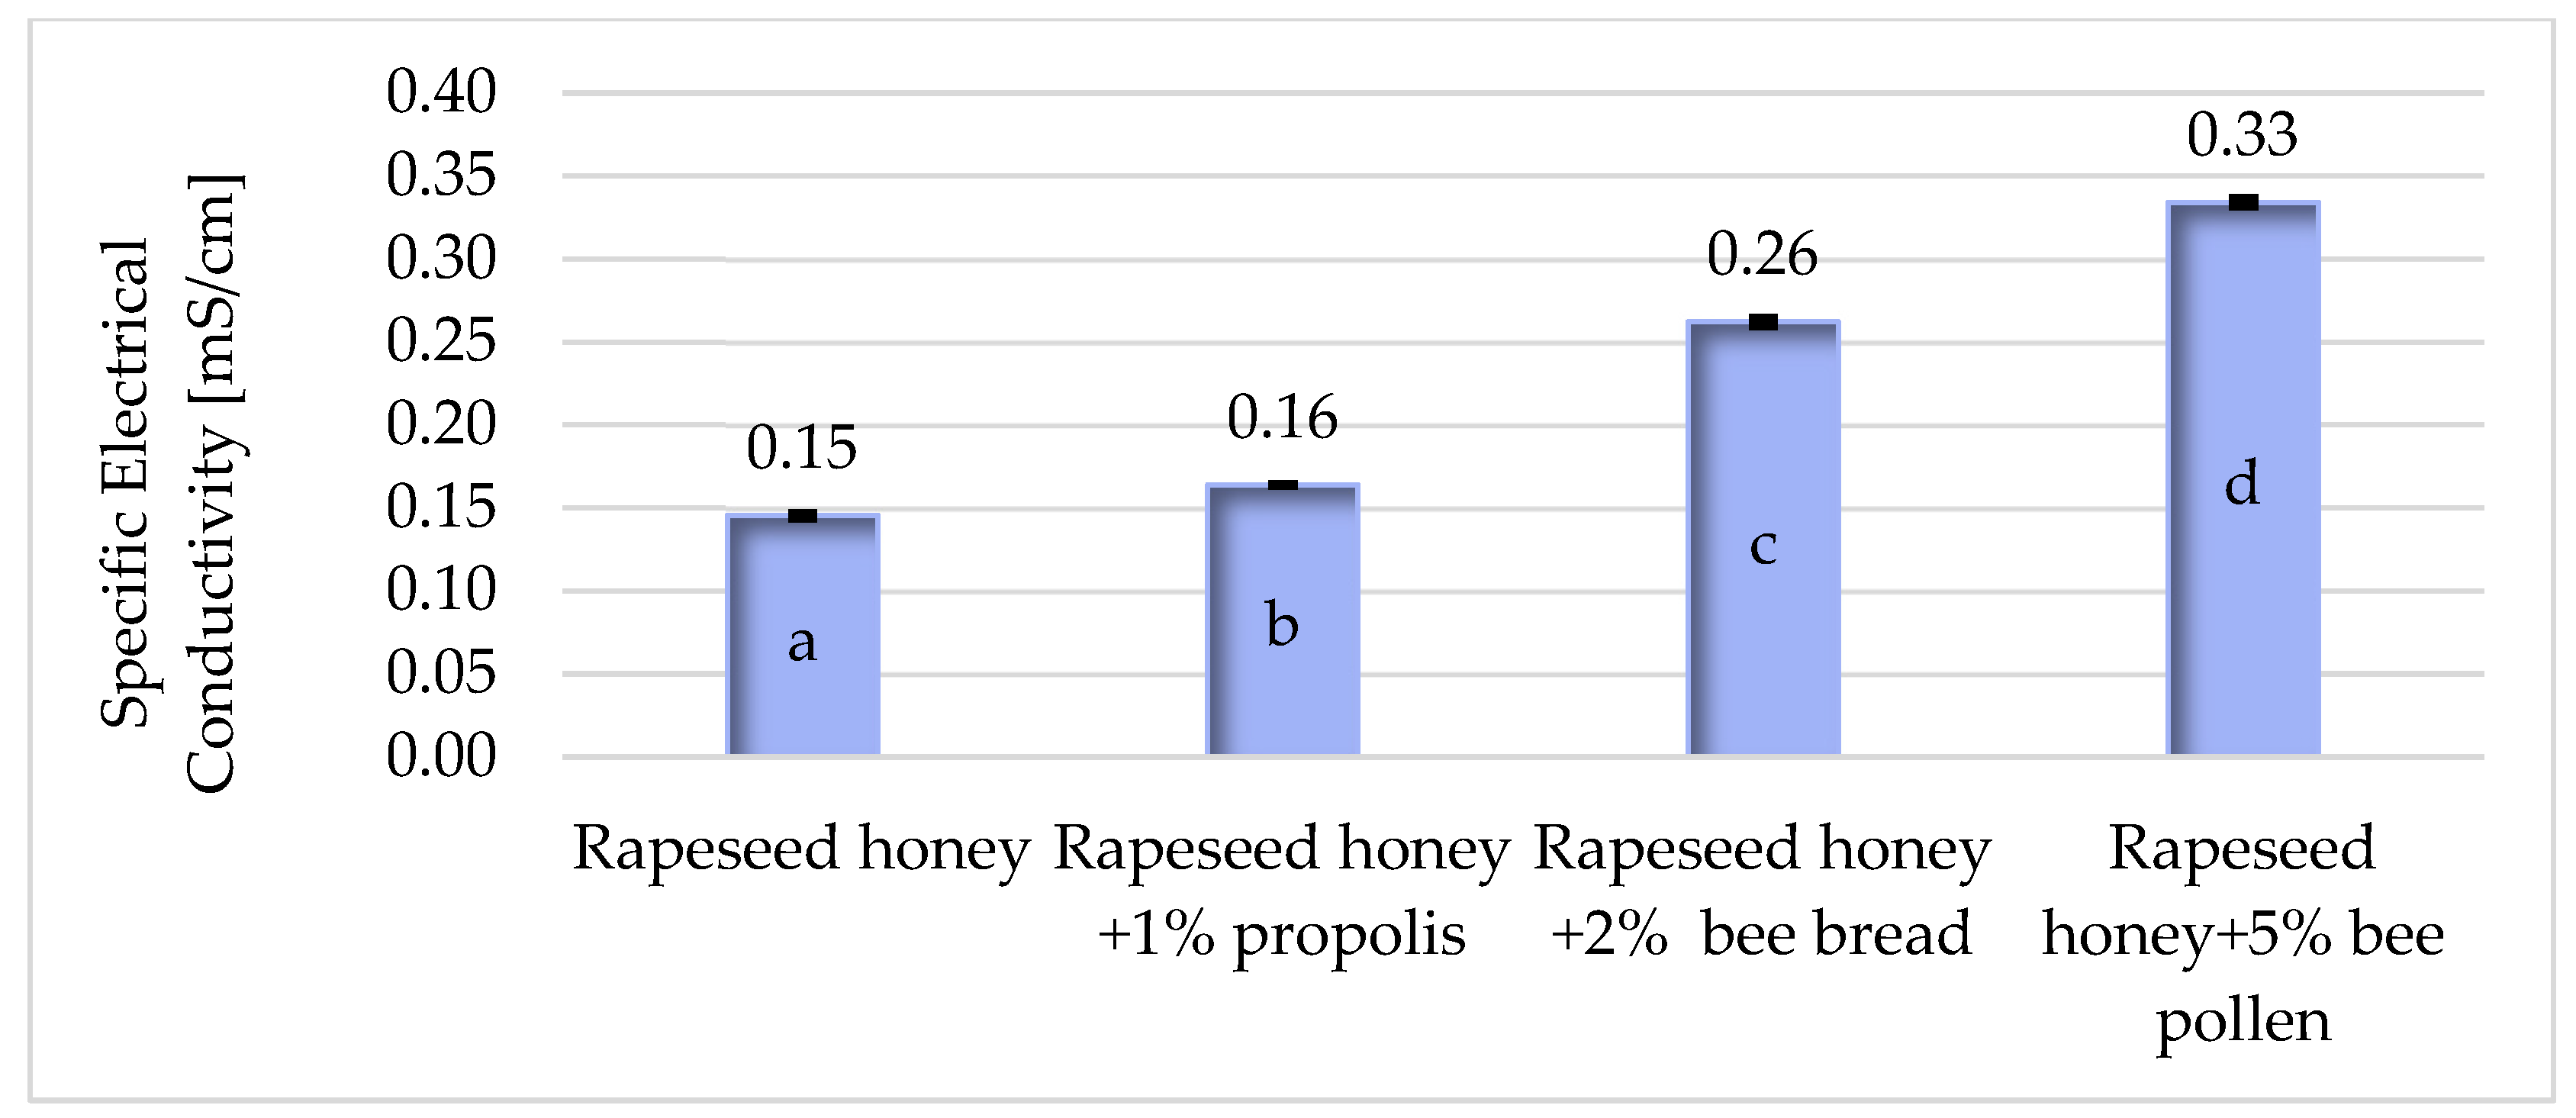
3.2. Determination of the Specific Electrical Conductivity of Honeys

The specific electrical conductivity of honeys primarily depends on the quantity of acids and mineral compounds present in the product. This parameter is used to determine the commercial quality of the analyzed honey [25]. According to this regulation, the specific electrical conductivity of edible honeys should not exceed 0.8 mS/cm, with exceptions for honey mixtures (honeydew honey, chestnut honey, chestnut honeydew honey). In all samples of rapeseed honey and rapeseed honey with additives, this value ranged from 0.15 mS/cm (rapeseed honey) to 0.33 mS/cm (rapeseed honey + 5% bee pollen) (Figure 2).
The results obtained from the conducted analyses, show that all of the products met the specified requirements for honey [25]. In samples from China, the electrical conductivity ranged from 0.13 mS/cm to 0.23 mS/cm, with an average value of 0.17 mS/cm [26]. Majewska and Kowalska 2011 [27], in their study of honey from Warsaw retail stores and directly from beekeepers, obtained a result of 0.10 mS/cm for rapeseed honey [27]. A similar analysis was conducted by Chomaniuk et al. 2016 [28], resulting in the following specific electrical conductivity values for rapeseed honeys: 0.22 mS/cm, 0.17 mS/cm, 0.19 mS/cm, and 0.3 mS/cm [28]. According to Habryka et al. 2020 [15], the addition of 1% of propolis to multifloral honey did not change the specific conductivity value (0.493 mS/cm) in comparison to multifloral honey without propolis (0.500 mS/cm). The specific conductivity in rapeseed honey with a 10% addition of bee pollen was in the range 0.424–0.665 mS/cm, and in honey with a 10% addition of bee bread, it was lower and in the range 0.528–0.537 mS/cm [16].

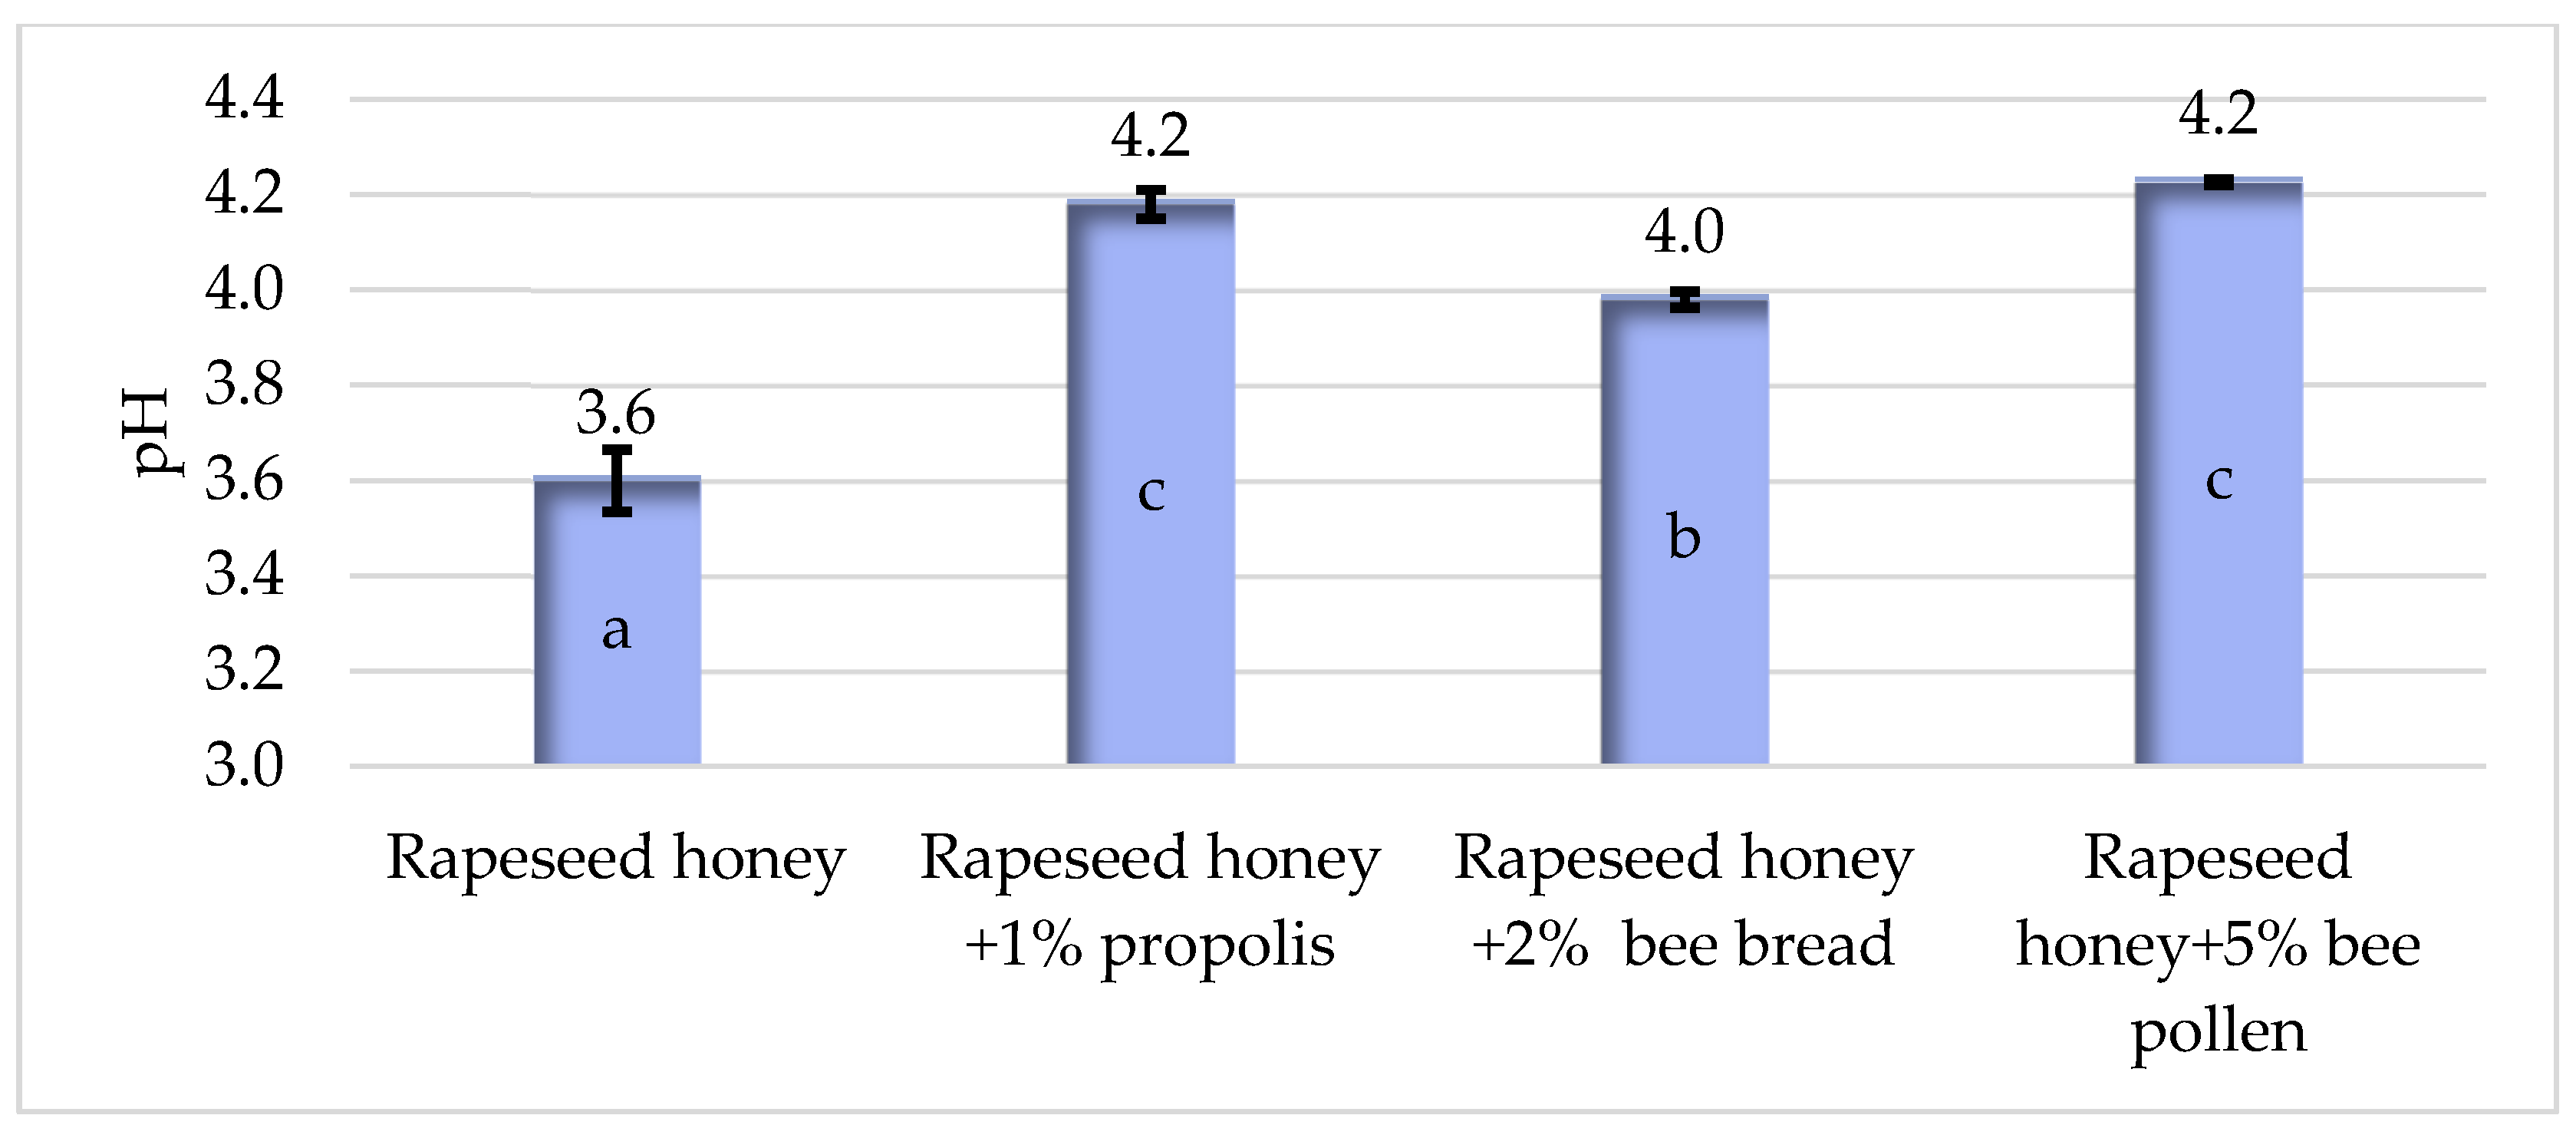
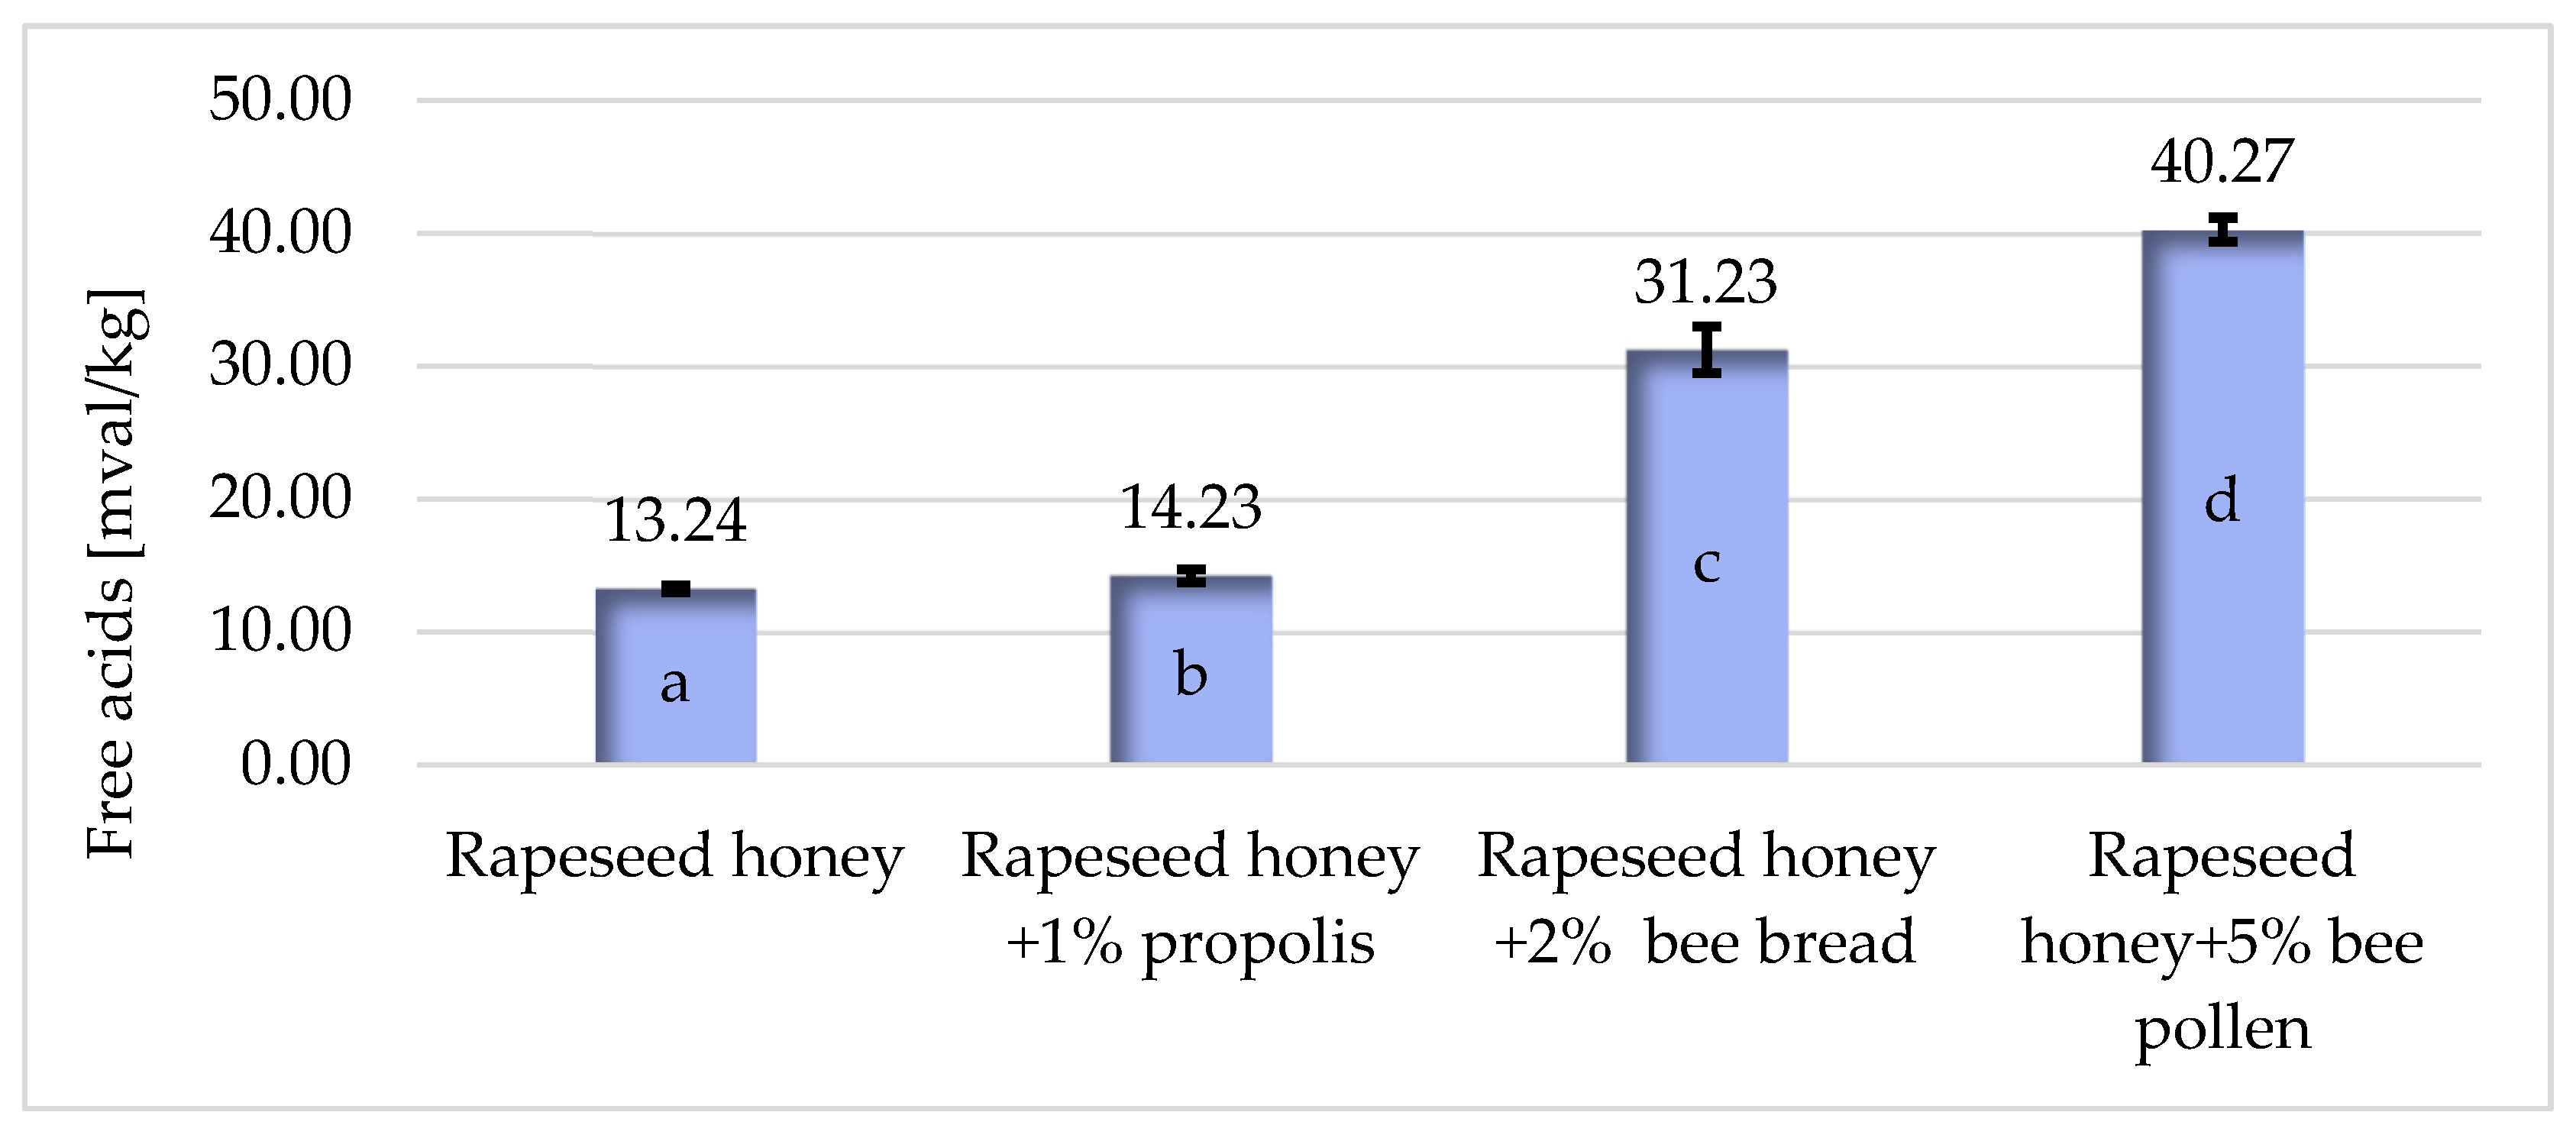
3.3. Determination of pH and Free Acids in Honey

Based on the data presented in Figure 3, it can be observed that rapeseed honey exhibited the lowest pH value at 3.6, while the highest, equally, was observed in rapeseed honey with the addition of propolis (1%) and bee pollen (5%)—both at 4.2. In rapeseed honey with addition of bee bread (2%), the pH value was 4.0. Analyzing the literature data related to rapeseed honey, similar pH values can be reported. In Popek’s research [29] on the acidity of various types of honey, rapeseed honey had a pH level of 3.7. Molenda and Sowińska 2020 [30] obtained a result of 3.6. On the other hand, in a study by Kaczmarek et al. 2019 [31], a greater difference in pH was noticed in the analyzed samples, with a result of 4.22. Zhang et al. 2021 [32] investigated the maturity index of raw rapeseed honey from 29 March to 13 April 2019, obtaining a pH value ranging from 3.5 to 3.7. According to Costa et al. 2017 [33], the pH for bee pollen ranges from 3 to 4. Miłek et al. 2023 [16] reported that after the addition of 10% bee pollen to rapeseed honey, the average pH of the product was lowered and reached 4.35. Moreover, the addition of 10% bee bread to rapeseed honey lowered its pH from 4.25 to 3.96 [16]. These differences can be caused by the quality of the used bee products, e.g., propolis, bee bread, and bee pollen.
The acidity of honey is associated with the amount of free acid present in it and is considered one of the fundamental parameters determining the origin of honey [34]. According to Council Directive 2001/110/EC, dated 20 December 2001, the amount of free acid in honey should not exceed 50 mval/kg [35]. The conducted analysis did not reveal any exceedances, as can be observed in Figure 4. The difference between the free acidity of rapeseed honey with the addition of 2% of bee bread and 5% of bee polen can be caused by the amount of added bee product. Habryka et al. 2020 [15] investigated multifloral honey with the addition of 1% of propolis and found that the free acidity in enriched honey was elevated from 22.87 mval/kg to 30.93 mval/kg (honey + 1% of propolis). Miłek et al. 2023 [16] reported that free acidity in honey with the addition of 10% of bee bread was high, ranging from 99.26 to 97.25 mval/kg. Similarly, high acidity was found in rapeseed honey with the addition of 10% bee pollen, varying from 62.20 to 90.00 mval/kg [16].
Among the examined honeys, rapeseed honey enriched with bee pollen (5%) exhibited the highest acidity, reaching a level of 40.27 mval/kg, while the lowest acidity was found in pure rapeseed honey at 13.24 mval/kg. Rapeseed honey enriched with propolis (1%) recorded a value of 14.23 mval/kg, and with the addition of bee bread (5%), it reached 31.23 mval/kg. The introduction of additional components such as propolis (1%), bee bread (2%), and bee pollen (5%) significantly influenced the acidity of the respective honey. Consequently, these additives may affect the shelf life of rapeseed honeys, as their acidity is significantly lower than that of pure rapeseed honey, also known as the “base” honey. The expiration date for consuming pure rapeseed honey was determined to be 30 June 2025. Rapeseed honey enriched with propolis (1%) exhibited stability until 28 February 2025, while honey with bee pollen (5%) had a consumption expiration date of 24 February 2024. On the other hand, the expiration date for rapeseed honey with the addition of bee bread (2%) was 30 August 2024.

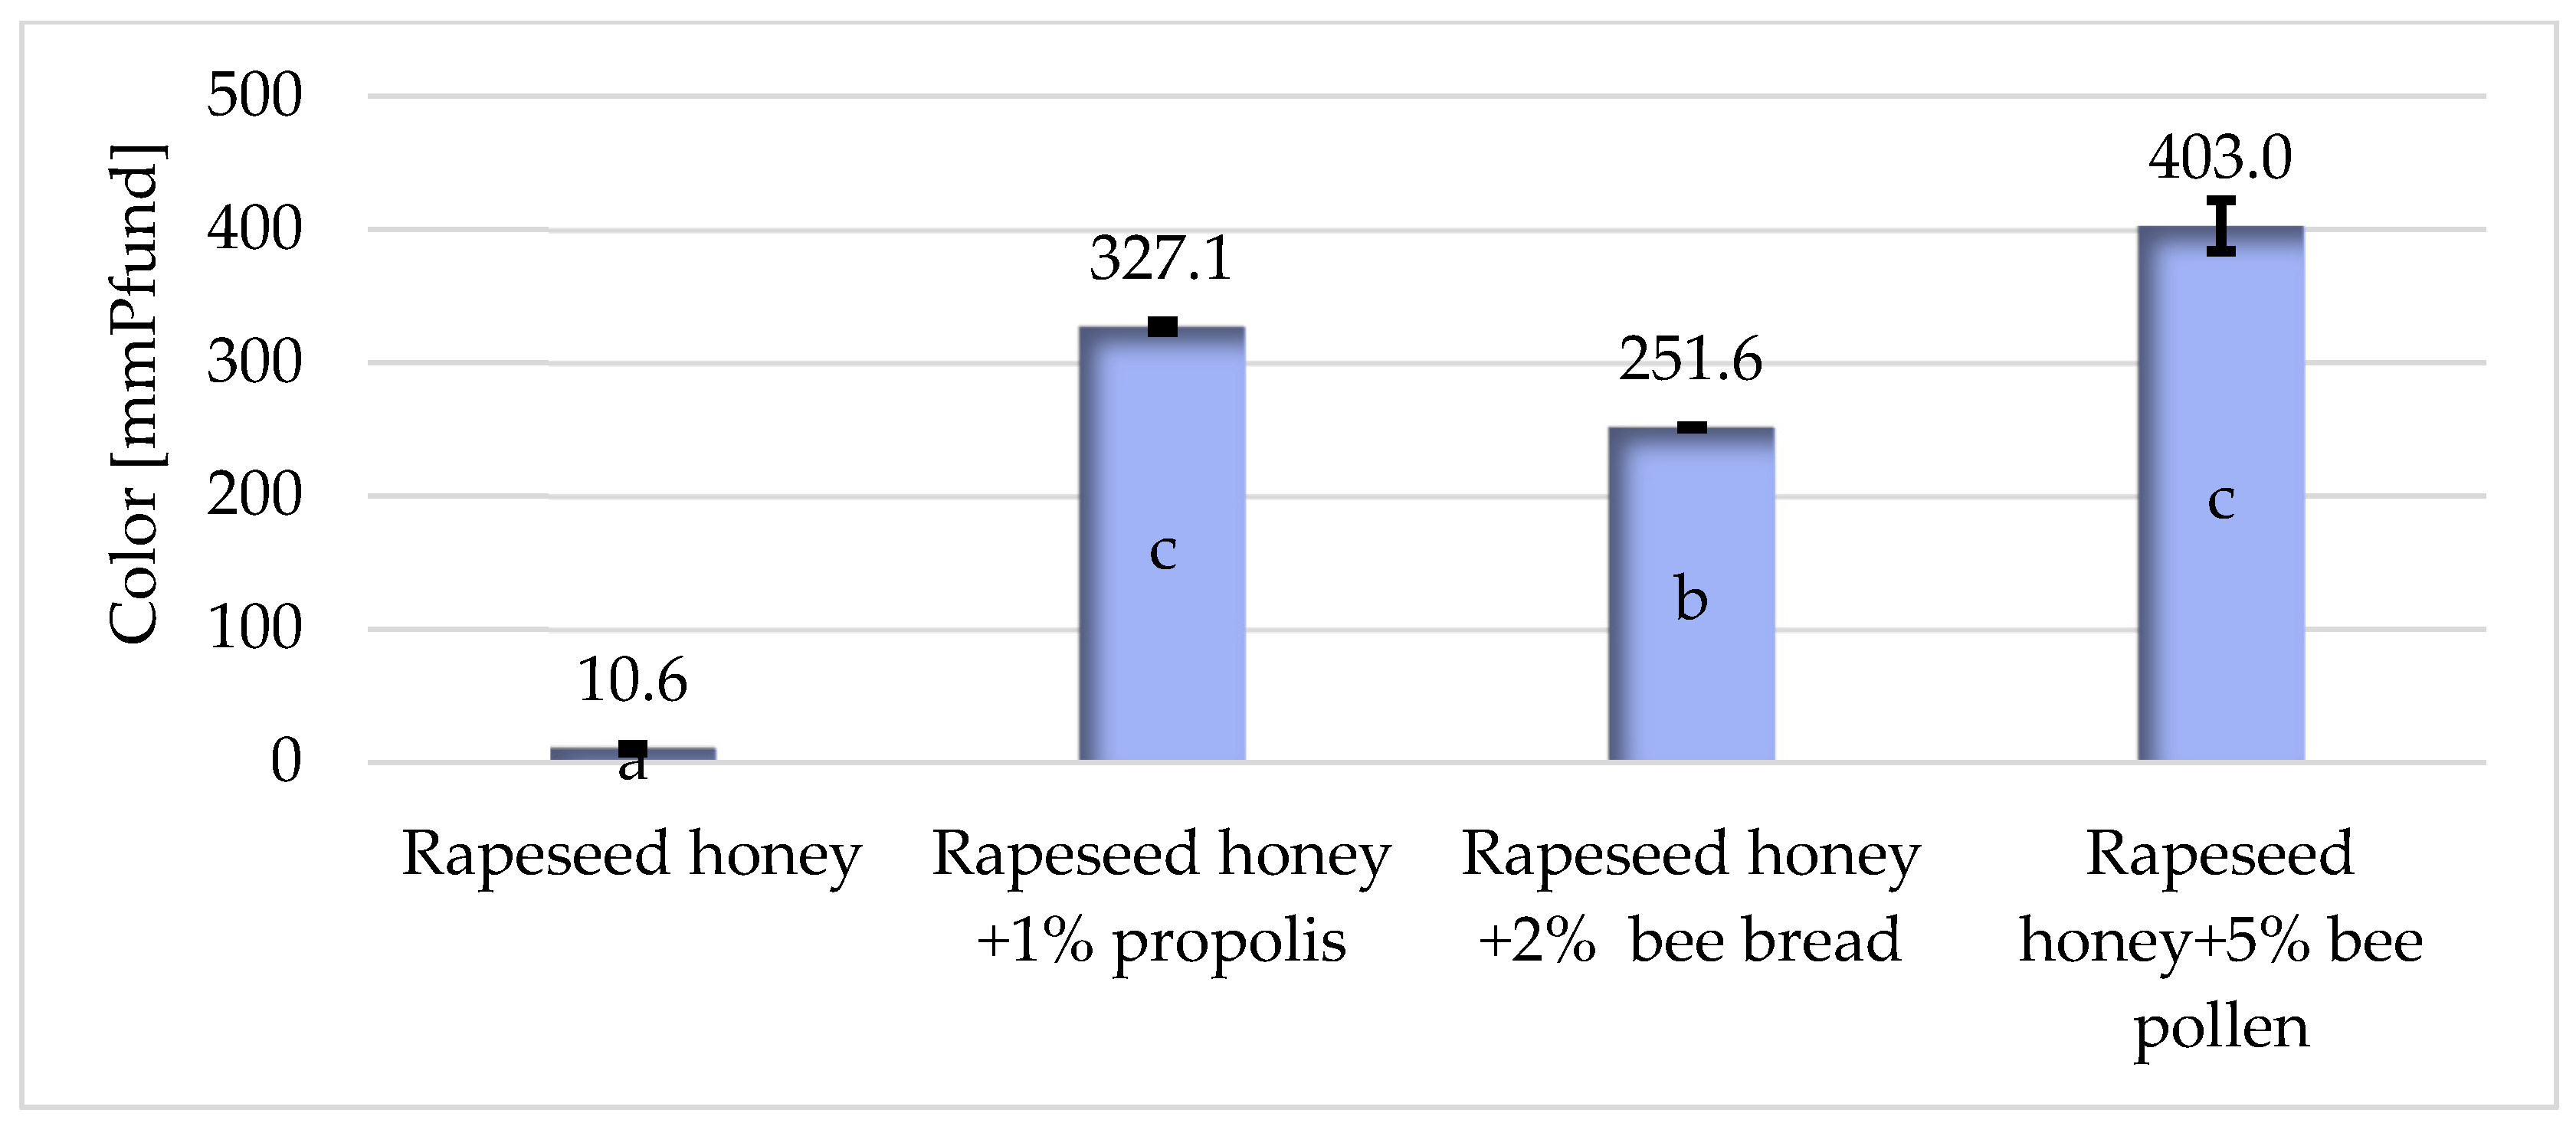
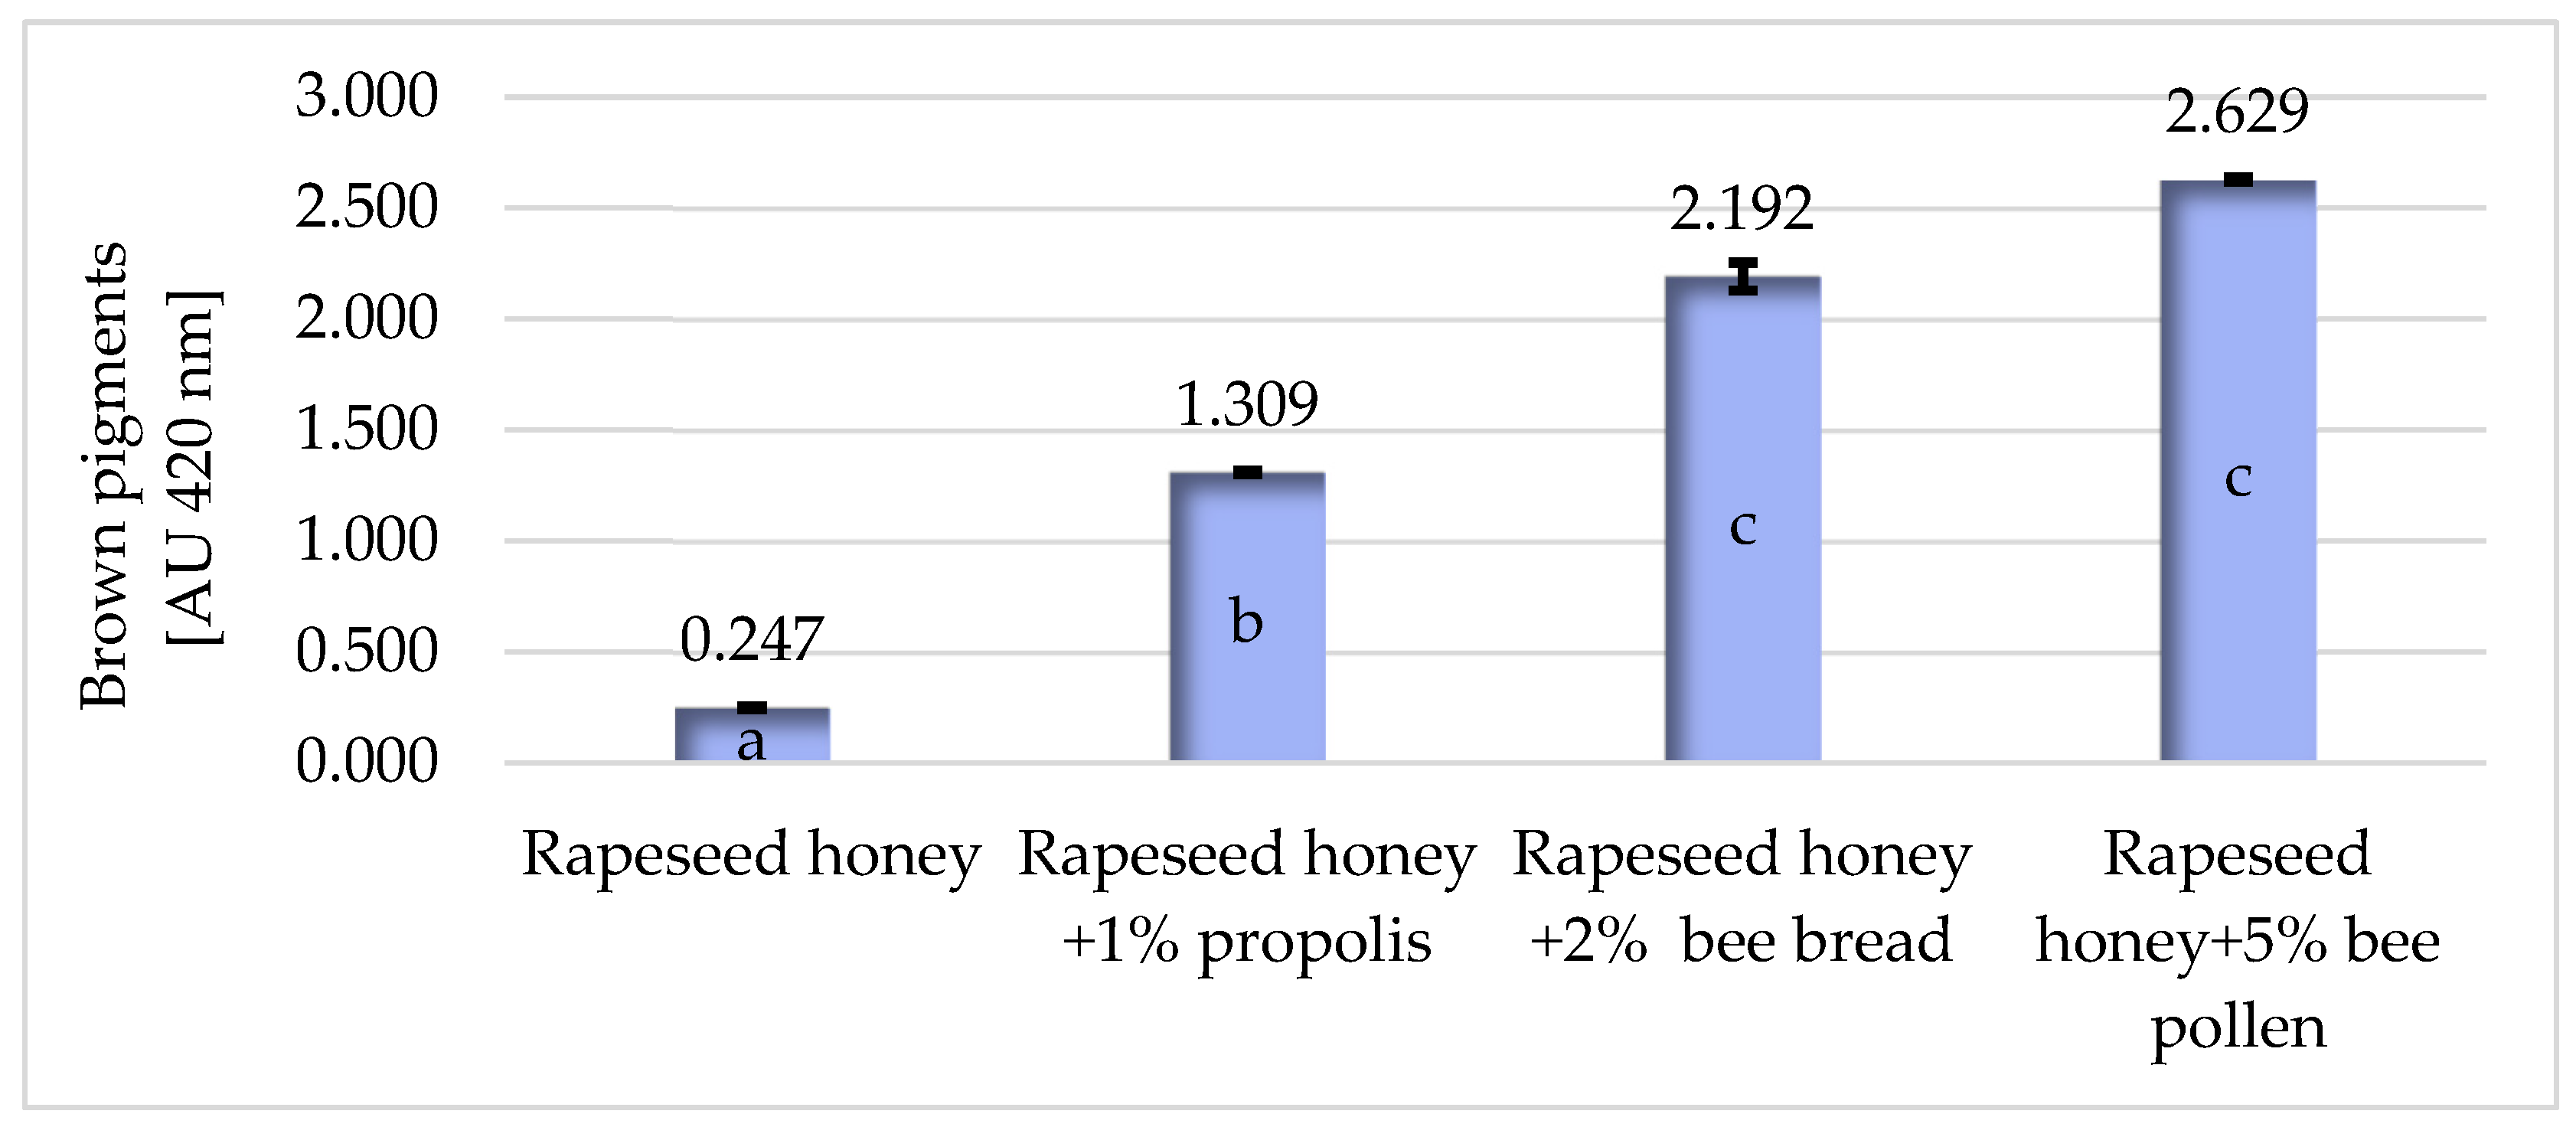
3.4. The Content of Brown Pigments in Honeys and the Color of Honeys

Brown pigments in honey largely contribute to its color. Analyzing the results of the aforementioned indicator, as illustrated in Figure 5, it can be observed that pure rapeseed honey contained the least, with a value of 0.247 AU. On the other hand, rapeseed honey with the addition of bee pollen (5%) had the highest amount of brown pigments, reaching 2.629 AU. This aligns with the observations made in this study, as the sample of pure rapeseed honey appeared to be visually the lightest, while the sample with the addition of bee pollen (5%) appeared to be the darkest. The values of brown pigment content in the remaining samples, namely rapeseed honey with the addition of propolis (1%) and bee bread (2%), fell in the ranges mentioned above. Rapeseed honey with the addition of propolis (1%) achieved a result of 1.309 AU, while rapeseed honey with the addition of bee bread (2%) recorded a result of 2.192 AU (Figure 5). These observations lead to one conclusion: the higher the amount of bee product added, the higher the value of brown pigments. Bath and Singh 1999 [36], analyzing eucalyptus and sunflower honeys, obtained brown pigment content levels of 0.611 AU and 0.683 AU, respectively. In the honeys examined by Boonchiangma et al. 2011 [37] from Thailand, the results ranged from 0.192 AU to 0.675 AU. Factors influencing the observed variations in results include the botanical origin of the honey, its country of origin, geographical region, climatic conditions, harvest time, and the content of pigments imparting color, such as carotenoids [37].
The color index of the examined honeys, presented in Figure 6 on the Pfund scale, ranged from 10.6 mm for pure rapeseed honey to 403.0 mm for rapeseed honey with the addition of bee pollen (5%). For the remaining honeys, namely rapeseed honey with the addition of bee bread (2%) and rapeseed honey with the addition of propolis (1%), the color index was 251.6 mm and 327.1 mm Pfund, respectively (Figure 6). These values indicate significant variations in color, with the addition of bee pollen resulting in the darkest hue among the examined samples.
In the study by Puścion-Jakubik et al. [38], rapeseed honey yielded results ranging from 17.5 to 125.6 mm Pfund. Popek et al. 2003 [29] obtained a value of 59.3 mm Pfund for rapeseed honey. Bodor et al. 2021 [39] investigated six samples of rapeseed honeys from the European Union and obtained Pfund values ranging from 2.1 to 138.6 mm. These findings highlight the variability in color among different rapeseed honey samples. The obtained results of the statistical analysis indicate that the addition of both bee pollen at a concentration of 5%, propolis at a concentration of 1%, and bee bread at a concentration of 2% to rapeseed honey resulted in a significant change in the color of the respective honey.

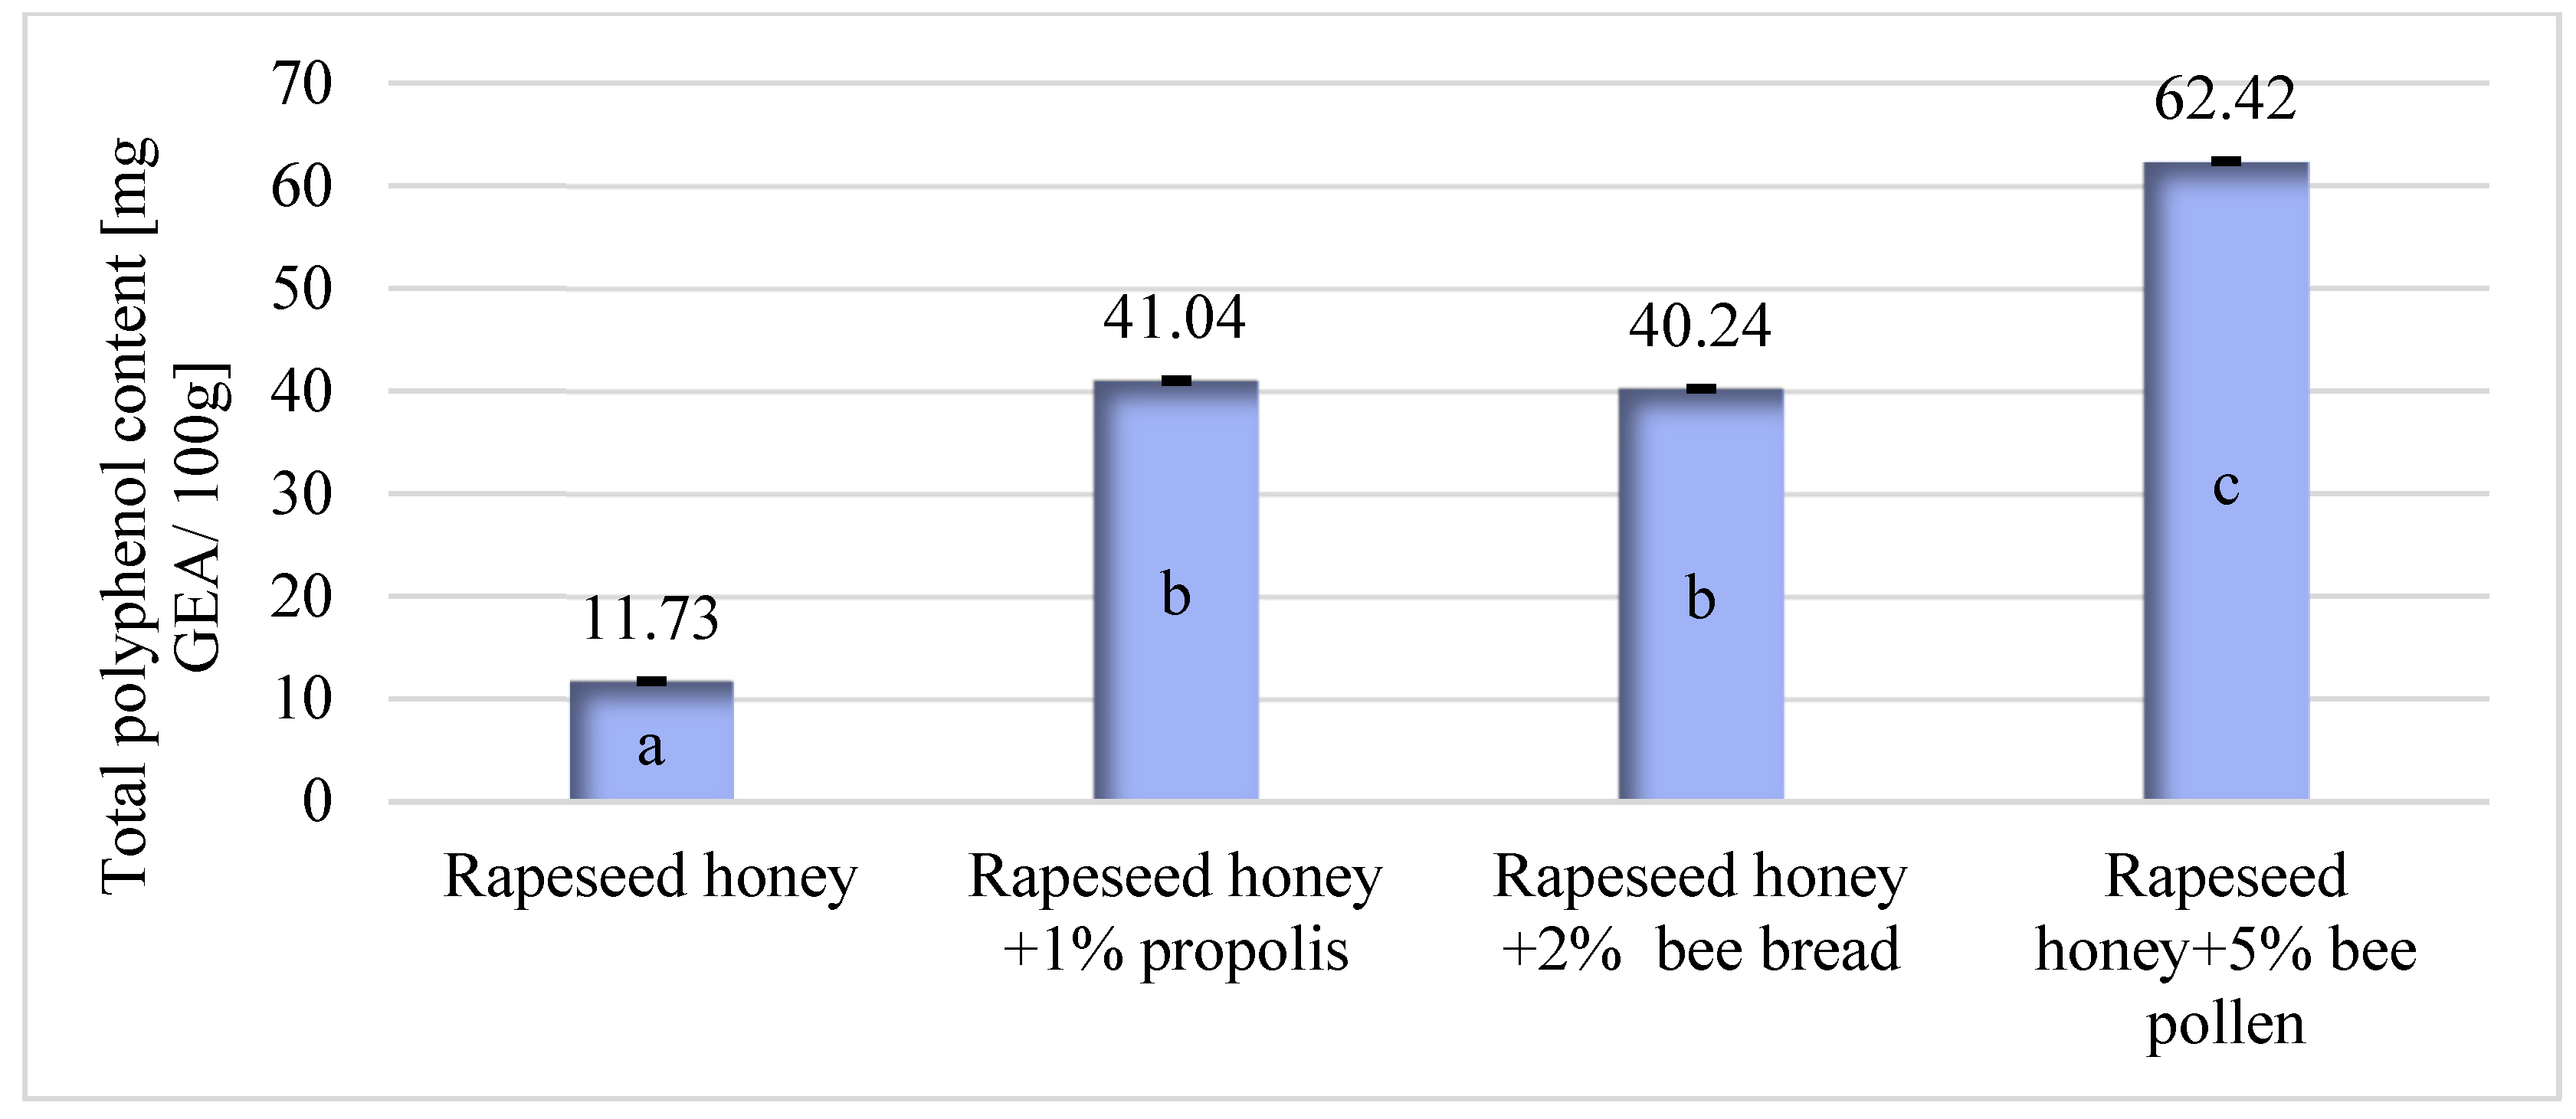
3.5. The Total Polyphenol Content (Microplate Spectrophotometric Method)

The determination of total polyphenol content in the examined products revealed that their values varied between 11.73 mg GEA/100 g honey (rapeseed honey) and 62.42 mg GEA/100 g honey (rapeseed honey with 5% added bee pollen). The other samples on the graph (Figure 7) exhibited a similar amount of polyphenols, namely 40.24 mg GEA/100 g honey (rapeseed honey with 2% added bee bread) and 41.04 mg GEA/100 g honey (rapeseed honey with 1% added propolis). Similar observations were presented by Habryka et al. 2020 [15]. The addition of 1% of propolis to multifloral honey led to a fourfold higher concentration of total polyphenols in fortified multifloral honey—133.6 GEA/100 g (while in honey without propolis, the content was 30.75 GEA/100 g). In rapeseed honey with the addition of 10% of bee bread, the total polyphenol content ranged from 80.43 to 88.91 GEA/100 g, and was about five times higher than in control samples. In rapeseed honey with the addition of 10% of pollen the total polyphenol content was between 97.92 and 124.37 GEA/100 g, and about seven times higher than in control samples [16]. Kowalski and Makarewicz 2017 [12] reported the influence on antioxidant properties of bee bread and/or propolis to lime honey. After the addition of 5% of bee bread to lime honey, the total content of polyphenols was 42.94 mg GEA/100 g, and in the sample with addition of 1% of propolis, the TPC was 115.51 mg GEA/100 g (control samples was 36.00 mg GEA/100 g). It was stated that the most significant influence on antioxidant properties was bee bread [12].
The total polyphenol content in multifloral honeys enriched with bee bread, examined by Socha et al. 2018 [40], ranged from 73.51 to 138.15 mg GEA/100 g honey. In contrast, the same honey without enrichment exhibited polyphenol contents ranging from 41.66 to 55.54 mg GEA/100 g honey. This emphasizes the substantial impact of bee bread enrichment on the polyphenol content, aligning with findings in our study where rapeseed honey enriched with 2% bee bread showed an increased total polyphenol content of 40.24 mg GEA/100 g honey.

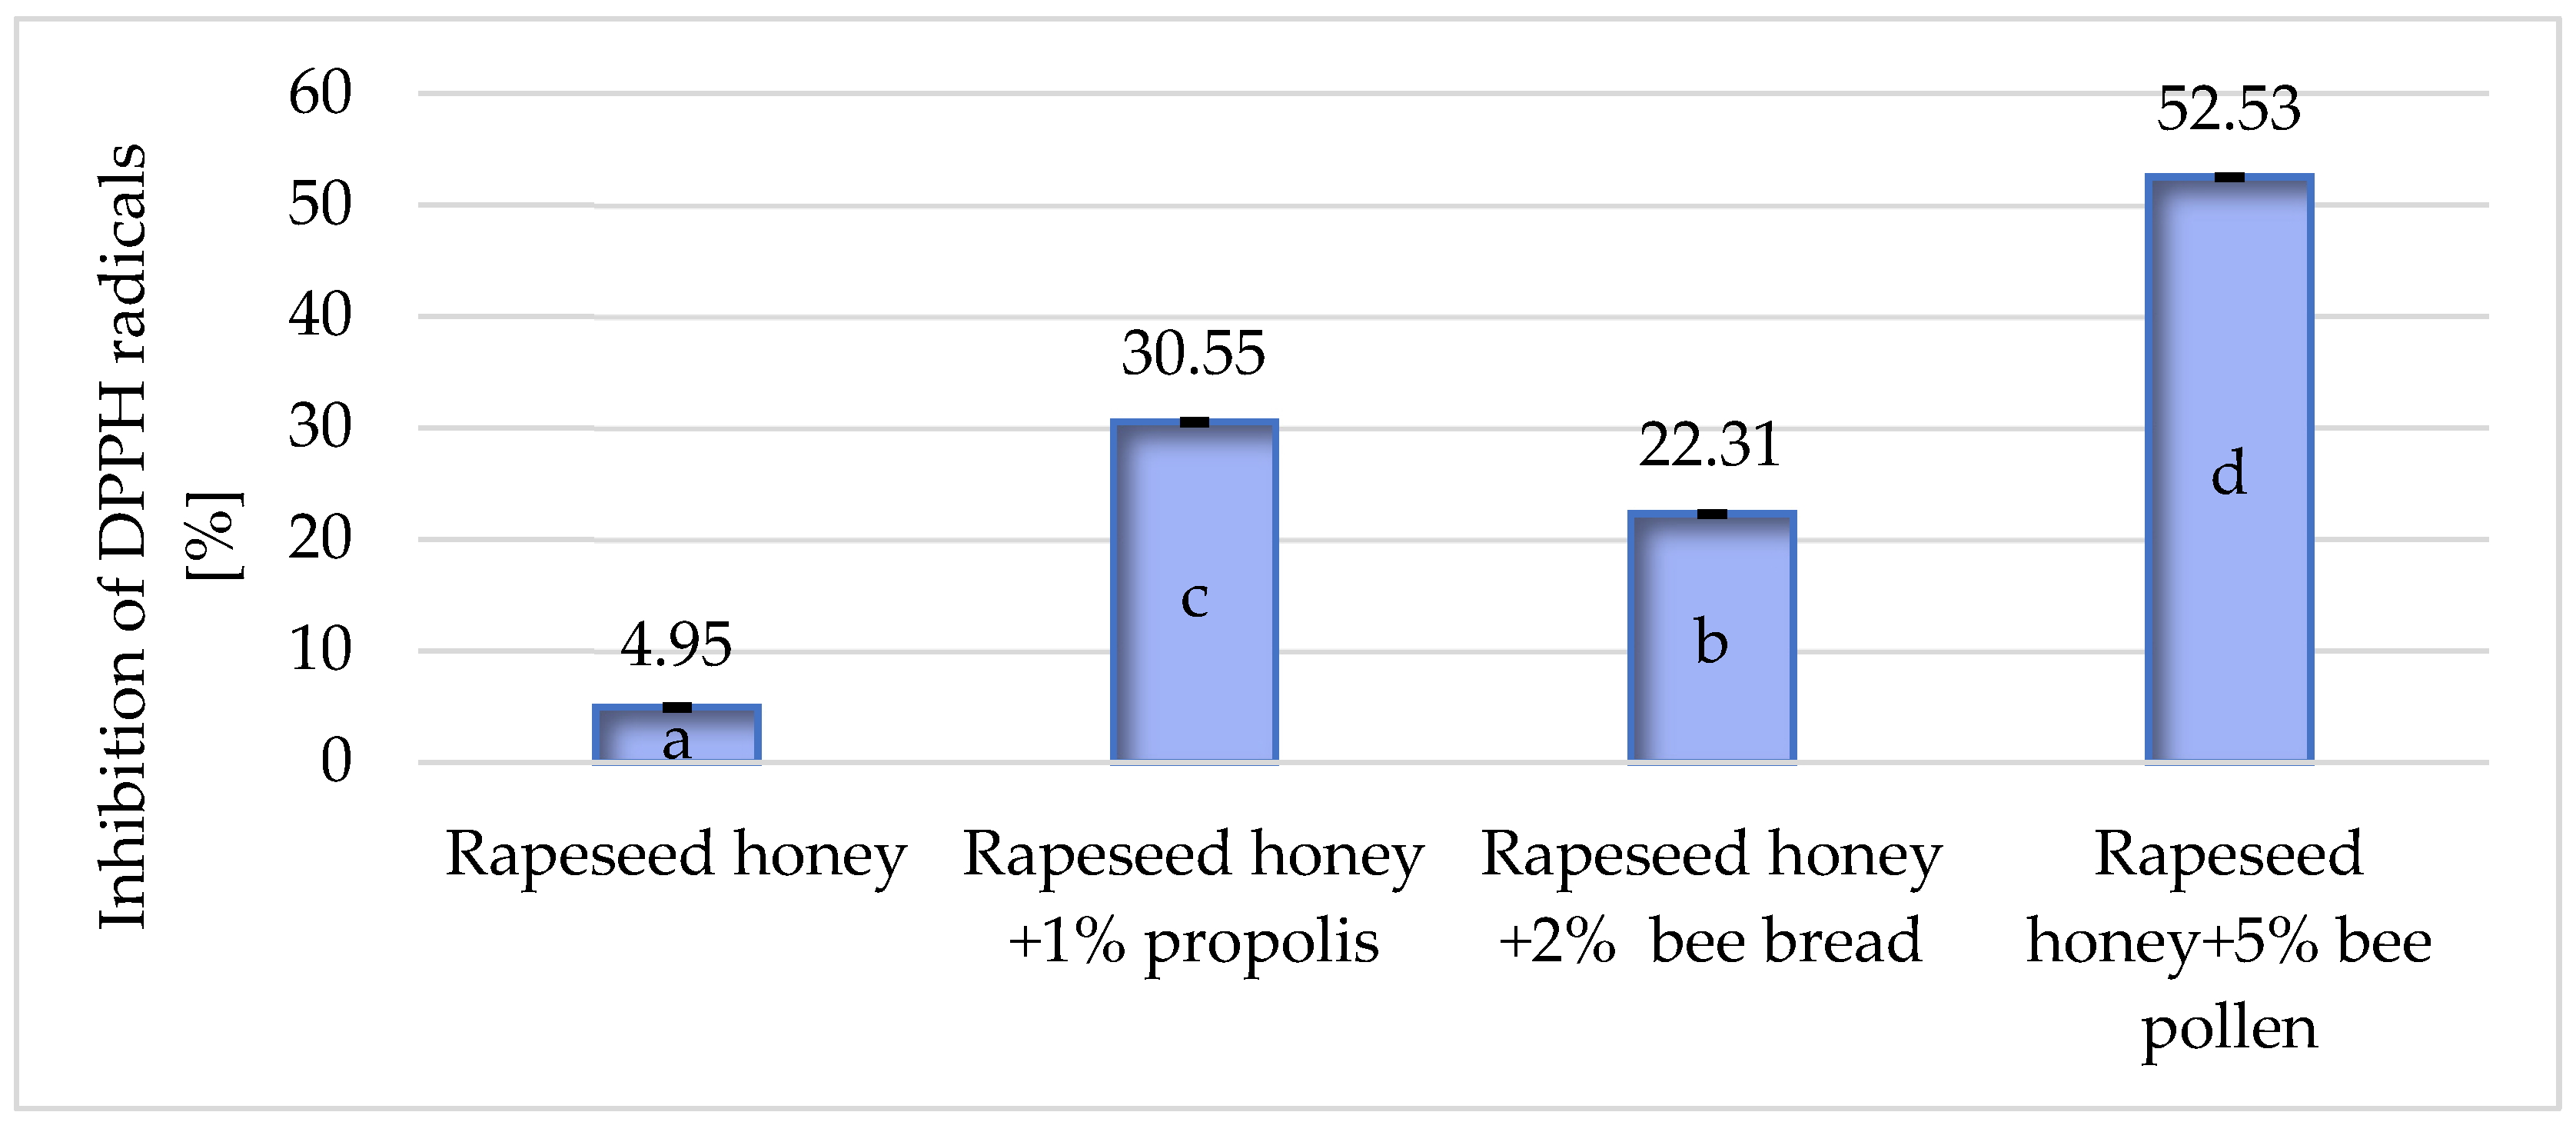
3.6. Antioxidant Capacity of Honeys

The extract from plain rapeseed honey exhibited the lowest ability to scavenge 2,2-diphenyl-1-picrylhydrazyl (DPPH) radicals among all extracts prepared from the analyzed honeys, reaching only 4.95%. Extracts from rapeseed honey enriched with bee bread (2%) showed a 22.31% ability to scavenge free DPPH radicals, while extracts based on rapeseed honey with the addition of 1% propolis reached a level of 30.55%. The highest value was observed in the extract from rapeseed honey with added bee pollen (5%), showcasing a remarkable ability to scavenge DPPH radicals at 52.53%, as depicted in Figure 8. Unfortunately, the least effective product in terms of scavenging free radicals, in this case, DPPH radicals, was plain rapeseed honey without any additives.
In a study by Tomczyk et al. 2019 [41], examining rapeseed honeys from both Poland and other European Union member countries, the ability to scavenge DPPH radicals extracts from Polish honeys reached values of 21.21%, while for Slovak samples, it was 11.76%. Puścion-Jakubik et al. 2022 [38], using water extracts of rapeseed honeys, obtained a result of 48.00% for determining the inhibition of DPPH radicals. Similar values for the ability to scavenge DPPH radicals for extracts obtained based on rapeseed honeys were obtained by Wilczyńska 2013 [42], ranging from 27.00% to 82.20%. Socha et al. 2016 [43] conducted analyses to investigate the effect of propolis addition on antioxidant capacity against DPPH radicals, using multifloral honeys and multifloral honeys enriched with propolis in amounts of 0.88% and 1% [43]. The values obtained for multifloral honey ranged from 5.56% to 24.41%. For samples enriched with propolis, the following values were obtained: addition of 0.88% of propolis—26.50%, addition of 1% of propolis—88.33%. Enriching multifloral honey with propolis significantly increased the antioxidant activity of the tested honeys. A similar study conducted two years later by Socha et al. 2018 [40] investigated multifloral honeys with the addition of bee bread in amounts of 10% (producer 1) and 20% (producer 2). The tested samples exhibited the following results regarding the ability to reduce free DPPH radicals: producer 1—plain multifloral honey 17.71%, enriched multifloral honey (10%)—77.50%, producer 2—plain multifloral honey 5.65%, and multifloral honey with bee bread (20%) 51.39%. After enriching the honeys, their antioxidant activity increased fivefold for the honeys from producer 1 (similar to the analyzed samples in this study), and tenfold for the honeys from producer 2.

3.7. Sugar Content in Honeys

The concentrations of fructose, glucose, and sucrose in all honeys are presented in Table 1. Among the analyzed samples, glucose and fructose emerged as the predominant carbohydrates. The mean glucose content ranged from 31.7% (rapeseed honey + 5% of bee pollen) to 34.3% (rapeseed honey + 2% of bee bread), with no significant differences observed (p ≤ 0.05). The fructose content in samples varied from 36.4% (rapeseed honey) to 37.5% (rapeseed honey + 1% of propolis). This variation is likely attributed to the sugar composition in propolis. According to Qian et al. 2008 [44], the sucrose, glucose, and fructose content in Bulgarian propolis was reported as 11.32%, 13.49%, and 16.36%, respectively. Another sugar composition is reported for bee pollen; for example, in Romanian bee pollen, the content of sucrose, glucose, and fructose was as follows 17.8; 11.0, and 16.0%, respectively [43].
Pauliuc et al. 2020 [23] reported a contrasting trend, discovering fructose content in rapeseed milk at 35.26% and glucose content at 31.78%. The combined glucose and fructose content ranged from 68.3% in rapeseed honey with the addition of 5% of bee pollen to 71.5% in rapeseed honey with addition of 2% of bee bread. No significant differences were observed in the values of fructose, total glucose, and fructose among the investigated samples. All honeys exhibited a total content of glucose and fructose values exceeding 60 g/100 g, complying with EU regulations Council Directive 2001/110/EC [35]. The fructose-to-glucose ratio ranged from 0.87 (rapeseed honey with the addition of 5% of bee pollen) to 0.93 (plain rapeseed honey). According to Kędzia, propolis has a negligible sugar content. This characteristic, combined with a minimal propolis addition, results in an absence of significant alterations in saccharide content with an increasing propolis addition [45]. Alvarez-Suarez et al. [46] noted that the fructose/glucose ratio could impact honey’s flavor, as fructose is sweeter than glucose. Higher F/G ratios result in more fluid honey that remains liquid for a longer duration [47]. The sucrose content in all tested honeys was 2.1%, adhering to the UE legislation limits of 5 g/100 g for honeys [35]. Other researchers [23] similarly reported values below the established limits for rapeseed honey. In summary, the conducted research indicates that the addition of bee pollen, propolis, or bee bread did not increase the sugar content in rapeseed honey.

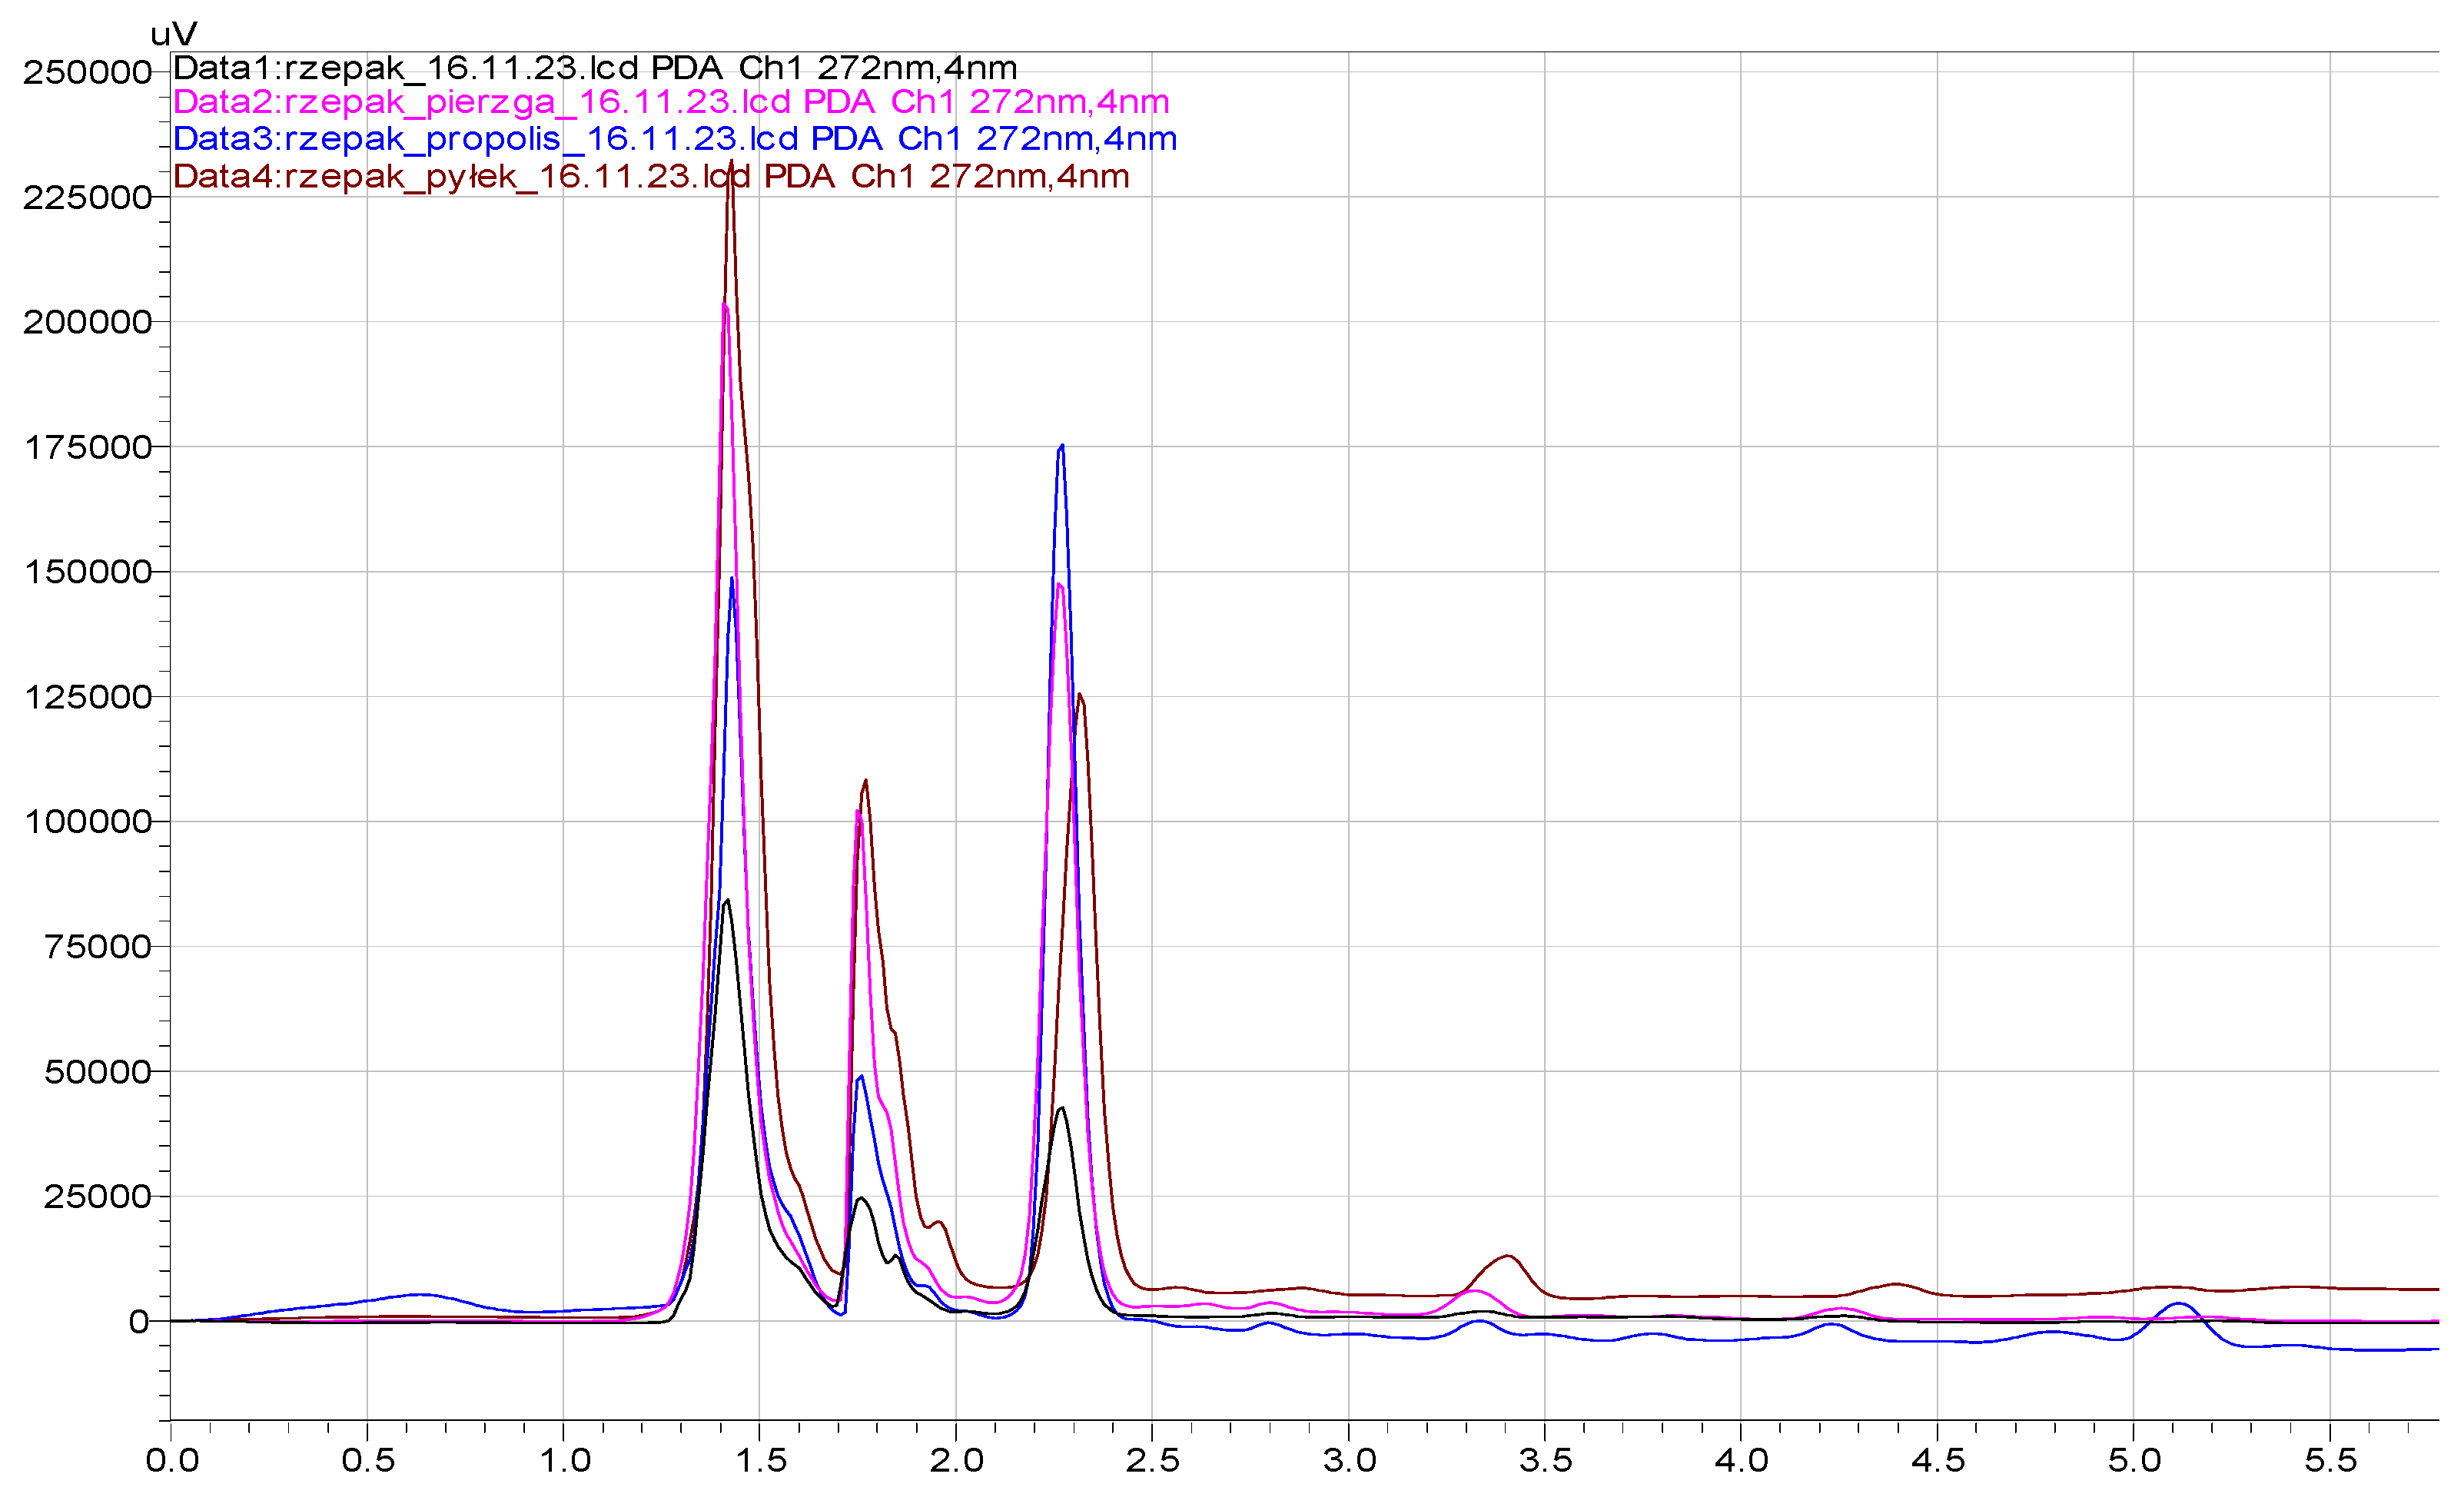
3.8. Phenolic Compounds Content

The HPLC analysis of the investigated products, as presented in Table 2 and Figure 9, revealed the presence of five different phenolic compounds as follows: kaempferol, gallic acid, quercetin, catechin, and epicatechin. In all rapeseed honey samples with the additon of bee product, the total content was elevated approximately threefold. Phenolic compounds in honey significantly contribute to its overall bioactivity, reflecting the honey’s quality and influencing its color, sensory characteristics, and antioxidant activity [48].
Among the compounds studied, kaempferol, gallic acid, and quercetin were identified in all the samples. Notably, kaempferol exhibited a higher concentration in honey with an added 5% of bee pollen, while the lowest value was identified in base rapeseed honey. Gallic acid content was the lowest in pure rapeseed honey, with the highest observed in honey with an added 5% of bee pollen. Gallic acid is frequently identified in natural honeys [49], with studies by Yao et al. 2005 [50] emphasizing its prevalence as the predominant acid in natural honey and its potential as a marker for honey origin.
Quercetin, a widely distributed flavonoid in food and natural honeys, displayed the highest level in rapeseed honey with added propolis, while the lowest value was identified in pure rapeseed honey. Although the quercetin values in the studied honeys were higher than those reported by Pauliuc et al. 2020 [23], they were consistent with values reported by Socha et al. 2011 [51]. Habryka et al. 2020 [15] also found high amounts of quercetin in multifloral honey with the addition of 1% of propolis (0.217 mg/100 g) and gallic acid (2.494 mg/100 g), while in honey without the addition of propolis, the amounts were 0.04 and 0.217 mg/100 g, respectively [15].
Also, the kaempferol content increased in honey after the addition of propolis; in honey with the addition of 1% of propolis, kaempferol content was 0.336 mg/100 g and was sevenfold higher than in pain multifloral honey [15]. In our study, the addition of 1% of propolis to rapeseed honey caused a twofold increase in the concentration of kaempferol.
Catechin was found exclusively in two types of honey: rapeseed honey with an added 5% of bee pollen and 1% of bee bread. Epicatechin was identified solely in rapeseed honey with an added 1% of propolis.
Phenolic phytochemicals in honey are vital aromatic secondary metabolites derived from plants, including nectar or honeydew collected by bees, as well as pollen or propolis [50]. Based on the conducted research, it can be concluded that the addition of other bee products (bee pollen, propolis, and bee bread) to honey increases the content of phenolic compounds.
Comparing the total polyphenol content determined by the spectrophotometric method and the content of phenolic compounds determined by the HPLC method, it can be observed that in the first method, the highest content of polyphenols was reported in rapeseed honeys with the addition of 5% of bee pollen, while the results of the second method do not confirm such high amounts of phenolic compounds. Such an observation can be seen due to the fact that the Folin–Ciocalteu method is known as a method for determining the total amount of polyphenols in a sample; however, many compounds such as reducing sugars, aromatic amines, thiols, SO2, ascorbic acid, some organic acids, polyhydric alcohols, ions of iron, manganese, and copper cause numerous interferences. It suggests that the above-mentioned compounds can be mainly found in bee bread. Therefore, the method should be considered as another approach for determining the reducing capacity of the sample [52].

4. Conclusions

A comparative analysis of rapeseed honeys enriched with 1% propolis, 2% bee bread, and 5% bee pollen indicates that the aforementioned additives do not exert a statistically significant influence on characteristics such as water content (with the exception of the 1% propolis addition) and sugar content in the investigated rapeseed honeys. However, these additives significantly impact qualitative attributes of honeys, including electrical conductivity, pH, free acid content, pigments, color, total polyphenol content (Folin–Ciocalteu method), and the ability to scavenge free DPPH radicals.
The addition of bee products results in a substantial increase in polyphenolic compound content in the honeys (the highest amount of polyphenols characterizes rapeseed honey enriched with 5% bee pollen, followed by rapeseed honey with 1% propolis, and then rapeseed honey with 2% bee bread). Rapeseed honeys enriched with bee products exhibit an enhanced capacity to scavenge free DPPH radicals (the highest activity is observed in rapeseed honey with 5% bee pollen, followed by rapeseed honey with 1% propolis and rapeseed honey with 2% bee bread).
In summary, rapeseed honeys enriched with bee products, particularly with 5% bee pollen, should be recommended for more frequent consumption than rapeseed honeys without additives, especially when compared to plain rapeseed honey.

Author Contributions

Conceptualization, D.D.; methodology, D.D. and E.M.; software STATISTICA 13.0, D.D. and E.M.; validation, D.D.; formal analysis D.D.; investigation, P.P. and E.M.; resources D.D.; data curation, D.D., E.M. and P.P.; writing—original draft preparation, D.D., E.M. and P.P.; writing—review and editing, D.D.; visualization, D.D.; supervision, D.D. All authors have read and agreed to the published version of the manuscript.

Funding

This research received no external funding.

Institutional Review Board Statement

Not applicable.

Informed Consent Statement

Not applicable.

Data Availability Statement

The data presented in this study are available on request from the corresponding author. The data are not publicly available due to privacy.

Conflicts of Interest

The authors declare no conflicts of interest.

References

  1. Anklam, E. A review of the analytical methods to determine the geographical and botanical origin of honey. Food Chem. 1998, 63, 549–562. [Google Scholar] [CrossRef]
  2. Almasaudi, S. The antibacterial activities of honey. Saudi J. Biol. Sci. 2021, 28, 2188–2196. [Google Scholar] [CrossRef]
  3. Brar, D.S.; Pant, K.; Krishna, R.; Kaur, S.; Rasane, P.; Nanda, V.; Saxen, S.; Gautam, S. A comprehensive review on unethical honey: Validation by emerging techniques. Food Control 2022, 145, 109482. [Google Scholar] [CrossRef]
  4. Machado De-Melo, A.A.; Almeida-Muradian, L.B.D.; Sancho, M.T.; Pascual-Maté, A. Composition and properties of Apis mellifera honey: A review. J. Apic. Res. 2018, 57, 5–37. [Google Scholar] [CrossRef]
  5. da Silva, P.M.; Gauche, C.; Gonzaga, L.V.; Costa, A.C.O.; Fett, R. Honey: Chemical composition, stability, and authenticity. Food Chem. 2016, 196, 309–323. [Google Scholar] [CrossRef]
  6. Wang, J.; Li, Q.X. Chapter 3-Chemical Composition, Characterization, and Differentiation of Honey Botanical and Geographical Origins. In Advances in Food and Nutrition Research; Taylor, S.L., Ed.; Academic Press: Cambridge, MA, USA, 2011; Volume 62, pp. 89–137. [Google Scholar]
  7. Young, G.W.Z.; Blundell, R. A review on the phytochemical composition and health applications of honey. Heliyon 2023, 9, e12507. [Google Scholar] [CrossRef]
  8. Santos-Buelga, C.; González-Paramás, A.M. Chemical Composition of Honey. In Bee Products—Chemical and Biological Properties; Alvarez-Suarez, J.M., Ed.; Springer International Publishing: Berlin/Heidelberg, Germany, 2017; pp. 43–82. [Google Scholar]
  9. Khalil, M.; Alam, N.; Moniruzzaman, M.; Sulaiman, S.; Gan, S. Phenolic Acid Composition and Antioxidant Properties of Malaysian Honeys. J. Food Sci. 2011, 76, C921–C928. [Google Scholar] [CrossRef] [PubMed]
  10. Gašić, U.M.; Milojković-Opsenica, D.M.; Tešić, Ž.L. Polyphenols as possible markers of botanical origin of honey. J. AOAC Int. 2017, 100, 852–861. [Google Scholar] [CrossRef] [PubMed]
  11. Komosinska-Vassev, K.; Olczyk, P.; Kaźmierczak, J.; Mencner, L.; Olczyk, K. Bee Pollen: Chemical Composition and Therapeutic Application. Evid. Based Complement. Altern. Med. 2015, 2015, e297425. [Google Scholar] [CrossRef] [PubMed]
  12. Kowalski, S.; Makarewicz, M. Functional properties of honey supplemented with bee bread and propolis. Nat. Prod. Res. 2017, 31, 2680–2683. [Google Scholar] [CrossRef] [PubMed]
  13. Osés, S.M.; Pascual-Maté, A.; Fernández-Muiño, M.A.; López-Díaz, T.M.; Sancho, M.T. Bioactive Properties of Honey with Propolis. Food Chem. 2016, 196, 1215–1223. [Google Scholar] [CrossRef]
  14. Pasupuleti, V.R.; Sammugam, L.; Ramesh, N.; Gan, S.H. Honey, Propolis, and Royal Jelly: A Comprehensive Review of Their Biological Actions and Health Benefits. Oxid. Med. Cell. Longev. 2017, 2017, e1259510. [Google Scholar] [CrossRef]
  15. Habryka, C.; Socha, R.; Juszczak, L. The Effect of Enriching Honey with Propolis on the Antioxidant Activity, Sensory Characteristics, and Quality Parameters. Molecules 2020, 25, 1176. [Google Scholar] [CrossRef]
  16. Miłek, M.; Mołoń, M.; Kielar, P.; Sidor, E.; Bocian, A.; Marciniak-Lukasiak, K.; Pasternakiewicz, A.; Dżugan, M. The Comparison of Honey Enriched with Laboratory Fermented Pollen vs. Natural Bee Bread in Terms of Nutritional and Antioxidant Properties, Protein In Vitro Bioaccessibility, and Its Genoprotective Effect in Yeast Cells. Molecules 2023, 28, 5851. [Google Scholar] [CrossRef]
  17. Bogdanov, S. Harmonised Methods of the International Honey Commission; Swiss Bee Research Centre, FAM, Liebefeld: Bern, Switzerland, 2002. [Google Scholar]
  18. Turkmen, N.; Sari, F.; Poyrazoglu, E.S.; Velioglu, Y.S. Effects of prolonged heating on antioxidant activity and colour of honey. Food Chem. 2006, 95, 653–657. [Google Scholar] [CrossRef]
  19. Beretta, G.; Granata, P.; Ferrero, M.; Orioli, M.; Facino, R.M. Standardization of antioxidant properties of honey by a combination of spectrophotometric/fluorimetric assays and chemometrics. Anal. Chim. Acta 2005, 533, 185–191. [Google Scholar] [CrossRef]
  20. Slinkard, K.; Singleton, V.L. Total phenol analysis: Automation and comparison with manual methods. Am. J. Enol. Vitic. 1977, 28, 49. [Google Scholar] [CrossRef]
  21. Herald, T.J.; Gadgil, P.; Tilley, M. High-throughput microplate assays for screening flavonoid content and DPPH-scavenging activity in sorghum bran and flour. J. Sci. Food Agric. 2012, 92, 2326–2331. [Google Scholar] [CrossRef] [PubMed]
  22. Bobo-García, G.; Davidov-Pardo, G.; Arroqui, C.; Vírseda, P.; Marín-Arroyo, M.R.; Navarro, M. Intra-laboratory validation of microplate methods for total phenolic content and antioxidant activity on polyphenolic extracts, and comparison with conventional spectrophotometric methods. J. Sci. Food Agric. 2015, 95, 204–209. [Google Scholar] [CrossRef] [PubMed]
  23. Pauliuc, D.; Dranca, F.; Oroian, M. Antioxidant activity, total phenoloc content, individual phenolics and physicochemical parameters suitability for Romanian honey authentication. Foods 2020, 9, 306. [Google Scholar] [CrossRef] [PubMed]
  24. Sauri-Duch, E.; Gutiérrez-Canul, C.; Cuevas-Glory, L.; Ramón-Canul, L.; Pérez-Pacheco, E.; Moo-Huchin, V. Determination of quality characteristics, phenolic compounds and antioxidant activity of propolis from southeastern Mexico. J. Apic. Sci. 2021, 65, 109–122. [Google Scholar] [CrossRef]
  25. Regulation of the Minister of Agriculture and Rural Development of October 3, 2003 on Detailed Requirements for the Commercial Quality of Honey. J. Laws 2003, 181, 1773.
  26. Wang, J.; Xue, X.; Du, X.; Cheng, N.; Chen, L.; Zhao, J.; Zheng, J.; Cao, W. Identification of Acacia Honey Adulteration with Rape Honey Using Liquid Chromatography–Electrochemical Detection and Chemometrics. Food Anal. Methods 2014, 7, 2003–2012. [Google Scholar] [CrossRef]
  27. Majewska, E.; Kowalska, J. Badanie Korelacji Pomiędzy Przewodnością Elektryczną i Zawartością Popiołu w Wybranych Miodach Pszczelich. Acta Agrophysica 2011, 17, 189. [Google Scholar]
  28. Chomaniuk, N.; Przybyłowski, P.; Wilczyńska, A. Wstępna ocena jakości pszczelich miodów gatunkowych z terenu Warmii i Mazur. Bromatol. I Chem. Toksykol. 2016, 49, 256. [Google Scholar]
  29. Popek, S. Badanie kwasowości pszczelich miodów odmianowych. Zesz. Nauk./Akad. Ekon. W Krakowie 2003, 623, 29–33. [Google Scholar]
  30. Molenda, M.; Sowińska, K. Badanie zgodności z normą PN-88/A-77626 elektrochemicznych właściwości wybranych miodów. Analit 2020, 9, 67–74. [Google Scholar]
  31. Kaczmarek, A.; Muzolf-Panek, M.; Tomaszewska-Gras, J.; Konieczny, P. Predicting the botanical origin of honeys with chemometric analysis according to their antioxidant and physicochemical properties. Pol. J. Food Nutr. Sci. 2019, 69, 191–201. [Google Scholar] [CrossRef]
  32. Zhang, G.Z.; Tian, J.; Zhang, Y.Z.; Li, S.S.; Zheng, H.Q.; Hu, F.L. Investigation of the maturity evaluation indicator of honey in natural ripening process: The case of rape honey. Foods 2021, 10, 2882. [Google Scholar] [CrossRef]
  33. Costa, M.C.A.; Morgano, M.A.; Ferreira, M.M.C.; Milani, R.F. Analysis of bee pollen constituents from different Brazilian regions: Quantification by NIR spectroscopy and PLS regression. LWT 2017, 80, 76–83. [Google Scholar] [CrossRef]
  34. Majewska, E.; Kowalska, J.; Owerko, B. Fizyko-chemiczne parametry wybranych miodów gryczanych dostępnych na rynku polskim. Bromatol. I Chem. Toksykol. 2012, 4, 1233–1238. [Google Scholar]
  35. Council Directive 2001/110/EC relating to honey. Off. J. Eur. Communities 2001, L10, 47–52. Available online: https://eur-lex.europa.eu/legal-content/EN/ALL/?uri=CELEX%3A32001L0110 (accessed on 20 July 2023).
  36. Bath, P.K.; Singh, N. A comparison between Helianthus annuus and Eucalyptus lanceolatus honey. Food Chem. 1999, 67, 389–397. [Google Scholar] [CrossRef]
  37. Boonchiangma, S.; Chanthai, S.; Srijaranai, S. Chemical compositions and non-enzymatic browning compounds of Thai honey: A kinetic study. J. Food Process Eng. 2011, 34, 1584–1596. [Google Scholar] [CrossRef]
  38. Puścion-Jakubik, A.; Karpińska, E.; Moskwa, J.; Socha, K. Content of phenolic acids as a marker of polish honey varieties and relationship with selected honey-quality-influencing variables. Antioxidants 2022, 11, 1312. [Google Scholar] [CrossRef] [PubMed]
  39. Bodor, Z.; Benede, C.; Urbin, Á.; Szabó, D.; Sipos, L. Colour of honey: Can we trust the Pfund scale?–An alternative graphical tool covering the whole visible spectra. Food Sci. Technol. 2021, 149, 111859. [Google Scholar] [CrossRef]
  40. Socha, R.; Habryka, C.; Juszczak, L. Wpływ dodatku pierzgi na zawartość wybranych związków polifenolowych oraz aktywność przeciwutleniającą miodu. Żywność Nauka Technol. Jakość 2018, 25, 34–47. [Google Scholar] [CrossRef]
  41. Tomczyk, M.; Tarapatskyy, M.; Dżugan, M. The influence of geographical origin on honey composition studied by Polish and Slovak honeys. Czech J. Food Sci. 2019, 37, 232–238. [Google Scholar] [CrossRef]
  42. Wilczyńska, A. Próba zastosowania regresji liniowej do określenia związku pomiędzy barwą a właściwościami antyoksydacyjnymi miodów. Zesz. Nauk. Akad. Morskiej W Gdyni 2013, 80, 13–19. [Google Scholar]
  43. Socha, R.; Habryka, C.; Juszczak, L. Wpływ dodatku propolisu na zawartość wybranych związków polifenolowych oraz aktywność przeciwutleniającą miodu. Żywność Nauka Technol. Jakość 2016, 23, 108–119. [Google Scholar]
  44. Qian, W.L.; Khan, Z.; Watson, D.G.; Fearnley, J. Analysis of sugars in bee pollen and propolis by ligand exchange chromatography in combination with pulsed amperometric detection and mass spectrometry. J. Food Compos. Anal. 2008, 21, 78–83. [Google Scholar] [CrossRef]
  45. Kędzia, B. Chemical composition of Polish propolis. Part I Initial. Period Investig. Phytother. Prog. 2009, 1, 39–44. [Google Scholar]
  46. Alvarez-Suarez, J.M.; Tulipani, S.; Díaz, D.; Estevez, Y.; Romandini, S.; Giampieri, F.; Damiani, E.; Astolfi, P.; Bompadre, S.; Battino, M. Antioxidant and antimicrobial capacity of several monofloral Cuban honeys and their correlation with color, polyphenol content and other chemical compounds. Food Chem. Toxicol. 2010, 48, 2490–2499. [Google Scholar] [CrossRef]
  47. Al, M.L.; Daniel, D.; Moise, A.; Bobis, O.; Laslo, L.; Bogdanov, S. Physicochemical and bioactive properties of different floral origin honeys from Romania. Food Chem. 2009, 112, 863–867. [Google Scholar] [CrossRef]
  48. Ojeda de Rodríguez, G.; Sulbarán de Ferrer, B.; Ferrer, A.; Rodríguez, B. Characterization of honey produced in Venezuela. Food Chem. 2004, 84, 499–502. [Google Scholar] [CrossRef]
  49. Tigistu, T.; Worku, Z.; Mohammed, A. Evaluation of the physicochemical properties of honey produced in Doyogena and Kachabira Districts of Kembata Tambaro zone, Southern Ethiopia. Heliyon 2021, 7, e06803. [Google Scholar] [CrossRef] [PubMed]
  50. Yao, L.; Jiang, Y.; Singansusong, R.; Datta, N.; Raymont, K. Phenolic acids in Australian Melaleuca, Guioa, Lophostemon, Banksia and Helianthus honey and their potential for floral authentication. Food Res. Int. 2005, 38, 651–658. [Google Scholar] [CrossRef]
  51. Socha, R.; Juszczak, L.; Pietrzyk, S.; Gałkowska, D.; Fortuna, T.; Witczak, T. Phenolic profile and antioxidant properties of Polish honeys. Int. J. Food Sci. Technol. 2011, 46, 528–534. [Google Scholar] [CrossRef]
  52. Pękal, A.M. The Impact of Selecting an Analytical Procedure on Determining the Antioxidant Properties of Food Samples. Ph.D. Thesis, Warsaw University, Faculty of Chemistry, Warszawa, Poland, 2014. [Google Scholar]
Figure 1. The water content in the investigated rapeseed honeys. a,b—groups statistically significant at the significance level p ≤ 0.05.
Applsci 14 01292 g001
Figure 2. The specific electrical conductivity of honeys. a–d—groups statistically significant at the significance level p ≤ 0.05.
Applsci 14 01292 g002
Figure 3. The pH level in rapeseed honey. a–c—groups statistically significant at the significance level p ≤ 0.05.
Applsci 14 01292 g003
Figure 4. The content of free acids in honey. a–d—groups statistically significant at the significance level p ≤ 0.05.
Applsci 14 01292 g004
Figure 5. The content of brown pigments in honey. a–c—groups statistically significant at the significance level p ≤ 0.05.
Applsci 14 01292 g005
Figure 6. The color of the honey. a–c—groups statistically significant at the significance level p ≤ 0.05.
Applsci 14 01292 g006
Figure 7. The total polyphenol content determined in honey. a–c—groups statistically significant at the significance level p ≤ 0.05.
Applsci 14 01292 g007
Figure 8. Antioxidant activity against DPPH radicals determined in the honey[%]. a–d—groups statistically significant at the significance level p ≤ 0.05.
Applsci 14 01292 g008
Figure 9. Results of HPLC of phenolic compounds detected in honeys (272 nm): (1) kaempferol = 1.43 min, (2) gallic acid = 1.76 min, (3) quercetin = 2.26 min, (4) catechin = 3.28 min, (5) epicatechin = 5.12 min.
Applsci 14 01292 g009
Table 1. The sugar content in honeys.
Fructose
[g/100 g]
Glucose
[g/100 g]
Glucose
+ Fructose
[g/100 g]
Sucrose
[g/100 g]
Fructose/
Glucose Ratio
Rapeseed honey33.8 ± 0.7 a36.4 ± 1.1 a70.1 ± 1.7 a2.1 ± 0.1 a0.93 ± 0.01 b
Rapeseed honey
+ 1% propolis
33.3 ± 0.2 a37.5 ± 0.5 a70.9 ± 0.6 a2.1 ± 0.1 a0.88 ± 0.01 a
Rapeseed honey
+ 2% bee bread
34.3 ± 0.9 a37.1± 0.3 a71.5 ± 1.0 a2.1 ± 0.1 a0.92 ± 0.03 b
Rapeseed honey
+ 5% bee pollen
31.7 ± 0.4 a36.6 ± 0.3 a68.3 ± 0.7 a2.1 ± 0.0 a0.87 ± 0.01 a
The same letters in the same line are significantly different at the 95% level (p ≤ 0.05) Tukey test.
Table 2. Contents of phenolic compounds [mg/100 g] in honeys.
Rapeseed HoneyRapesedd Honey
+ 1% Propolis
Rapeseed Honey
+ 2% Bee Bread
Rapeseed Honey
+ 5% Bee Pollen
Kaempferol1.519 ± 0.001 a2.488 ± 0.001 c3.192 ± 0.002 d4.021 ± 0.000 b
Gallic acid0.001 ± 0.000 a0.002 ± 0.000 c0.004 ± 0.000 d0.006 ± 0.000 b
Quercetin0.695 ± 0.002 a2.576 ± 0.000 c2.319 ± 0.000 d1.952 ± 0.001 b
Catechinnd.nd.0.395 ± 0.002 b0.175 ± 0.000 a
Epicatechin
gallate
nd.1.059 ± 0.002nd.nd.
Sum of
phenolic
compounds
2.216 ± 0.004 a6.126 ± 0.002 b5.910 ± 0.005 c6.155 ± 0.001 b
The same letters in the same line are significantly different at the 95% level (p ≤ 0.05) Tukey test. nd.—not detected.
Disclaimer/Publisher’s Note: The statements, opinions and data contained in all publications are solely those of the individual author(s) and contributor(s) and not of MDPI and/or the editor(s). MDPI and/or the editor(s) disclaim responsibility for any injury to people or property resulting from any ideas, methods, instructions or products referred to in the content.

