Article

Research on Capillary Water Absorption Characteristics of Modified Recycled Concrete under Different Freeze–Thaw Environments

1
School of Civil Engineering, Architecture and Environment, Hubei University of Technology, Wuhan 430068, China
2
Key Laboratory of Health Intelligent Perception and Ecological Restoration of River and Lake, Ministry of Education, Hubei University of Technology, Wuhan 430068, China
3
China Railway Major Bridge Engineering Group Co., Ltd., Wuhan 430050, China
4
School of Public Policy and Management, Tsinghua University, Beijing 100084, China
5
High-Tech Research and Development Center, Ministry of Science and Technology, Beijing 100044, China
*
Author to whom correspondence should be addressed.
Appl. Sci. 2024, 14(3), 1247; https://doi.org/10.3390/app14031247
Submission received: 14 December 2023 / Revised: 28 January 2024 / Accepted: 30 January 2024 / Published: 2 February 2024

Abstract

:
Recycled coarse aggregate is processed through the second crushing, which causes some internal damage, resulting in its physical indicators being far worse than natural coarse aggregate; its durability is relatively poor, and in the northern region, the soil contains a large number of acidic salt ions from the erosion of concrete, resulting in a decline in its durability. In this test, concrete was made from the single and composite immersion of recycled coarse aggregate using 5% water glass and 8% silane solution and subjected to a rapid freeze–thaw test in water, 3.5% NaCl solution, and 5% Na2SO4 solution, followed by a capillary water absorption test. The study was conducted to test the durability of recycled concrete, establish the initial capillary water absorption prediction model under freeze–thaw in different media, and analyze the internal structure of the RAC group after freeze–thaw using SEM. The test results showed that the composite-modified water absorption decreased the most, which can effectively improve the durability of recycled concrete, and the chloride salt caused the greatest erosion of recycled concrete and had the least clear water. The predictive model has high accuracy and can be used as a reference for capillary water absorption experiments on recycled concrete.

1. Introduction

The speed of global infrastructure has been increasing in recent years, and the infrastructure construction material that is mainly used is concrete [1], which produces more and more construction waste. A big problem that follows is the disposal of construction waste, but the global recycling rate of construction waste is very low [2]. A small amount of construction waste is recycled and utilized mainly for backfilling foundations, while the rest is piled up at empty sites. Since it is difficult for construction waste to decompose on its own, dumping it randomly will damage and pollute the ecological environment.
The use of recycled coarse aggregates enables the reuse of resources and reduces the extraction of natural stone; it also reduces the ecological damage caused by construction waste. However, when recycled coarse aggregates are crushed and processed again, the microcracks inside the aggregates increase a lot, and part of the old mortar is attached to the surface, resulting in high water absorption of the recycled concrete [3,4,5]. Thus, it is necessary to strengthen recycled coarse aggregates. Currently, the more frequently used and effective strengthening method is the chemical modification method; the chemical modification method is involves the recycled coarse aggregate being soaked in a chemical solution to improve the performance of the recycled coarse aggregate through the product of a chemical reaction [6]. C. Christodoulou et al. [7] measured the capillary water absorption of bridges treated with silane for 20 years and found that the bridges were still well waterproofed and protected. M. Medeiros and P. Helene et al. [8] found that the water absorption of concrete surfaces treated with silane hydrophobizing agents was reduced by 2.12 times. Ya-GuangZhu et al. [9] experimented by either applying silane on the surface of concrete or by adding it to the concrete as a whole, and it was found that both treatments improved the resistance of recycled concrete to capillary water absorption, carbonation, and chloride ion penetration. Mazen J. Al-Kheetan et al. [10] showed a 7% decrease in the water absorption of concrete after treating glass powder with silane. DujianZou et al. [11] found that both the surface silane modification of recycled aggregate and cementitious monolithic silane modification can improve the freeze–thaw durability of recycled aggregate pervious concrete. QingWang et al. [12] found that the addition of an appropriate amount of water glass to recycled aggregate concrete can improve its strength. Sang-SoonPark et al. [13] impregnated concrete with water glass and found that the strength of the concrete was slightly increased, but the porosity of the concrete was improved more significantly, and its resistance to chloride ions was significantly increased. Bin Zhang et al. [14] showed that the microcracking of concrete with the addition of sodium silicate material was less than that of conventional materials. Saud Al-Otaibi et al. [15] used 4% and 6% water glass as activators to be added to the concrete, and the durability of the concrete was better in both cases. Baifu Luo et al. [16] found that soaking the recycled coarse aggregate in the prepared water glass solution reduced the water absorption of the recycled coarse aggregate. Hongru Zhang et al. [17] treated the surface of recycled coarse aggregate with a 3% solution of water glass, which resulted in decreases in the water absorption and crushing value of 23.36% and 16.59%, respectively. D. A. Kagi et al. [18] found a more pronounced decrease in the water absorption of concrete by immersing the concrete in a diluted water glass solution and then in a diluted alkyl quaternary ammonium salt solution. The silane and water glass production process has become more mature, with less pollution to the environment, good adhesion with concrete, corrosion resistance, high-temperature resistance to weathering, and low production costs. Additionally, when dealt with appropriately, it can be transformed into a harmless substance used for recycled aggregate reinforcement, reducing the mining of natural aggregates and protecting the environment.
Tahir Gonen et al. [19] tested silica fume and fly-ash-doped concrete and found that the capillary water absorption of concrete increased more after freeze–thaw cycles, and San Luo et al. [20] found that freeze–thaw cycles accelerated the destruction of concrete. In the northern region, many soils contain a large number of Cl, SO4, and other salt ions due to the huge temperature difference between day and night, so the concrete is not only subjected to freezing and thawing damage but is also subjected to the erosion of salt ions, which greatly shortens the service life of the building. Peng Zhang et al. [21] found that the penetration rate of chloride ions was accelerated after freeze–thaw cycles, which exacerbated the damage inside the concrete. I.F. Sáez Del Bosque et al. [22] found that there was a decrease in the freeze–thaw durability of demolition construction concrete in de-icing salts. Ángel Vega-Zamanillo et al. [23] performed freeze–thaw cycle tests after immersing the specimens in salt water and found that the specimens survived for a shorter period of time. FanXu et al. [24] performed freeze–thaw experiments by placing three different types of concrete in water and 5% Na2SO4 and found that sulfate accelerated the freeze–thaw damage of concrete. Wojciech Piasta et al. [25] found that sulfate decreases the frost resistance of cement mortar, and S. Boudali et al. [26] found that the compressive strength of concrete decreased by 22% when it was immersed in sulfate solution for 365 days. Sajjad Ali Mangi et al. [27] made concrete that was cured in different solutions, and it was found that the strength of the concrete decreased more in 5% sodium sulfate and 5% sodium chloride solutions, and the internal reinforcement was damaged by corrosion.
In summary, recycled aggregates have more defects, the natural environment in cold regions is more severe, and the application of recycled concrete in cold regions needs to be considered. In recent years, more research has been conducted on aggregate modification, water freezing, and salt freezing, and the effect is more obvious. However, there is less research on single modification and composite modification combined with water freezing and salt freezing. The ability to absorb capillary water is one of the important indexes for evaluating the durability of concrete [28,29]. It is closely related to the internal pores and cracks of concrete, and the freeze–thaw cycle has a large influence on the capillary water absorption ability of concrete. Therefore, the objective of this study is to investigate the durability of modified recycled concrete under different freeze–thaw environments. In this paper, 5% water glass solution, 8% silane solution, and 5% water glass solution + 8% silane solution were used to modify the recycled aggregate. The test specimens were placed in water, 3.5% sodium chloride solution, and 5% sodium sulfate solution for the freeze–thaw cycle test, and then a capillary water absorption test was conducted to measure the water absorption of the specimens within 7 days, and electron microscope experiments were carried out on the recycled concrete after freezing and thawing to analyze the durability of the concrete both superficially and microscopically.

2. Test

2.1. Raw Materials

The cement is P.O42.5-grade ordinary silicate cement produced by Yadong Cement Co., Ltd. (Wuhan, China) The fly ash is Grade I fly ash, and the mineral powder is S95 mineral powder, all of which were provided by China Construction Commercial Concrete Company, Detailed parameters are shown in Table 1, Table 2 and Table 3. The natural coarse aggregate is natural gravel, and the recycled coarse aggregate is the construction waste from the demolition of the community, which is crushed and screened by the jaw crusher. The coarse aggregate grading range is 4.75~31.5 mm, the fine aggregate is natural river sand, and the fineness modulus is 2.87, and it belongs to the medium sand classification. Detailed parameters are shown in Table 4. The basic performance indexes are as follows: The additives are an SJ-3 air-entraining water-reducing agent and a naphthalene high-efficiency water-reducing agent; the test water is laboratory tap water. The water glass solution was produced by Yurui Refractories Co., Ltd. (Zhejiang Sheng, China); the solid content is about 35.8%, and the modulus is 3.30. The silane coupling agent (KH550) was produced by Henan Lingjia Chemical Co., Ltd. (Zhengzhou, China); the density is 0.945 g/cm3.

2.2. Design of Test Mix Ratio

In this experiment, the concrete proportion design was carried out according to the JCJ55-2011 “Design Procedures for Ordinary Concrete Proportions”, and 30% of recycled coarse aggregate was substituted for natural coarse aggregate. The unmodified recycled coarse aggregate was made into recycled concrete according to the standard as the reference group (RAC), and the recycled concrete was made by immersing the recycled coarse aggregate in 5% water glass for 1 h and 8% silane solution for 24 h, and 5% water glass solution for 1 h + 8% silane solution for 24 h were used as the control group (WRAC, GRAC, WGRAC). The materials in the recycled concrete are shown in Table 5, and a schematic diagram of the recycled concrete interface is shown in Figure 1.

2.3. Test Methods

2.3.1. Pretreatment of Recycled Coarse Aggregate Modification

The modulus of the 3.30 water glass solution was diluted with water to a 5% concentration, placed in a bucket, and slowly added to the processed regenerated coarse aggregate while mixing, ensuring that the liquid surface was higher than the regeneration of coarse aggregate by 5–10 cm. After 1 h of immersion in the regenerated coarse aggregate, it was fished out and placed in a cool, ventilated place to dry naturally for a week, and then bagged for storage.
KH550 silane solution was diluted with water to 8% concentration in a barrel; then, the treated regenerated coarse aggregate was slowly added while mixing, ensuring that the liquid surface was higher than the regenerated coarse aggregate by 5–10 cm. It was then soaked for 24 h, fished out, placed in a ventilated place to dry for a week, and then bagged for storage.
Firstly, treated regenerated coarse aggregate was put in a 5% concentration of water glass solution, added and stirred at the same time to ensure that the liquid surface was higher than the regenerated coarse aggregate by 5–10 cm, and soaked for 1 h and placed in a ventilated area to dry for a week. It was then put in an 8% concentration of silane solution, added and stirred at the same time to ensure that the liquid surface was higher than the regenerated coarse aggregate by 5–10 cm, soaked for 24 h, and placed in a cool and ventilated area to dry for a week and then bagged for storage.
The process of reinforcing recycled coarse aggregate with different modifiers is shown in Figure 2.

2.3.2. Reinforcement Mechanism of Recycled Coarse Aggregate Modification

Water glass and silane solution can wash away the dust on the surface of recycled coarse aggregate, and the sodium silicate component in the water glass solution reacts with the unhydrated Ca(OH)2 and other substances to produce products such as C-S-H gel to fill the cracks and pores in the mortar of the surface layer of recycled coarse aggregate. Small silane molecules have strong permeability; when silane molecules penetrate into the concrete, a series of dehydration and condensation reactions occur and form a layer of siloxane polymer water-repellent membrane on the surface of the concrete, preventing the entry of external water molecules, and thus reducing the water absorption rate of the recycled coarse aggregate (Figure 3).

2.3.3. Freeze–Thaw Cycle Test

The SEM experimental equipment model is TESCAN MIRA LMS, and the equipment manufacturer is Tescan China (Shanghai, China); the current/acceleration voltage is 5 keV. The freeze–thaw cycle test was performed according to the GB/T50082-2009 “long-term performance of ordinary concrete and durability test method standard” requirements, using the “fast freezing method” on the specimen freeze–thaw test. Each group of three specimens had a size of 100 mm × 100 mm ×100 mm, and the specimens were in accordance with the standard maintenance of 28 d. The specimens were placed in a bucket of water and immersed for 4 d; the liquid level above the specimen was 20–30 mm. After immersion, the specimens were taken out for rapid freeze–thaw cycle tests; when the specimens’ freezing and thawing cycle numbers reached the set numbers of 0 times, 50 times, 100 times, 150 times, and 200 times, a photo record was taken, and the capillary water absorption test was carried out.

2.3.4. Capillary Water Absorption Test

When the set number of freezing and thawing cycles of the specimen was reached, they were removed with a cutting machine along the center axis, cut into 100 mm × 100 mm × 50 mm small specimens, and placed in the oven at 105 (±5) °C and baked for 48 h. The specimens were cooled to room temperature, and a surface for the absorbent was selected; the opposite sides of the absorbing surface were sealed with plastic film, while the remaining four sides were sealed with epoxy resin, evenly coated to ensure that the specimen absorbed water in one dimension during the experiment. The treated specimens were placed in an oven at a temperature of 23 (±2) °C, and the mass of the specimens was weighed after the epoxy resin was completely dried; the accuracy of the measured mass was 0.01 g. The test specimens were then sealed with a plastic film. The specimen was placed in the water-absorbing device, and the liquid surface was kept higher than the bottom surface of the specimen by 1–3 mm until the specimen reached the specified water-absorbing time. It was then removed quickly, and a rag was used to dry its surface water. The specimen was placed in the water-absorbing device, and after weighing its mass, it was quickly put into the suction device to carry out the next stage of the water-absorption test. Its different stages of capillary water absorption mass, the measurement time, and allowable error were then calculated, as shown in Table 6; the capillary water absorption process device diagram is shown in Figure 4.

2.3.5. Scanning Electron Microscopy Tests

The specimens of the RAC group were removed for sampling after 250 freeze–thaw cycles in three freeze–thaw environments: clear water, chloride salt solution, and sulfate solution. The specific operation was as follows: (1) To ensure the accuracy of the mechanism, a cutting machine was used to slice the test block, and the same depth specimen was taken as the sample. (2) The samples were dried in an oven at 105 (±5) °C, labeled, and sent to the SEM laboratory for gold spraying. (3) After the gold spraying was completed, the specimens were fixed on the fixed stage of the electron microscope, observed back and forth to determine the desired observation position, and photographed at different magnifications for recording.

3. Analysis and Discussion of Test Results

3.1. Analysis of Apparent Morphology of Specimen after Freeze–Thaw Cycle

The apparent morphology of the recycled concrete changed considerably as the test progressed. Specimens (ordinary recycled concrete) without freeze–thaw and with 150 and 250 freeze–thaw cycles in clear water, chloride salt solution, and sulfate solution were selected for a comparison of the apparent morphology analysis, using the RAC group (ordinary recycled concrete) as the reference group.
In Figure 5a, it can be seen that when the specimen is not frozen and thawed, the surface is relatively smooth, flat, and dense, and there are some regular bubble holes generated by the hydration reaction. In Figure 5b, it can be seen that the specimen surface added a small number of scattered holes, and most of them are still relatively smooth and dense. In Figure 5c, it can be seen that some of the mortar on the surface of the specimen has begun to expand, and there is a small amount of shedding; from Figure 5d, it can be seen that there are more holes on the surface of the specimen than during the water freezing and thawing cycle. As can be seen in Figure 5e, the surface of the specimen is uneven, part of the mortar has fallen off, and there are many irregular holes. In Figure 5f, it can be seen that a large amount of mortar was detached from the surface of the specimen, and the area of the holes became larger and the number of holes increased significantly, which was accompanied by the appearance of some cracks, but there was no coarse aggregate exposed. In Figure 5g, it can be seen that the mortar is widely dislodged, the surface is rough and uneven, only a few mortars attached to the concrete surface exist, and the number of holes is greater than the number of clear water freezing and thawing cycles. In Figure 5h, it can be seen that the mortar on the surface of the test specimen is almost completely dislodged, the cracks are extended and increased in number, and some of the coarse aggregates are exposed to the air. In Figure 5i, it can be seen that the mortar on the surface of the specimen shed more, there are many dense, small holes, similar to a honeycomb, and in Figure 5j, it can be seen that a large amount of mortar is shed on the surface, only a few mortars are left, and there is a small amount of exposed coarse aggregate and some minor cracks. It can be seen that the freeze–thaw damage of recycled concrete is a process that occurs from shallow to deep concrete.

3.2. Analysis of Capillary Water Absorption Properties of Recycled Concrete

3.2.1. Cumulative Water Absorption

The general test results are calculated using the following formula:
W = m t a ρ
where W is the cumulative water absorption per unit area (in mm); m is the mass of water absorbed by the specimen at time t (in g); ρ is the density of water (in g/mm3); and a is the contact area between the specimen and the water (in mm2).

3.2.2. Water Absorption

The capillary water absorption rate is usually used to indicate the rate of water absorption per unit area of concrete in contact with water; it is often used to judge the strength of the water absorption capacity of unsaturated materials, such as concrete; and it is an important indicator for judging the durability of concrete. Disregarding the influencing factors of hydration reactions occurring within the concrete, the cumulative amount of water absorbed by the concrete in the one-dimensional water absorption state at time, t, can be expressed as follows:
W = S t + b
where S denotes the capillary water absorption rate, expressed in g/(cm-s1/2); t denotes the water absorption time; and b denotes the longitudinal axis intercept.

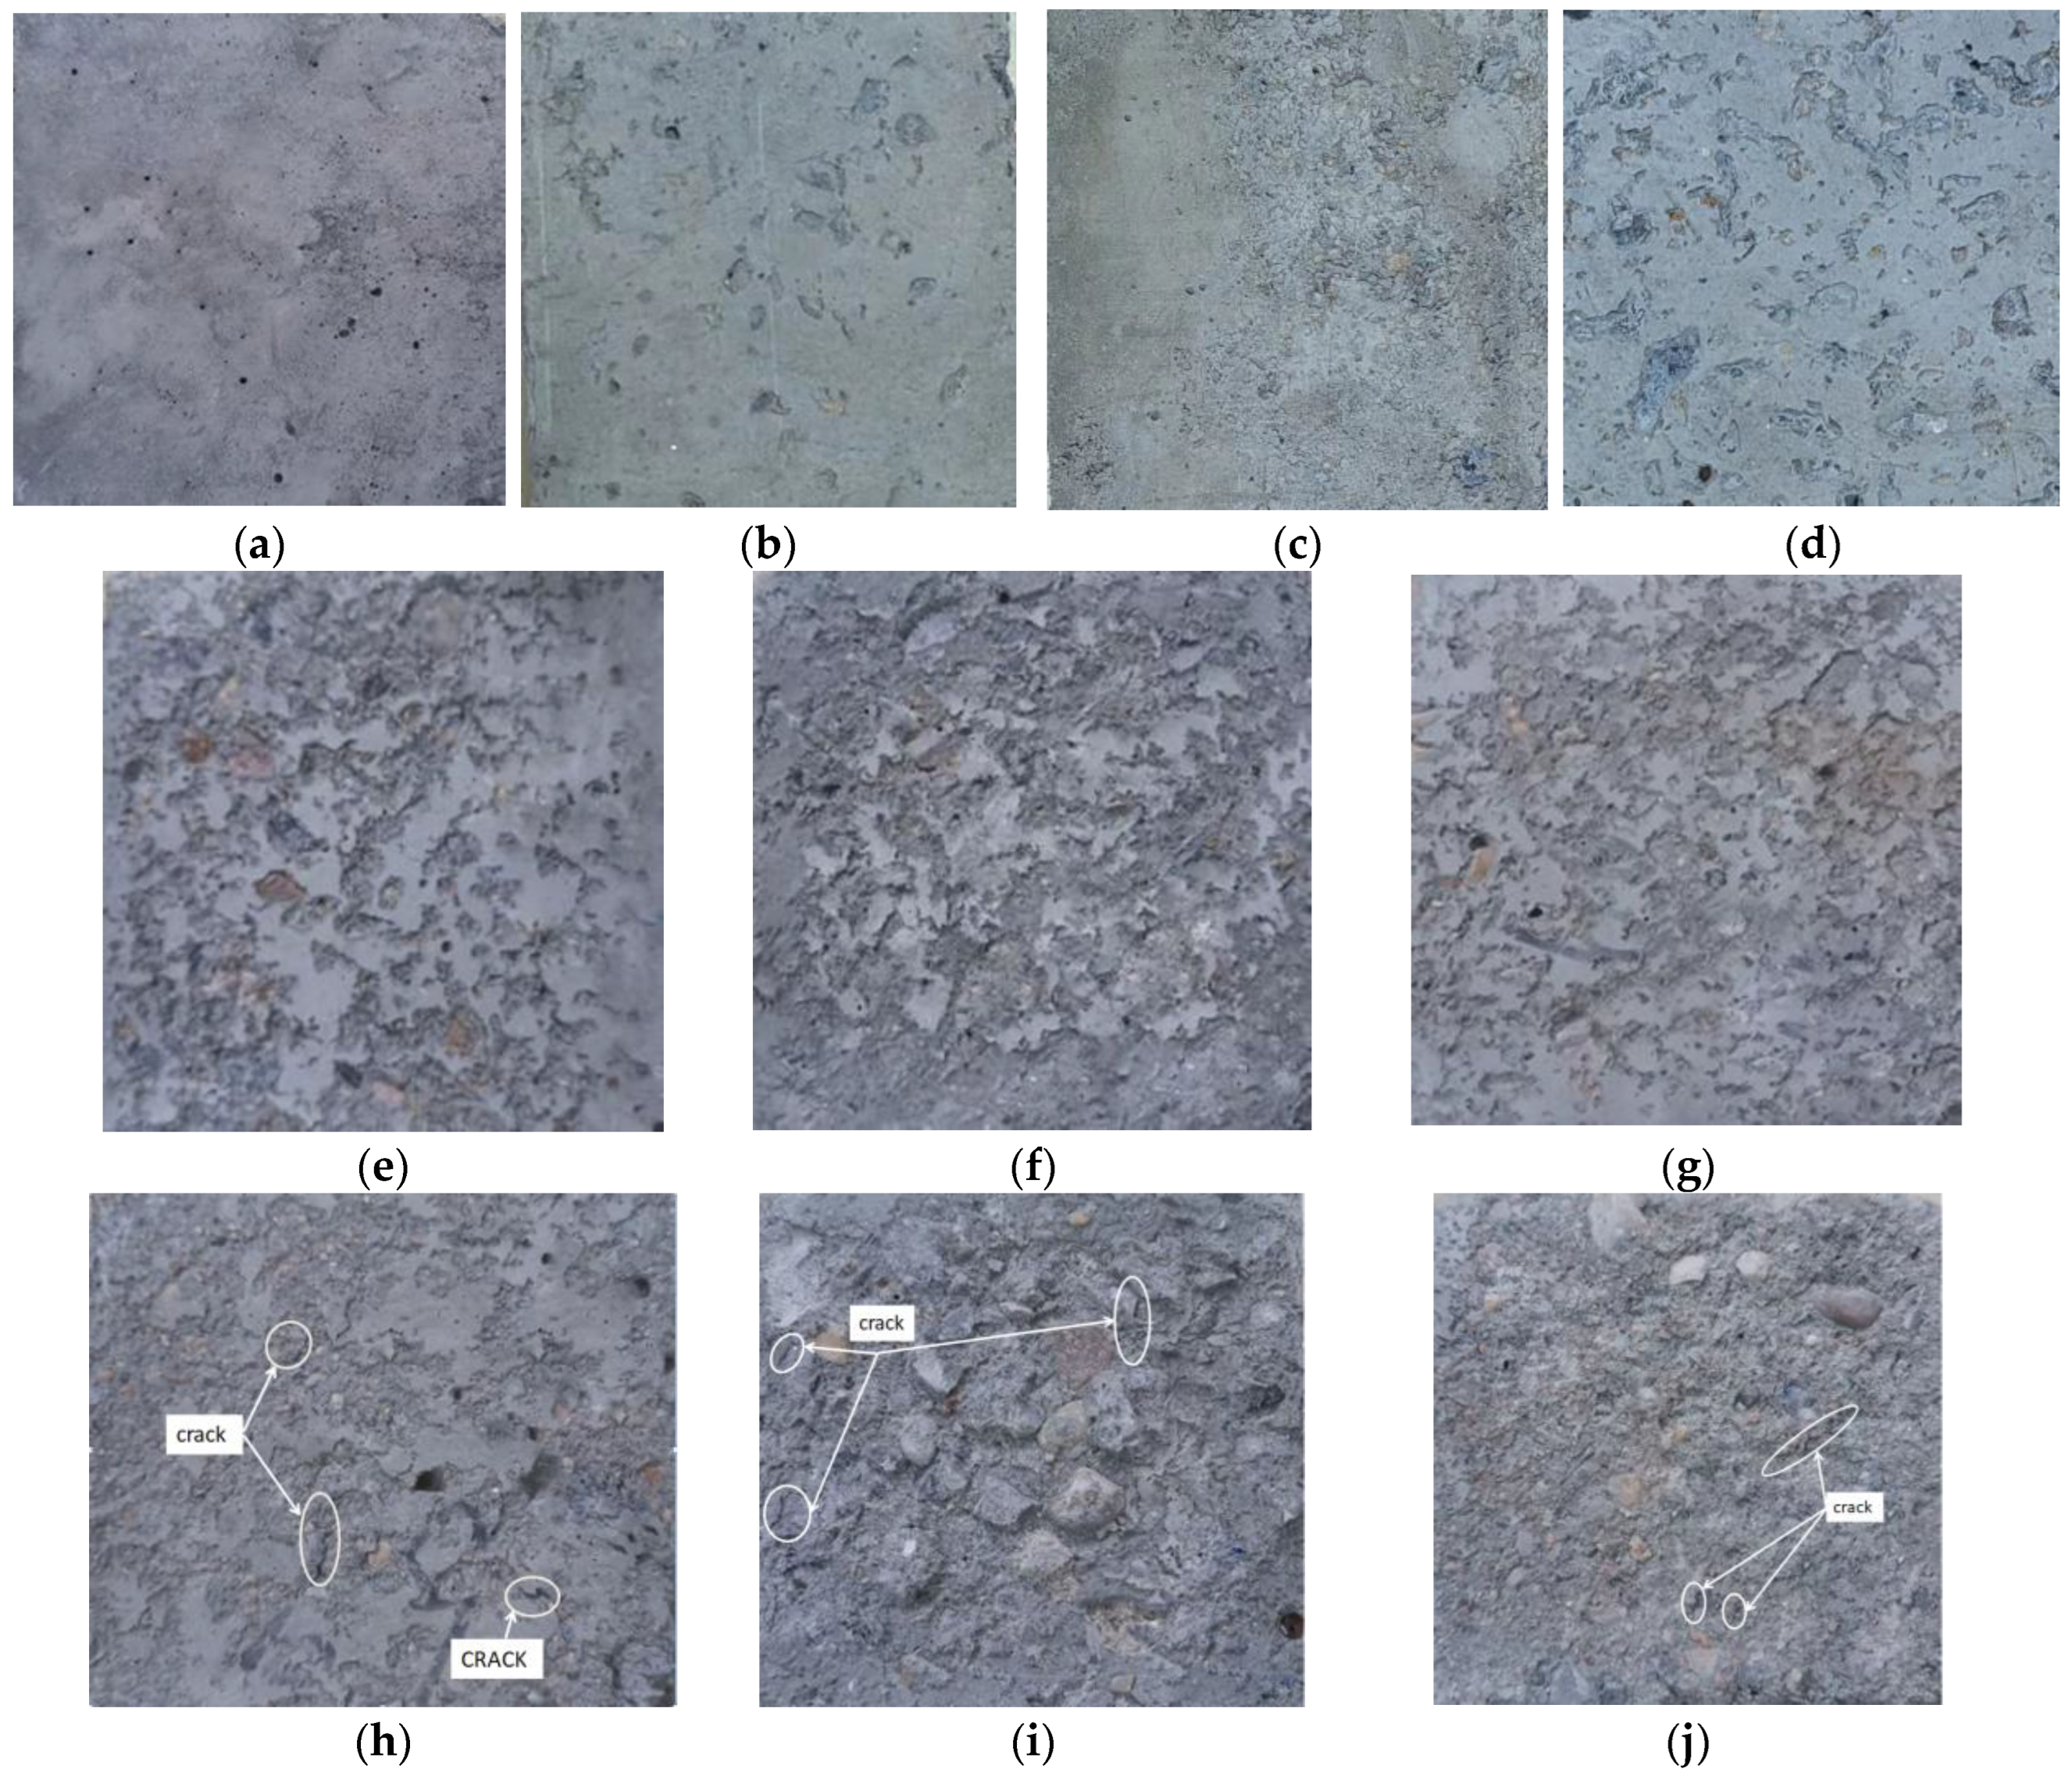
3.2.3. Analysis of Data Calculations

According to the experimental data, the water absorption rate can be divided into three stages, which are the pre-fast absorption stage (T1/2 = 0–84.8 s), the secondary slow absorption stage (T1/2 = 84.8–207.8 s), and the late gentle absorption stage (T1/2 = 207.8–777.7 s).
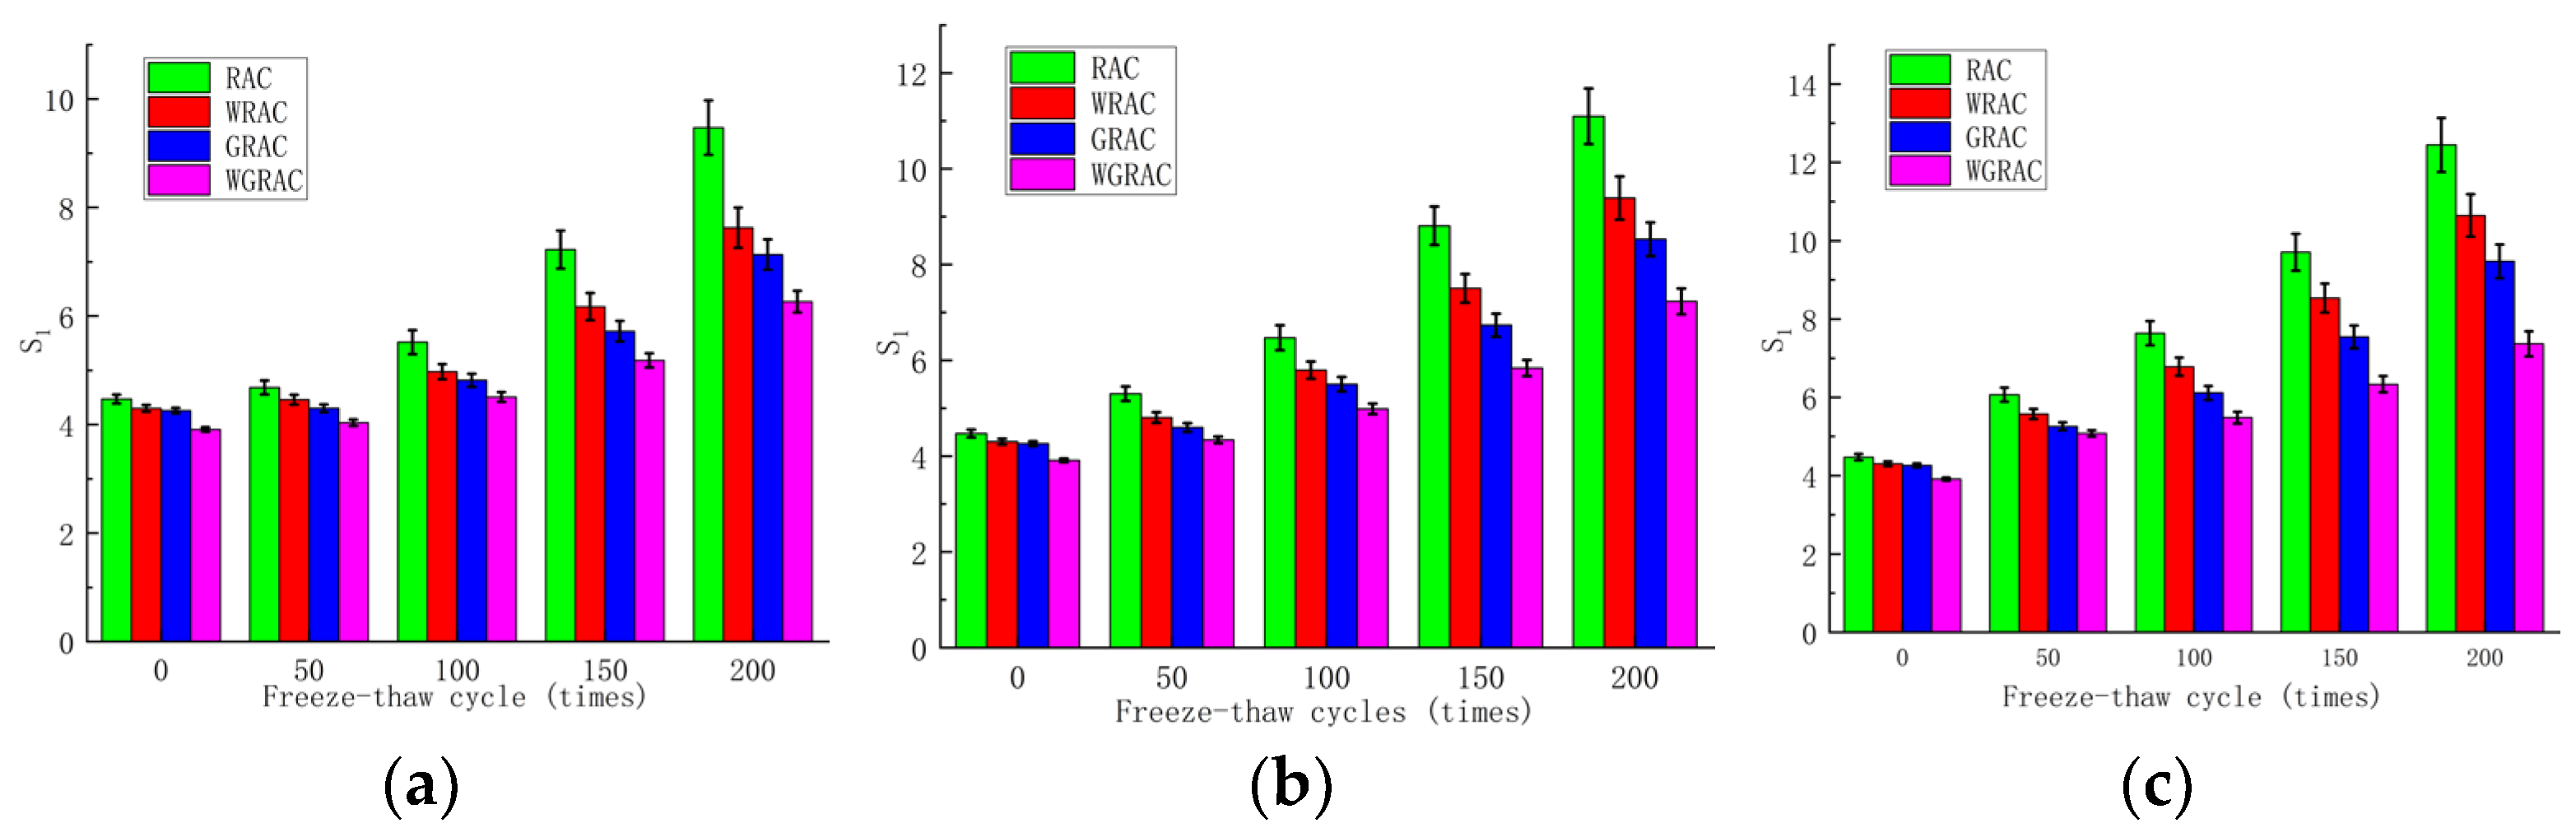
The initial water absorption rates of the RAC, WRAC, GRAC, and WGRAC groups can be obtained from the linear fit of the preliminary phase (T1/2 = 0–84.8 s) of the cumulative water absorption curve per unit time, and its relationship with the number of freeze–thaw cycles in different media is shown below.
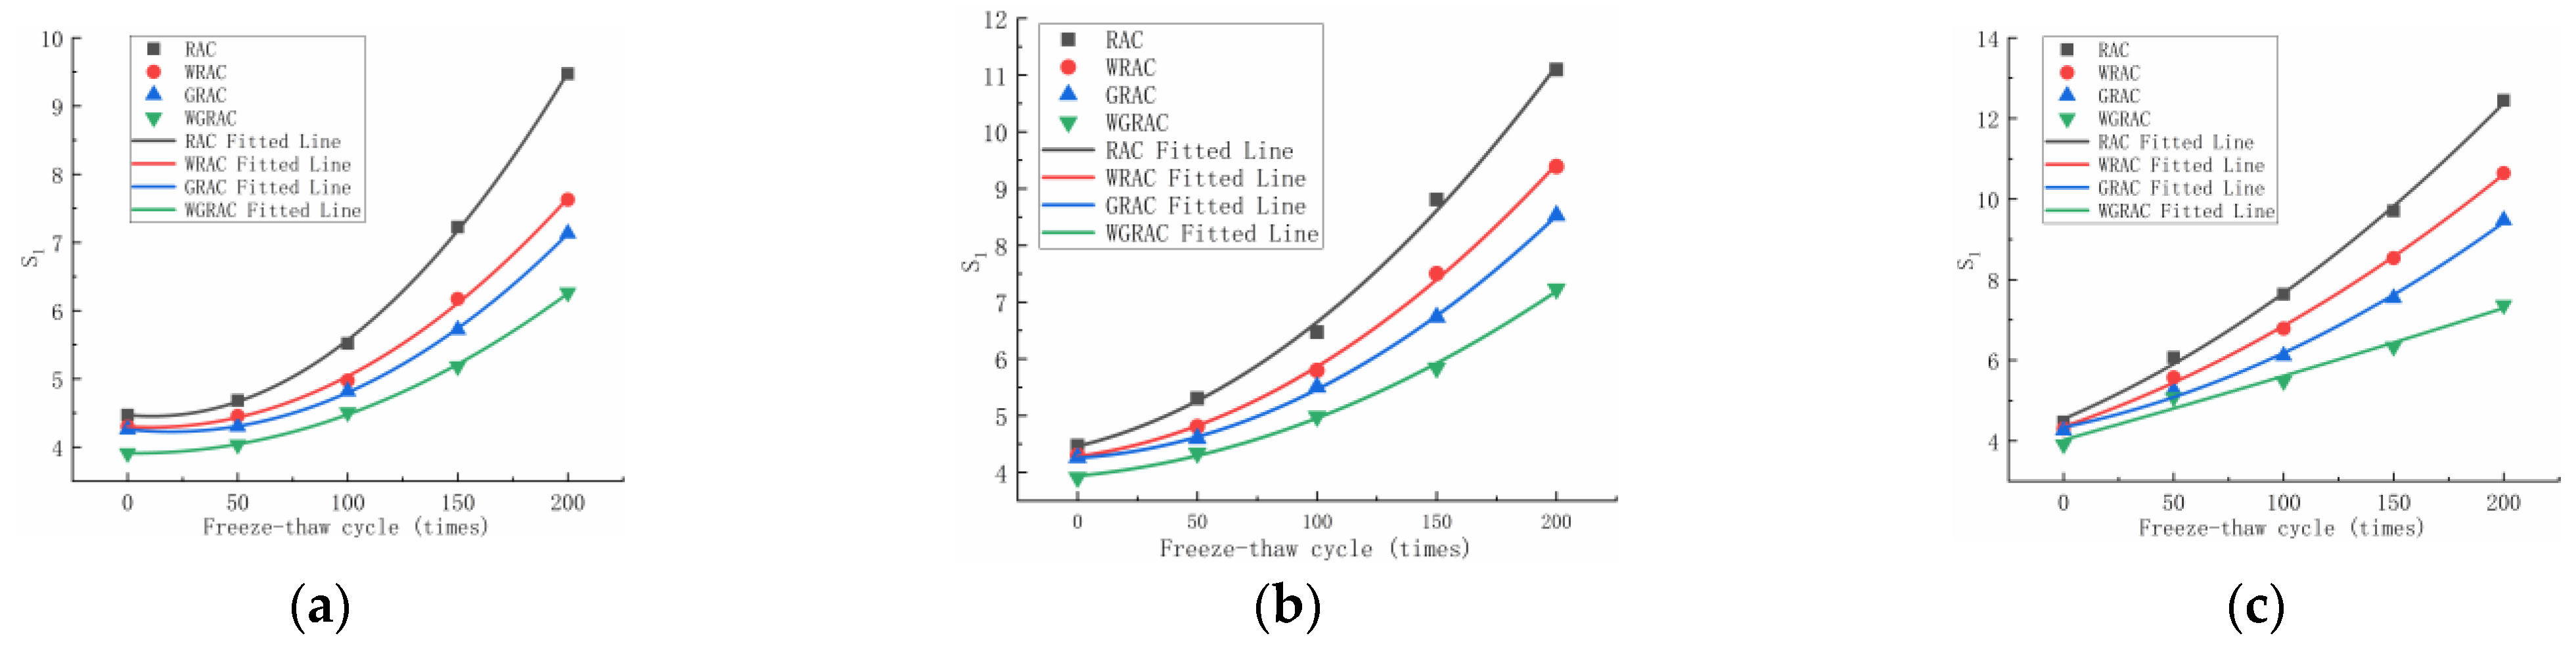
As can be seen in Figure 6a, at 50 freeze–thaw cycles, the water absorption of the WRAC, GRAC, and WGRAC groups decreased by 4.82%, 8.1%, and 13.8% compared to the RAC group. At 200 freeze–thaw cycles, the water absorption of the WRAC, GRAC, and WGRAC groups decreased by 19.4%, 24.6%, and 33.8% compared to the RAC group. As can be seen in Figure 6b, at 50 freeze–thaw cycles, the capillary water absorption of the WRAC, GRAC, and WGRAC groups decreased by 9.3%, 13.2%, and 18.1%, which are lower than that of the RAC group. At 200 freeze–thaw cycles, the pre-absorption rates of the WRAC, GRAC, and WGRAC groups decreased by 15.38%, 23.14%, and 34.83%, respectively, compared with the RAC group. As can be seen in Figure 6c, at 50 freeze–thaw cycles, the water absorption of the WRAC, GRAC, and WGRAC groups decreased by 8.1%, 13.3%, and 16.3% compared with that of the RAC group, and when 200 freeze–thaw cycles were performed, the water absorption of the WRAC, GRAC, and WGRAC groups decreased by 14.4%, 23.8%, and 38.6% compared with that of the RAC group, respectively.
The water absorption of the specimens did not change much at the low number of freeze and thaw cycles in the clear water freezing and thawing environment. The reason for this is that in the early stage of freezing and thawing, the specimen is more complete and dense, and the damage caused by freezing and thawing is mainly concentrated in the surface layer, which has less effect on the interior of the concrete. With the increase in the number of freeze–thaw cycles, the freeze–thaw damage gradually increases, destroying the concrete surface mortar; the internal closed pores of the concrete are gradually destroyed and connected; the water infiltration into the internal channels of the concrete is gradually increased; the freeze–thaw damage is gradually diffused to the internal concrete; and therefore, the amplitude of the change in the capillary absorption rate of the concrete is gradually increased. At a low number of freeze–thaw cycles in a sulfate freezing and thawing environment, the capillary water absorption rate of each group of specimens in the early stage has a certain increase compared with that of clear water, but the growth rate is relatively slow because the hydration reaction between sulfate and concrete internally generates crystals of calcium alumina, gypsum, etc., which fill the pores and make the concrete relatively dense, allowing it to resist part of the freezing and thawing damage. With the increase in the number of freezing and thawing cycles, the specimen’s surface erosion spalling becomes more and more serious, and the sulfate solution is more likely to penetrate into the concrete interior and constantly crystallize and expand, under the pressures of crystallization and infiltration, to accelerate the specimen’s internal freezing and thawing damage, so that the specimen’s water absorption ability is accelerated. At a low number of freeze–thaw cycles in freeze–thaw environments with chloride salts, the pre-capillary water absorption ability of each group of specimens was higher than that of the other two because the chloride salts lowered the freezing point of the water, reduced the freezing time, and increased the time needed for the chloride ions to penetrate. Additionally, the chlorine ion’s own penetration ability is very strong due to the existence of the concentration difference; the chlorine ion with the water quickly penetrates into the concrete interior; the concrete’s internal erosion, along with the increase in the number of freeze–thaw cycles, causes the surface concrete spalling to become more and more serious; and the internal freeze–thaw damage becomes more and more serious, which accelerates the freeze–thaw damage, and the growth rate of capillary water absorption gradually accelerates.
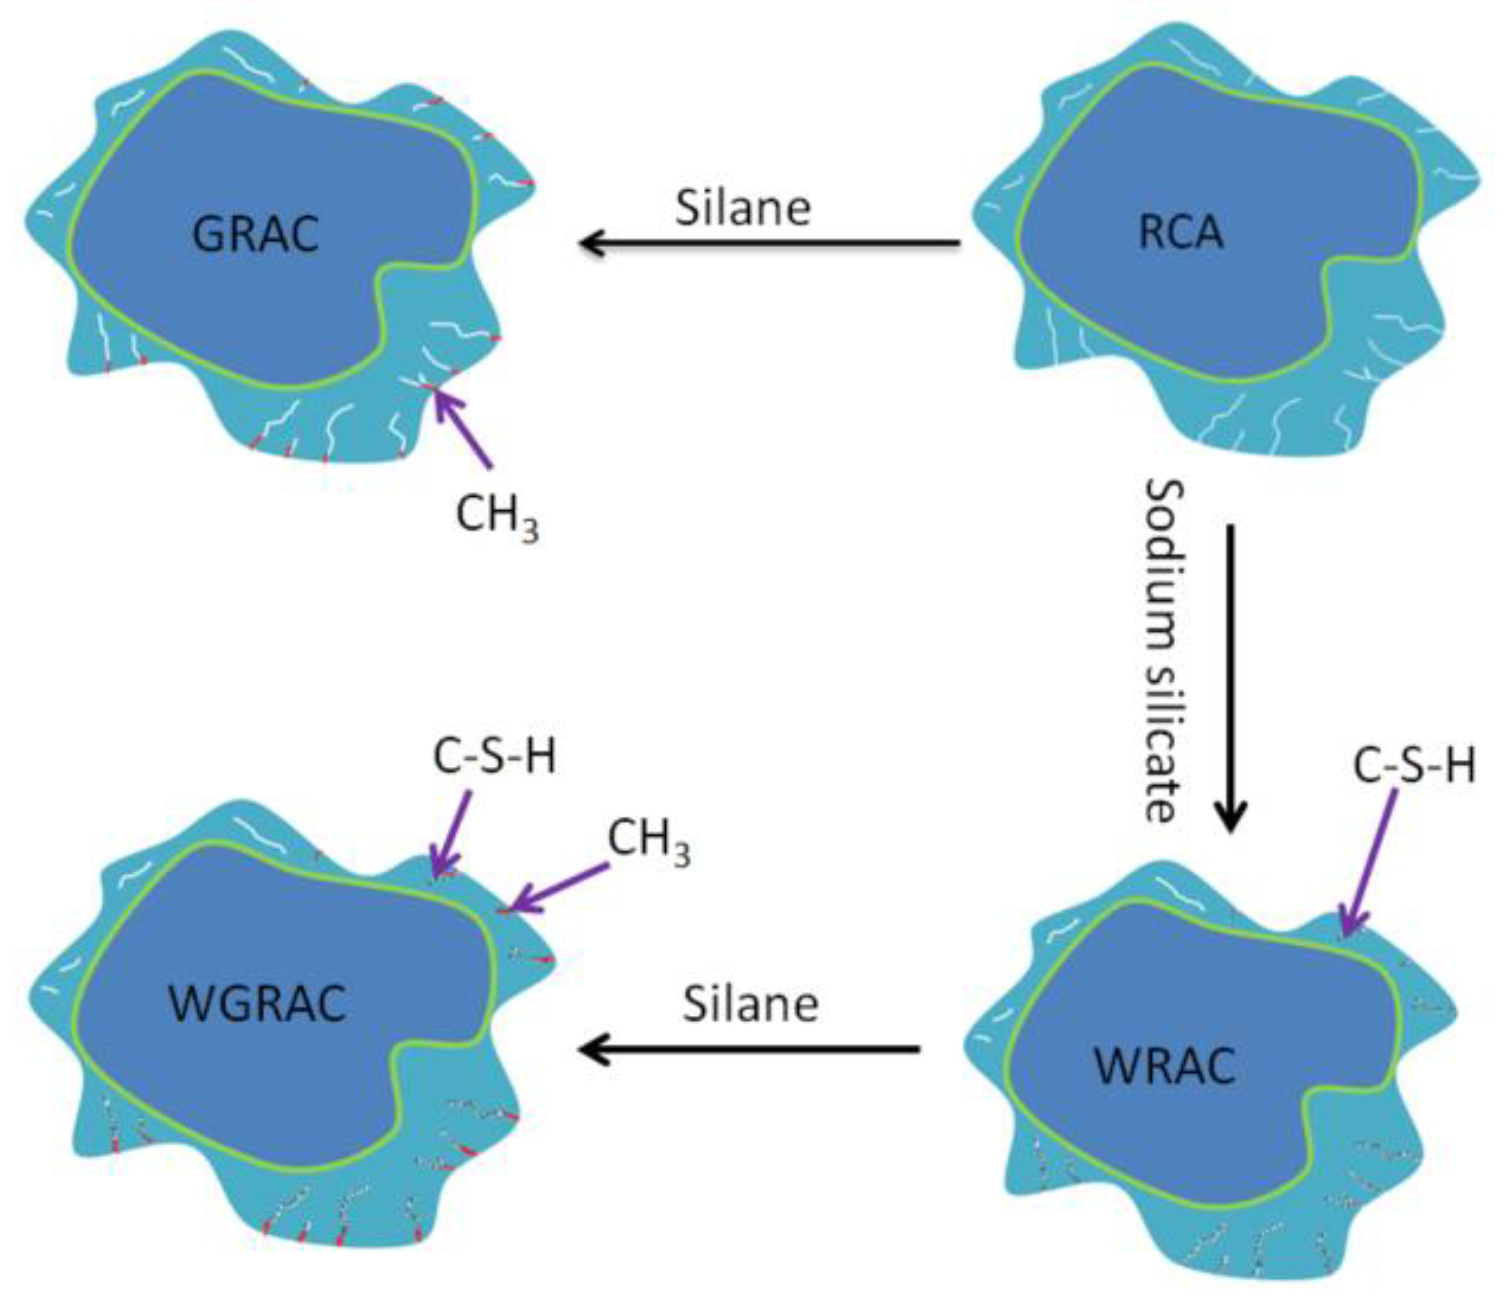
From the overall observation of the above figure, it can be seen that with the increase in the number of freezing and thawing cycles, the specimen’s pre-capillary water absorption ability gradually increased, the specimen under the chlorine salt medium freezing and thawing showed the fastest growth in capillary water absorption, with the slowest growth being observed for the water medium, and it can be seen that salt freezing of the concrete caused by the damage was greater than that caused by the water freezing, with the largest freeze–thawing damage being caused by chlorine salts. The water absorption of the pretreated specimens was lower than that of the unmodified pretreatment, and the composite-modified pretreatment was the most effective. Regarding the water glass solution and silane solution for recycled aggregate immersion modification treatment, the solution can enter the aggregate through penetration and react with the unhydrated material to generate silicate gel (C-S-H) and other substances to fill the internal pores of the aggregate; thus, the recycled coarse aggregate’s internal structure of densification has been improved, and the recycled concrete’s internal pore space is relatively small. The recycled concrete and silane hydrolysis attached to the surface of the recycled coarse aggregate, forming a hydrophobic barrier and preventing water molecules from penetrating into the concrete interior; the overall water absorption capacity of recycled concrete was reduced, and the water absorption rate decreased.

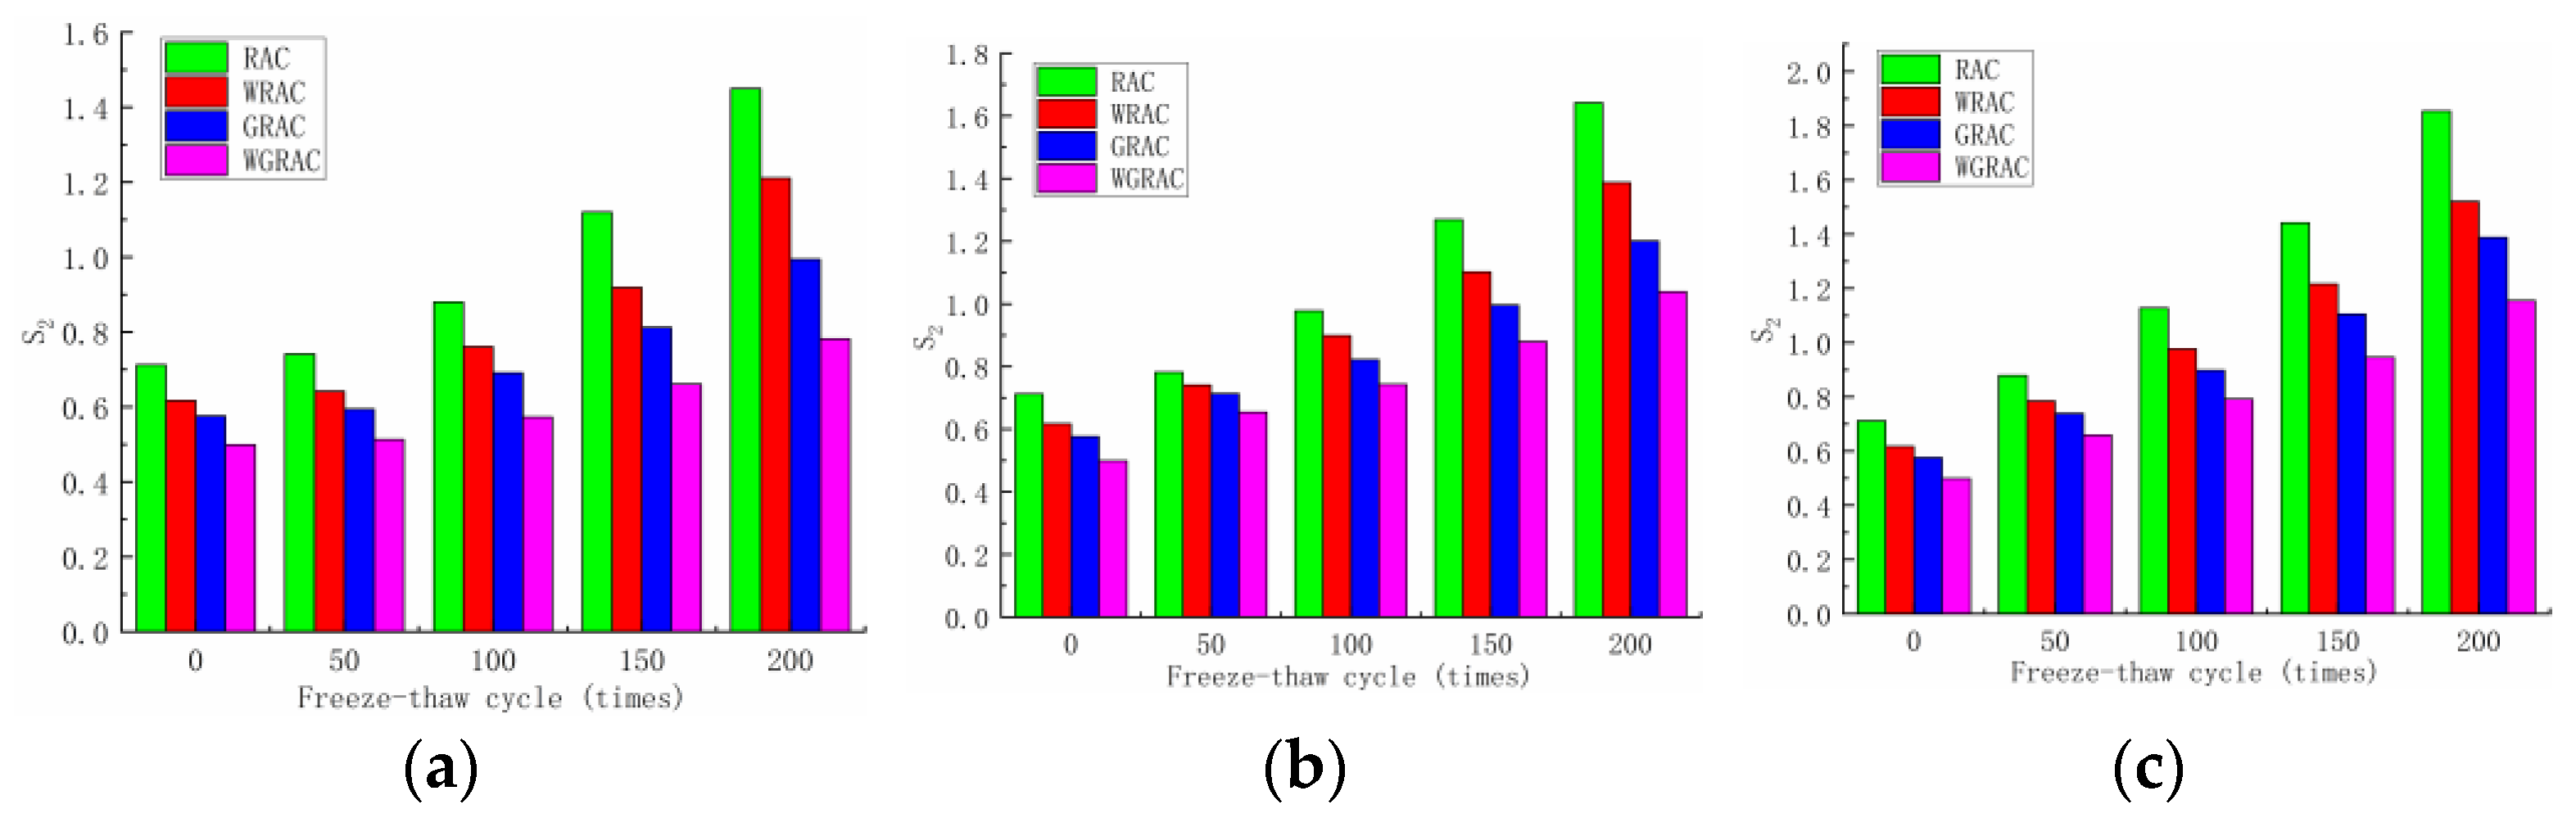
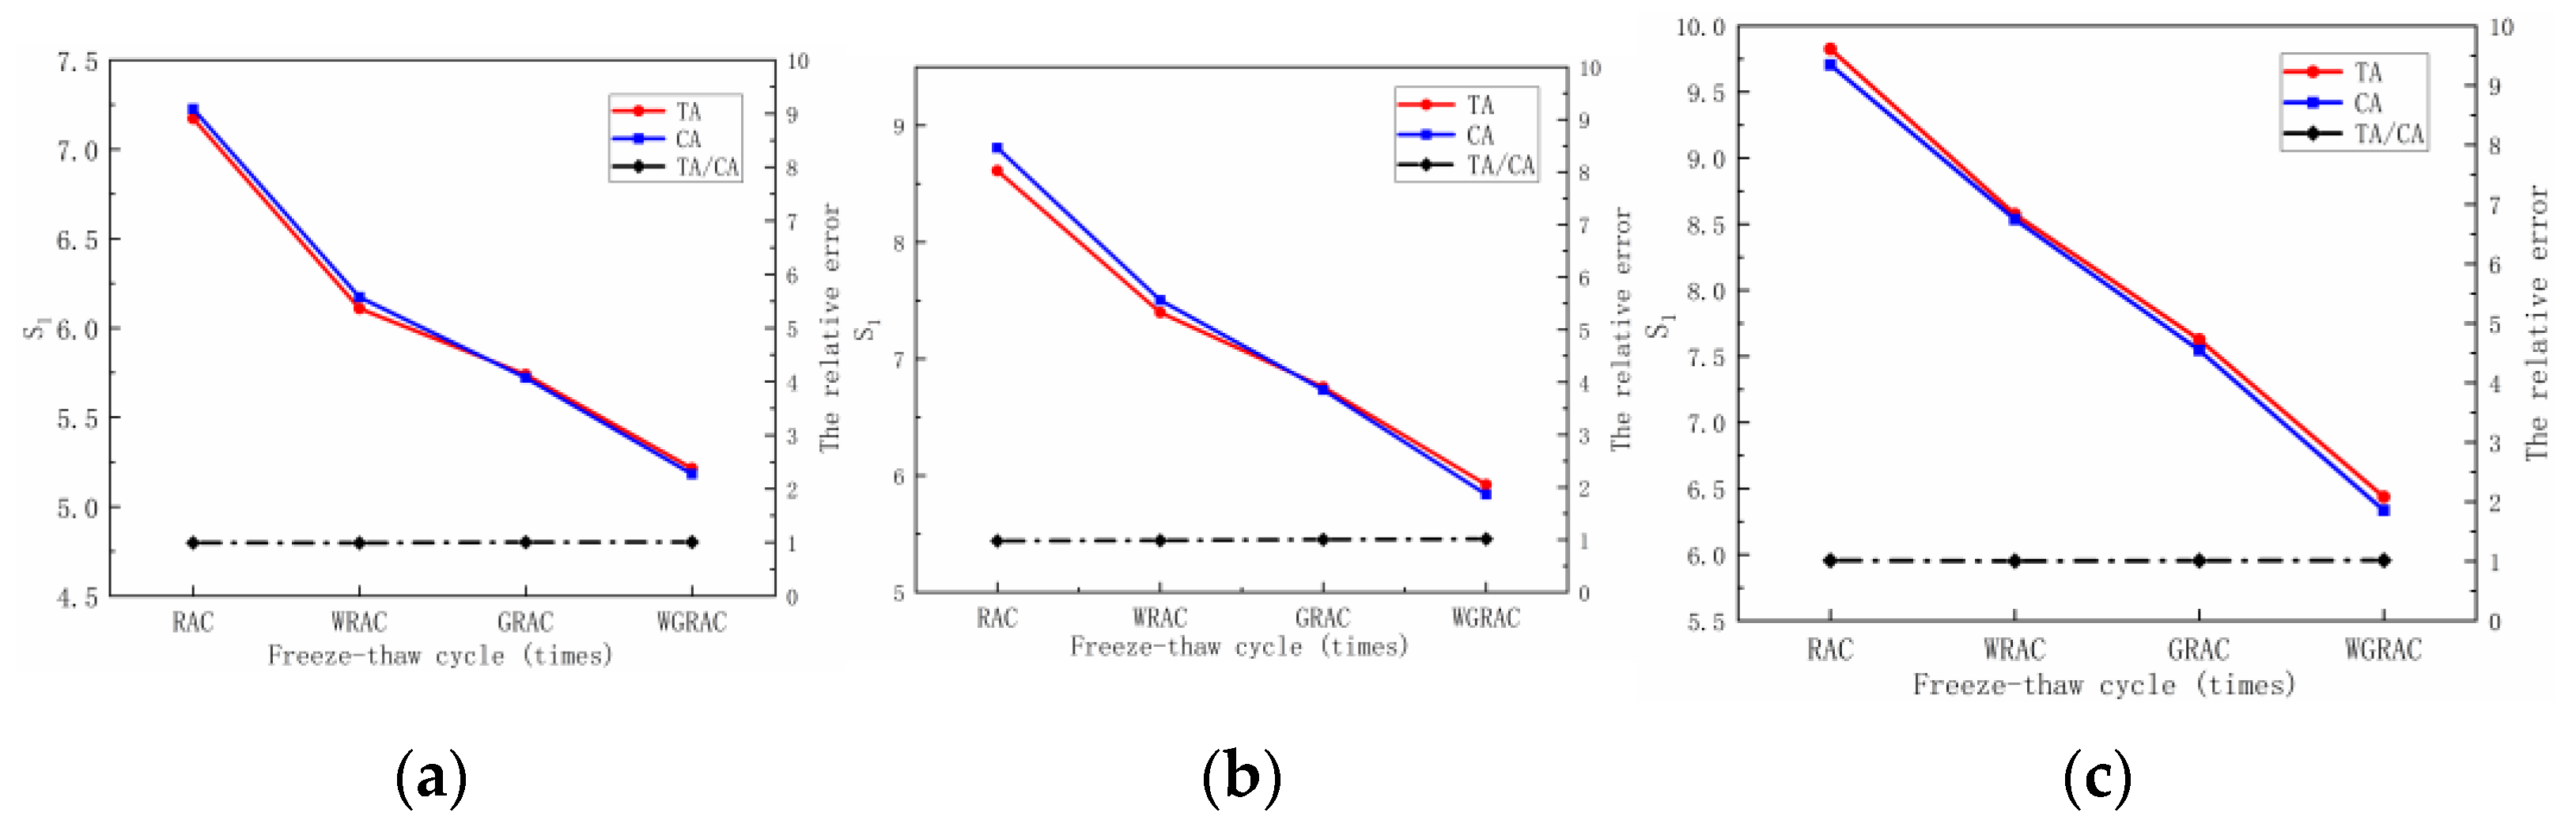
3.2.4. Secondary Water Absorption Rate

From the linear fit of the mid-term phase (T1/2 = 84.8–207.8 s) of the unit’s cumulative water uptake curve, the secondary water uptake rates of the RAC, WRAC, GRAC, and WGRAC groups can be obtained, and their relationships with the number of freeze–thaw cycles in different media are shown in Figure 7.
As can be seen in Figure 7, the water absorption of the RAC, WRAC, GRAC, and WGRAC groups increased with the increase in the number of freeze–thaw cycles under the three media freeze–thaw cycles, but in comparison to the pre-absorption phase, the secondary water absorption showed a substantial decrease.
This is because, in the early stage of water absorption, unsaturated concrete comes into contact with water, and the concrete surface’s capillary pores undergo pressure under the action of rapid water absorption, leading to the absorption of more water and causing the capillary pores to be gradually saturated, resulting in the middle stage; the capillary pores undergo a gradual decrease in pressure. At this time, the water outside the test piece is mainly diffused into the concrete’s interior, and the rate of water absorption gradually slows down, so the secondary water absorption rate of the test piece is much smaller than the initial water absorption rate. By comparison, the chloride salt freeze–thaw specimens have the largest water absorption rates, followed by sulfate, and the water freeze–thaw specimens have the smallest rates. After comparison, it can be seen that the water absorption rate of the RAC group is greater than that of the WRAC group, and the water absorption rate of the GRAC group is greater than that of the WGRAC group, which indicates that the effect of composite-modified recycled coarse aggregate on the improvement of the internal pore space of the concrete is more obvious, the overall water absorption of the concrete decreases significantly, and the decrease in the water absorption rate is the largest.

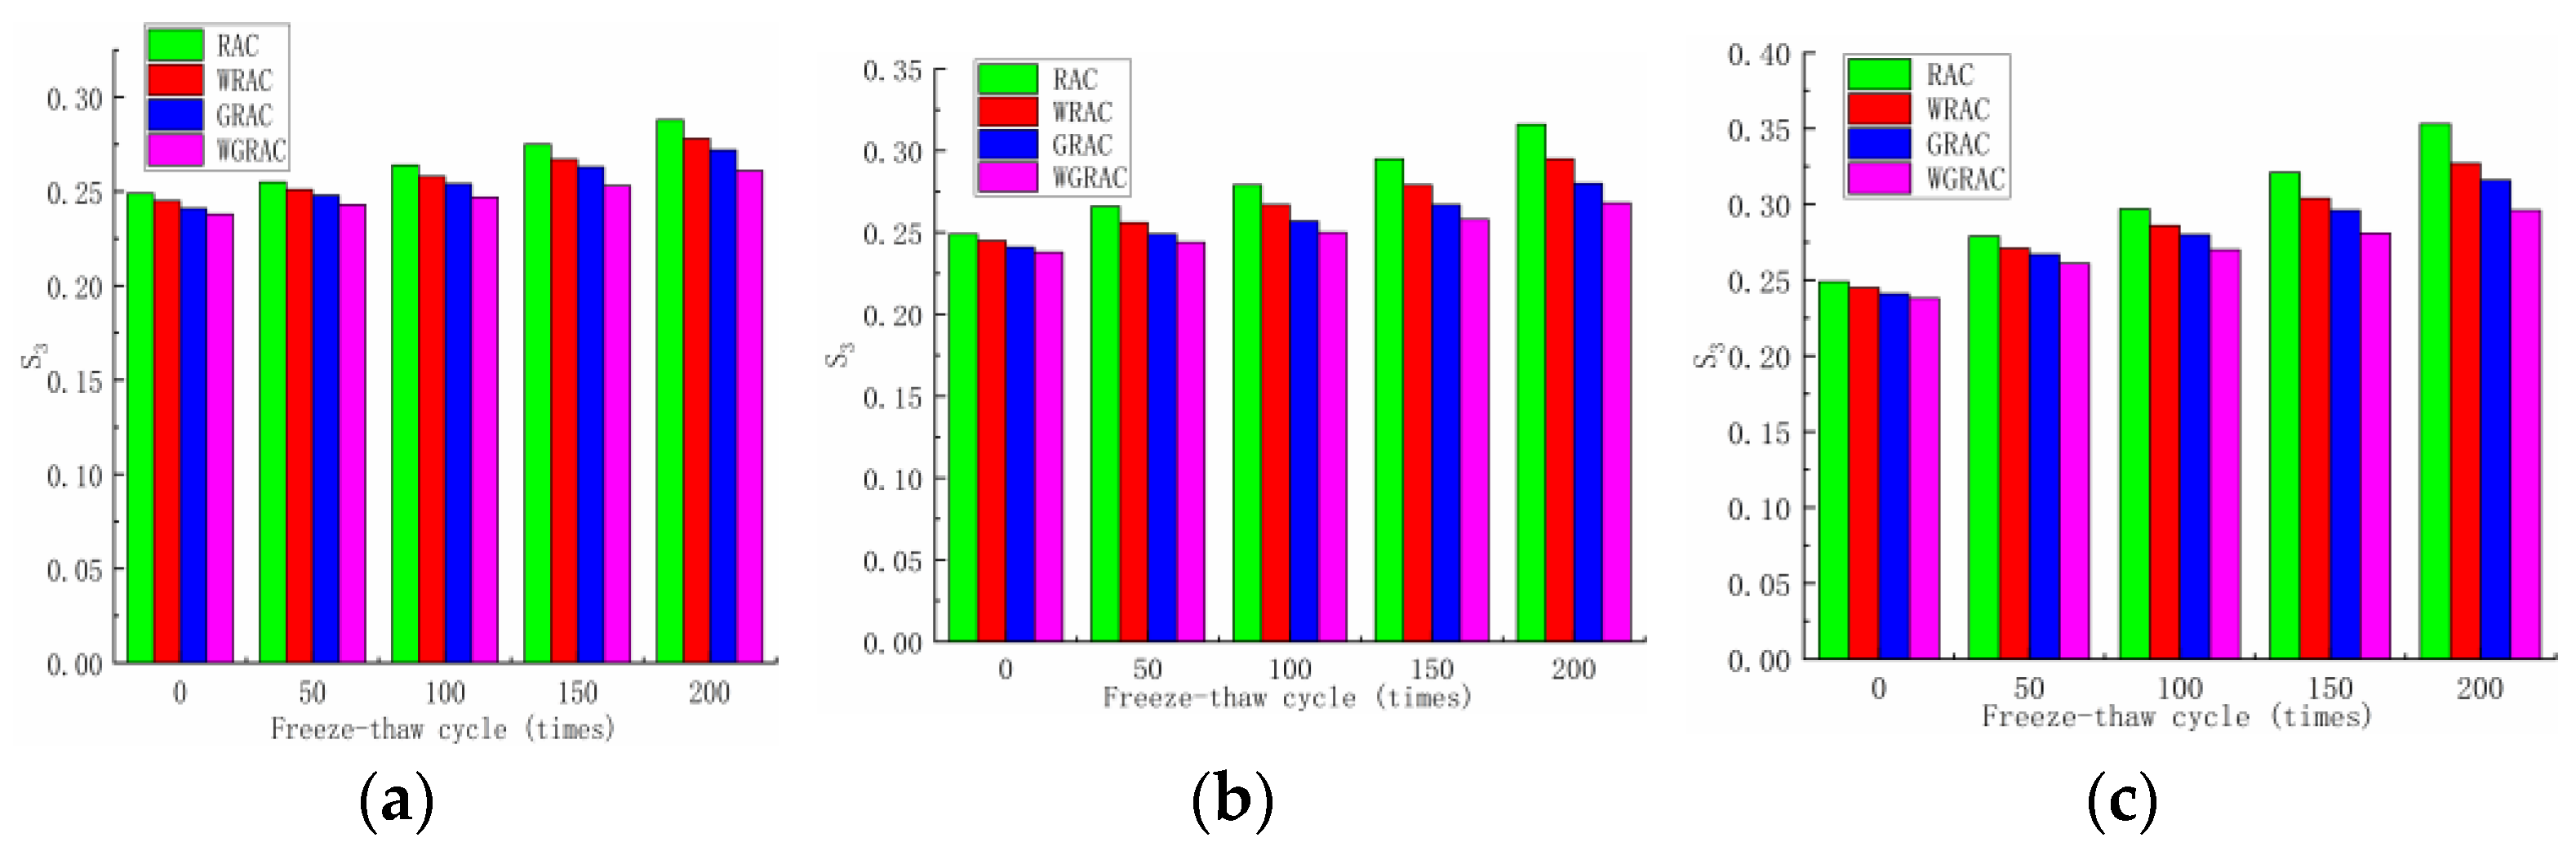
3.2.5. Late Water Absorption

From the late period phase (T1/2 = 207.8–777.7 s) of the unit’s cumulative water uptake curve, a linear fit was made to obtain the late-period water uptake rates for the RAC, WRAC, GRAC, and WGRAC groups as a function of the number of freeze–thaw cycles for different media, as shown in the figure below.
According to Figure 8, it can be seen that the water absorption rate of the specimen under three different media used for freezing and thawing is very small, and the change is very small, because in the late stage of freezing and thawing, the growth of internal cracks in the specimen gradually slows down, and the water absorption rate in the late stage also gradually tends to be leveled off.
Through the above data analysis and comparison, it can be seen that the initial water absorption rate of the concrete changes, S1, is large; the secondary water absorption rate, S2, does not change much; and the later water absorption rate, S3, has an even more minimal effect on the capillary water absorption of concrete. It can be found that the capillary water absorption capacity of concrete is mainly determined by the initial water absorption rate, S1, so the initial water absorption rate, S1, is mainly used in the actual project to measure the capillary water absorption capacity of concrete to judge the durability performance of concrete.

4. Prediction Model of Initial Capillary Water Absorption of Recycled Concrete under Freeze–Thaw Environment with Different Media

From the above analysis, it can be seen that the initial capillary water absorption has the greatest influence on the capillary water absorption performance of recycled concrete, so the initial capillary water absorption can be used to represent the capillary water absorption of recycled concrete. Therefore, the prediction model of the initial capillary water absorption of recycled concrete under freeze–thaw cycles with different media was established according to different modification methods of recycled coarse aggregates and by using the numbers of freeze–thaw cycles as variables.

4.1. Basic Assumptions

(1)
The specimen is in a completely dry state during the whole process of water absorption, and the size and volume of the specimen do not change in shape to ensure that the water absorption surface of the specimen is stable.
(2)
The specimen only absorbs water at the bottom of the whole capillary absorption process to ensure the one-dimensional transfer of water from the bottom to the inside of the concrete, without considering the influence factors such as some chemical reactions that occur after the contact between the constituents inside the concrete and water.
(3)
Only the different modification methods of recycled coarse aggregate and the number of freeze–thaw cycles were considered, and other influencing factors were not considered.
(4)
The initial capillary water absorption of the specimens is positively correlated with the number of freeze–thaw cycles, and the values are all positive.

4.2. Basic Form Determination

According to the previous relationship curve between the initial capillary water absorption of recycled concrete and the number of freeze–thaw cycles and the test data, by using Origin for fitting in various forms, the initial capillary water absorption and the number of freeze–thaw cycles of the specimens were obtained to obey a quadratic polynomial distribution, so that the expression of the prediction model is
S1 = A + BN + CN2
where S1 is the initial capillary water absorption of recycled concrete; A, B, and C are the influence factors of freeze–thaw cycles; N is the number of freeze–thaw cycles; and R2 is the fitted regression coefficient. Table 7, Table 8 and Table 9 describes the detailed fitting parameters
According to the data obtained, the regression analysis of the pre-capillary water absorption of different specimens at 0, 50, 100, and 200 freeze–thaw cycles was carried out, and the relationship between the coefficients of different freeze–thaw cycles and different numbers of freeze–thaw cycles was obtained. Table 10, Table 11 and Table 12 lists the detailed analysis and fitting.
The above tables show the prediction models of pre-capillary water absorption of different modified recycled concrete under different numbers of freeze–thaw cycles.
The fitted regression curve is shown in Figure 9.

4.3. Validation of the Model

The pre-capillary water absorption of 150 freeze–thaw cycles was substituted into the above model, and the calculated and measured values of the prediction model of the pre-capillary water absorption of recycled concrete at 150 freeze–thaw cycles were obtained to verify the accuracy of the above pre-capillary water absorption model. As shown in Figure 10, the difference between the measured and calculated values of capillary water absorption in freeze–thaw specimens in different media is small, and the mean values of the ratio between the measured and calculated values are 1.002196, 1.004881, and 0.989241, respectively, with standard deviations of 0.014466, 0.004166, and 0.006897, indicating that the calculated and measured values of the model have small errors and high fitting accuracy. Thus, they can be used as an experimental control for the capillary water absorption of modified recycled concrete under freezing and thawing cycles in different media.

5. SEM Micro-Mechanism Analysis

Jingyu Yang et al. [30] conducted electron microscopy tests and found that both single aggregate modification with water glass and composite modification with water glass and silane could improve the state of the interfacial transition zone, and the composite modification was better than the single modification. The unfrozen and thawed RAC group (ordinary recycled concrete) was selected as the control group; the RAC group with 250 water freeze–thaw cycles, the RAC group with 250 chloride freeze–thaw cycles, and the RAC group with 250 sulfate freeze–thaw cycles were selected as the test groups for the scanning electron microscope test; and the internal damage of the RAC group was observed in the freeze–thaw cycles under different media. The microscopic condition is shown below.
Figure 11 shows the microscopic morphology of the interior of the specimen when it is not frozen or thawed. As can be seen from Figure 11a, the surface of the specimen is relatively dense, and there is a penetrating crack in the interface transition zone, which provides a channel for moisture and other salts and corrosive substances to enter the concrete. As can be seen from Figure 11b, the interfacial transition zone is relatively smooth, the cracks are relatively smooth and flat, and there exist cement particles on the surface that have not yet been fully hydrated, as well as C-S-H gel produced by the hydration reaction and Ca(OH)2 crystals, etc., which are roughly uniformly distributed in the vicinity of the interfacial transition zone and are tightly connected, forming a mesh to fill the weak region of the interfacial transition zone, which makes the internal structure of recycled concrete denser in comparison with the other.
Figure 12 shows the microscopic morphology of the interior of the specimen at 250 freezing and thawing cycles in clear water, and it can be seen from Figure 12a that the cracks in the interfacial transition zone have expanded, and some new small holes and cracks have appeared on the surface. As can be seen in Figure 12b, the microcracks and holes increased significantly, the cracks were rougher and uneven, the gaps between the C-S-H gels became larger as well, the Ca(OH)2 crystals were arranged haphazardly, and the densities in the interfacial transition zone decreased. The reason for these phenomena is that water molecules penetrate the concrete interior through the pores and cracks, and through the freezing and expansion effect, the pores and cracks inside the concrete continue to expand, and new pores and cracks are generated, which leads to the loosening of the internal structure and causes damage.
Figure 13 shows the internal microscopic morphology of the specimen after 250 cycles of freeze–thaw cycles with chloride salts. As seen in Figure 13a, the surface appears to be more uneven, and the cracks and pores in the transition zone of the interface are extended significantly and increased in number. Figure 13b shows that the damage of the cracks in the interface transition zone is very serious, and the gaps between the needle-like calcite are larger, with almost no tight connection, and the arrangement is more chaotic and disorganized; additionally, it can be found that there is a lot of crystalline material near the interface transition zone, which indicates that the concrete specimen in the chlorine salt solution in the freeze–thaw cycle can not only withstand freezing and expansion, but it can also withstand the crystallization pressure due to the difference in concentration. Together, these two factors accelerated the destruction of the concrete.
Figure 14 shows the microscopic morphology of the specimen at 250 sulfate freezing and thawing cycles. Figure 14a shows that the interface transition zone is rough and uneven, and there are a lot of cracks and holes of different sizes, but it is slightly better than the case of chloride salt. As can be seen in Figure 14b, the cracks in the interfacial transition zone are uneven, with obvious signs of erosion, and the internal structure is loose. Xiao Q H et al. [31] conducted EDS test studies and found that there are a lot of disorganized needle-like calcite and gypsum and sulfate crystals in the interfacial transition zone; these substances fill the pores and squeeze the concrete, resulting in damage being caused to the concrete because it cannot withstand the expansion stresses, which indicates that water freezing and expansion pressure and salt crystallization pressure are also present in the specimen during freezing and thawing in sulfate, which accelerate the destruction of the concrete.

6. Conclusions

The mortar shedding on the surface of the recycled concrete increases with the number of freeze–thaw cycles and is accompanied by cracking, which is more serious in salt-mediated freeze–thaw environments, where mortar shedding, cracking, and coarse aggregate exposure are more severe.
The capillary water absorption curve of recycled concrete after freeze–thaw cycles in different media showed a three-stage growth, and the initial capillary water absorption rate in the whole capillary water absorption rate accounted for a large proportion of the dominant position; the capillary water absorption capacity of concrete is mainly determined by the initial capillary water absorption rate.
With the increase in the number of freeze–thaw cycles, the growth rate of the capillary water absorption of recycled concrete is slow and then fast, and the increasing rate of capillary water absorption by freeze–thaw using chloride salt is the fastest, followed by that of the sulfate solution, and clear water has the smallest rate. The initial water absorption rates of the WRAC group, GRAC group, and WGRAC group have different degrees of reduction compared with that of the RAC group, and the reduction in composite modification is the most obvious. Composite-modified recycled concrete can be used for construction in salty areas where there is a large difference in temperature between day and night; these areas are cold all year round.
The microstructure and product changes of recycled concrete in different freezing and thawing environments were obvious. The overall structure of the unfrozen and thawed concrete was relatively dense, and after clear water freezing and thawing, the interface transition zone increased significantly, and the surface structure was loose and uneven, accompanied by the emergence of micro-cracks and pores. After the salt solution freezing and thawing, the interface transition zone expansion was serious, and the transition region contained a large number of haphazard salt crystallization products.
A fitting regression analysis of the experimental data was carried out to establish the initial capillary water absorption model of modified recycled concrete under freezing and thawing cycles with different media, and the deviation of the measured value from the calculated value was very small, so it can provide a reference for the subsequent study of capillary water absorption of modified recycled concrete.
While this experiment studied a single salt for modified recycled concrete freeze–thaw erosion, the actual environment is more complex, as there is a variety of salt erosions occurring at the same time; thus, there is a need to carry out further research.

Author Contributions

Conceptualization, C.Z., W.L. and C.S.; methodology, C.Z., W.L., W.M. and J.Z.; software, C.Z. and S.X.; validation, C.Z., W.L. and J.C.; writing—original draft preparation, C.Z., W.L., J.C. and J.Z.; writing—review and editing, C.Z., W.L., J.C. and J.Z.; visualization, C.Z., J.C. and C.S.; project administration, C.Z., W.M., S.X., J.C. and J.Z.; funding acquisition, C.Z., W.M., S.X., J.C. and J.Z. All authors have read and agreed to the published version of the manuscript.

Funding

This research was funded by the National Natural Science Foundation of China (grant number 52208340), the State Key Laboratory of Bridge Structure Health and Safety (grant number BHSKL19-04-KF), the Project of Outstanding Young and Middle-aged Scientific and Technological Innovation Team in Hubei Universities and Colleges (grant number T2022010), and the Doctoral Start-up Fund of Hubei University of Technology (grant number BSQD2020051).

Institutional Review Board Statement

Not applicable.

Informed Consent Statement

Not applicable.

Data Availability Statement

The data used to support the findings of this study are available from the corresponding authors upon request. The data are not publicly available due to it is too private to be disclosed.

Conflicts of Interest

Author Chuheng Zhong, Weiqi Mao and Sijia Xin were employed by the company China Railway Major Bridge Engineering Group Co., Ltd. The remaining authors declare that the research was conducted in the absence of any commercial or financial relationships that could be construed as a potential conflict of interest.

References

  1. Pedro, D.; de Brito, J.; Evangelista, L. Influence of the use of recycled concrete aggregates from different sources on structural concrete, Constr. Build. Mater. 2014, 71, 141–151. [Google Scholar] [CrossRef]
  2. Tam, V.W.; Tam, C.M. A review on the viable technology for construction waste recycling. Resour. Conserv. Recycl. 2006, 47, 209–221. [Google Scholar] [CrossRef]
  3. Verian, K.P.; Ashraf, W.; Cao, Y. Properties of recycled concrete aggregate and their influence in new concrete production. Resour. Conserv. Recycl. 2018, 133, 30–49. [Google Scholar] [CrossRef]
  4. Kurda, R.; de Brito, J.; Silvestre, J.D. Water absorption and electrical resistivity of concrete with recycled concrete aggregates and fly ash. Cem. Concr. Compos. 2019, 95, 169–182. [Google Scholar] [CrossRef]
  5. Sasanipour, H.; Aslani, F. Durability properties evaluation of self-compacting concrete prepared with waste fine and coarse recycled concrete aggregates. Constr. Build. Mater. 2020, 236, 117540. [Google Scholar] [CrossRef]
  6. Li, Z.; Azman, M.N.A.; Jaya, R.P. Review of Research on Coarse Aggregate Reinforcement of Recycled Concrete. Construction 2023, 3, 135–141. [Google Scholar] [CrossRef]
  7. Christodoulou, C.; Goodier, C.I.; Austin, S.A.; Webb, J.; Glass, G.K. Long-term performance of surface impregnation of reinforced concrete structures with silane. Constr. Build. Mater. 2013, 48, 708–716. [Google Scholar] [CrossRef]
  8. Medeiros, M.; Helene, P. Efficacy of surface hydrophobic agents in reducing water and chloride ion penetration in concrete. Mater. Struct. 2008, 41, 59–71. [Google Scholar] [CrossRef]
  9. Zhu, Y.G.; Kou, S.C.; Poon, C.S.; Dai, J.G.; Li, Q.Y. Influence of silane-based water repellent on the durability properties of recycled aggregate concrete. Cem. Concr. Compos. 2013, 35, 32–38. [Google Scholar] [CrossRef]
  10. Al-Kheetan, M.J.; Byzyka, J.; Ghaffar, S.H. Sustainable valorization of silane-treated waste glass powder in concrete pavement. Sustainability 2021, 13, 4949. [Google Scholar] [CrossRef]
  11. Zou, D.; Wang, Z.; Shen, M.; Liu, T.; Zhou, A. Improvement in freeze-thaw durability of recycled aggregate permeable concrete with silane modification. Constr. Build. Mater. 2021, 268, 121097. [Google Scholar] [CrossRef]
  12. Wang, Q.; Bian, H.; Li, M.; Dai, M.; Chen, Y.; Jiang, H.; Zhang, Q.; Dong, F.; Huang, J.; Ding, Z. Effects of a Water-Glass Module on Compressive Strength, Size Effect and Stress–Strain Behavior of Geopolymer Recycled Aggregate Concrete. Crystals 2022, 12, 218. [Google Scholar] [CrossRef]
  13. Park, S.S.; Kim, Y.Y.; Lee, B.J.; Kwon, S.J. Evaluation of concrete durability performance with sodium silicate impregnants. Adv. Mater. Sci. Eng. 2014, 2014, 945297. [Google Scholar] [CrossRef]
  14. Zhang, B.; Gao, F.; Zhang, X.; Zhou, Y.; Hu, B.; Song, H. Modified cement-sodium silicate material and grouting technology for repairing underground concrete structure cracks. Arab. J. Geosci. 2019, 12, 680. [Google Scholar] [CrossRef]
  15. Al-Otaibi, S. Durability of concrete incorporating GGBS activated by water-glass. Constr. Build. Mater. 2008, 22, 2059–2067. [Google Scholar] [CrossRef]
  16. Luo, B.; Wang, D.; Mohamed, E. The process of optimizing the interfacial transition zone in ultra-high performance recycled aggregate concrete through immersion in a water glass solution. Mater. Lett. 2023, 338, 134056. [Google Scholar] [CrossRef]
  17. Zhang, H.; Xu, X.; Su, S.; Zeng, W. To improve the resistance of recycled aggregate concrete (RAC) to internal steel corrosion by the pre-treatment of aggregate. Constr. Build. Mater. 2021, 306, 124911. [Google Scholar] [CrossRef]
  18. Kagi, D.A.; Ren, K.B. Reduction of water absorption in silicate treated concrete by post-treatment with cationic surfactants. Build. Environ. 1995, 30, 237–243. [Google Scholar] [CrossRef]
  19. Gonen, T.; Yazicioglu, S.; Demirel, B. The influence of freezing-thawing cycles on the capillary water absorption and porosity of concrete with mineral admixture. KSCE J. Civ. Eng. 2015, 19, 667–671. [Google Scholar] [CrossRef]
  20. Luo, S.; Bai, T.; Guo, M.; Wei, Y.; Ma, W. Impact of Freeze–Thaw Cycles on the Long-Term Performance of Concrete Pavement and Related Improvement Measures: A Review. Materials 2022, 15, 4568. [Google Scholar] [CrossRef]
  21. Zhang, P.; Wittmann, F.H.; Vogel, M.; Müller, H.S.; Zhao, T. Influence of freeze-thaw cycles on capillary absorption and chloride penetration into concrete. Cem. Concr. Res. 2017, 100, 60–67. [Google Scholar] [CrossRef]
  22. del Bosque, I.S.; Van den Heede, P.; De Belie, N.; de Rojas, M.S.; Medina, C. Freeze-thaw resistance of concrete containing mixed aggregate and construction and demolition waste-additioned cement in water and de-icing salts. Constr. Build. Mater. 2020, 259, 119772. [Google Scholar] [CrossRef]
  23. Vega-Zamanillo, A.; Juli-Gandara, L.; Calzada-Perez, M.A.; Teijon-Lopez-Zuazo, E. Impact of temperature changes and freeze—Thaw cycles on the behavior of asphalt concrete submerged in water with sodium chloride. Appl. Sci. 2020, 10, 1241. [Google Scholar] [CrossRef]
  24. Xu, F.; Wang, S.; Li, T.; Liu, B.; Zhao, N.; Liu, K. The mechanical properties and resistance against the coupled deterioration of sulfate attack and freeze-thaw cycles of tailing recycled aggregate concrete. Constr. Build. Mater. 2021, 269, 121273. [Google Scholar] [CrossRef]
  25. Piasta, W.; Marczewska, J.; Jaworska, M. Durability of air-entrained cement mortars under combined sulfate and freeze-thaw attack. Procedia Eng. 2015, 108, 55–62. [Google Scholar] [CrossRef]
  26. Boudali, S.; Kerdal, D.E.; Ayed, K.; Abdulsalam, B.; Soliman, A.M. Performance of self-compacting concrete incorporating recycled concrete fines and aggregate exposed to sulfate attack. Constr. Build. Mater. 2016, 124, 705–713. [Google Scholar] [CrossRef]
  27. Mangi, S.A.; Ibrahim, M.H.W.; Jamaluddin, N.; Arshad, M.F.; Jaya, R.P. Short-term effects of sulfate and chloride on the concrete containing coal bottom ash as supplementary cementitious material. Eng. Sci. Technol. Int. J. 2019, 22, 515–522. [Google Scholar]
  28. Medeiros, M.H.F.; Helene, P. Surface treatment of reinforced concrete in the marine environment: Influence on chloride diffusion coefficient and capillary water absorption. Constr. Build. Mater. 2009, 23, 1476–1484. [Google Scholar] [CrossRef]
  29. Delobel, F.; Bulteel, D.; Mechling, J.M.; Lecomte, A.; Cyr, M.; Rémond, S. Application of ASR tests to recycled concrete aggregates: Influence of water absorption. Constr. Build. Mater. 2016, 124, 714–721. [Google Scholar] [CrossRef]
  30. Yang, J.; Guo, Y.; Tam, V.W.; Tan, J.; Shen, A.; Zhang, C.; Zhang, J. Feasibility of recycled aggregates modified with a compound method involving sodium silicate and silane as permeable concrete aggregates. Constr. Build. Mater. 2022, 361, 129747. [Google Scholar] [CrossRef]
  31. Xiao, Q.H.; Li, Q.; Cao, Z.Y.; Tian, W.Y. The deterioration law of recycled concrete under the combined effects of freeze-thaw and sulfate attack. Constr. Build. Mater. 2019, 200, 344–355. [Google Scholar] [CrossRef]
Figure 1. Interface diagram.
Applsci 14 01247 g001
Figure 2. Different modifiers soaking reinforced recycled coarse aggregates and drying process: (a) water glass solution modification; (b) silane solution modification; (c) composite modification of water glass solution + silane solution; (d) drying of aggregates.
Applsci 14 01247 g002
Figure 3. Modified strengthening mechanism diagram.
Applsci 14 01247 g003
Figure 4. Flow chart of capillary water absorption experimental device.
Applsci 14 01247 g004
Figure 5. Changes in apparent morphology of the RAC group under different freeze–thaw environments. (a) Not frozen and thawed; (b) water (50 times); (c) chlorine salt solution (50 times); (d) sulfate solution (50 times); (e) water (150 times); (f) chlorine salt solution (150 times); (g) sulfate solution (150 times); (h) water (250 times); (i) chlorine salt solution (250 times); (j) sulfate solution (250 times).
Applsci 14 01247 g005
Figure 6. Capillary water absorption before the number of freezing and thawing cycles in different media. (a) Freshwater freeze–thaw cycle; (b) sulfate freeze–thaw cycle; (c) chlorine salt freeze–thaw cycle.
Applsci 14 01247 g006
Figure 7. Freeze–thawing times of different media secondary capillary water absorption rate. (a) Freshwater freeze–thaw cycle; (b) sulfate freeze–thaw cycle; (c) chlorine salt freeze–thaw cycle.
Applsci 14 01247 g007
Figure 8. Capillary water absorption rates at the later stage of the freeze–thawing cycle for different media. (a) Freshwater freeze–thaw cycle; (b) sulfate freeze–thaw cycle; (c) chlorine salt freeze–thaw cycle.
Applsci 14 01247 g008
Figure 9. (a) clear water medium; (b) sulfate medium; (c) chloride salt medium.
Applsci 14 01247 g009
Figure 10. (a) Freshwater freeze-thaw cycle (b) Sulfate freeze-thaw cycle (c) Chlorine salt freeze-thaw cycle.
Applsci 14 01247 g010
Figure 11. Microscopic morphology of specimens in the RAC group without freeze–thaw; (a) 1000X and (b) 5000X.
Applsci 14 01247 g011
Figure 12. Microscopic morphology of RAC group specimens after 250 cycles of freezing and thawing in clear water; (a) 1000X and (b) 5000X.
Applsci 14 01247 g012
Figure 13. Microscopic morphology of test blocks in the RAC group after 250 cycles of freeze–thaw with chlorine salt solution; (a) 1000X and (b) 5000X.
Applsci 14 01247 g013
Figure 14. Microscopic morphology of specimens in the RAC group after 250 freeze–thaw cycles with sulfate solution; (a) 1000X and (b) 5000X.
Applsci 14 01247 g014
Table 1. Basic cement properties.
Fineness/%Firing Loss/%Setting Time/minCompressive Strength/MPaWater for Standard Consistency/%Stability
Initial Setting TimeFinal Setting Time
0.34.3611414149.830Up to standard
Table 2. Class Ⅰ fly ash.
CategoryFineness/%Firing Loss/%Water Requirement/%
Class I fly ash8.13.2≤95
Table 3. S95 mineral powder.
CategoryDensitySpecific Surface AreaActivity Index
S95 mineral powder2.85420105
Table 4. Basic performance indicators of coarse aggregates.
CategoryGrain Size/mmApparent Density/(kg·m3)Crushing IndexWater Absorption Rate/(%)
Natural Coarse Aggregate4.75 mm–31.5 mm248023.543.3
Recycled Coarse Aggregate4.75 mm–31.5 mm27757.80.42
Table 5. Mixing ratios of recycled concrete.
Specimen TypeCement/
(kg·m3)
Natural Coarse Aggregate/(kg·m3)Recycled Coarse Aggregate/(kg·m3)River Sand/
(kg·m3)
Fly Ash/
(kg·m3)
Mineral Powder/
(kg·m−3)
Additives/(kg·m−3)Water/(kg·m3)Waterglass/(kg·m3)Silane/(kg·m3)
RAC32183835963568682.716000
WRAC32183835963568682.71601400
GRAC32183835963568682.7160085
WGRAC32183835963568682.716014085
Table 6. Measurement time and allowable error.
Time0.5 h1 h2 h4 h8 h12 h1 d2 d3 d4 d5 d6 d7 d
Allowable error2 min2 min5 min5 min5 min5 min2 h2 h2 h2 h2 h2 h2 h
Table 7. Fitting parameters of capillary water absorption in clear water before freezing and thawing.
NumberAB
RAC1.41 × 10−4−0.003120.999
WRAC9.36 × 10−5−0.001980.997
GRAC8.94 × 10−5−0.003550.999
WGRAC6.04 × 10−5−3.6 × 10−40.998
Table 8. Fitting parameters of capillary water absorption in the pre-freeze–thaw period with sulfate.
NumberAB
RAC1.166 × 10−40.010190.994
WRAC9.94 × 10−50.005870.997
GRAC9.262 × 10−50.002820.999
WGRAC6.097 × 10−50.004090.996
Table 9. Fitting parameters of capillary water absorption in the pre-freeze–thaw period with chloride salt.
NumberAB
RAC7.942 × 10−50.023290.997
WRAC6.317 × 10−50.018670.997
GRAC6.991 × 10−50.011460.993
WGRAC5.2 × 10−60.015300.964
Table 10. Freeze–thaw initial capillary water absorption prediction model for clear water medium.
NumberPredictive ModelsR2
RACy = (1.410 × 10−4) x2 − 0.00312x + 4.4690.999
WRACy = (9.36 × 10−5x2 − 0.00198x + 4.3000.997
GRACy = (8.94 × 10−5) x2 − 0.00355x + 4.2600.999
WGRACy = (6.04 × 10−5) x2 + (−3.64 × 10⁻⁴) x + 3.9100.998
Table 11. Freeze–thaw initial capillary water absorption prediction model for sulfate medium.
NumberPredictive ModelsR2
RACy = (1.166 × 10−4) x2 + 0.01019x + 4.4600.994
WRACy = (9.94 × 10−5) x2 + 0.00587x + 4.2800.997
GRACy = (9.262 × 10−5) x2 + 0.00282x + 4.2520.999
WGRACy = (6.097 × 10−5) x2 + 0.00409x + 3.9370.996
Table 12. Freeze–thaw initial capillary water absorption prediction model for chloride salt medium.
NumberPredictive ModelsR2
RACy = (7.942 × 10−5) x2 + 0.02329x + 4.5440.997
WRACy = (6.317 × 10−5) x2 + 0.01867x + 4.3530.997
GRACy = (6.991 × 10−5) x2 + 0.01146x + 4.3350.993
WGRACy = (5.2 × 10−6) x2 + 0.0153x + 4.0250.964
Disclaimer/Publisher’s Note: The statements, opinions and data contained in all publications are solely those of the individual author(s) and contributor(s) and not of MDPI and/or the editor(s). MDPI and/or the editor(s) disclaim responsibility for any injury to people or property resulting from any ideas, methods, instructions or products referred to in the content.

