Article

Efficacy of Cold Atmospheric Plasma on Pathogenicity of Oral Microcosm Biofilms

Department of Dental Hygiene, Gachon University College of Health Science, Incheon 21936, Republic of Korea
Appl. Sci. 2024, 14(3), 1211; https://doi.org/10.3390/app14031211
Submission received: 4 January 2024 / Revised: 30 January 2024 / Accepted: 30 January 2024 / Published: 31 January 2024
(This article belongs to the Special Issue Oral Microbial Communities and Oral Health (3rd Edition))

Abstract

:
This study aimed to compare the longitudinal efficacy between chlorhexidine gluconate (CHX; 0.12%) and cold atmospheric plasma (CAP) in reducing oral biofilm pathogenicity, utilizing a quantitative light-induced fluorescence-digital (QLF-D) camera. Oral microcosm biofilms were developed for 2 days on 57 hydroxyapatite disks. These biofilms were treated with distilled water for 1 min, CHX for 1 min, and CAP for 2 min over the course of 6 days. The red fluorescence intensities of the biofilms were measured using a QLF-D and expressed as pre- and post-treatment red/green ratios (RatioR/G). The bacterial viability (ratio of the green-stained area to the total stained area, RatioG/G+R) was calculated using live/dead bacterial staining; the total and aciduric bacterial counts were determined. A significant intergroup difference was found between RatioR/G changes according to the treatment period (p < 0.001). The RatioR/G observed within the CAP-treated group was significantly lower compared with the CHX-treated group at every interval of measurement (p < 0.001). The CAP-treated group also exhibited a lower RatioG/G+R and more weakened bacterial aggregation compared with the CHX-treated group (p < 0.05). In the group treated with CAP, the counts of both total and aciduric bacteria were substantially reduced compared with the DW group, with a statistically significant reduction (p < 0.001). Therefore, CAP may be more effective in minimizing oral microcosm biofilm pathogenicity than 0.12% CHX.

1. Introduction

Biofilm-associated oral diseases, which impact approximately 3.5 billion individuals globally, predominantly originate from the accumulation of oral biofilms at inaccessible stagnation sites, the removal of which poses a significant challenge [1]. Accumulated biofilms progressively transform into metabolically altered environments within the oral cavity, resulting in the formation of spatially heterogeneous microbial communities [2]. This phenomenon disrupts the dynamic stability of the oral microbiota, leading to ecological shifts that amplify the pathogenicity of oral biofilms [3]. Therefore, controlling the formation of oral biofilms is essential for preventing and managing oral diseases [4].
Although mechanical methods, such as tooth brushing or flossing, are recommended for oral biofilm removal, accessing some regions of the oral cavity using such tools is difficult owing to dental morphology. Supplementary methods, such as the use of antimicrobial mouthwashes, have also been used to control oral biofilm accumulation. However, prolonged or excessive use has been connected to various side effects, such as oral irritation and hyposalivation with alcohol-based mouthwashes, and tooth discoloration, altered taste sensation, and oral mucosal irritation with chlorhexidine gluconate (CHX)-based mouthwashes [5,6]. Moreover, the indiscriminate use of antimicrobial mouthwashes may disrupt the homeostatic balance between oral microorganisms and lead to the proliferation of resistant bacteria or fungi [7,8]. Therefore, novel technologies that could selectively target clinical sites and simultaneously inhibit biofilm accumulation must be developed to reduce the incidence of adverse effects associated with antimicrobial treatment.
Cold atmospheric plasma (CAP), a partially ionized gas comprising a mixture of neutral atoms, molecules, ions, and free electrons produced under conditions of atmospheric pressure and room temperature, is distinct from other plasmas that typically require high temperatures [9]. This technology has attracted interest in the dental field in recent years owing to its demonstrated safety in living tissues [10]. CAP jet, a technique used for CAP generation, can produce plasma at a certain distance from electrodes, facilitating localized application to the target area. CAP has been used for various purposes in dentistry, such as sterilization and disinfection, biofilm removal, the surface modification of dental implants, tooth whitening, oral lesion treatment, and root canal disinfection [11]. CAP produces reactive species, such as reactive oxygen and nitrogen species (RONS), that can disrupt and inactivate microorganisms, thereby facilitating biofilm removal [10,12]. A previous study reported the presence of cytoplasmic efflux in Streptococcus mutans following exposure to nitrogen-based CAP for 2 or 10 min [13]. This phenomenon was attributed to the RONS generated during the CAP application inducing cell wall erosion or cell membrane disruption through substantial electrostatic forces [8]. Furthermore, RONS can stimulate the oxidation of integral bacterial components, such as polysaccharides, proteins, lipids, and nucleic acids [12].
The antibacterial efficacy of CAP has been established in previous studies using single- and multispecies biofilm models [12,14,15]. One report found that argon-based CAP brush application to Streptococcus or Lactobacillus biofilms for 60 s resulted in complete sterilization [16]. Similarly, another study reported a significant reduction in colony-forming units (CFUs) that was observed in multispecies biofilms following argon-based CAP treatment for up to 600 s [17]. However, the clinical relevance of such biofilm models is limited due to the complexity of the oral microbial ecosystem, which comprises over 1000 different bacteria species [18]. Thus, the accurate evaluation of the antibacterial effects of CAP in biofilm models that mimic the compositional conditions of biofilms in the oral cavity, rather than specific species, is necessary. To date, few studies have reported on such evaluations.
Interactions among metabolically diverse species of bacteria found within the oral cavity can be simulated using oral microcosm biofilm models, which employ human saliva as the starting culture [19], thereby lending these models significant validity as in vitro simulation models capable of closely emulating the oral biofilm environment [20]. The accumulation of extracellular matrix molecules over time results in biofilm formation in three-dimensional structures, which can provide protection to the bacteria against antibiotic treatments [21]. For example, the dense matrix of extracellular polymeric substances (EPSs) produced by biofilms as they mature can act as a barrier against antibacterial agent penetration. Therefore, this study aimed to enhance the clinical applicability of in vitro findings by longitudinally monitoring the antibacterial efficacy of CAP with 0.12% CHX using an oral microcosm biofilm model and quantitative light-induced fluorescence-digital imaging (QLF-D Biluminator™2+; Inspektor Research Systems BV, Amsterdam, The Netherlands).

2. Materials and Methods

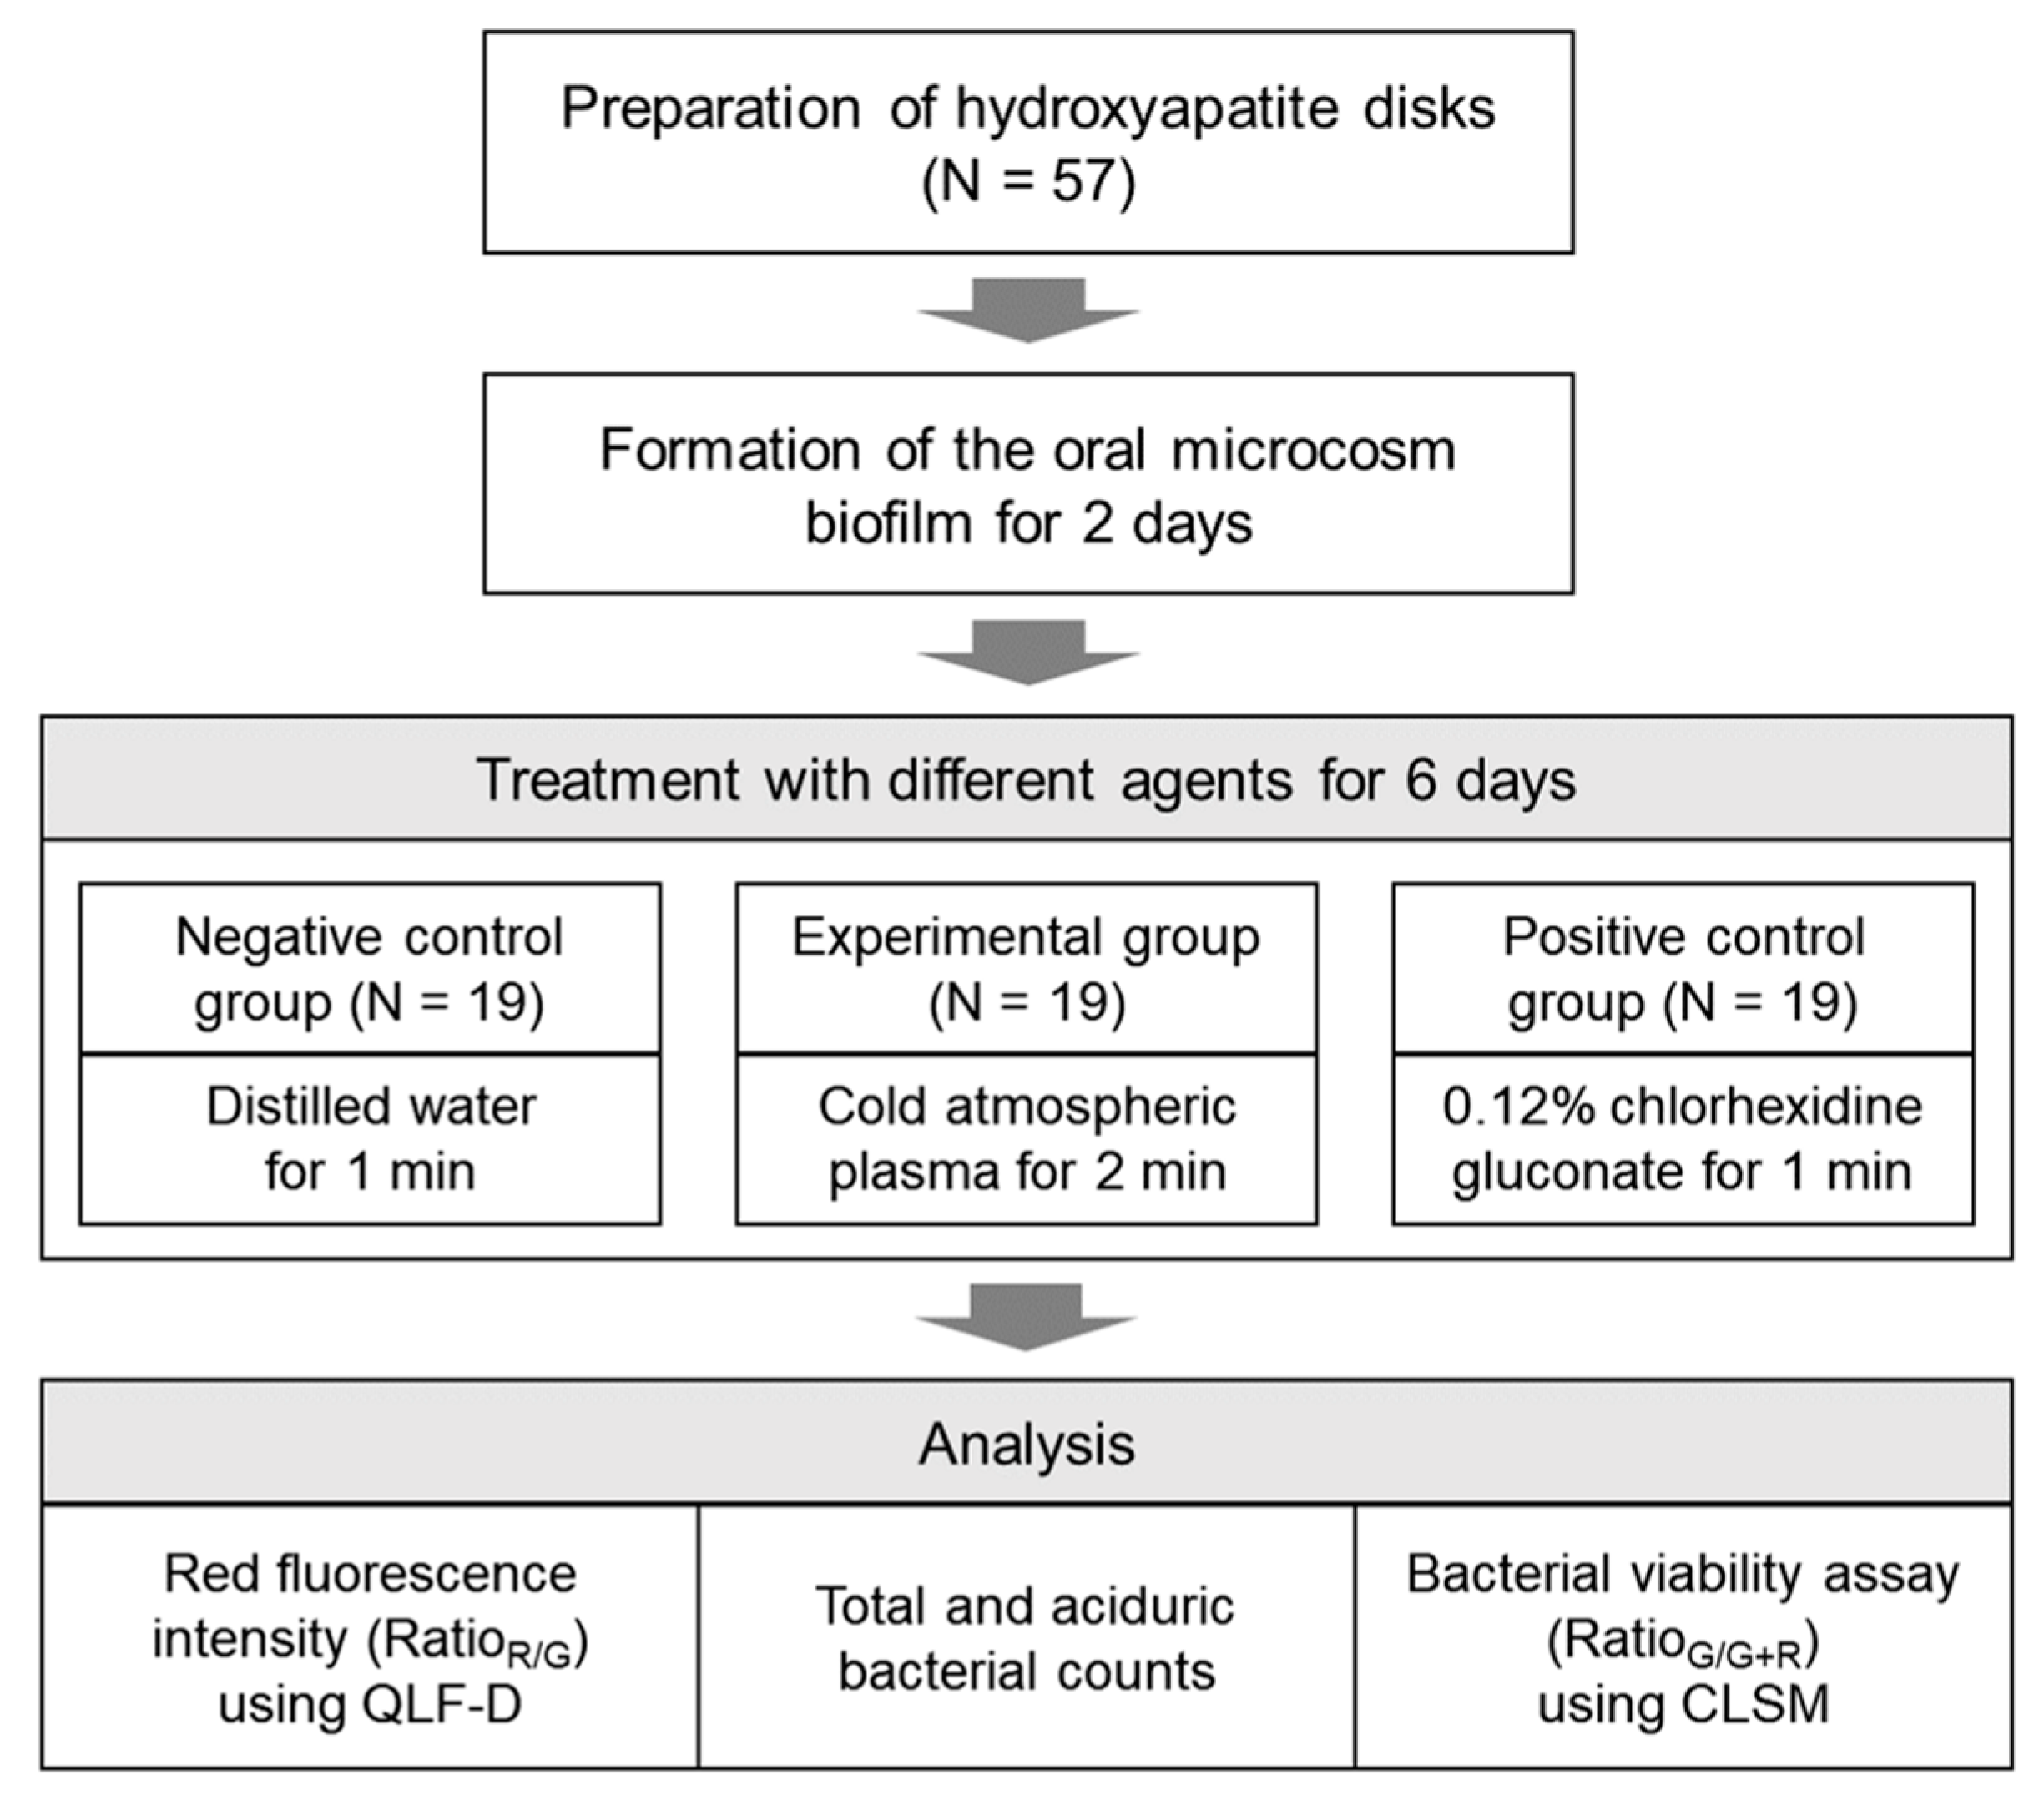
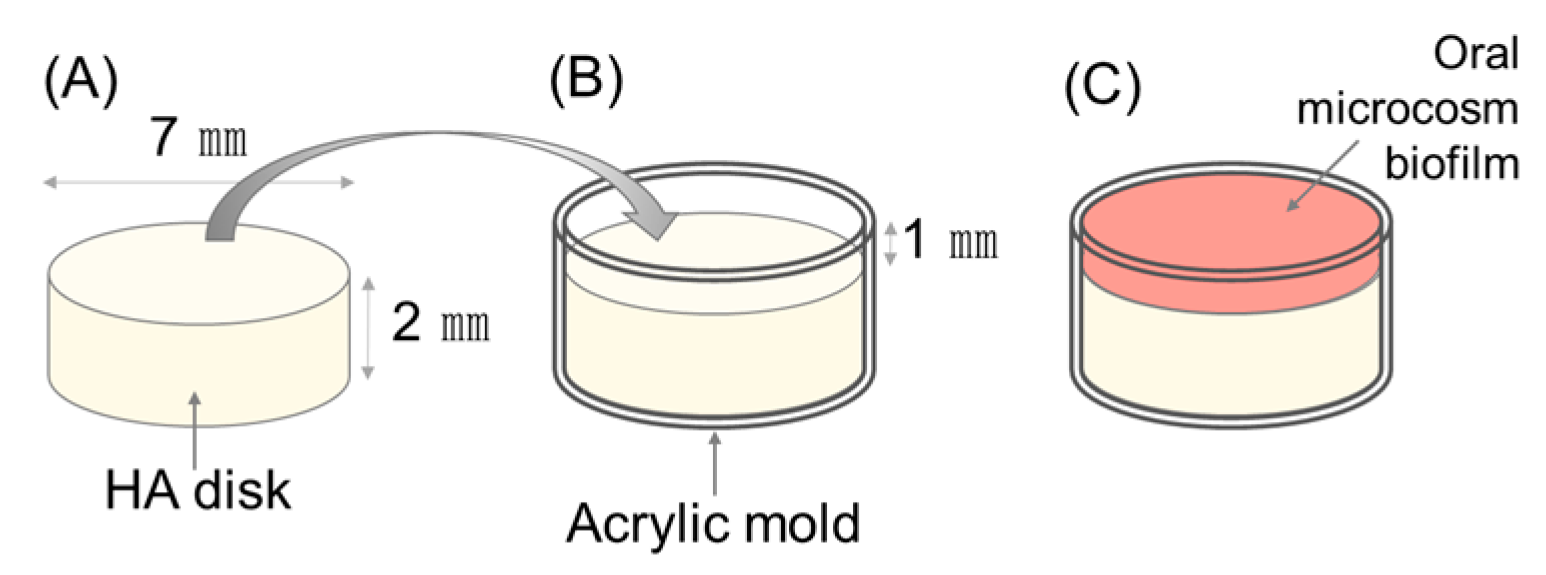
2.1. Establishing the Number of Samples and Preparation of Specimens

Utilizing G*Power software version 3.1 (Heinrich Heine University Düsseldorf, Düsseldorf, Germany), the sample size was established: a total of 57 samples would be necessary to perform a one-way analysis of variance (ANOVA) encompassing analysis between the three groups. Based on preliminary experimental results, the estimated effect size was determined to be 0.43, considering an alpha error probability of 0.05 and a statistical power of 0.80.
Fifty-seven hydroxyapatite (HAP) disks (Himed Inc., Old Bethpage, NY, USA), each measuring 7 mm in diameter and 2 mm in height, were prepared [22]. The disk surfaces were ground using sandpaper (400–1200 grit) and a polishing machine (M-PREP 5TM; Allied High Tech Products, Inc., Compton, CA, USA) (Figure 1 and Figure 2A). Each HAP disk was positioned within an acrylic mold in accordance with the protocols outlined in a previous study [22], ensuring that a space of 1 mm was maintained above the disk for biofilm formation (Figure 2B). Following their preparation, the specimens underwent sterilization with ethylene oxide gas.

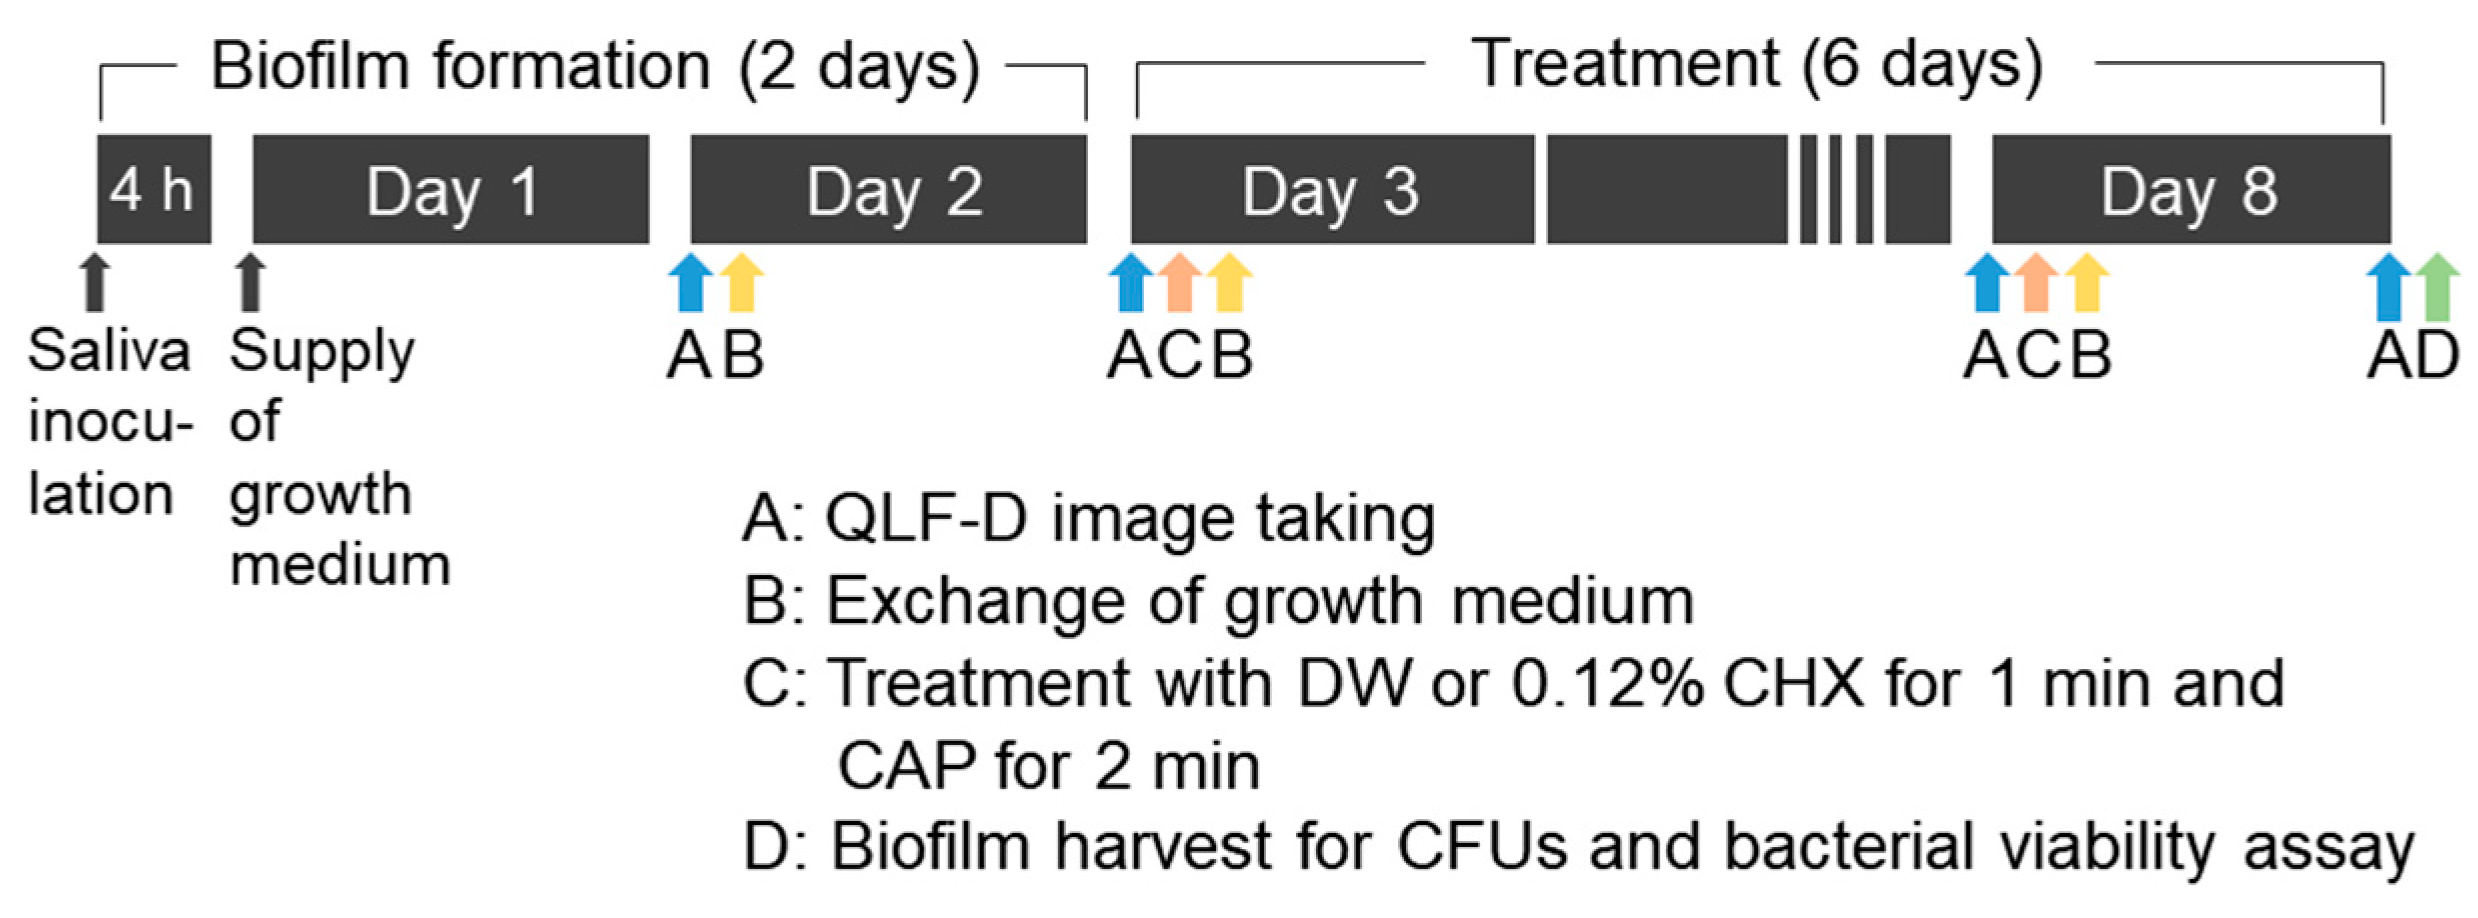
2.2. Development of the Oral Microcosm Biofilm

The Institutional Review Board of Gachon University granted approval for this study under reference number 1044396-202107-HR-165-01. The entire experimental process adhered to the relevant guidelines and ethical standards, particularly those concerning the use of human saliva. Saliva donors received a detailed explanation regarding the purpose and methods of the study and their rights as participants. This explanation included information on how their saliva would be used, the confidentiality of their personal data, and their right to withdraw from the study at any point without any consequences. Each donor provided written informed consent, where they acknowledged their understanding of the study and agreed to participate. Stimulated saliva was collected from three donors aged 22.67 ± 2.08 years without active dental caries, periodontal disease, or a history of antibiotic use within the preceding three months. Prior to saliva collection, donors were advised to avoid oral hygiene activities for 24 h to maintain the natural state of the oral microbiome [22,23]. All collected samples were anonymized and handled following strict confidentiality protocols. Personal information was securely stored, accessible only to authorized personnel, and used solely for this study. The collected stimulated saliva was passed through sterilized glass wool (Duksan Chemicals, Ansan, Republic of Korea). Thereafter, the specimens were placed in 24-well cell culture plates (SPL Life Sciences, Pocheon, Republic of Korea). Subsequently, saliva (1.5 mL) was inoculated and the specimens were incubated for 4 h at 37 °C with 10% CO2 (BB15 CO2 incubator; Thermo Fisher Scientific, Waltham, MA, USA). The saliva from each specimen was carefully removed and a fresh medium (pH, 7.0) containing 0.5% sucrose (0.1 mL) and basal medium mucin (1.4 mL) was applied to each specimen. The medium was routinely replaced at a consistent time over a period of 2 days, during which oral microcosm biofilms were cultivated at 37 °C in a 10% CO2 environment (Figure 1, Figure 2C and Figure 3) [23,24,25].

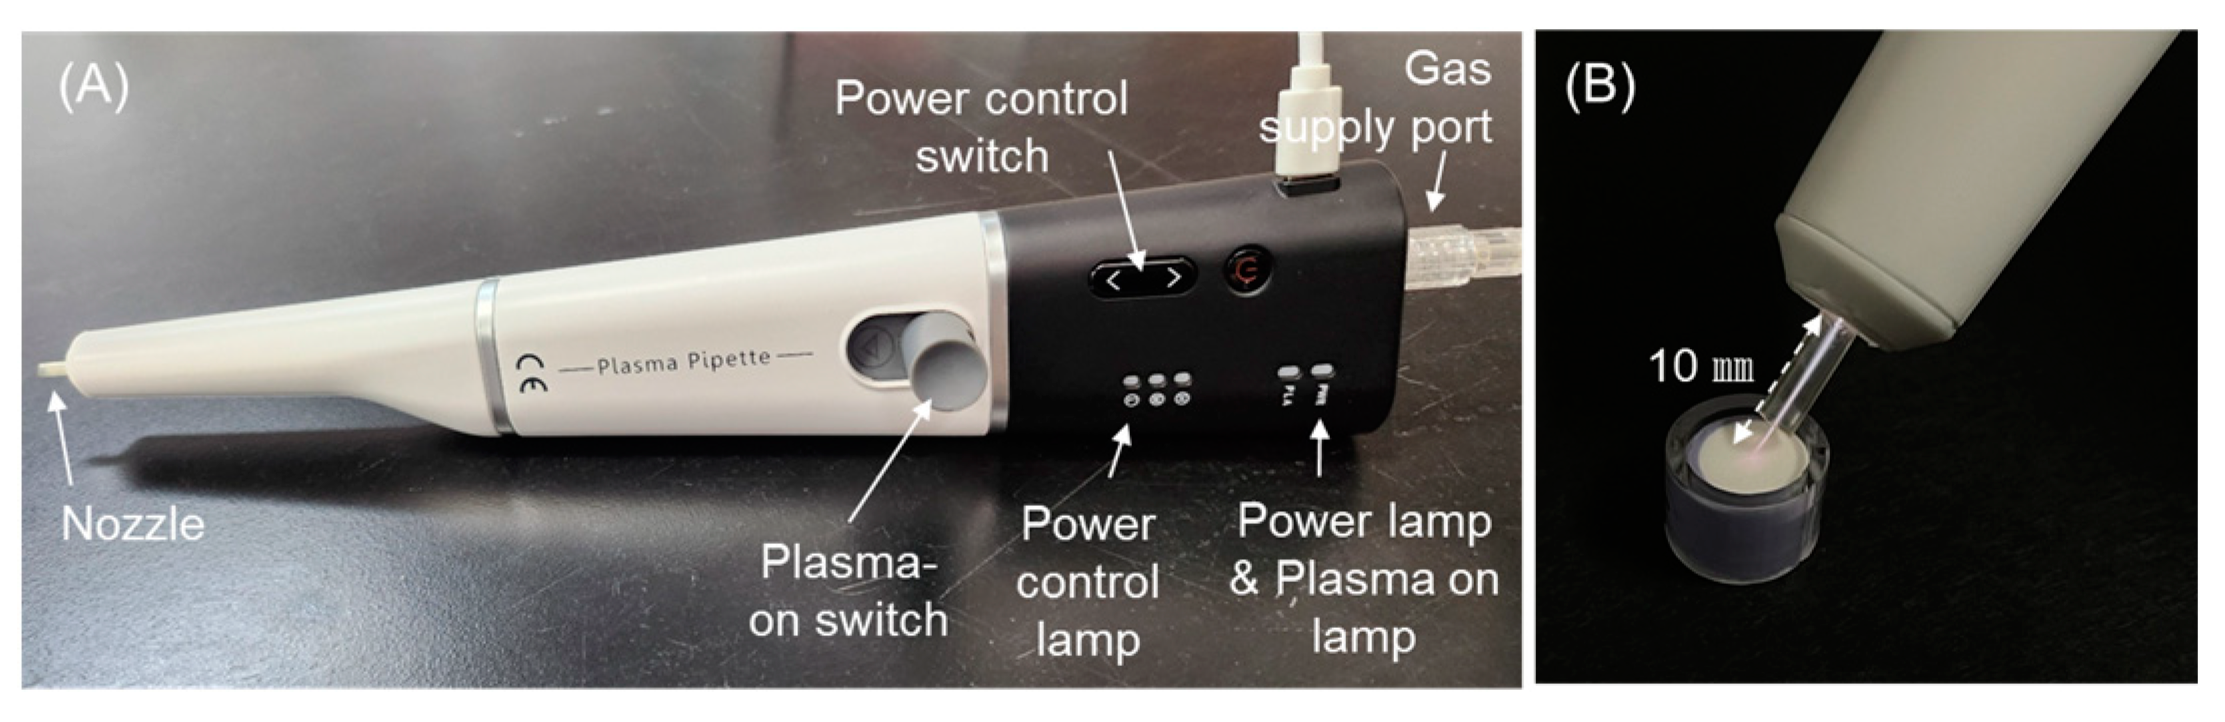
2.3. Plasma Treatment

CAP treatment was performed using an argon-based plasma pipette (Femto Science, Hwaseong, Republic of Korea; Figure 4A) at a power of 4 W, voltage of 10 kV, and frequency of 100 kHz [22]. The output pressure of the regulator was set to 0.02 MPa, with the flow rate being controlled through a dedicated flow controller [22]. In addition, the temperature of the plasma column was maintained at 40 °C. The CAP jet was applied for 2 min, maintaining a consistent distance of 10 mm between the top of the nozzle of the handpiece and the biofilm (Figure 4B). Biofilms that were not exposed to CAP received 1.5 mL of distilled water (DW) for 1 min as a negative control group and 1.5 mL of 0.12% CHX (Hexamedine; Bukwang Pharm. Co., Ltd., Ansan, Republic of Korea) as a positive control group. All specimens were rinsed thrice with 1.5 mL of phosphate-buffered saline (PBS; Welgene, Gyeongsan, Republic of Korea) post-treatment to eliminate any residual antimicrobial agents. Fresh medium (1.5 mL) was added after completing all antibacterial treatments. All biofilms were stored in a 10% CO2 environment at 37 °C following each treatment. The treatments were repeated once daily for 6 days (Figure 1 and Figure 3).

2.4. Evaluating the Intensity of Red Fluorescence

The biofilms were subjected to daily imaging using blue light from a QLF-D camera throughout the biofilm formation phase and the entire duration of the antibacterial treatment (Figure 3 and Figure 5A,B). For capturing images using blue light, the camera settings were adjusted to a shutter speed of 1/60 s, an aperture value set at f/7.1, and an ISO level fixed at 1600. In addition, a distance of 10 cm was kept between the biofilm and the camera lens during the imaging process to ensure consistency and accuracy. Fluorescent images of the biofilms were then taken at room temperature. Image PRO version 10 (Media Cybernetics, Inc., Silver Spring, MD, USA) was used for assessing the red fluorescence intensity in the captured images. The red and green intensities for each biofilm image were analyzed using identically sized regions of interest (Figure 5C). The RatioR/G, defined as the ratio of the red intensity to the green intensity, was then calculated. A higher RatioR/G value indicated stronger biofilm pathogenicity [26].

2.5. Bacterial Viability Assay

After rinsing the biofilm-covered HAP disk specimens with PBS (1.5 mL) thrice to remove free-floating bacteria after completing the antibacterial treatment, each specimen was moved into a conical tube containing PBS (1 mL). To prepare the biofilm suspensions, the samples underwent a dual mechanical disruption process, whereby the samples were subjected to treatment for 1 min each using a vortex mixer (VM-96A; Lab Companion, Seoul, Republic of Korea) and an ultrasonic vibrator (SHB-1025; Saehan Sonic, Seoul, Republic of Korea). A LIVE/DEAD BacLight Bacterial Viability Kit (Invitrogen, Waltham, MA, USA) was then employed to evaluate bacterial viability according to the manufacturer’s guidelines. SYTO-9 and propidium iodide (PI) were combined in equal proportions and used to distinguish living bacteria from those that were non-viable. SYTO-9, which is capable of permeating cellular membranes, produces green fluorescence in the presence of live bacteria. Conversely, PI, which is unable to penetrate intact cellular membranes, stains only those cells with damaged membranes, resulting in red fluorescence. When both dyes coexist within a cell, PI’s stronger nucleic acid affinity dominates, leading to the cell exhibiting only red fluorescence. Consequently, when using this dual-staining method, bacteria that are alive are indicated by green fluorescence, whereas non-viable bacteria are characterized by red fluorescence [27]. Dye mixture (3 µL) was added to the biofilm suspension (1 mL) and allowed to react at 37 °C for 15 min in a dark room. Subsequently, 5 µL of the stained suspension was imaged at 100× magnification using ZEN 2009 software and confocal laser scanning microscopy (CLSM; Zeiss LSM 700; Carl Zeiss, Inc., Oberkochen, Germany), performed at an excitation wavelength of 488 nm and an emission wavelength of 555 nm. Image Pro software was used to analyze the green and red intensities across the full image area. The ratio of the green-stained area to the total stained area (RatioG/G+R) was calculated and presented as bacterial viability, with higher values indicating higher bacterial survival rates [28].

2.6. Evaluation of Colony Count

The biofilm suspensions were prepared as previously described, diluted further via multiple steps (10−1 to 10−6), and inoculated onto two types of agar plates: (1) brain–heart infusion (BHI) agar (Becton Dickinson and Co., Frankin Lakes, NJ, USA) with a final pH of 4.8 to promote aciduric bacteria growth, which is critical in the pathogenesis of dental caries, and (2) tryptic soy blood (TSB) agar (Becton Dickinson and Co.) with a final pH of 7.0 containing 5% sheep blood (Kisanbio, Seoul, Republic of Korea) to facilitate the growth of a broader range of oral bacteria, thereby providing a comprehensive overview of the total bacterial load. After adding 100 µL of suspension to each plate and incubating for 72 h, the total and aciduric bacterial colonies were tallied, expressed as log CFUs/mL.

2.7. Statistical Analysis

The analysis of all data was performed with IBM SPSS Statistics version 28.0 (SPSS Inc., Chicago, IL, USA), setting the significance level at 0.05. Normality tests were conducted for all outcomes. A repeated-measures one-way ANOVA was performed to examine the interaction effects between the treatment substances and treatment period with Tukey’s post hoc analysis for between-group comparisons within the same treatment period. One-way ANOVA was also used to compare the differences in bacterial viability, the total bacterial count, and the aciduric bacterial count according to the antibacterial treatment method with Tukey’s post hoc analysis to determine the inter-group differences.

3. Results

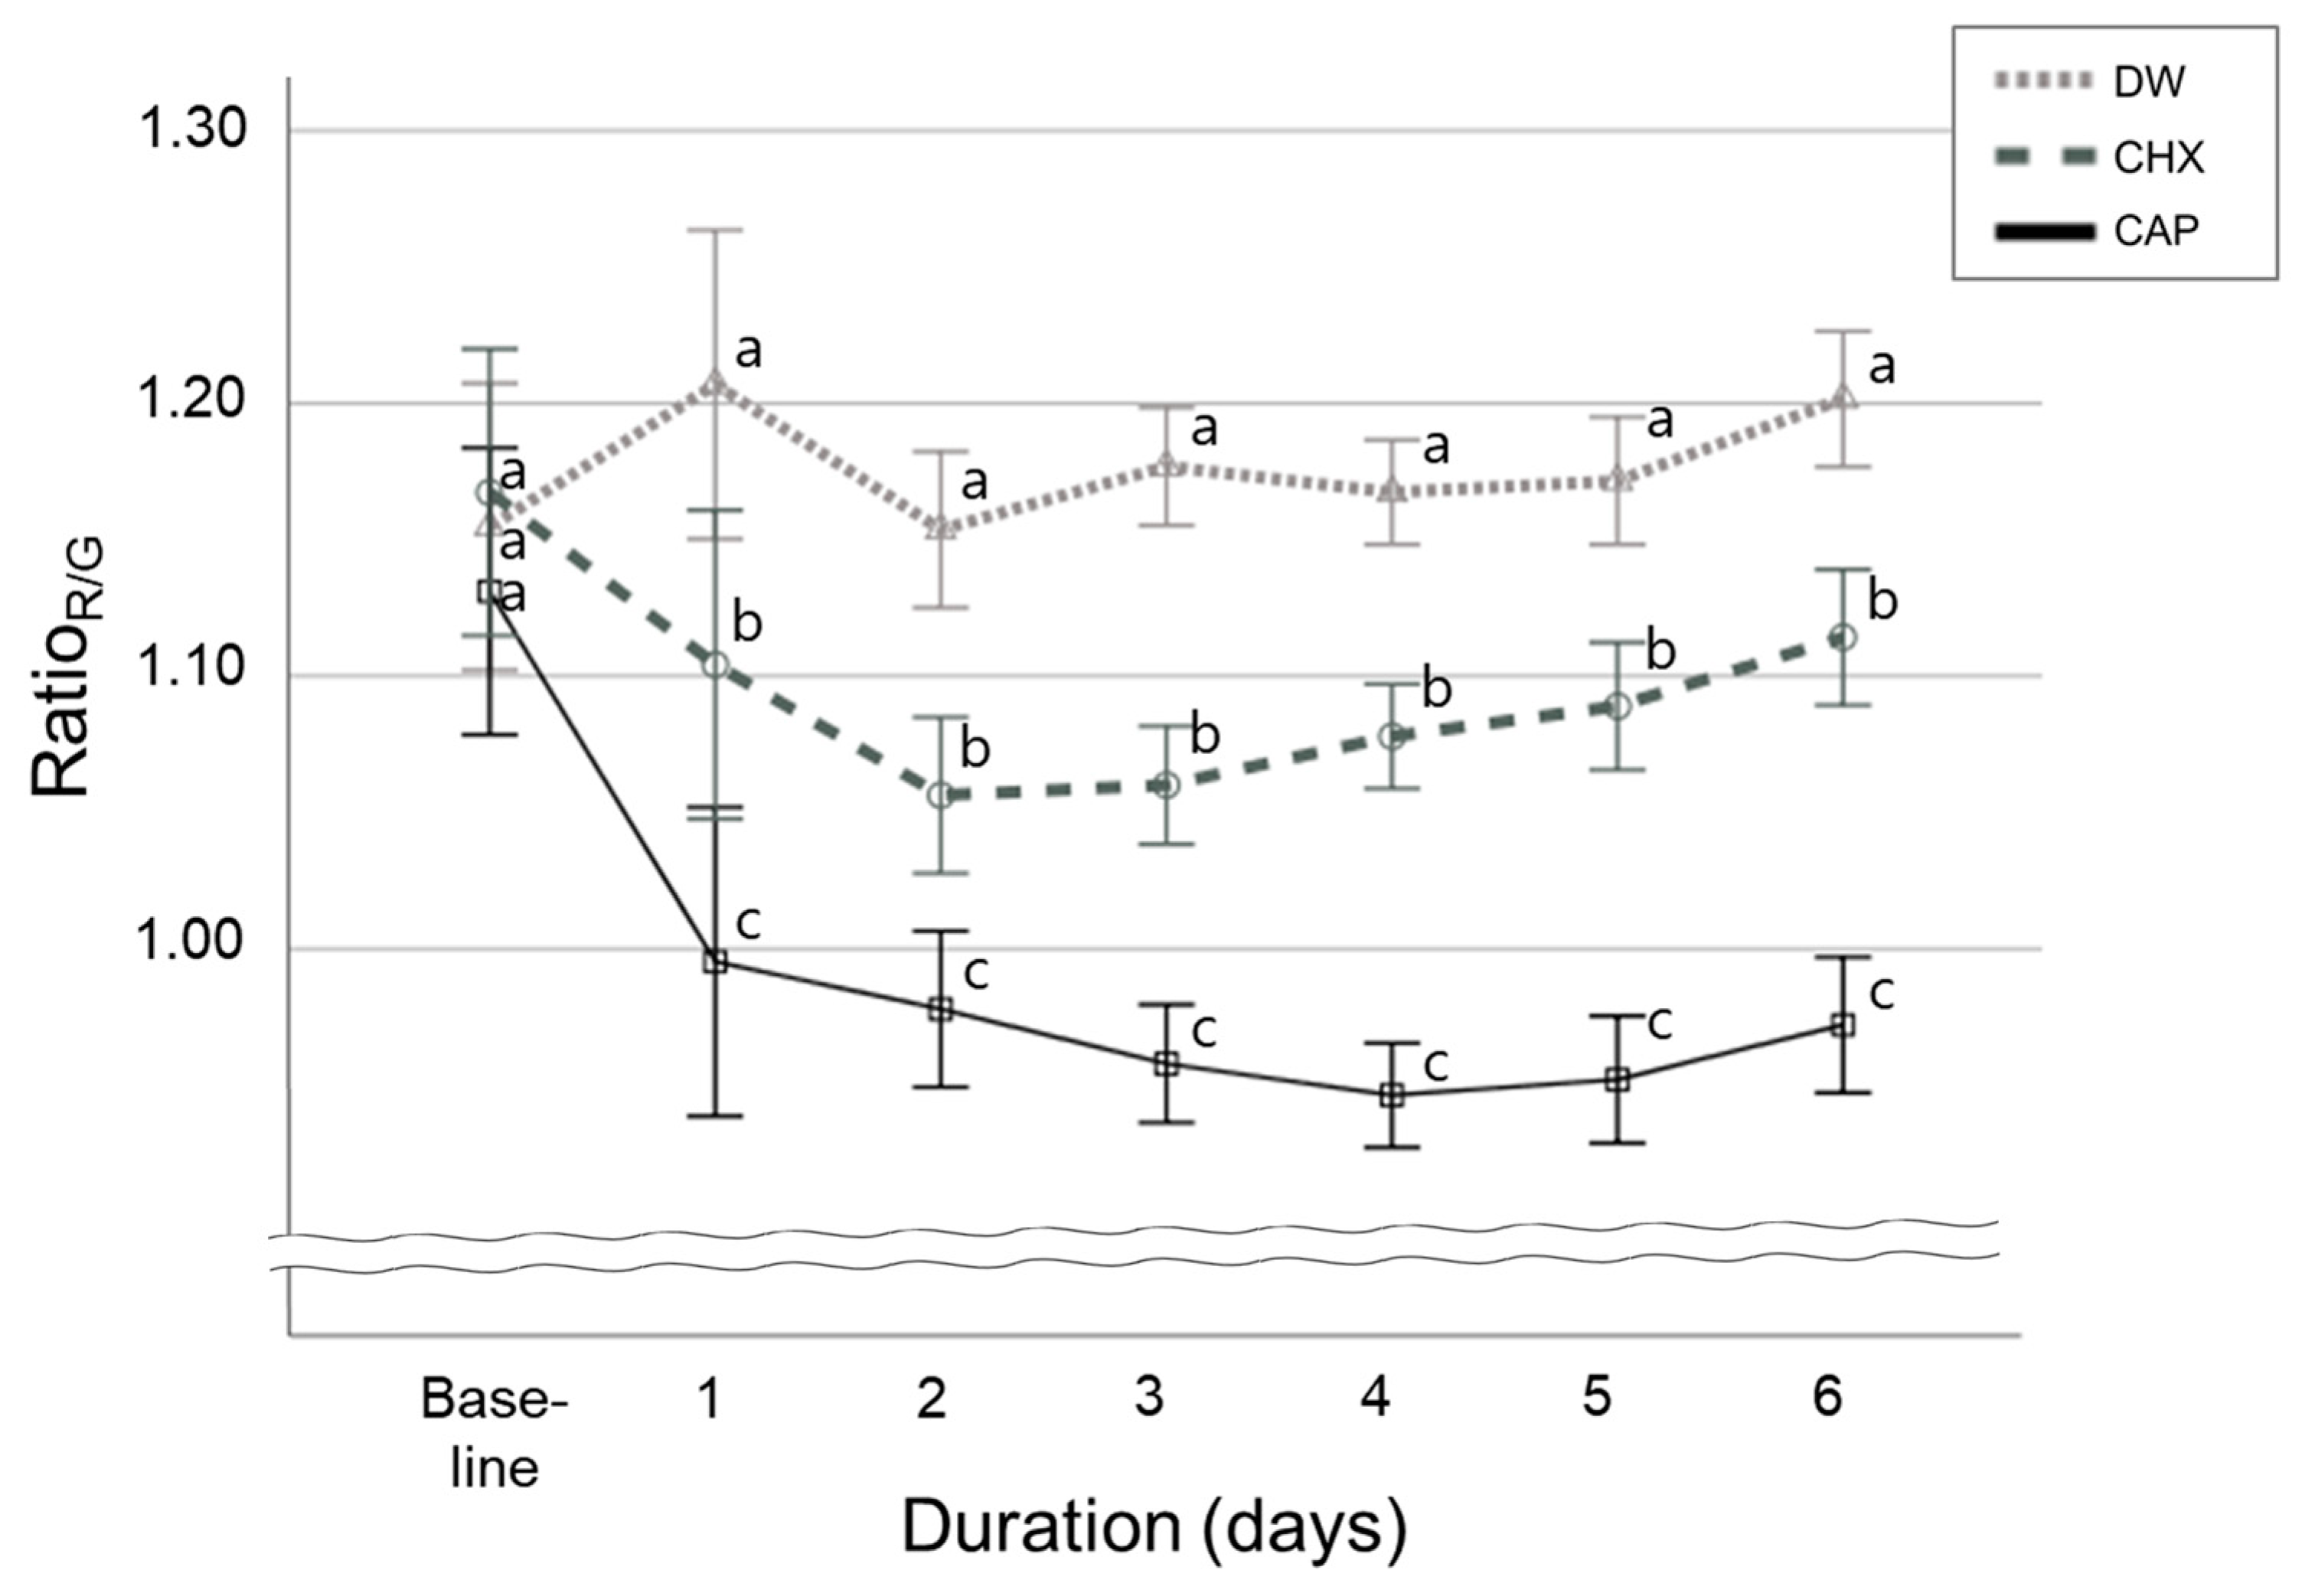
3.1. Red Fluorescence Signal Strength in Oral Microcosm Biofilms

The interaction effect between the treatment materials and time periods significantly impacted the RatioR/G (p < 0.001, Figure 6). Figure 6 illustrates the shift in the RatioR/G trend for the CHX group, showing an increase from day 2 onwards. In contrast, a continuous decrease in the RatioR/G was found in the CAP group up to day 4. Notably, the CAP group demonstrated the most substantial reduction in the RatioR/G from the baseline (p < 0.001, Figure 6), and was significantly lower than that in the CHX group at each treatment time point (adjusted p < 0.001, Figure 6).

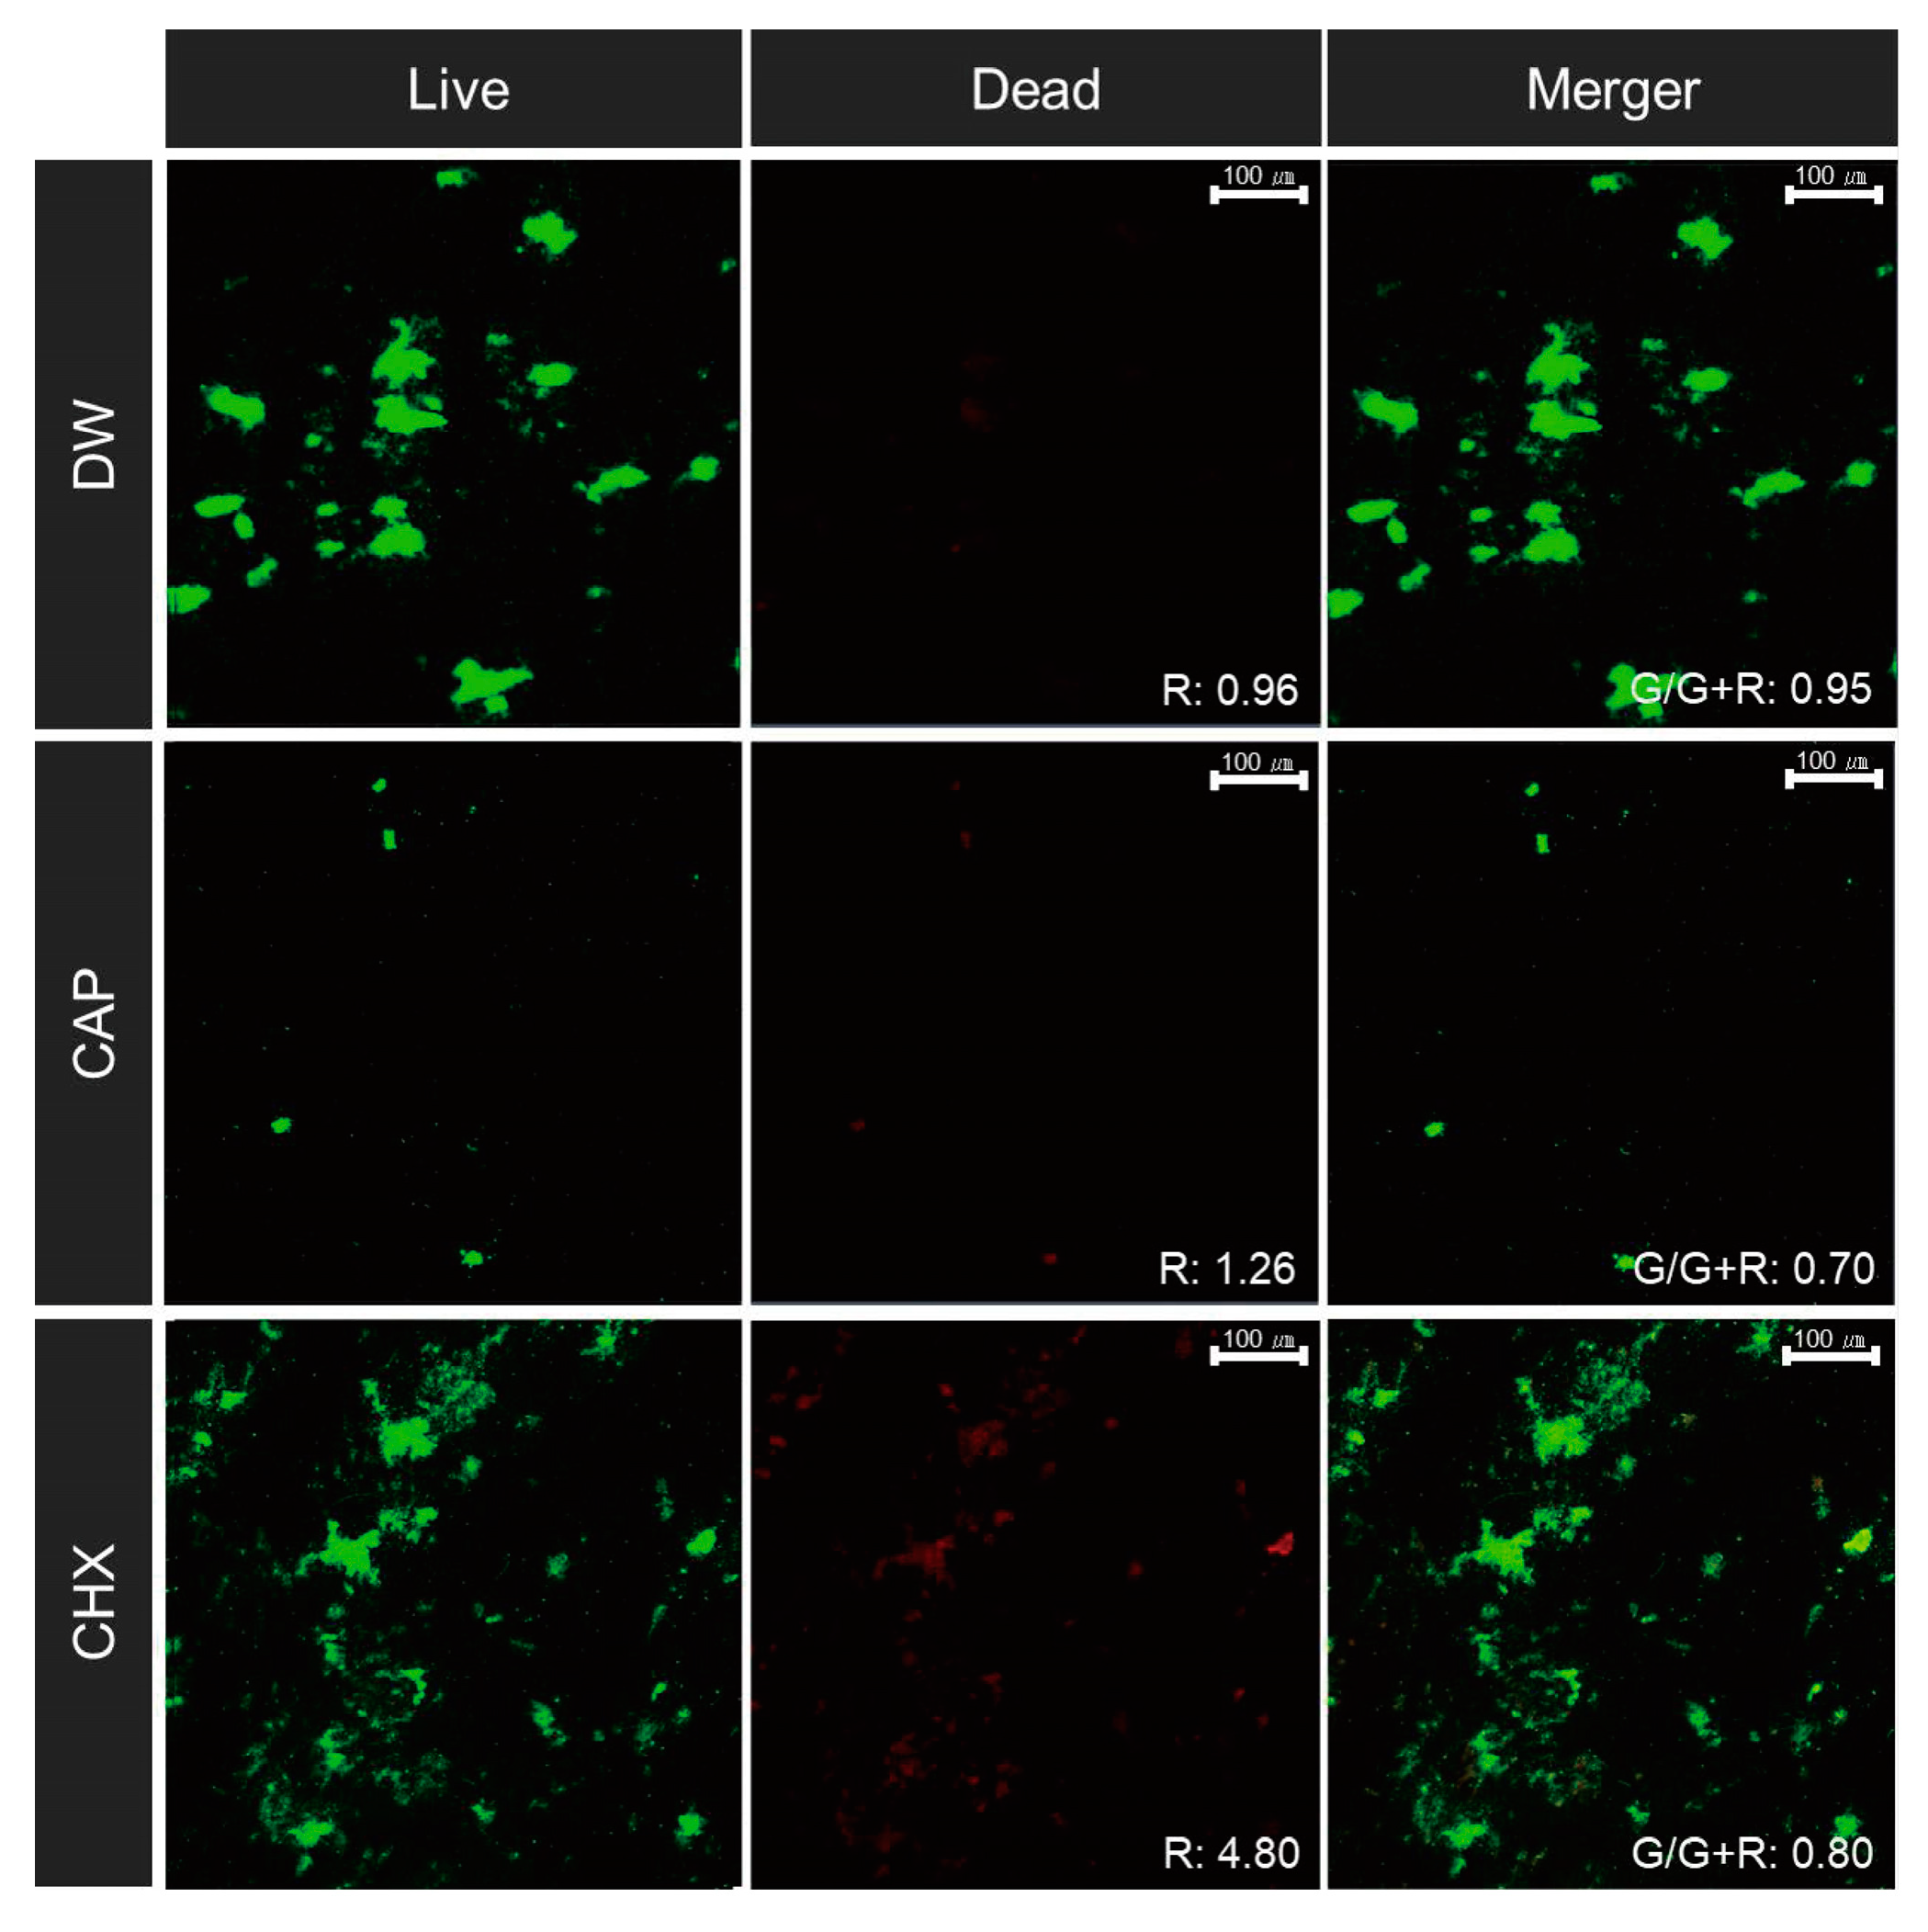
3.2. Bacterial Viability

The RatioG/G+R in the CAP group (0.68 ± 0.03) was lower than those in the DW (0.94 ± 0.02) and CHX (0.80 ± 0.01) groups by 0.26 ± 0.04 and 0.12 ± 0.03, respectively (p < 0.05). Notably, bacterial aggregation was weakened in the CAP group (Figure 7).

3.3. Bacterial Counts

The total bacterial count in the CAP group was 0.93 times lower than that in the CHX group; despite showing no substantial difference (p = 0.590). In contrast, a significant reduction of 0.83 times was detected in the CAP group compared with that in the DW group (p < 0.001). The aciduric bacterial count in the CAP group was 1.06 times higher than that in the CHX group; however, the difference was not statistically significant (p = 0.330). A significant reduction of 0.84 times was observed in the CAP group compared with that in the DW group (p < 0.001, Table 1).

4. Discussion

This longitudinal study evaluated changes in the antibacterial efficacy of CAP and CHX over a period of 6 days using QLF-D-based red fluorescence intensity (RatioR/G) analysis. The porphyrins and extracellular and intracellular polysaccharides produced by bacterial metabolism in response to the blue light (405 nm) emitted from the QLF-D camera manifests as red fluorescence [29,30]. Thus, stronger red fluorescence indicates a higher concentration of these substances within the biofilm, signifying increased bacterial activity and enhanced biofilm pathogenicity [23,31]. This is a non-invasive method that enables the monitoring of biofilm changes over time [32]. The most significant finding of this study was the reduction in biofilm pathogenicity observed in the CAP group. The RatioR/G in the CAP group exhibited the greatest decrease from the baseline (p < 0.001; Figure 6) and was consistently lower than that in the CHX group at each treatment interval (adjusted p < 0.001). Thus, CAP may be more effective compared with CHX in controlling biofilm growth. The efficacy of CAP translates to a substantial reduction in bacterial activity within the biofilm, signifying a decline in the pathogenic potential of biofilms [26]. Consistent with these findings, another study previously reported that argon-based CAP application for 2 min led to a notable decrease in the number of cells in a 2-day salivary biofilm compared with 0.12% CHX [15]. However, they only completed a single CAP treatment session, and biofilm alterations were not monitored continuously.
Oral biofilms become structurally complex over time, and their resistance to antimicrobials intensifies with genetic transfer and adaptation among bacteria [33]. In the present study, the difference in antibacterial efficacy between CHX and CAP progressively increased as the oral microcosm biofilms underwent repeated CAP exposure over a period of 6 days (Figure 6). This may be attributed to the inability of CHX to penetrate the deeper layers of mature biofilms, unlike CAP [34]. The proportion of EPSs increases as the age of the oral biofilm increases, resulting in a more intricate internal structure [35], which can act as a physical barrier that limits chemical transport within and outside the biofilm, thereby decreasing bacterial susceptibility to antimicrobial treatments [34,36]. Moreover, EPSs contain negatively charged phosphates that can strongly adsorb cationic compounds, such as CHX, thereby impeding CHX penetration into the biofilm [37]. Although biofilm age has been reported to be inversely related to the penetration rate of antimicrobial substances [38], the findings of the present study suggest that the efficacy of CAP in inhibiting oral biofilm growth is superior to that of CHX. The CAP group exhibited the lowest bacterial viability (RatioG/G+R), indicating its potential superiority in inhibiting bacterial proliferation within oral microcosm biofilms, as well as weakened bacterial aggregation compared with that in the DW and CHX groups (Figure 7). RONS produced during CAP treatment are known to disrupt bacterial morphology, thereby weakening bacterial aggregation [39]. A previous study also reported shorter streptococcal chains of S. mutans after CAP treatment compared with the pre-treatment length [11]. During plasma production, oxidants like hydrogen peroxide (H2O2) accumulate at the vacuum–water boundary and within the water itself [40], implying that oxidants can infiltrate liquids. Thus, the RONS generated by CAP may reach the biofilm, potentially undermining the structural integrity of EPSs and leading to cell damage [41]. Moreover, a previous study reported that CAP destabilized amyloid-beta peptide aggregation by inducing oxidation [39], which may affect EPS aggregation in biofilms in a similar manner. Although this previous study did not focus directly on biofilms, the similarities in the aggregation processes of peptides and EPSs suggest that the oxidative properties of CAP could potentially hinder the structural integrity of EPSs in biofilms.
The present study evaluated total and aciduric bacterial counts to assess bacterial adhesion and growth, and revealed a significant decrease between the CAP and DW groups (p < 0.05, Table 1), consistent with the findings of a previous study that reported reduced adherent bacterial counts following nitrogen-based CAP jet pre-treatment in S. mutans biofilms [42]. However, the CAP and CHX groups did not show significant variances in both total and aciduric bacterial counts (Table 1), aligning with a previous study that reported no significant difference in bactericidal activity between the CAP and 2% CHX on in vitro endodontic biofilms [43]. Despite the lack of statistically significant differences between the CAP and CHX groups in terms of bacterial counts, the confocal laser scanning micrographs revealed a significant difference in bacterial viability (RatioG/G+R) between these two groups (Figure 7). Previous studies have also suggested that plasma-derived RONS can oxidize bacterial walls and EPSs, thereby disrupting bacterial aggregation [41,44]. These results suggest that CAP may inhibit biofilm formation [11], thus explaining the diminished biofilm pathogenicity where adhesion and growth was limited, and the weakened aggregation compared with the CHX group.
Overall, these findings suggest that CAP effectively reduced the pathogenicity of oral microcosm biofilms by decreasing the oral bacterial count and weakening their ability to aggregate. The plasma pipette used in the present study is a small jet device capable of compacting plasma through a nozzle with a diameter of approximately 1 mm, enhancing accessibility within the oral cavity and enabling localized application at clinical sites. Using this device, CAP can be effectively applied to control oral biofilms that accumulate in areas where removal is challenging with physical brushing alone, such as deep periodontal pockets, pits, and fissures. Unlike CHX, which must be used as a mouthwash, localized CAP treatment could prevent normal oral microbiota disruption, thereby reducing opportunistic infections. This is crucial in a clinical setting, where long-term management of oral biofilms is often necessary. Moreover, the ability of CAP to penetrate mature biofilms, as demonstrated in the present study, holds significant practical benefits in oral healthcare, since CHX has limited efficacy in reaching the inner layers of advanced biofilms. Moreover, this benefit is particularly crucial for addressing oral conditions involving biofilms that have developed resistance to conventional antibacterial treatments.
This study has some limitations. First, RONS may have been generated in the oral cavity during CAP treatment but were not evaluated. However, the survival rate of L-929 mouse fibroblasts subjected to up to 2 min of CAP treatment demonstrated no significant difference from the control group, as indicated in a previous study [42]. Further cytotoxicity studies should be conducted to support the clinical use of CAP. Second, the biofilms were formed on HAP disks rather than on actual enamel, which could have influenced initial biofilm adherence. Nevertheless, the HAP disk surfaces were prepared similarly to the process of specimen preparation using actual enamel [25], thereby minimizing the potential impact of the HAP disk surface characteristics on biofilm formation. Third, the CAP treatment duration was set to 2 min based on the unique characteristics of the plasma application, accounting for the 1 mm diameter jet projection onto the 7 mm disk and the output pressure of 0.02 MPa. Therefore, the area of immediate exposure was inherently limited due to the 1 mm diameter nozzle, resulting in non-uniform biofilm CAP exposure, unlike the CHX treatment, where the entire biofilm surface received simultaneous and uniform exposure. Consequently, while the CHX treatment, as per the manufacturer’s instructions, only required 1 min due to its comprehensive coverage, the CAP treatment required prolonged exposure to ensure that the entirety of the biofilm surface received adequate treatment. However, the 2 min duration for CAP treatment does not correspond directly to the 1 min duration for the CHX treatment in terms of efficacy and exposure. Therefore, future studies should explore methods that could reduce the optimum CAP treatment duration, potentially through modifications to the nozzle length and enrichment of the working gas with oxygen, to optimize treatment efficiency. This would help in aligning the treatment times more closely and mitigating the issue of time as a confounding variable. Lastly, the differences in ease of use and cost-effectiveness could prominently differ between the CHX and CAP treatments. The current form of CAP application via a pipette could be less practical for everyday use and involve higher costs. However, this study aimed to lay the groundwork for future advancements in this technology. The ultimate goal is to eventually develop more user-friendly and cost-effective CAP devices that could offer viable alternatives or adjunctive therapies to existing treatments. These findings could highlight the potential for innovation in dental treatment methods and underscore the need for ongoing research to make emerging technologies more accessible and practical for patient use.
Nevertheless, this novel study measured changes in oral biofilms using QLF-D camera over 6 days, which allowed for precise and non-invasive biofilm monitoring over time and provided detailed quantitative data on biofilm pathogenicity and antibacterial treatment responses. The antibacterial efficacy of CAP demonstrated using an oral microcosm biofilm model that closely simulates the oral environment presents another significant advantage, as this model closely mimics the natural environment of the oral cavity, providing a more accurate and realistic assessment of biofilm behavior and treatment efficacy compared with traditional models. By replicating the complex microbial community and environmental conditions of the oral cavity, the model presented in this study offers valuable insights into oral biofilm dynamics and their treatment responses.

5. Conclusions

The RatioR/G in the CAP group was notably lower than that in the CHX and DW groups, indicating reduced pathogenicity in the biofilms. Furthermore, the total and aciduric bacterial counts were substantially lower in the CAP group, further affirming its efficacy in controlling bacterial growth and viability. The findings of the present study also revealed that CAP treatment limited bacterial aggregation more effectively than the other treatments, indicating that CAP may be a superior alternative for managing and reducing the pathogenicity of oral microcosm biofilms compared to conventional methods, such as CHX. The findings of this study might suggest a promising avenue for the development of innovative antibacterial strategies targeting oral biofilms in regions of the oral cavity where removal is difficult. Moreover, this study underscores the need for ongoing research to make emerging technologies more accessible and practical for patient use.

Funding

This work was supported by a National Research Foundation of Korea (NRF) grant funded by the Korean government (MSIT) (No. 2022R1F1A1064357).

Institutional Review Board Statement

This study was conducted in accordance with the guidelines of the Declaration of Helsinki, and approved by the Institutional Review Board of Gachon University (protocol code: 1044396-202107-HR-165-01, approve date: 20 August 2021).

Informed Consent Statement

Written informed consent was obtained from all participants involved in this study.

Data Availability Statement

The data presented in this study are available on request from the corresponding author. The data are not publicly available due to intellectual property rights restrictions.

Acknowledgments

I express my gratitude to Jiyeon Lee for her contribution to the creation of the pilot data.

Conflicts of Interest

The author declares no conflicts of interest.

References

  1. World Health Organization. Global Oral Health Status Report: Towards Universal Health Coverage for Oral Health by 2030; World Health Organization: Geneva, Switzerland, 2022; Available online: https://www.who.int/publications/i/item/9789240061484 (accessed on 17 January 2024).
  2. Stoodley, P.; Sauer, K.; Davies, D.G.; Costerton, J.W. Biofilms as complex differentiated communities. Annu. Rev. Microbiol. 2002, 56, 187–209. [Google Scholar] [CrossRef] [PubMed]
  3. Takahashi, N.; Nyvad, B. The role of bacteria in the caries process: Ecological perspectives. J. Dent. Res. 2011, 90, 294–303. [Google Scholar] [CrossRef]
  4. Nyvad, B.; Takahashi, N. Integrated hypothesis of dental caries and periodontal diseases. J. Oral Microbiol. 2020, 12, 1710953. [Google Scholar] [CrossRef]
  5. Jones, C.G. Chlorhexidine: Is it still the gold standard? Periodontol. 2000 1997, 15, 55–62. [Google Scholar] [CrossRef] [PubMed]
  6. Flötra, L.; Gjermo, P.; Rölla, G.; Waerhaug, J. Side effects of chlorhexidine mouth washes. Scand. J. Dent. Res. 1971, 79, 119–125. [Google Scholar] [CrossRef]
  7. Brookes, Z.; Teoh, L.; Cieplik, F.; Kumar, P. Mouthwash effects on the oral microbiome: Are they good, bad, or balanced? Int. Dent. J. 2023, 73 (Suppl. 2), S74–S81. [Google Scholar] [CrossRef]
  8. do Amaral, G.C.L.S.; Hassan, M.A.; Sloniak, M.C.; Pannuti, C.M.; Romito, G.A.; Villar, C.C. Effects of antimicrobial mouthwashes on the human oral microbiome: Systematic review of controlled clinical trials. Int. J. Dent. Hyg. 2023, 21, 128–140. [Google Scholar] [CrossRef]
  9. von Woedtke, T.; Laroussi, M.; Gherardi, M. Foundations of plasmas for medical applications. Plasma Sources Sci. Technol. 2022, 31, 054002. [Google Scholar] [CrossRef]
  10. Borges, A.C.; Kostov, K.G.; Pessoa, R.S.; de Abreu, G.M.; Lima, G.d.M.; Figueira, L.W.; Koga-Ito, C.Y. Applications of cold atmospheric pressure plasma in dentistry. Appl. Sci. 2021, 11, 1975. [Google Scholar] [CrossRef]
  11. Gherardi, M.; Tonini, R.; Colombo, V. Plasma in dentistry: Brief history and current status. Trends Biotechnol. 2018, 36, 583–585. [Google Scholar] [CrossRef]
  12. Sladek, R.E.; Filoche, S.K.; Sissons, C.H.; Stoffels, E. Treatment of Streptococcus mutans biofilms with a nonthermal at-mospheric plasma. Lett. Appl. Microbiol. 2007, 45, 318–323. [Google Scholar] [CrossRef]
  13. Lee, M.J.; Kwon, J.S.; Jiang, H.B.; Choi, E.H.; Park, G.; Kim, K.M. The antibacterial effect of nonthermal atmospheric pressure plasma treatment of titanium surfaces according to the bacterial wall structure. Sci. Rep. 2019, 9, 1938. [Google Scholar] [CrossRef] [PubMed]
  14. Carreiro, A.F.P.; Delben, J.A.; Guedes, S.; Silveira, E.J.D.; Janal, M.N.; Vergani, C.E.; Pushalkar, S.; Duarte, S. Low-temperature plasma on peri-implant–related biofilm and gingival tissue. J. Periodontol. 2019, 90, 507–515. [Google Scholar] [CrossRef] [PubMed]
  15. Jablonowski, L.; Fricke, K.; Matthes, R.; Holtfreter, B.; Schlüter, R.; von Woedtke, T.; Weltmann, K.D.; Kocher, T. Removal of naturally grown human biofilm with an atmospheric pressure plasma jet: An in-vitro study. J. Biophotonics 2017, 10, 718–726. [Google Scholar] [CrossRef] [PubMed]
  16. Blumhagen, A.; Singh, P.; Mustapha, A.; Chen, M.; Wang, Y.; Yu, Q. Plasma deactivation of oral bacteria seeded on hy-droxyapatite disks as tooth enamel analogue. Am. J. Dent. 2014, 27, 84–90. [Google Scholar] [PubMed]
  17. Koban, I.; Holtfreter, B.; Hübner, N.O.; Matthes, R.; Sietmann, R.; Kindel, E.; Weltmann, K.D.; Welk, A.; Kramer, A.; Kocher, T. Antimicrobial efficacy of non-thermal plasma in comparison to chlorhexidine against dental biofilms on titanium discs in vitro—Proof of principle experiment. J. Clin. Periodontol. 2011, 38, 956–965. [Google Scholar] [CrossRef] [PubMed]
  18. Costerton, J.W.; Stewart, P.S.; Greenberg, E.P. Bacterial biofilms: A common cause of persistent infections. Science 1999, 284, 1318–1322. [Google Scholar] [CrossRef]
  19. Filoche, S.K.; Soma, K.J.; Sissons, C.H. Caries-related plaque microcosm biofilms developed in microplates. Oral Microbiol. Immunol. 2007, 22, 73–79. [Google Scholar] [CrossRef] [PubMed]
  20. Sissons, C.H. Artificial dental plaque biofilm model systems. Adv. Dent. Res. 1997, 11, 110–126. [Google Scholar] [CrossRef]
  21. Marsh, P.D. Controlling the oral biofilm with antimicrobials. J. Dent. 2010, 38 (Suppl. 1), S11–S15. [Google Scholar] [CrossRef]
  22. Lee, J.; Cho, S.; Kim, H.E. Antimicrobial effects of non-thermal atmospheric pressure plasma on oral microcosm biofilms. Int. J. Environ. Res. Public Health 2023, 20, 2447. [Google Scholar] [CrossRef]
  23. Lee, E.S.; Kang, S.M.; Ko, H.Y.; Kwon, H.K.; Kim, B.I. Association between the cariogenicity of a dental microcosm biofilm and its red fluorescence detected by Quantitative Light-induced Fluorescence-Digital (QLF-D). J. Dent. 2013, 41, 1264–1270. [Google Scholar] [CrossRef] [PubMed]
  24. Hwang, H.Y.; Kim, H.E. Influence of a novel pH-cycling model using dental microcosm biofilm on the remineralizing efficacy of fluoride in early carious lesions. Clin. Oral Investig. 2021, 25, 337–344. [Google Scholar] [CrossRef]
  25. Kang, M.K.; Kim, H.E. Remineralizing efficacy of fluoride in the presence of oral microcosm biofilms. J. Dent. 2021, 115, 103848. [Google Scholar] [CrossRef]
  26. Lee, E.S.; de Josselin de Jong, E.D.J.; Kim, B.I. Detection of dental plaque and its potential pathogenicity using quantitative light-induced fluorescence. J. Biophotonics 2019, 12, e201800414. [Google Scholar] [CrossRef]
  27. Stocks, S.M. Mechanism and use of the commercially available viability stain, BacLight. Cytometry A 2004, 61, 189–195. [Google Scholar] [CrossRef] [PubMed]
  28. Lee, Y.R.; Kim, H.E. Red fluorescence threshold for assessing the lesion activity of early caries. Photodiagnosis Photodyn. Ther. 2020, 32, 102040. [Google Scholar] [CrossRef] [PubMed]
  29. Volgenant, C.M.; van der Veen, M.H.; de Soet, J.J.; ten Cate, J.M. Effect of metalloporphyrins on red autofluorescence from oral bacteria. Eur. J. Oral Sci. 2013, 121, 156–161. [Google Scholar] [CrossRef]
  30. de Josselin de Jong, E.; Higham, S.M.; Smith, P.W.; van Daelen, C.J.; van der Veen, M.H. Quantified light-induced fluores-cence, review of a diagnostic tool in prevention of oral disease. J. Appl. Phys. 2009, 105, 102031. [Google Scholar] [CrossRef]
  31. Lee, E.S.; de Josselin de Jong, E.D.J.; Jung, H.I.; Kim, B.I. Red fluorescence of dental biofilm as an indicator for assessing the efficacy of antimicrobials. J. Biomed. Opt. 2018, 23, 015003. [Google Scholar] [CrossRef]
  32. Kim, Y.S.; Lee, E.S.; Kwon, H.K.; Kim, B.I. Monitoring the maturation process of a dental microcosm biofilm using the Quantitative Light-induced Fluorescence-Digital (QLF-D). J. Dent. 2014, 42, 691–696. [Google Scholar] [CrossRef]
  33. Marsh, P.D. Dental plaque as a microbial biofilm. Caries Res. 2004, 38, 204–211. [Google Scholar] [CrossRef] [PubMed]
  34. Souza, J.G.S.; Costa Oliveira, B.E.C.; Costa, R.C.; Bechara, K.; Cardoso-Filho, O.; Benso, B.; Shibli, J.A.; Bertolini, M.; Barāo, V.A.R. Bacterial-derived extracellular polysaccharides reduce antimicrobial susceptibility on biotic and abiotic surfaces. Arch. Oral Biol. 2022, 142, 105521. [Google Scholar] [CrossRef] [PubMed]
  35. Bowen, W.H.; Burne, R.A.; Wu, H.; Koo, H. Oral biofilms: Pathogens, matrix, and polymicrobial interactions in microenvi-ronments. Trends Microbiol. 2018, 26, 229–242. [Google Scholar] [CrossRef] [PubMed]
  36. Karygianni, L.; Ren, Z.; Koo, H.; Thurnheer, T. Biofilm matrixome: Extracellular components in structured microbial com-munities. Trends Microbiol. 2020, 28, 668–681. [Google Scholar] [CrossRef]
  37. Melvaer, K.L.; Helgeland, K.; Rölla, G. A charged component in purified polysaccharide preparations from Streptococcus mutans and Streptococcus sanguis. Arch. Oral Biol. 1974, 19, 589–595, IN25. [Google Scholar] [CrossRef]
  38. Tatevossian, A. The effects of heat inactivation, tortuosity, extracellular polyglucan and ion-exchange sites on the diffusion of [14C]-sucrose in human dental plaque residue in vitro. Arch. Oral Biol. 1985, 30, 365–371. [Google Scholar] [CrossRef]
  39. Razzokov, J.; Yusupov, M.; Bogaerts, A. Oxidation destabilizes toxic amyloid beta peptide aggregation. Sci. Rep. 2019, 9, 5476. [Google Scholar] [CrossRef]
  40. Razzokov, J.; Fazliev, S.; Kodirov, A.; AttrI, P.; Chen, Z.; Shiratani, M. Mechanistic insight into permeation of plas-ma-generated species from vacuum into water bulk. Int. J. Mol. Sci. 2022, 23, 6330. [Google Scholar] [CrossRef]
  41. Xu, Z.; Shen, J.; Cheng, C.; Hu, S.; Lan, Y.; Chu, P.K. In Vitro antimicrobial effects and mechanism of atmospheric-pressure He/O2 plasma jet on Staphylococcus aureus biofilm. J. Phys. D Appl. Phys. 2017, 50, 105201. [Google Scholar] [CrossRef]
  42. Yoo, E.M.; Choi, Y.R.; Kang, M.K. Antimicrobial efficacy of nitrogen-based non-thermal atmospheric pressure plasma jet on dental biofilm. Iran J. Sci. Technol. Trans. A Sci. 2020, 44, 1541–1547. [Google Scholar] [CrossRef]
  43. Du, T.; Shi, Q.; Shen, Y.; Cao, Y.; Ma, J.; Lu, X.; Xiong, Z.; Haapasalo, M. Effect of modified nonequilibrium plasma with chlorhexidine digluconate against endodontic biofilms in vitro. J. Endod. 2013, 39, 1438–1443. [Google Scholar] [CrossRef] [PubMed]
  44. Khosravi, S.; Jafari, S.; Zamani, H.; Nilkar, M. Inactivation of Staphylococcus aureus and Escherichia coli biofilms by air-based atmospheric-pressure DBD plasma. Appl. Biochem. Biotechnol. 2021, 193, 3641–3650. [Google Scholar] [CrossRef] [PubMed]
Figure 1. Schematic diagram showing the study design (CLSM, confocal laser scanning microscopy; QLF-D, quantitative light-induced fluorescence-digital; RatioG/G+R, the ratio of the green-stained area to the total stained area; RatioR/G, the ratio of the red intensity to the green intensity).
Applsci 14 01211 g001
Figure 2. Specimen preparation and oral microcosm biofilm establishment. (A) Preparation of the hydroxyapatite disk; (B) the hydroxyapatite disk embedded within an acrylic mold; (C) the oral microcosm biofilm formation on the hydroxyapatite disk over 2 days.
Applsci 14 01211 g002
Figure 3. Establishing the oral microcosm biofilm and conducting the treatment protocols (CAP, cold atmospheric plasma; CFUs, colony-forming units; CHX, chlorhexidine gluconate; DW, distilled water; QLF-D, quantitative light-induced fluorescence-digital).
Applsci 14 01211 g003
Figure 4. Argon-based plasma pipette. (A) Components of the plasma pipette. (B) The 10 mm white dotted line shows the distance from the top of the nozzle of the plasma pipette to the oral microcosm biofilm [22].
Applsci 14 01211 g004
Figure 5. (A) Body of the quantitative light-induced fluorescence-digital (QLF-D) camera. (B) Light sources of the QLF-D camera. (C) Region of interest (ROI) on a fluorescence image of the oral microcosm biofilm to analyze the RatioR/G [22].
Applsci 14 01211 g005
Figure 6. Differences in RatioR/G based on treatment methods and duration on oral microcosm biofilms. The letters (a, b, c) assigned to each treatment duration indicate significant differences between the groups as determined through Tukey’s post hoc test, with the adjusted α set at 0.007 (CAP, cold atmospheric plasma; CHX, chlorhexidine gluconate; DW, distilled water; RatioR/G, ratio of red pixels to green pixels in fluorescence images captured using the quantitative light-induced fluorescence-digital camera).
Applsci 14 01211 g006
Figure 7. Representative confocal laser scanning micrographs (magnification 100×) displaying live (green) and dead (red) bacterial staining (CAP, cold atmospheric plasma; CHX, chlorhexidine gluconate; DW, distilled water).
Applsci 14 01211 g007
Table 1. Total bacterial and aciduric bacterial counts after antibacterial treatment (unit, log CFUs/mL).
TreatmentsNTotal BacteriaAciduric Bacteria
Distilled water197.19 (0.52) a5.83 (0.48) a
Cold atmospheric plasma195.96 (0.66) b4.89 (0.60) b
Chlorhexidine gluconate196.44 (0.80) b4.61 (0.68) b
p-values <0.001<0.001
All data are displayed as the mean (standard deviation).  p-value derived using one-way ANOVA. a,b Different letters in a single column represent significant differences between groups, as determined by Tukey’s post hoc analysis (α = 0.05).
Disclaimer/Publisher’s Note: The statements, opinions and data contained in all publications are solely those of the individual author(s) and contributor(s) and not of MDPI and/or the editor(s). MDPI and/or the editor(s) disclaim responsibility for any injury to people or property resulting from any ideas, methods, instructions or products referred to in the content.

