Abstract
This article proposes a simulation model of single-phase common-mode inductors to evaluate the small-signal characteristic of common-mode inductors when the stray capacitance cancellation method is applied. From the estimated stray capacitance of common-mode inductors, the value of the cancellation capacitors is determined and implemented into the model. Thus, the proposed model can simulate the small-signal characteristic of common-mode inductors with the capacitance cancellation method at the design stage. To validate the proposed model, a comparison between measured and simulated attenuation characteristics of fabricated single-phase common-mode inductors is performed. The comparison result clarifies that the high-frequency attenuation improvement of the capacitance cancellation method is limited for manganese–zinc ferrite-based common-mode inductors due to the steep change of the complex permeability.
1. Introduction
Lately, power semiconductor devices made from silicon carbide (SiC) have entered the market and are being utilized in numerous applications [1,2,3,4]. These SiC-based power devices can complete switching operations ten times faster than their traditional silicon-based counterparts. As a result, by enhancing the switching frequency of power converters, there is the potential to minimize the size of passive components. Conversely, the significant dv/dt and di/dt associated with SiC devices contribute to a rise in high-frequency electromagnetic interference (EMI) in power converters [4,5,6,7]. Consequently, implementing EMI filters is essential to achieve substantial noise reduction across a broad frequency range.
Common-mode inductors (CMIs) combined with Y-connected capacitors form common-mode (CM) EMI filters [8,9,10]. For safety, the capacitances of Y-connected capacitors are restricted to a few nanofarads, necessitating CMIs with substantial CM inductance. Consequently, CMIs in power converters often have a larger size, weight, and cost. Typically, nanocrystalline or manganese–zinc (MnZn) ferrites are used as core materials in CMIs [11]. Nanocrystalline materials, with their high relative permeability of around 100,000 and saturation flux density near 1.2 T, greatly aid in downsizing common-mode inductors. Hence, their usage in common-mode inductors’ magnetic cores is growing. Meanwhile, MnZn ferrites, with a relative permeability up to 10,000 and a saturation flux density between 0.3–0.5 T, offer benefits such as broad bandwidth, affordability, and versatile shaping, leading to their prevalent use in commercial common-mode inductors.
The high relative permeability of these materials allows for fewer winding turns to achieve the desired CM inductance. However, independent of winding precision, CMIs experience self-resonance due to winding stray capacitance [12,13,14,15,16,17], acting as capacitive impedances beyond the self-resonant frequency and weakening their high-frequency emission attenuation. Therefore, extra filter components are often needed to ensure sufficient CM noise attenuation across a wide frequency range, enlarging the EMI filter.
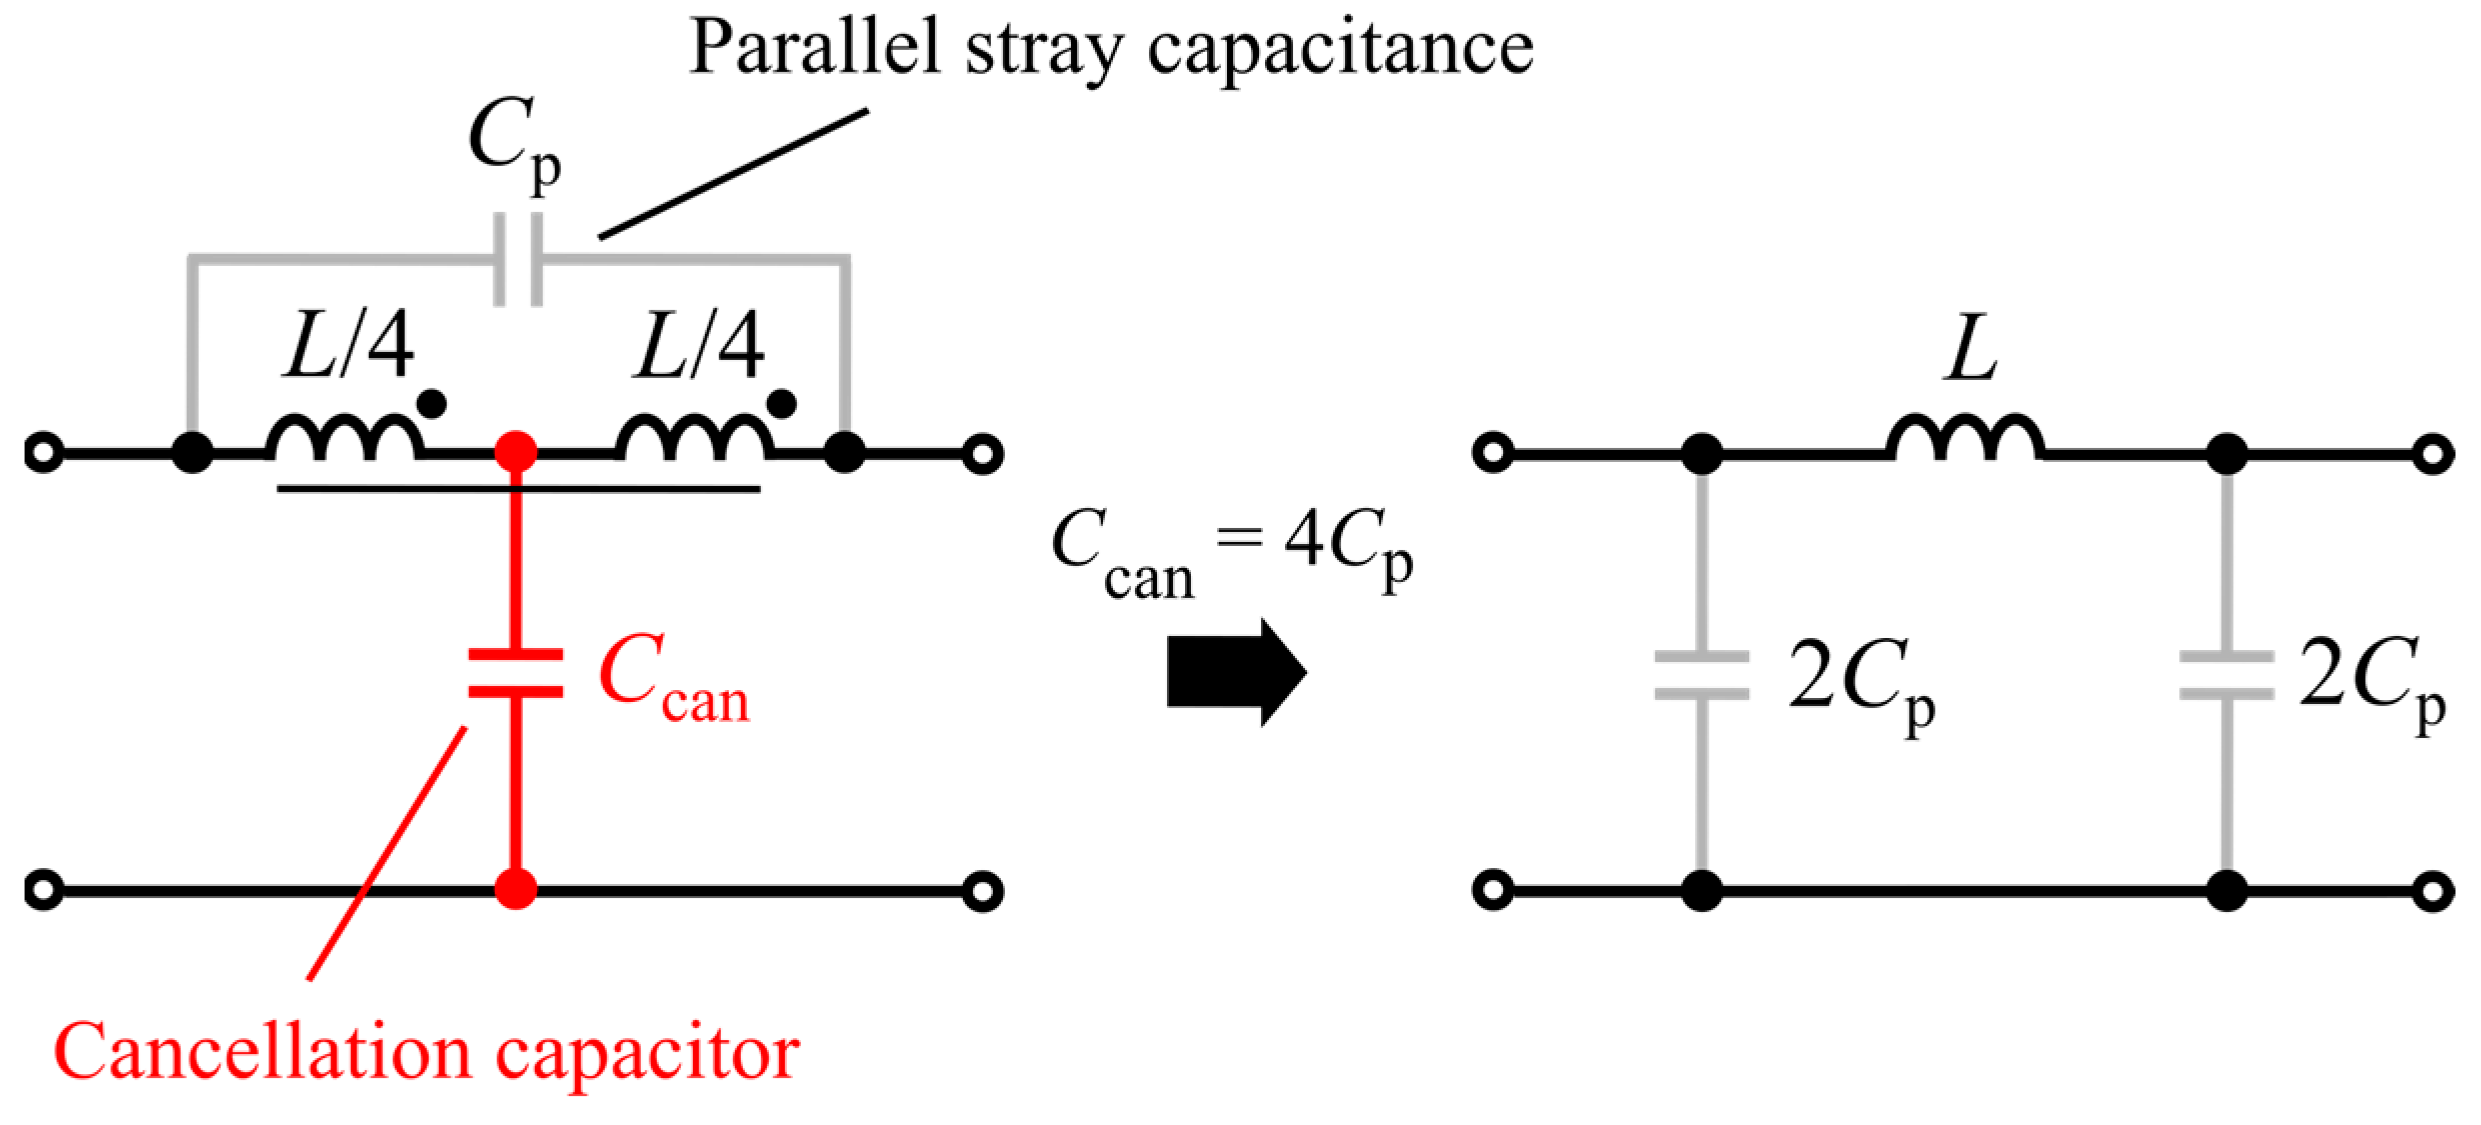
The capacitance cancellation (CC) method has been introduced to enhance inductors’ high-frequency attenuation [18]. As depicted in Figure 1, this method involves adding a center tap to an inductor L and a cancellation capacitor Ccan between this center tap and a reference potential. Theoretically, Ccan neutralizes the effect of stray capacitance Cp on the inductor’s frequency characteristic, making the inductor with the CC method act like an ideal inductor. Wang et al. applied CC to a single-phase CMI and experimentally showed that CC could boost CM emission attenuation by up to 20 dB at frequencies above 10 MHz [18]. Heldwein et al. used the CC technique on three-phase CMIs [19]. However, previous studies identified stray capacitances from the measured attenuation characteristics and impedances of manufactured CMIs and determined the capacitance of cancellation capacitors accordingly. To date, to the authors’ knowledge, there is a lack of circuit simulation models that can accurately simulate CMIs’ attenuation characteristics with CC applied, making it challenging to assess these characteristics during the EMI filter design phase.
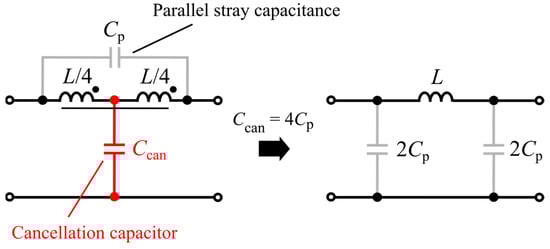
Figure 1.
Basic concept of capacitance cancellation.
In the previous work [20], an estimating method for winding stray capacitance of single-phase toroidal inductors that considers the insulation between the winding and the magnetic core has been proposed. It has been demonstrated that the proposed method can estimate winding stray capacitance with practically acceptable accuracy. Generally, single-phase toroidal inductors are fabricated by uniformly winding an entire toroidal core. On the other hand, CMIs are usually fabricated with multiple windings, which are applied to specific areas of toroidal cores. Therefore, the winding stray capacitance depends on the angle of the windings covering the core. Therefore, the method proposed in [20] cannot be directly applied to estimate stray capacitance of CMIs. To solve the above problem, the author has modified the equations for calculating the turn-to-turn capacitance in the estimation method proposed in [20] to be a function of the angle of the winding covering the core and applied to single-phase CMIs [21].
Another aspect that diminishes the high-frequency attenuation properties of CMIs is the frequency-dependent nature of the complex permeability in magnetic materials. To illustrate, in nanocrystalline materials, the imaginary component of complex permeability becomes more prominent at frequencies exceeding approximately 100 kHz. Therefore, nanocrystalline-based CMIs behave as resistive components in the high-frequency range. In addition, depending on the core dimension, the permeability of manganese–zinc (MnZn) ferrite decreases drastically around 1 MHz and indicates negative polarity [22,23]. This steep change in the permeability degrades the high-frequency attenuation characteristics of MnZn ferrite-based CMIs. In some previous studies, simulation models of CMIs that consider the complex permeability’s frequency dependence have been proposed [16,24]. However, the relationship between the frequency dependence of complex permeability and the CC method has yet to be investigated in detail.
The author introduced a circuit simulation model for CMIs, accounting for the frequency-dependent complex permeability of magnetic materials and the stray capacitances of windings [25]. This model was validated through impedance measurements, confirming its ability to simulate the small-signal characteristics of CMIs across a broad frequency spectrum, from 1 kHz to 100 MHz. Nonetheless, as presented in [25], the model was developed without incorporating the grounding connections of cancellation capacitors. As a result, it cannot replicate the effects of the CC method on the attenuation properties of CMIs.
In this article, the author refines the previously proposed circuit simulation model for single-phase CMIs (as described in [25]) to assess the influence of the CC method on the small-signal behavior of CMIs. Integrating cancellation capacitors, calculated based on the anticipated stray capacitance, into this adjusted simulation model makes it feasible to predict the attenuation characteristics of a single-phase CMI utilizing the CC method during the design phase of CMIs.
Note that the small-signal characteristics of a common-mode inductor are evaluated using a network analyzer in this article. Therefore, the magnetic flux generated in the inductor during the measurement is a small signal at several mT levels. Therefore, the proposed simulation model does not include phenomena specific to large-signal excitation conditions, such as magnetic saturation and nonlinearity behavior. Furthermore, losses must be considered when installing EMI filters in power converters. On the other hand, this article aims to understand the small-signal characteristics (attenuation characteristics) of CMIs with CC method at the design stage. Therefore, an evaluation of loss characteristics of CMIs is beyond the scope of this article.
Comparing the measured and simulated small-signal characteristics of actual single-phase CMIs demonstrates that the model can accurately represent the attenuation behavior of CMIs with the CC method across a wide frequency range. Additionally, empirical findings highlight that the enhancement in attenuation achieved by applying the CC method to MnZn ferrite-based CMIs is restricted in the high-frequency domain due to the sharp variation in complex permeability.
2. Simulation Model of CMIs with the CC Method
2.1. Configuration of the Proposed Model
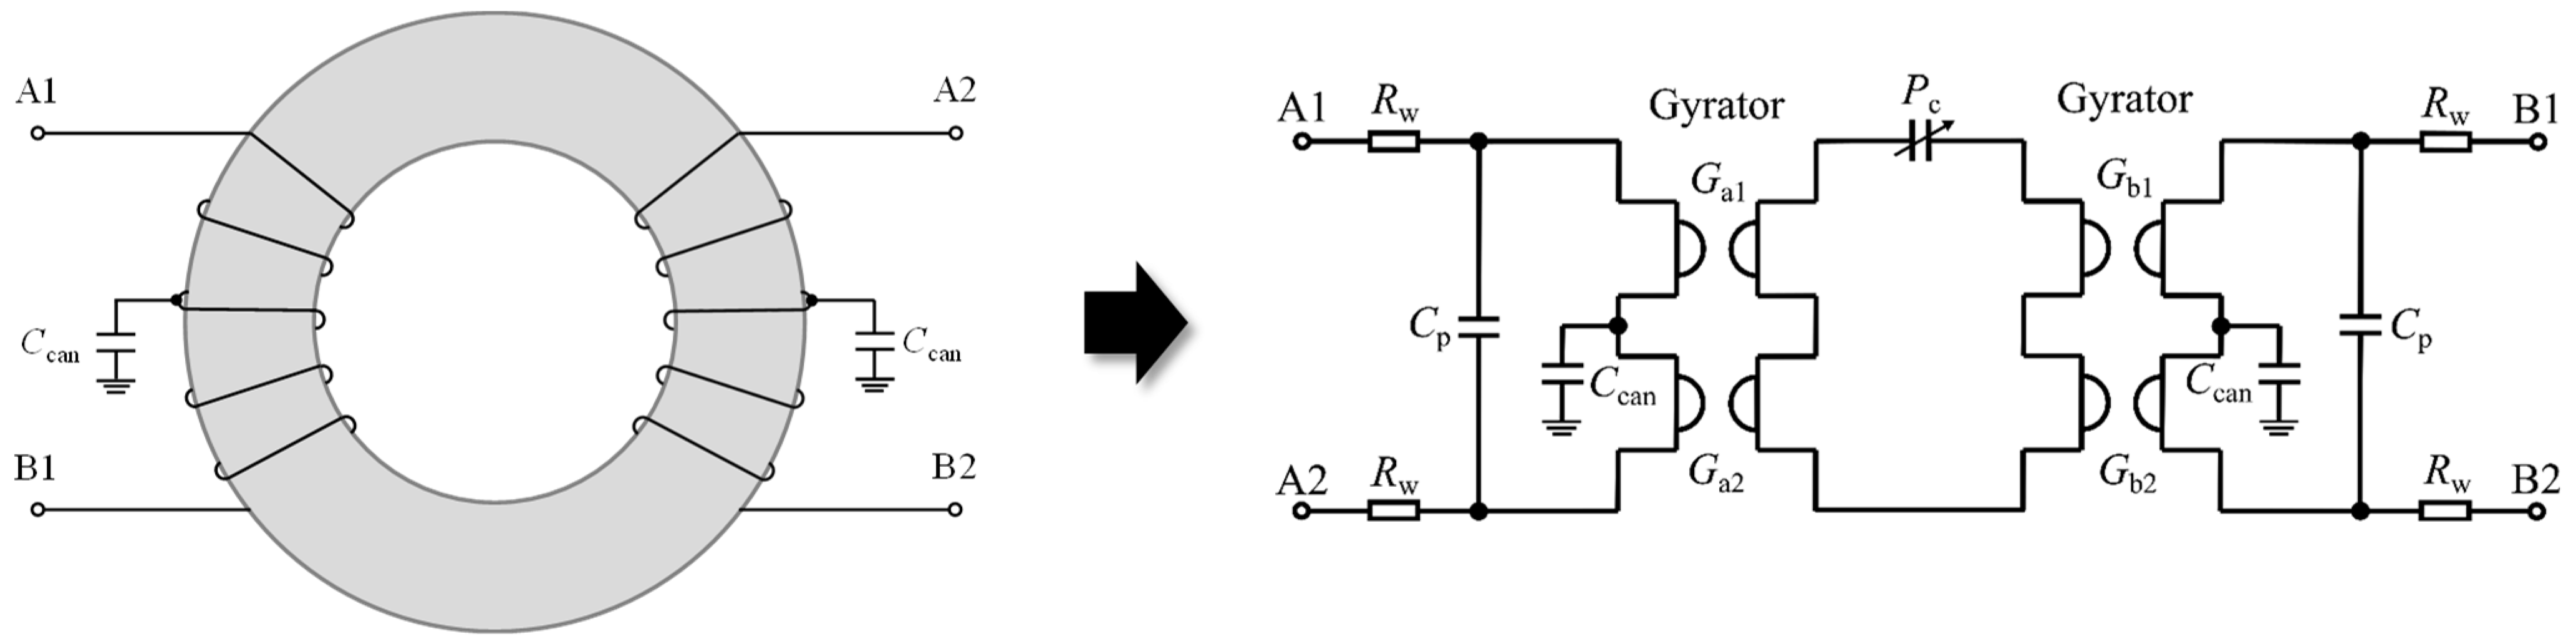
Figure 2 presents the layout of the suggested simulation model for single-phase CMIs. This model employs the permeance–capacitance analogy [26,27,28] and represents the single-phase CMI by segmenting it into two parts: magnetic and electric circuits [25].
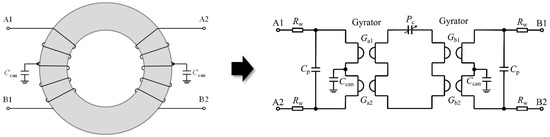
Figure 2.
Configuration of the proposed simulation model for single-phase common-mode inductors.
In order to reproduce the physical structure of magnetic components in circuit simulation, it is necessary to separate the electric circuit part from the magnetic circuit part. The model proposed in this article applies the permeance–capacitance analogy. The reluctance–resistance analogy is the well-known method for modeling magnetic components by separating the electrical and magnetic circuit parts [28]. The models obtained by both methods are mathematically equivalent. However, in the reluctance–resistance analogy-based model, the frequency characteristic of magnetic reluctance is simulated by a ladder circuit of electrical resistance and inductance. Electric resistance, an energy storage component, is introduced in the circuit simulator to simulate magnetic reluctance, and inductance is introduced to simulate high-frequency losses. As a result, confusion may be caused when building the model.
On the other hand, the permeance–capacitance analogy simulates magnetic permeance with capacitance and high-frequency losses by introducing resistance. In other words, the permeance–capacitance analogy-based model resolves the confusion caused by the reluctance–resistance analogy. Thus, this article employs the permeance–capacitance analogy for modeling common-mode inductors.
The complex permeance Pc of the magnetic core is implemented in the magnetic circuit part of the model, and the winding resistance Rw and the parallel stray capacitance Cp are implemented in the electric circuit part. Coupling between the magnetic and electric circuit parts is realized using a gyrator, an impedance inverting component. The gain G of the gyrator corresponds to the turn number and is set to half of the turn number (G = N/2). Furthermore, cancellation capacitors Ccan are connected between the connection point of two gyrators (the center tap of the winding) and the ground to simulate the CC method.
All parameters of the proposed model for CMIs can be determined during their design phase. It is important to note that this model does not account for the leakage inductance of windings and interwinding capacitance, as the article concentrates on the small-signal characteristics of CMIs in CM. Winding resistance notably rises in the high-frequency range due to skin effects and other reasons. Nevertheless, the equivalent core loss resistance, resulting from the imaginary component of complex permeability, often far exceeds the winding AC resistance for the small-signal characteristics of CMIs at these high frequencies. Consequently, the model disregards winding AC resistance and includes only the winding DC resistance. An analysis comparing the equivalent core loss resistance with the winding AC resistance is provided in Appendix A.
2.2. Modeling the Complex Permeance of the Core
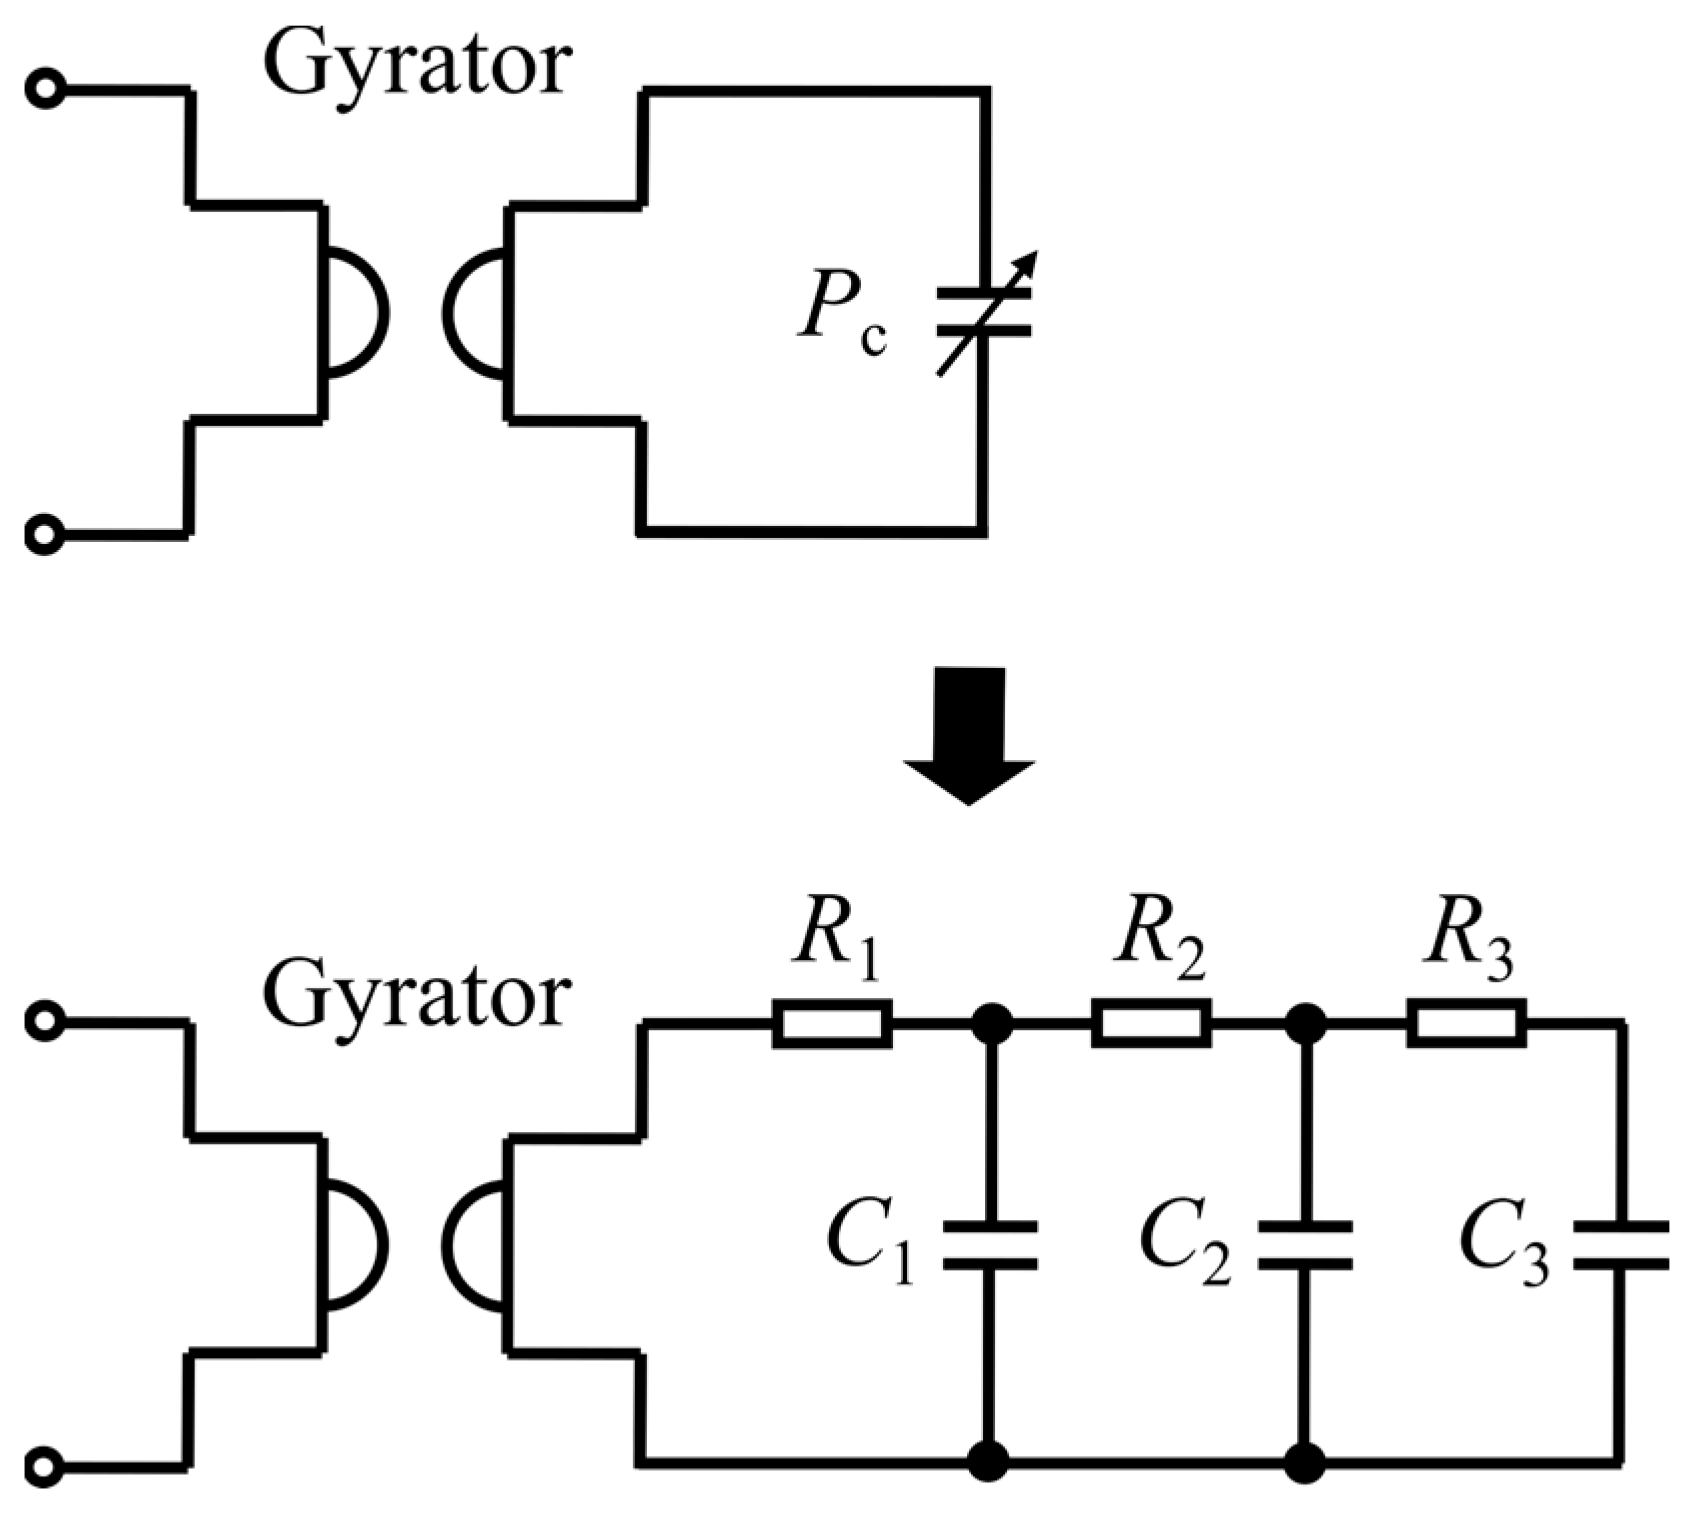
In the proposed model, a three-stage RC circuit in Figure 3 replicates the magnetic core’s complex permeance. Since modeling accuracy did not change significantly when higher-order ladder circuits were used, the three-stage RC ladder circuit is selected in this article. The complex permeance implemented in the magnetic circuit part is derived from the core’s dimensions and the magnetic material’s complex permeability and is incorporated into the magnetic circuit portion of the model.

Figure 3.
RC circuit with three stages designed to emulate the magnetic core’s complex permeance.
Generally, manufacturers’ datasheets do not offer comprehensive broadband frequency characteristics of complex permeability. Additionally, the complex permeability of MnZn ferrites is influenced by the core’s dimensions and significantly diminishes at high frequencies. To minimize the impact of core size, manufacturers typically provide data only for cores with smaller dimensions. Therefore, measuring the frequency characteristics of complex permeability before constructing the simulation model is advisable.
Within the frequency band where the effect of stray capacitance is minor and can be overlooked, it is possible to depict the inductor as an assembly of an equivalent series inductance Ls and an equivalent series resistance Rs [26]. Consequently, the real and imaginary components of the complex permeability, μr′ and μr″, can be expressed by Equations (1) and (2), respectively.
Ac represents the magnetic core’s cross-sectional area, lc is the magnetic path length, Nm refers to the inductor’s turn number under measurement, and μ0 is the permeability of free space (4π × 10−7 H/m).
One can directly measure Ls and Rs with a network analyzer. Inserting these measured frequency characteristics of Ls and Rs into Equations (1) and (2) allows for calculating the complex permeability’s real and imaginary parts, respectively.
Figure 4 illustrates the measured complex permeabilities of a nanocrystalline core (Vitroperm 500F, model number: T6006-L2030-W358) and a MnZn ferrite core (N30, model number: B64290L0048X830). These measurements were conducted with a network analyzer (Bode 100, Omicron Lab, Hong Kong, China) and an impedance measurement fixture (B-WIC) across frequencies ranging from 1 kHz to 30 MHz.
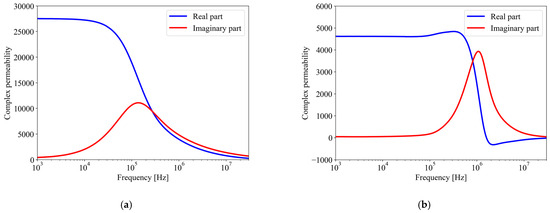
Figure 4.
Measured complex permeabilities: (a) Nanocrystalline (Vitroperm 500F); (b) MnZn ferrite (N30).
Figure 4a shows that the real part of the nanocrystalline core’s complex permeability starts to decline from about 20 kHz. Beyond 300 kHz, the imaginary part surpasses the real part. Conversely, Figure 4b shows that the real part of the MnZn ferrite’s complex permeability rapidly decreases, starting around 1 MHz, with the imaginary part displaying a resonance peak. Additionally, the real part exhibits negative polarity from approximately 1.5 MHz and gradually approaches zero. This significant alteration in the MnZn ferrite’s complex permeability substantially affects the high-frequency characteristics of filter inductors [23].
The real and imaginary parts of complex permeability can be described by Equations (3) and (4), using the RC circuit’s real and imaginary components of complex admittance Ym, as depicted in Figure 3.
Using fitting parameters a1, a2, a3, b0, b1, b2, and b3, the admittance Ym can be represented as
where s = jω.
The real and imaginary parts of the complex permeability can be calculated by dividing Equation (5) into real and imaginary parts and substituting them into Equations (3) and (4). To identify the fitting parameters, curve fitting of the calculated results to the measured results obtained from Equations (1) and (2) is performed based on the least-squares method.
Moreover, the admittance of the three-stage RC circuit is also represented by the following Equation (6).
By comparing Equations (5) and (6), the modeling components of the complex permeance R1, R2, R3, C1, C2, and C3 can be calculated based on the identified fitting parameters.
2.3. Calculating the Winding DC Resistance
In this article, the mean length per turn of toroidal core-based inductors lT is assumed, as shown in Figure 5. Thus, lT is obtained from the following Equation (7), where OD, ID, and HT are the outer diameter, inner diameter, and height of the toroidal core, respectively. In addition, do is the outer diameter of the wire, including an insulation coating.
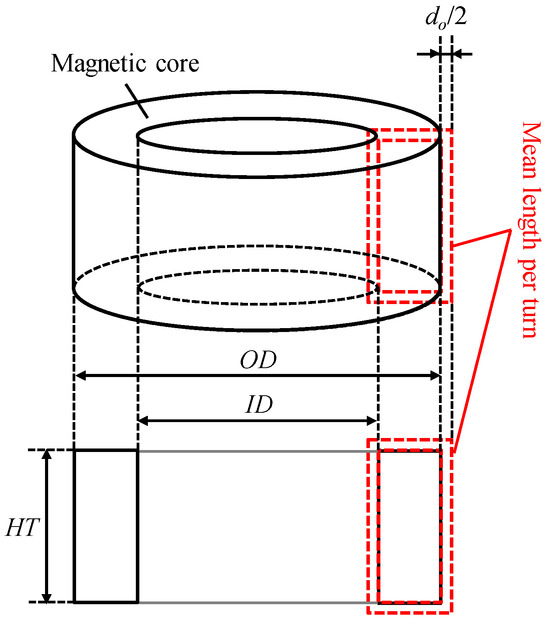
Figure 5.
Mean length per turn of toroidal inductors.
It is commonly understood that the winding DC resistance, Rw,DC, can be expressed by Equation (8). In this equation, ρCu denotes the resistivity of copper, dw represents the diameter of the conductor, and N refers to the number of turns.
The resistivity depends on temperature T; thus, the resistivity of copper is also given by
Here, ρCu(20 °C) is the resistivity of copper at 20 °C (1.724 × 10⁻⁸ (Ω ∙ m)), and αCu is the temperature coefficient of copper (0.00393 (1/°C)). In this article, the winding DC resistance of the winding was calculated, where T was set to the room temperature (25 °C).
3. Estimation of Stray Capacitance of Single-Phase CMIs
3.1. Turn-to-Turn Capacitance
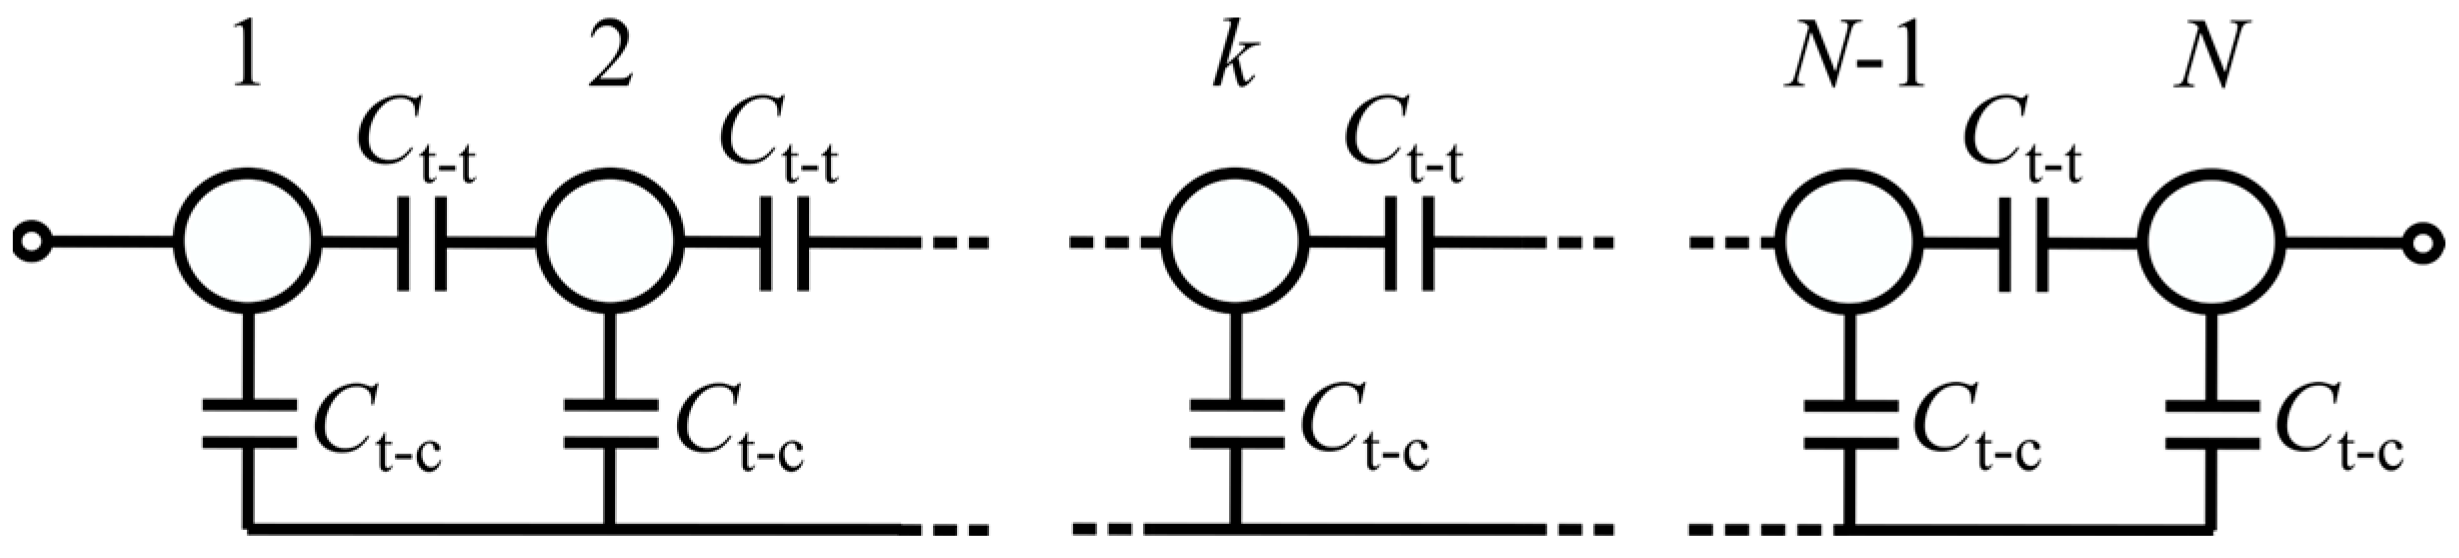
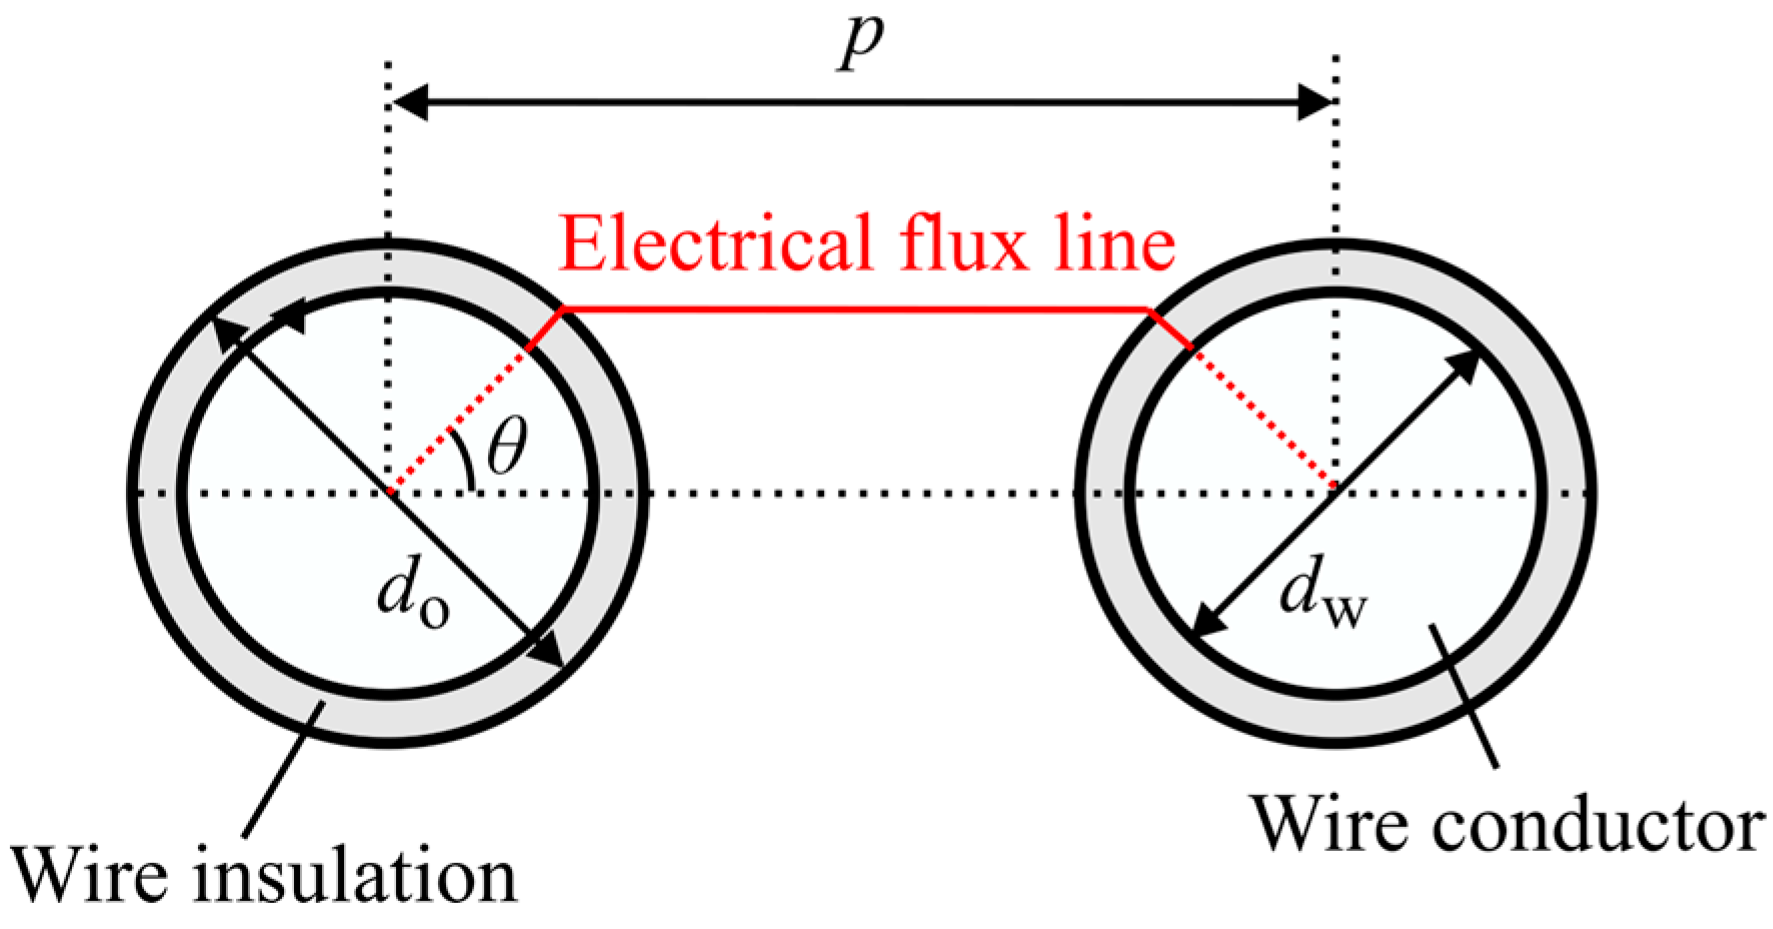
Figure 6 illustrates that the parallel stray capacitance, Cp, is modeled as a ladder circuit consisting of the turn-to-turn capacitance, Ct−t, and the turn-to-core capacitance, Ct−c [29]. Initially, the turn-to-turn capacitance is determined using Equations (10) and (11), which are based on the assumption of an electric force line existing between adjacent windings, as depicted in Figure 7 [30].
where lw is the total winding length, εri is the permittivity of the insulation coating, and p is the distance between the center of the conductors.
Figure 6.
Capacitance network for calculating the total stray capacitance of the winding with N turns.

Figure 7.
Electric flux line between adjacent turns.
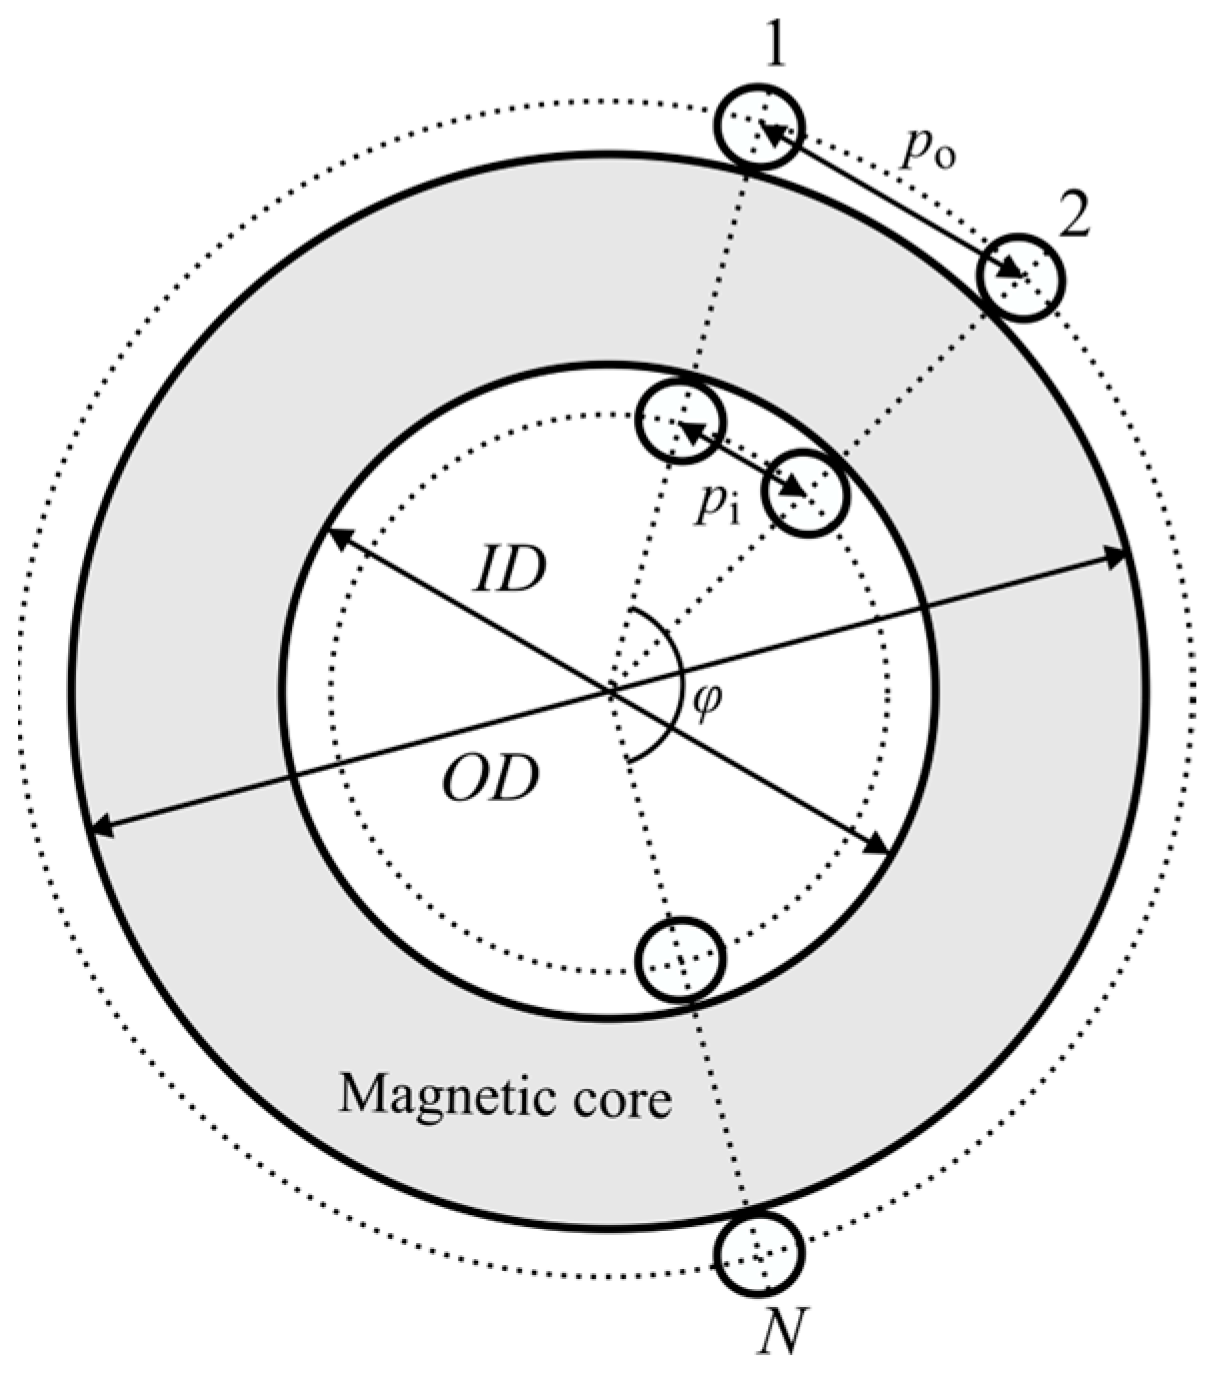
In toroidal inductors, the distance between the centers of conductors varies from the inside to the outside of the toroidal core. For this reason, the distance between the centers of conductors is calculated in three regions: inside, outside, and lateral of the core pi, po, and pl. Based on Figure 8, pi and po are obtained as Equations (12) and (13), respectively, as a function of the angle φ, at which the winding covers the core [20].
Figure 8.
Winding pitch of the toroidal core-based single-phase CMIs.
Moreover, pl is obtained as the average of pi and po (pl = (pi + po)/2).
Winding lengths inside, outside, and lateral of the core lwi, lwo, and lwl are calculated as
By substituting the distance between the centers of conductors and winding lengths in each part of the toroidal core calculated from Equations (12)–(15) into Equations (10) and (11), the turn-to-turn capacitances inside, outside, and lateral of the core Ct−t,i, Ct−t,o, and Ct−t,l can be calculated, respectively. The turn-to-turn capacitance Ct−t is obtained as the sum of calculated results in each part of the core (Ct−t = Ct−t,i + Ct−t,o + 2Ct−t,l).
3.2. Turn-to-Core Capacitance
To compute the turn-to-core stray capacitance, Ct−c, an assumption is made regarding the electric force line between the wire conductor and the magnetic core, as shown in Figure 9 [20].
Figure 9.
Electric flux line between the winding and the magnetic core.
Based on this assumption, the turn-to-core capacitance is determined as a series connection of three types of stray capacitance: Ct−c,i, which is due to the winding’s insulation coating; Ct−c,g, resulting from the air gap between the winding and core, and Ct−c,c, originating from the core’s insulation. The calculation of the turn-to-core capacitance is, therefore, performed using Equations (16) and (17) [20].
In these equations, tc represents the thickness of the magnetic core’s insulation, and εrc is the relative permittivity of the core’s insulation.
3.3. Total CM Capacitance
As shown in Figure 6, the parallel stray capacitance Cp is obtained as the ladder circuit of the turn-to-turn capacitance and turn-to-core capacitance. Based on the delta–wye transformation, Equation (18) is derived [20].
Note that the total CM capacitance CCM of single-phase CMIs is the parallel connected Cp and is obtained as CCM = 2Cp.
One possible error factor in the stray capacitance estimation method described above is that straight lines approximate the electric force lines between conductors of adjacent turns. In toroidal core-based CMIs, the distance between conductors of adjacent turns becomes large when the turn number is small or when the winding covers the core at a wide angle. As is well-known, the electric force lines between conductors are represented by arcs. On the other hand, this article approximates the electric force lines between conductors by straight lines. This approximation may lead to the overestimated turn-to-turn capacitance because the length of the electric force line is estimated to be shorter than its actual length when the winding is applied sparsely to the toroidal core. The possible error of the turn-to-turn capacitance due to the above approximation of the electric force lines increases as the distance between conductors of adjacent turns increases.
On the other hand, in this article, the parallel stray capacitance of the winding is calculated as the ladder circuit of the turn-to-turn capacitance and the turn-to-core capacitance. The turn-to-core capacitance does not depend on the distance between conductors of adjacent turns, and windings are usually applied closely to the core. Therefore, the turn-to-core capacitance is dominant in the parallel stray capacitance of the winding when the winding is sparsely applied to the core. In other words, even if the turn-to-turn capacitance is overestimated, its impact on the parallel stray capacitance may be ignored.
The turn-to-core capacitance can be reduced when the distance between the winding and the core increases. In such a case, the turn-to-turn capacitance may dominate the parallel stray capacitance even if the winding is sparsely applied to the toroidal core. However, windings are usually applied tightly to the core. Thus, the distance between the winding and the core is not considered in Equations (16) and (17) for calculating the turn-to-core capacitance.
4. Evaluation of Small-Signal Characteristics of Single-Phase CMIs
4.1. Configuration of the Evaluation System
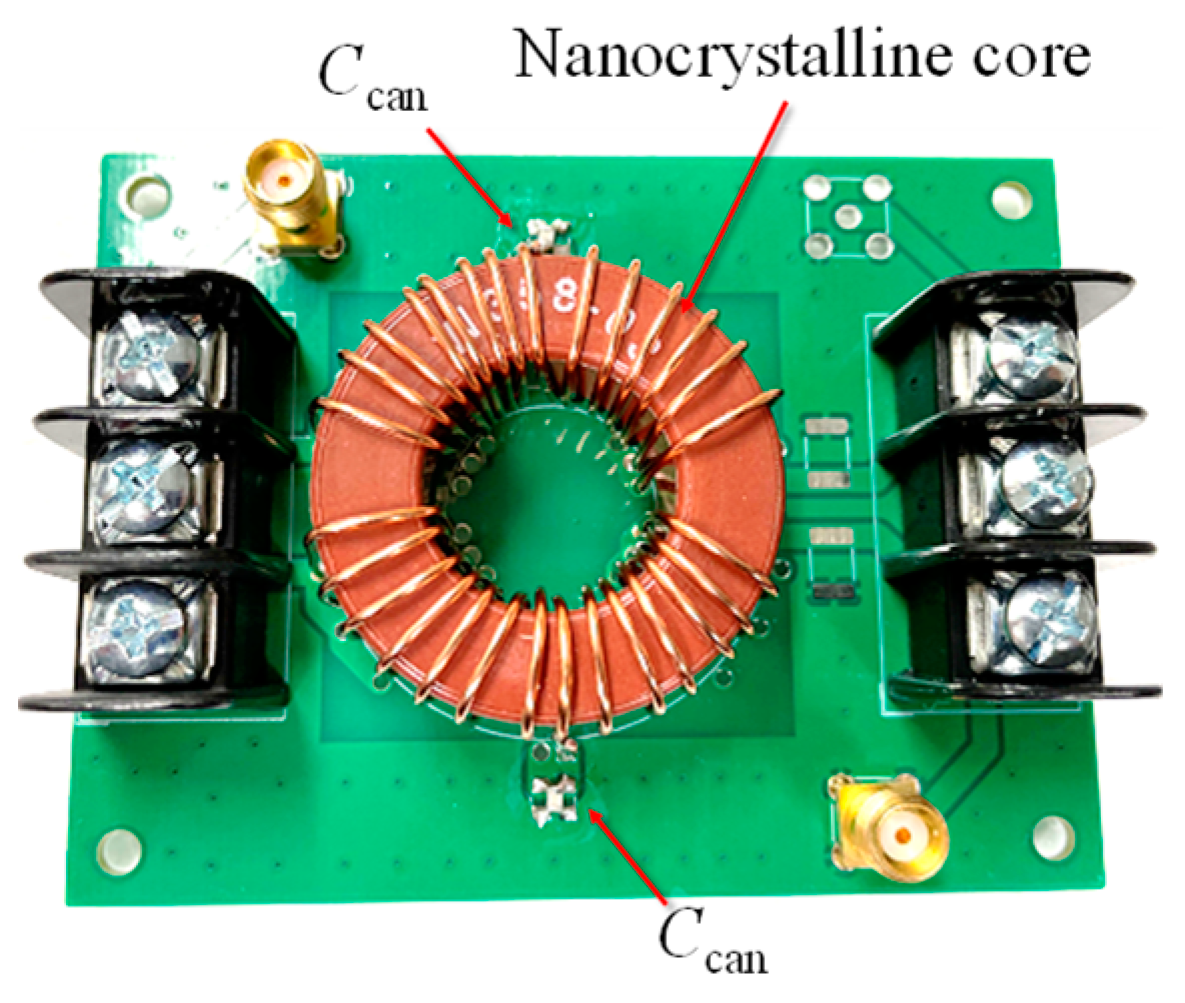
To validate the proposed model, two single-phase CMIs were fabricated using two different magnetic materials, nanocrystalline and MnZn ferrite. The CMIs were mounted on printed circuit boards to adjust the winding angle φ. The cancellation capacitors Ccan (= 4Cp) calculated based on the estimated parallel stray capacitance were also mounted on the printed circuit boards. The picture of the fabricated CMI is shown in Figure 10, and the specifications of the fabricated CMIs are listed in Table 1.

Figure 10.
Picture of the fabricated CMI (CMI-1).

Table 1.
Parameters of fabricated single-phase common-mode inductors.
The CM small-signal characteristics of the CMIs were recorded with a network analyzer, following the measurement setup depicted in Figure 11, across a frequency range of 1 kHz to 30 MHz. The simulation model proposed was developed in LTspice according to a step-by-step procedure, which is presented as a flow chart in Figure 12, and all model parameters are comprehensively listed in Table 2.
Figure 11.
Configuration for measurement of attenuation characteristics of the fabricated CMIs.
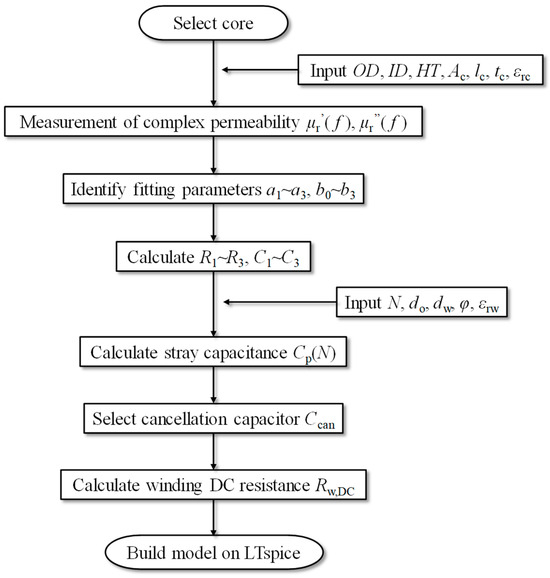
Figure 12.
Flow chart of the building procedure of the proposed simulation model.
Table 2.
Model parameters.
Two simulations shown in Figure 13 are performed for each CMI to obtain the voltage Vo1 when the CMI is not connected and the voltage Vo2 when the CMI is connected. Based on simulated Vo1 and Vo2, the attenuation characteristic GCM of the CMI can be calculated using Equation (19).
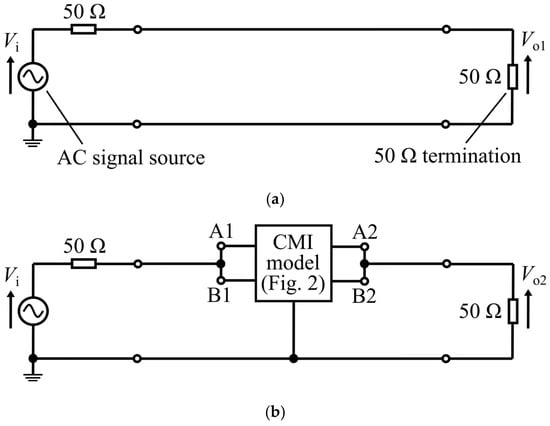
Figure 13.
Configurations for calculating attenuation characteristics of the fabricated CMIs: (a) without CMI; (b) with CMI.
4.2. Evaluation of the Small-Signal Characteristics
Figure 14 compares the measured and simulated small-signal characteristics of a nanocrystalline-based CMI (CMI-1) with and without the implementation of a cancellation capacitor. In Figure 14a, the measured data without the cancellation capacitor indicate a gradual reduction in the attenuation characteristic’s slope, starting from around 100 kHz. This observation is attributed to the significant decrease in the real component of the nanocrystalline’s complex permeability from around 100 kHz and the imaginary component exceeding the real component after 300 kHz, as demonstrated in Figure 4a. Additionally, self-resonance is observed at around 10 MHz due to the stray capacitance, and CM attenuation decreases from the self-resonance frequency. The simulation reproduces the small-signal characteristic of the nanocrystalline-based CMI over a wideband frequency range, incorporating the core’s frequency-responsive complex permeance and the estimated stray capacitance into the model. A minor deviation between 10–30 MHz may arise from variances between the actual and calculated stray capacitance values. Disparities in the core’s actual dimensions versus datasheet specifications and inaccuracies in the winding length per turn in the lab-created CMI could contribute to errors in stray capacitance estimation. Furthermore, the high-frequency mutual coupling effect between the CMI’s windings and the printed circuit board’s traces might negatively impact the CMI’s attenuation performance [31]. The mutual coupling effect is particularly influential in multistage EMI filters [19,32]. However, this effect is not factored into the simulation model in this article, as it focuses solely on the attenuation characteristics of a single magnetic component.
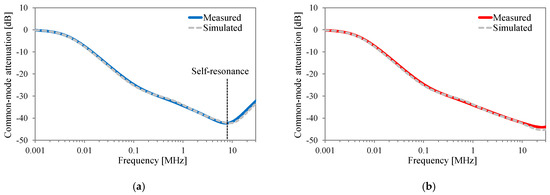
Figure 14.
Comparison between the measured and simulated attenuation characteristics of CMI−1: (a) without Ccan; (b) with Ccan.
Figure 14b compares the measured and simulated CM attenuation for the nanocrystalline-based CMI with cancellation capacitors. The results confirm that incorporating cancellation capacitors mitigates the effects of stray capacitance, allowing the CMI to maintain robust CM attenuation even beyond the 10 MHz frequency mark. The model proficiently predicts the improved attenuation provided by the CC method at frequencies over 10 MHz. A slight variation around 20–30 MHz may be due to the difference between the chosen value of the off-the-shelf cancellation capacitor and the ideally required capacitance value. The data from Figure 14a,b validate the reliability of the proposed simulation model.
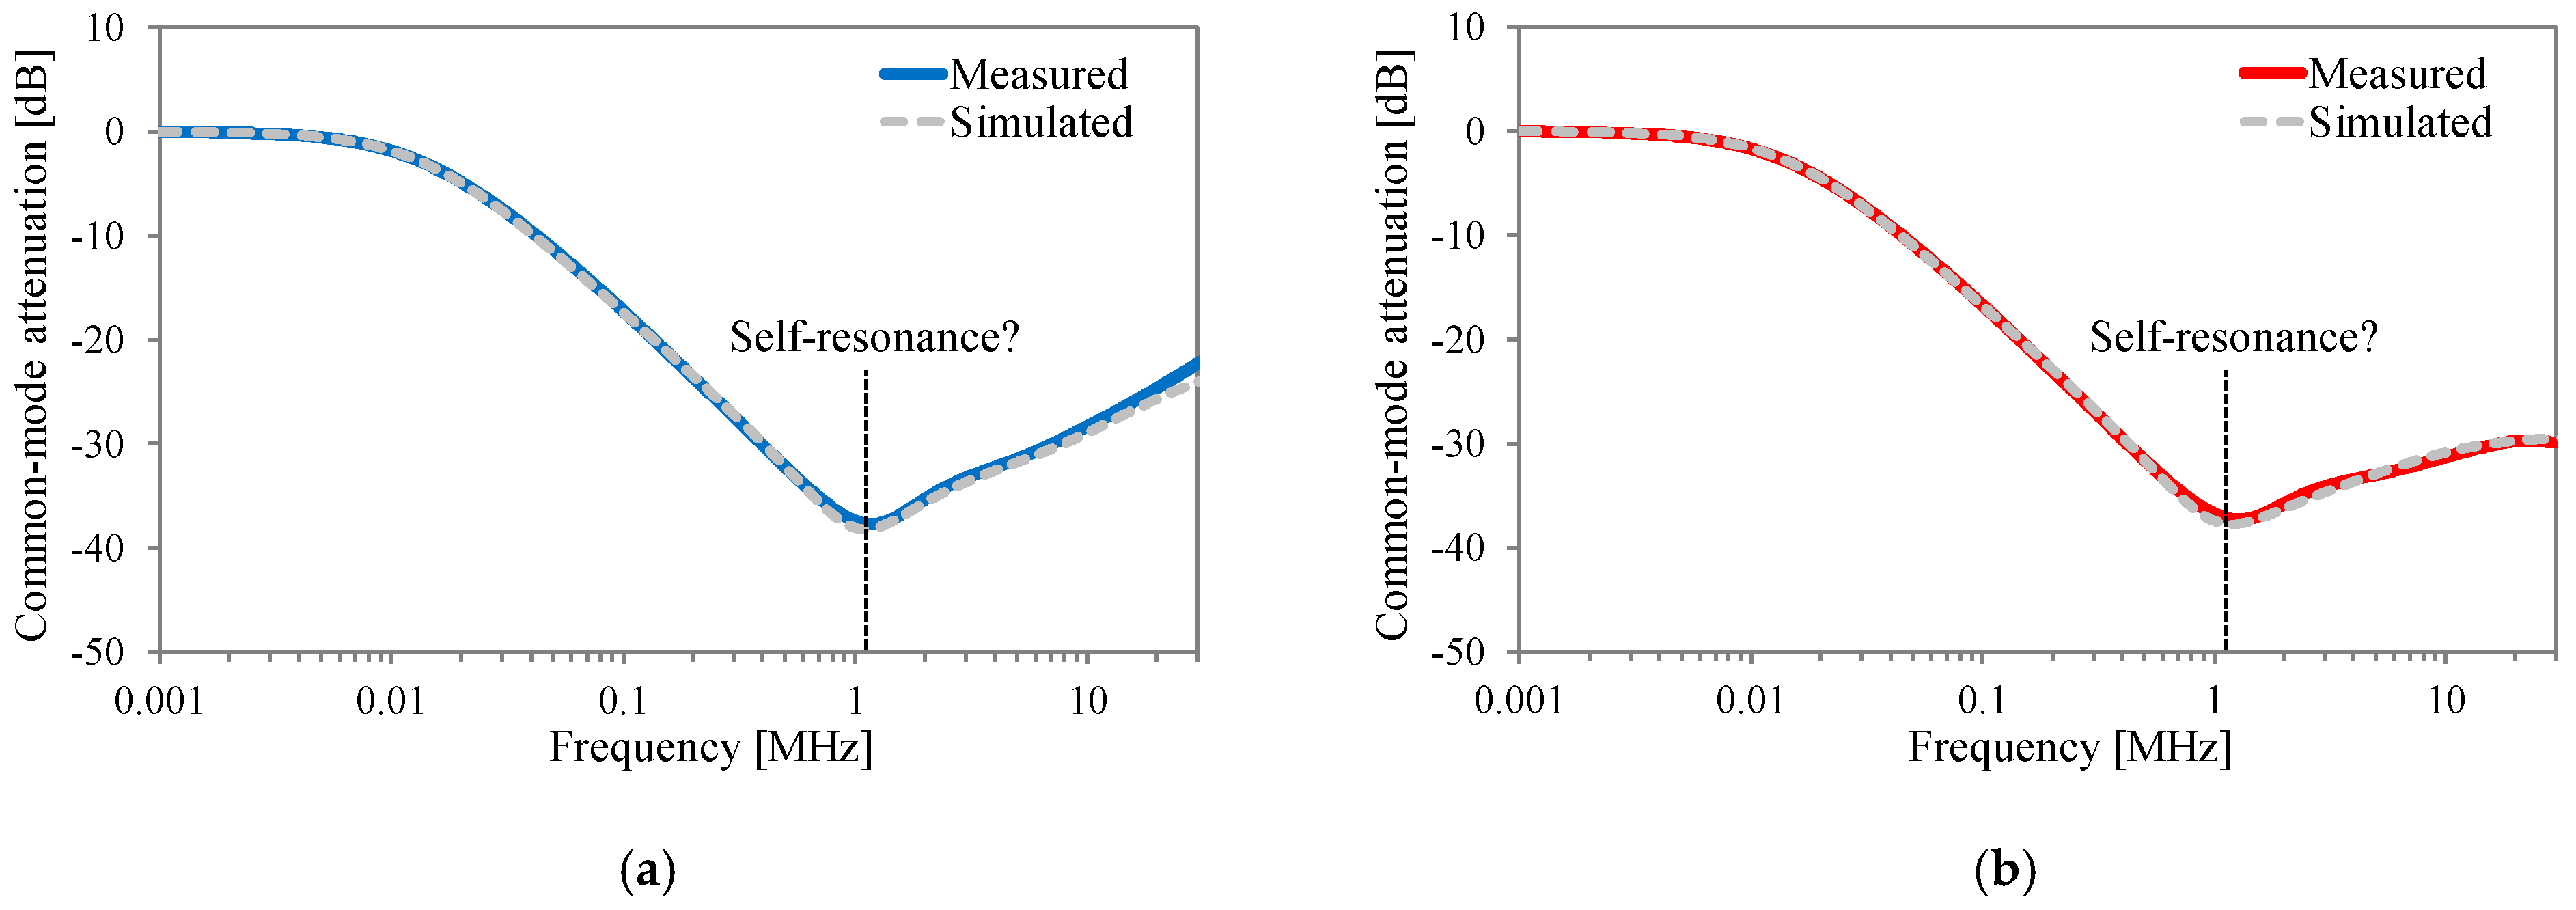
Figure 15a demonstrates that the proposed model accurately replicates the CM attenuation characteristic of the MnZn ferrite-based CMI (CMI-2) over a wideband frequency when the CC method is not employed. Additionally, the comparison in Figure 15b confirms the model’s capability to simulate the CM attenuation characteristic of CMI-2 with cancellation capacitors.
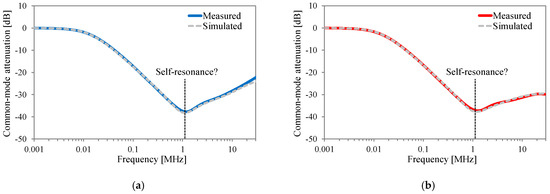
Figure 15.
Comparison between the measured and simulated attenuation characteristics of CMI−2: (a) without Ccan; (b) with Ccan.
Figure 15a,b show that the frequency at which the CM attenuation begins to deteriorate does not change from around 1 MHz, even when the CC method is applied. As already shown in Figure 4b, the real part of the complex permeability of MnZn ferrite decreases rapidly, and the imaginary part peaks around 1 MHz. Furthermore, the real part of the complex permeability shows negative polarity from about 1.5 MHz and converges slowly to zero. In the frequency range where the real part of the complex permeability shows negative polarity, the inductor behaves as a capacitive impedance component. Therefore, as shown in Figure 15b, even if the CC method is applied to cancel the effect of parallel stray capacitance, the frequency at which the CMI-2 attenuation characteristic begins to deteriorate does not change from around 1 MHz due to the frequency dependence of the complex permeability. As a result, the CM attenuation improvement by the CC method is smaller than that of CMI-1 based on the nanocrystalline core.
Since the proposed model implements both the frequency dependence of complex permeability and parallel stray capacitance, the proposed model can simulate the CM attenuation characteristic of the CMI-2 based on the MnZn ferrite core when the CC method is applied. Note that Figure 15a shows that a slight discrepancy between the measured and simulated CM attenuation from 10 to 30 MHz is observed. This is possible because of the error of calculated stray capacitance.
5. Conclusions
This article proposed a simulation model of single-phase CMIs to evaluate the impact of the CC method on the CM attenuation characteristic of CMIs. By connecting cancellation capacitors based on the estimated stray capacitance to the proposed simulation model, the attenuation characteristics of a single-phase CMI with the CC method can be simulated at the design stage of CMIs. The measurements of the CM attenuation of the fabricated CMIs were performed, and the measured results were compared with the simulated results. The comparison results clarified that the proposed model can simulate the CM attenuation characteristics of the CMI with the CC method over a wideband frequency. Furthermore, in the case of the MnZn ferrite-based CMI, the measured result clarified that the CM attenuation improvement by the CC method is limited due to the steep change in the complex permeability.
Some previous works have validated that the dimensional effect of MnZn ferrites can be mitigated by applying core lamination [23,33]. Thus, the combination of the CC method and core lamination to improve the CM attenuation of MnZn ferrite-based CMIs will be investigated as the next step of this study.
Funding
This research was supported by MEXT Program for Creation of Innovative Core Technology for Power Electronics Grant Number JPJ009777.
Institutional Review Board Statement
Not applicable.
Informed Consent Statement
Not applicable.
Data Availability Statement
Data are contained within the article.
Acknowledgments
The author would like to thank K. Wada of Tokyo Metropolitan University for supporting this article by providing his expertise in power electronics.
Conflicts of Interest
The author declares no conflicts of interest.
Appendix A
Equivalent core loss resistance Rc is calculated using the imaginary part of the complex permeability μr″ and is obtained as
Winding resistance Rw is given by
where the conductivity of copper at room temperature (T = 25 °C) is derived from Equation (9). Moreover, the skin depth of copper is obtained from the following Equation (A3).
To validate Equations (A2) and (A3), the resistance of a 1 m length copper wire (conductor diameter: 0.81 mm) was measured using the network analyzer. A comparison of the measured winding resistance and the calculated results from Equations (A2) and (A3) are shown in Figure A1.
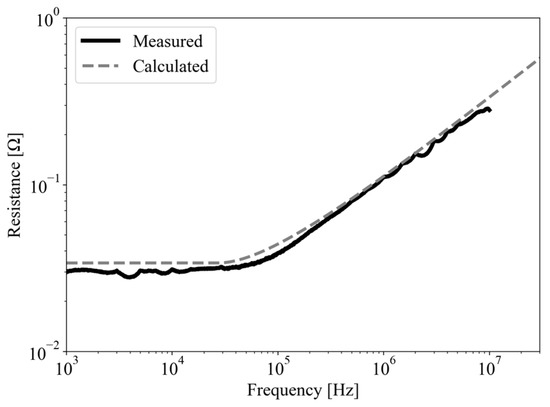
Figure A1.
Measured and calculated winding resistance (dw = 0.81 mm, NlT = 1 m).
Figure A1.
Measured and calculated winding resistance (dw = 0.81 mm, NlT = 1 m).
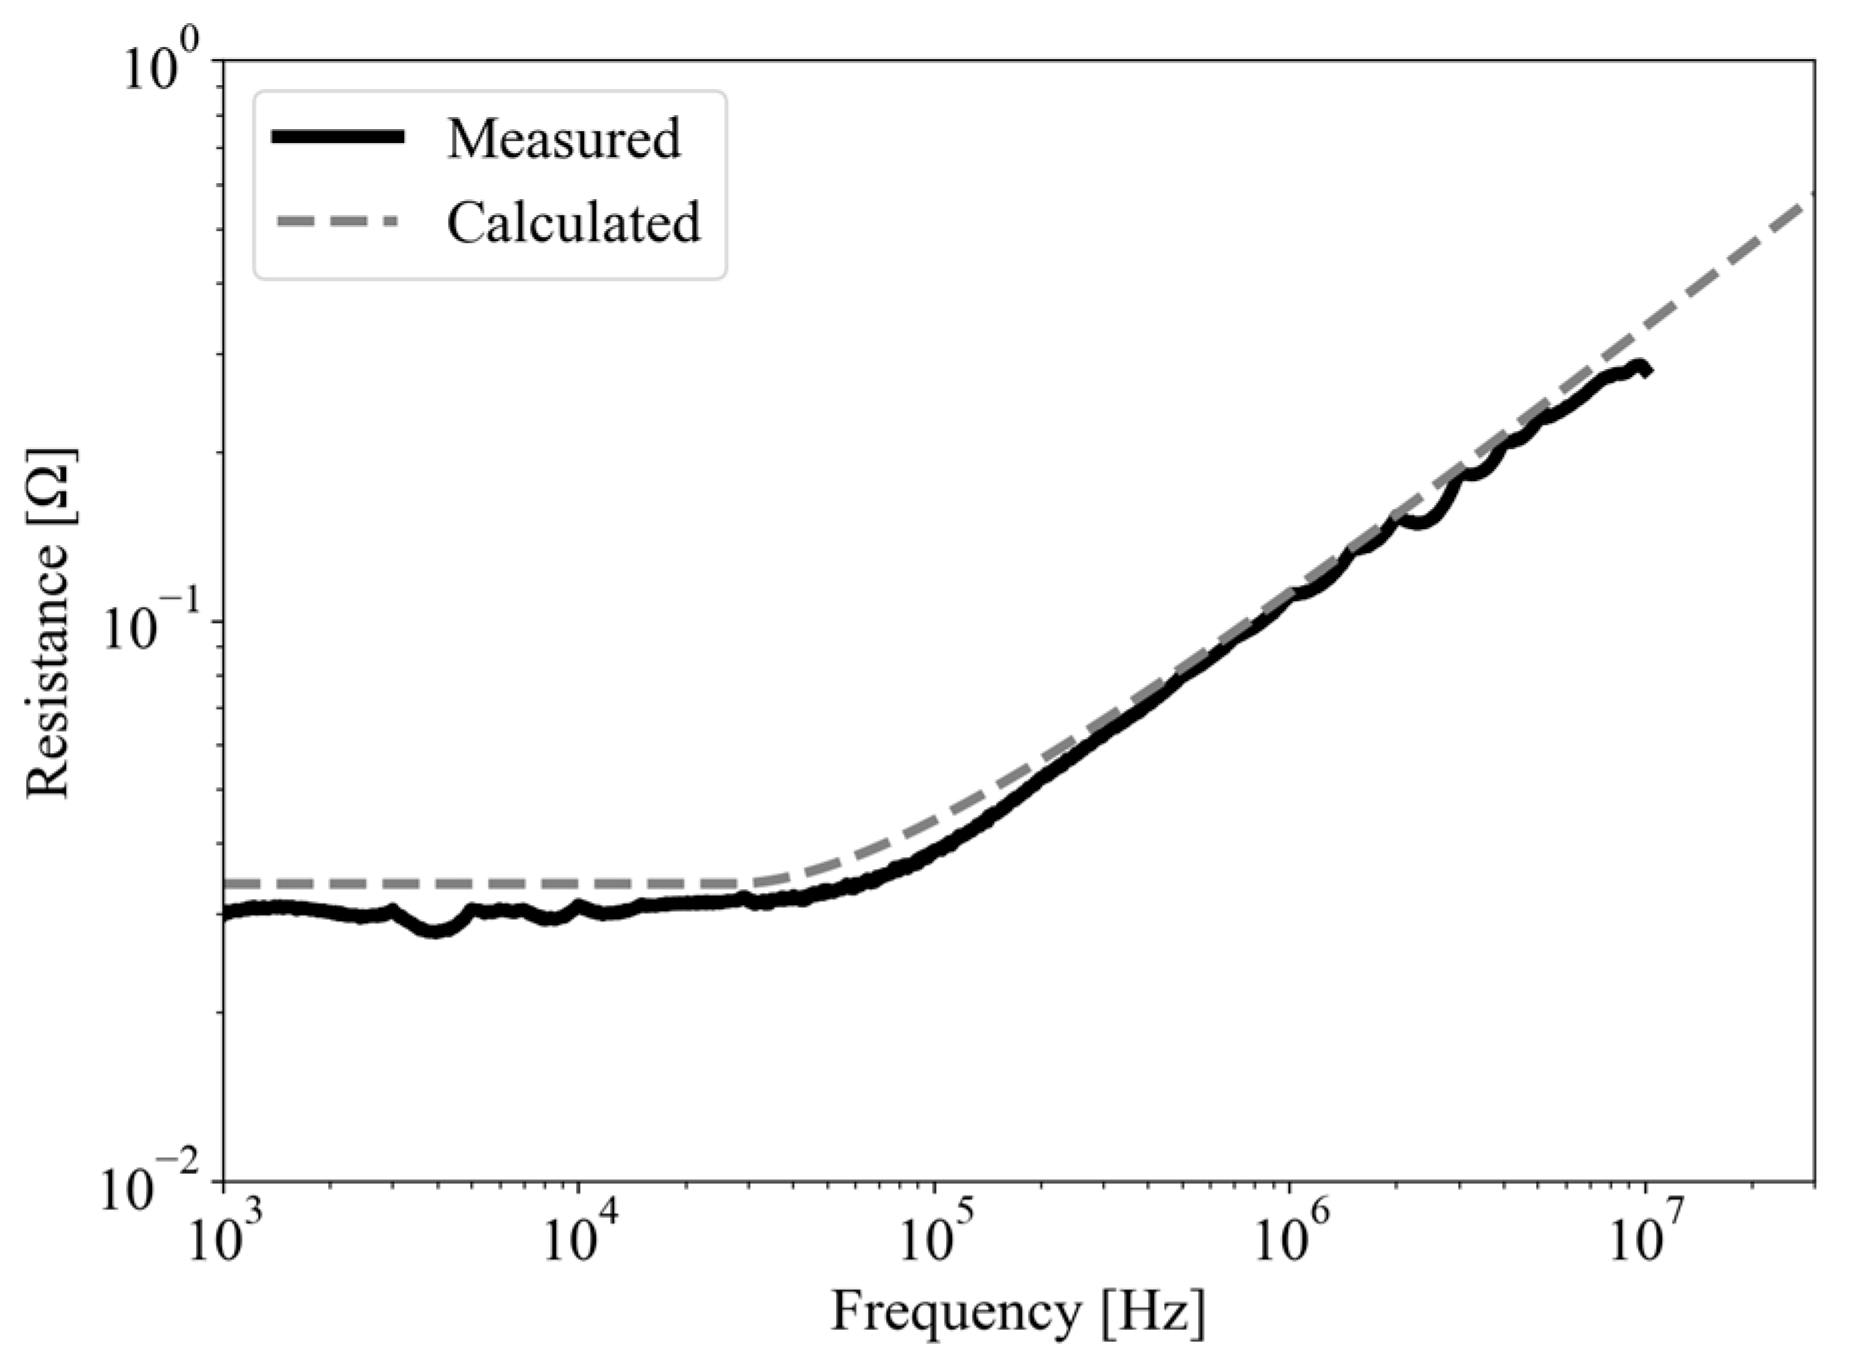
Since the measured winding resistance varied due to the transmission line effect in the high-frequency range, Figure A1 shows the measured result up to 10 MHz. Figure A1 confirms that the frequency characteristics of the winding resistance can be calculated over a wideband frequency from Equations (A2) and (A3).
Figure A2 compares the calculated equivalent core loss resistances and calculated winding resistances. The equivalent core loss resistances were calculated from Equation (A1) based on the specifications of CMI-1 listed in Table 1. Figure A2 includes the calculated results where the turn number N is set to 1, the minimum number of turns.
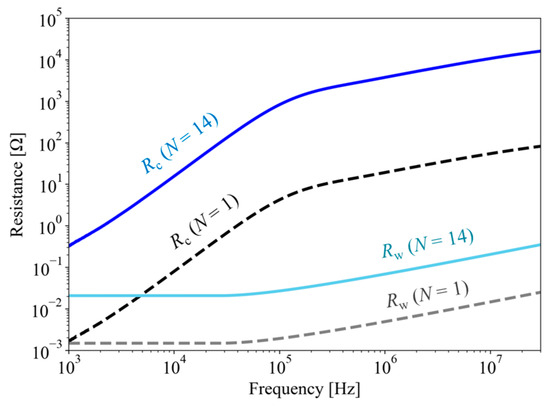
Figure A2.
Comparison of the core loss resistance and winding resistance of the CMI-1.
Figure A2.
Comparison of the core loss resistance and winding resistance of the CMI-1.
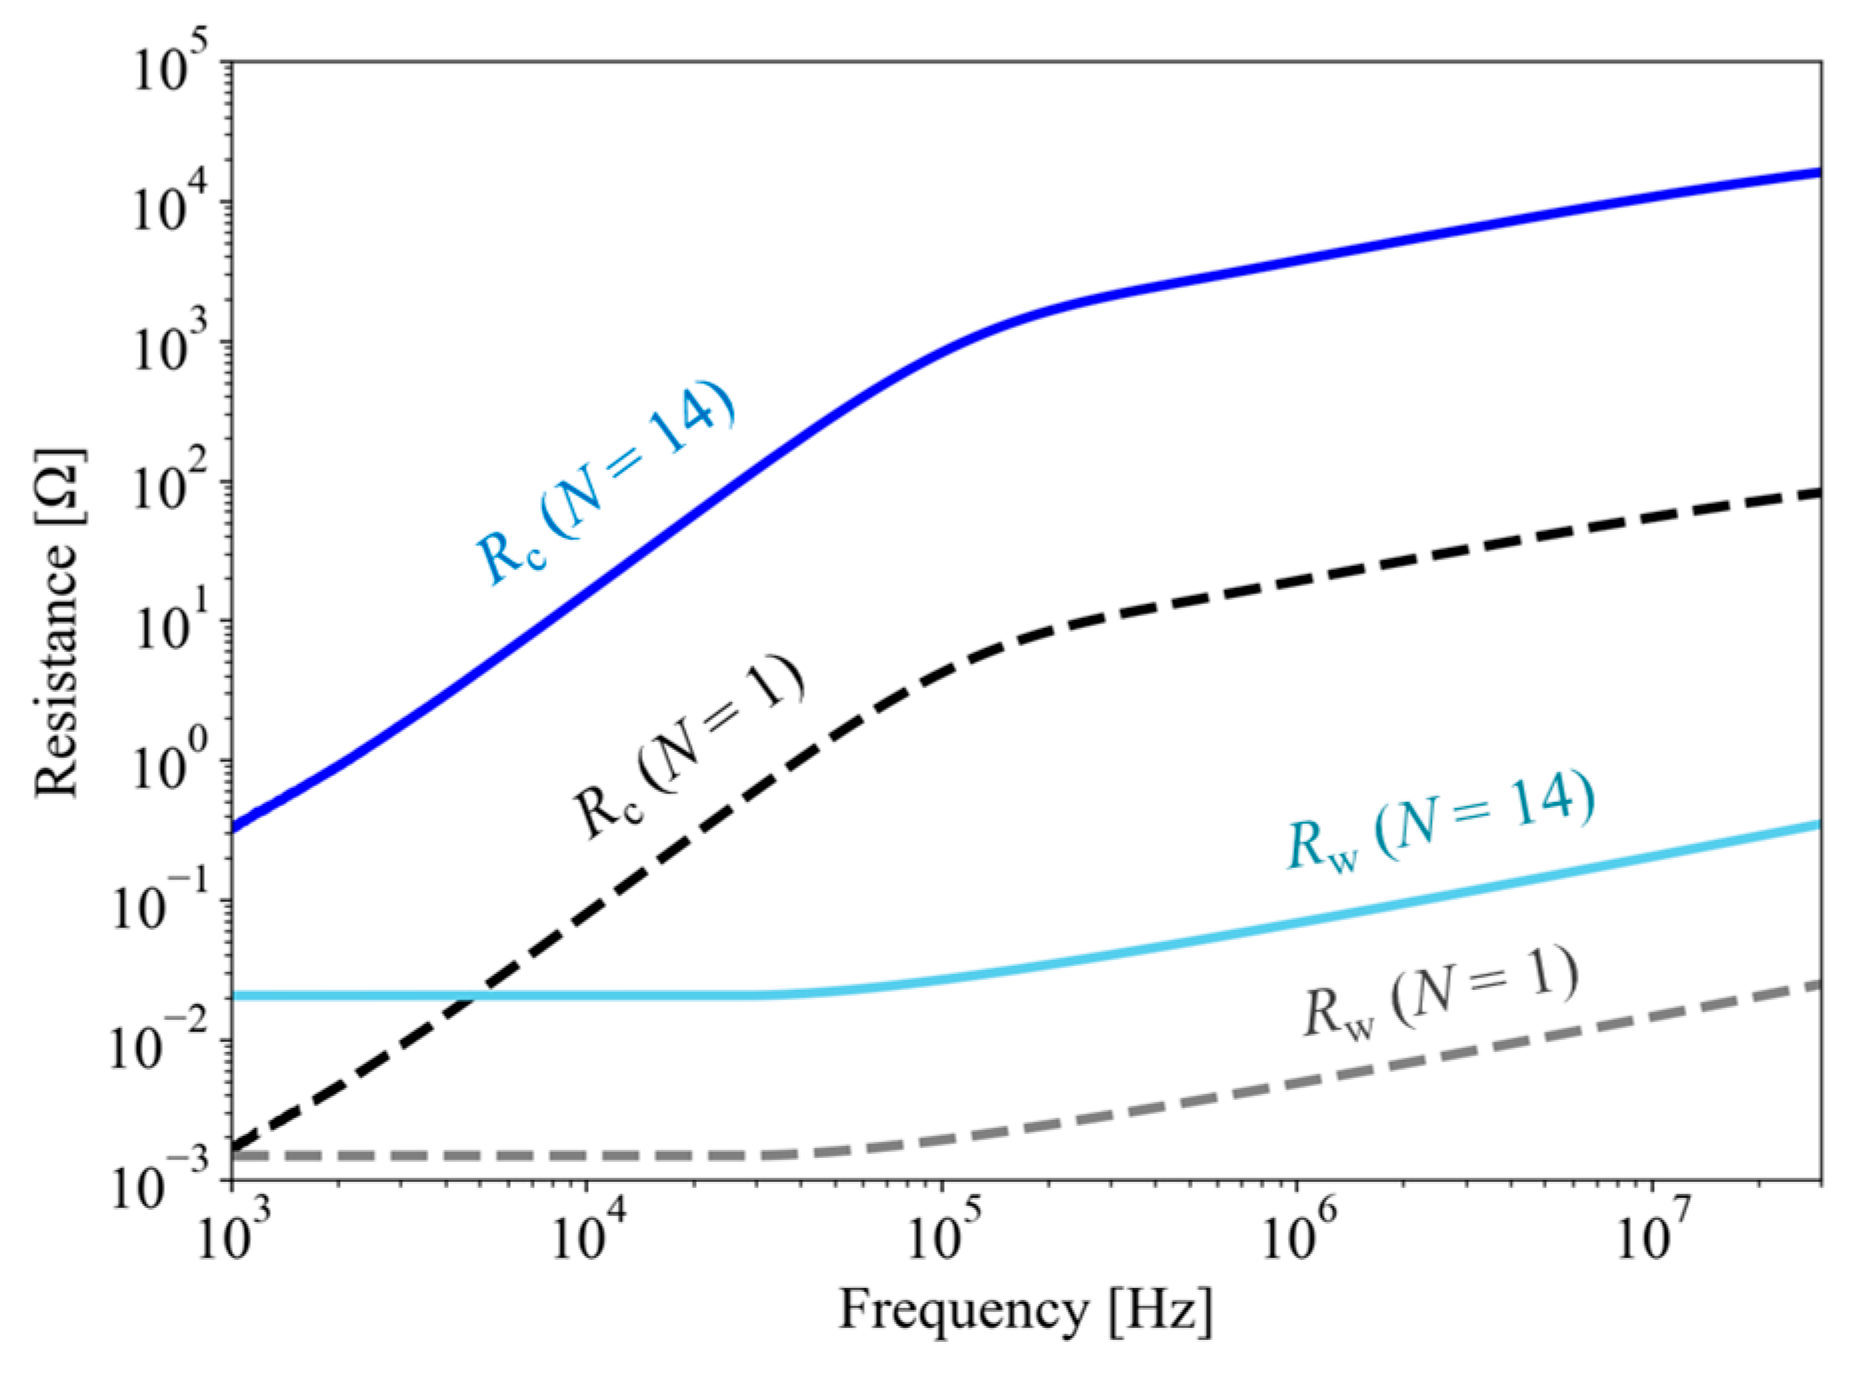
Figure A2 illustrates that for CMI-1 the equivalent core loss resistance substantially exceeds the winding resistance across the frequency range from 1 kHz to 30 MHz. This observation aligns closely with scenarios where the turn number is at its minimum, N = 1. Notably, around 10 MHz, the equivalent core loss resistance becomes the predominant factor in the CMI’s small-signal characteristics, especially at the point of self-resonance caused by parallel stray capacitance. Consequently, the influence of the winding AC resistance is almost inconsequential at the self-resonance frequency of CMI-1. Based on these observations in Figure A2, the winding AC resistance is not incorporated into the simulation model for single-phase CMIs discussed in this article. However, at the lower frequency vicinity of 1 kHz, when the turn number is set to 1, the equivalent core loss resistance and the winding DC resistance are approximately equal. As a result, the winding DC resistance is included in the proposed model to accurately simulate the impedance of CMIs in the low-frequency range with a reduced turn number.
References
- Biela, J.; Schweizer, M.; Waffler, S.; Kolar, J.W. SiC versus Si—Evaluation of Potentials for Performance Improvement of Inverter and DC–DC Converter Systems by SiC Power Semiconductors. IEEE Trans. Ind. Electron. 2011, 58, 2872–2882. [Google Scholar] [CrossRef]
- Han, D.; Morris, C.T.; Lee, W.; Sarlioglu, B. Comparison Between Output CM Chokes for Sic Drive Operating at 20- and 200-kHz Switching Frequencies. IEEE Trans. Ind. Appl. 2017, 53, 2178–2188. [Google Scholar] [CrossRef]
- Schrittwieser, L.; Leibl, M.; Haider, M.; Thony, F.; Kolar, J.W. 99.3% Efficient Three-Phase Buck-Type All-SiC SWISS Rectifier for DC Distribution Systems. IEEE Trans. Power Electron. 2019, 34, 126–140. [Google Scholar] [CrossRef]
- Engelmann, D.G.; Sewergin, A.; Neubert, M.; De Doncker, R.W. Design Challenges of SiC Devices for Low- and Medium- Voltage DC-DC Converters. IEEJ J. Ind. Appl. 2019, 8, 505–511. [Google Scholar] [CrossRef]
- Han, D.; Li, S.; Wu, Y.; Sarlioglu, B. Comparative Analysis on Conducted CM EMI Emission of Motor Drives: WBG Versus Si Devices. IEEE Trans. Ind. Electron. 2017, 64, 8353–8363. [Google Scholar] [CrossRef]
- Zhang, B.; Wang, S. A Survey of EMI Reserch in Power Electronics Systems with Wide-Bandgap Semiconductor Devices. IEEE J. Emerg. Sel. Top. Powe Electron. 2020, 8, 626–643. [Google Scholar] [CrossRef]
- Takahashi, S.; Wada, K.; Ayano, H.; Ogasawara, S.; Shimizu, T. Review of Modeling and Suppression Techniques for Electromagnetic Interference in Power Conversion Systems. IEEJ J. Ind. Appl. 2022, 11, 7–19. [Google Scholar] [CrossRef]
- Shih, F.Y.; Chen, D.Y.; Wu, Y.P.; Chen, Y.T. A Procedure for Designing EMI Filters for AC Line Applications. IEEE Trans. Power Electron. 1996, 11, 170–181. [Google Scholar] [CrossRef]
- Akagi, H.; Shimizu, T. Attenuation of Conducted EMI Emissions From an Inverter-Driven Motor. IEEE Power Electron. 2008, 23, 282–290. [Google Scholar] [CrossRef]
- Ala, G.; Giaconia, C.; Giglia, G.; DiPiazza, M.C.; Vitale, G. Design and Performance Evaluation of a High Power-Density EMI Filter for PWM Inverter-Fed Induction-Motor Drives. IEEE Ind. Appl. 2016, 52, 2397–2404. [Google Scholar] [CrossRef]
- Kącki, M.; Rylko, M.S.; Hayes, J.G.; Sullivan, C.R. Magnetic material selection for EMI filters. In Proceedings of the IEEE Energy Conversion Congress and Exposition (ECCE), Cincinnati, OH, USA, 1–5 October 2017; pp. 2350–2356. [Google Scholar]
- Heldwein, M.L.; Dalessandro, L.; Kolar, J.W. The Three-Phase Common-Mode Inductor: Modeling and Design Issues. IEEE Trans. Ind. Electron. 2011, 58, 3264–3274. [Google Scholar] [CrossRef]
- Kovacic, M.; Stipetic, S.; Krishnamurthy, S.; Zarko, D. Analytical Wideband Model of a Common-Mode Choke. IEEE Trans. Power Electron. 2012, 27, 3173–3185. [Google Scholar] [CrossRef]
- Stevanovic, I.; Skibin, S.; Masti, M.; Laitinen, M. Behavioral Modeling of Chokes for EMI Simulations in Power Electronics. IEEE Trans. Power Electron. 2013, 28, 695–705. [Google Scholar] [CrossRef]
- Pasko, S.W.; Kazimierczuk, M.K.; Grzesik, B. Self-Capacitance of Coupled Toroidal Inductors for EMI Filter. IEEE Trans. Electromagn. Compat. 2015, 57, 216–223. [Google Scholar] [CrossRef]
- Cuellar, C.; Idir, N.; Benabou, A. High-Frequency Behavioral Ring Core Inductor Model. IEEE Trans. Power Electron. 2016, 31, 3763–3772. [Google Scholar] [CrossRef]
- Palacios, C.D.; Bernal, J.; Prats, M.M. Characterization of Common Mode Chokes at High Frequencies with Simple Measurements. IEEE Trans. Power Electron. 2018, 33, 3975–3987. [Google Scholar] [CrossRef]
- Wang, S.; Lee, F.C.; Van Wyk, J.D. Design of Inductor Winding Capacitance Cancellation foe EMI Suppression. IEEE Trans. Power Electron. 2006, 21, 1825–1832. [Google Scholar] [CrossRef]
- Heldwein, M.L.; Kolar, J.W. Winding Capacitance Cancellation for Three-Phase EMC Input Filters. IEEE Trans. Power Electron. 2008, 23, 2062–2074. [Google Scholar] [CrossRef]
- Takahashi, S.; Wada, K. Simple Method for Estimation of Stray Capacitance of Toroidal Inductors by Considering an Insulation between Winding and Core. IEEJ Trans. Ind. Appl. 2021, 142, 33–40. [Google Scholar] [CrossRef]
- Takahashi, S.; Maekawa, S. Wideband Small-Signal Model of Common-Mode Inductors Based on Stray Capacitance Estimation Method. IEEJ J. Ind. Appl. 2022, 11, 514–521. [Google Scholar] [CrossRef]
- Wunsch, B.; Christen, T.; Skibin, S.; Forsstom, V. Broadband Circuit Model of a Ferrite Core, Including Dimensional Resonance, Saturation, and Hysteresis. IEEE Trans. Magnet. 2019, 55, 7300605. [Google Scholar] [CrossRef]
- Takahashi, S. Experimental Investigation of the Dimensional Effect on Small-Signal Characteristics of Common-Mode Inductors. IEEE Access 2022, 10, 123068–123079. [Google Scholar] [CrossRef]
- Nomura, K.; Kojima, T.; Hattori, Y. Straightforward Modeling of Complex Permeability for Common Mode Chokes. IEEJ J. Ind. Appl. 2018, 7, 462–472. [Google Scholar] [CrossRef]
- Takahashi, S.; Ogasawara, S. A Novel Simulation Model for Common-Mode Inductors Based on Permeance-Capacitance Analogy. In Proceedings of the IEEE Energy Conversion Congress and Expo (ECCE 2020), Detroit, MI, USA, 11–15 October 2020; pp. 5862–5869. [Google Scholar]
- Dalessandro, L.; Odendaal, W.G.H.; Kolar, J.W. HF Characterization and Nonlinear Modeling of a Gapped Toroidal Magnetic Structure. IEEE Trans. Power Electron. 2006, 21, 1167–1175. [Google Scholar] [CrossRef]
- Blanken, P.G.; Van Vlerken, J.J.L.M. Modeling of Electromagnetic systems. IEEE Trans. Magn. 1991, 27, 4509–4515. [Google Scholar] [CrossRef]
- Allmeling, J.; Hammer, W.; Schonberger, J. Transient Simulation of Magnetic Circuits Using the Permeance-Capacitance Analogy. In Proceedings of the 2012 IEEE 13th Workshop on Control and Modeling for Power Electronics (COMPEL), Kyoto, Japan, 10–13 June 2012; pp. 1–6. [Google Scholar]
- Massarini, A.; Kazimierczuk, M.K. Self-Capacitance of Inductors. IEEE Trans. Power Electron. 1997, 12, 671–676. [Google Scholar] [CrossRef]
- Ayachit, A.; Kazimierzuk, M.K. Self-Capacitance of Single-Layer Inductors With Separation Between Conductor Turns. IEEE Trans. Electromagn. Compat. 2017, 59, 1642–1645. [Google Scholar] [CrossRef]
- Wang, S.; Lee, F.C.; Chen, D.Y.; Odendaal, W.G. Effects of Parasitic Parameters on EMI Filter Performance. IEEE Trans. Power Electron. 2004, 19, 869–877. [Google Scholar] [CrossRef]
- Cuellar, C.; Idir, N. Reduction of the Parasitic Couplings in the EMI Filters to Improve the High Frequency Insertion Loss. In Proceedings of the 44th Annual Conference of the IEEE Industrial Electronics Society, Washington, DC, USA, 20–23 October 2018; pp. 5766–5771. [Google Scholar]
- Kacki, M.; Rylko, M.S.; Hayes, J.G.; Sullivan, C.R. A High-Performance EMI Filter Based on Laminated Ferrite Ring Cores. In Proceedings of the 24th European Conference on Power Electronics and Applications (EPE’22 ECCE Europe), Hanover, Germany, 5–9 September 2022; pp. 1–7. [Google Scholar]


Disclaimer/Publisher’s Note: The statements, opinions and data contained in all publications are solely those of the individual author(s) and contributor(s) and not of MDPI and/or the editor(s). MDPI and/or the editor(s) disclaim responsibility for any injury to people or property resulting from any ideas, methods, instructions or products referred to in the content. |
© 2024 by the author. Licensee MDPI, Basel, Switzerland. This article is an open access article distributed under the terms and conditions of the Creative Commons Attribution (CC BY) license (https://creativecommons.org/licenses/by/4.0/).