1. Introduction
In recent years, the construction industry has witnessed a transformative shift, with the advent of 3D printing technology revolutionizing traditional building methods. One of the most groundbreaking developments in this domain is 3D-printed concrete, a cutting-edge construction technique that has the potential to reshape the way we build structures. 3D-printed concrete, also known as the 3D printing of concrete or concrete 3D printing, is an innovative construction technology that uses computer-controlled robotic systems or large-scale 3D printers to deposit layers of concrete material in a precise and predetermined manner [
1,
2]. 3D-printed concrete (3DPC) finds applications across residential, commercial, and infrastructure projects, ranging from walls and buildings to bridges and smaller structures, all while continuing to evolve and shape the future of construction.
However, as the adoption of 3DPC grows, the need for sustainable and environmentally-responsible practices becomes increasingly critical. This environmental consideration is expected to gain further prominence in the future, particularly as 3D-printed concrete is applied in the construction of temporary buildings. The swift production pace inherent to this technology necessitates the prompt encounter and management of demolition waste in such projects. This dual emphasis on sustainability and efficiency positions 3D-printed concrete as a promising solution not only for current construction needs but also for the evolving demands of future structures. The construction industry’s increasing inclination towards environmentally-conscious and resource-efficient solutions underscores the transformative potential of 3D-printed concrete in shaping the future of construction methodologies [
3,
4].
The incorporation of recycled coarse aggregate (RCA) into concrete mixes presents a promising avenue for sustainable construction practices. Various studies have delved into the impact of RCA replacement ratios on both the mechanical properties and durability of concrete structures. Research indicates that up to 30% RCA replacement has no significant impact on mechanical properties [
5]. At 50% RCA replacement, there is typically a 10–15% reduction, and at 100% replacement, it can reduce mechanical properties by 30–40% [
6,
7,
8,
9]. Over a 2-year period, Abed et al. [
10] investigated the compressive strength of concrete, incorporating 0%, 25%, and 50% of RCA alongside supplementary cementitious materials, revealing increased strength in recycled aggregate (RA) mixes over natural aggregate (NA) mixes and suggesting enhanced long-term performance attributed to the continuous hydration of attached mortar on the RCA, even during freeze-thaw cycles. Gonzalez and Moriconi [
11] recommend that in regions prone to severe seismic activity, it is sufficient to replace up to 30% of conventional NA with RA to maintain acceptable structural performance. Kou and Poon [
12] assessed the mechanical properties of RA produced from parent concrete (PC) with 28-day compressive strengths ranging from 30 to 100 MPa. After 28 days, concrete derived from PC with 80 and 100 MPa compressive strengths exhibited strengths exceeding 65 MPa, slightly surpassing those of natural aggregate concrete. Over a 90-day period, both mixtures achieved compressive strengths of 75 MPa. The highest compressive strength reported by Tu et al. [
13] was 42 MPa after 91 days at a water-cement (w/c) ratio of 0.32.
In addressing the potential adverse effects on strength and durability in structural applications due to RCA, various guidelines have been established to provide specific recommendations. One such guideline, HB155-2002 [
14], proposes measures to control the use of RCA in different concrete grades. For instance, it suggests limiting the replacement of conventional coarse aggregate with Class 1A RCA to 30% in Grade 1 structural concrete. In contrast, Grade 2 non-structural concrete is permitted to have a 100% replacement with RCA. Adding to this, BV-MI 01: 2005(H) [
15] introduces recommendations that involve varying levels of RCA replacement, ranging from 30% to 100%, based on class strength and the geometrical properties of aggregates. However, it advises not to use RCA replacement for C50/60 and above class strength. It is noteworthy that different countries have adopted varying approaches to regulate the percentage of RCA replacement. For example, Brazil, China, Spain, and the UK have set a lower limit, restricting RCA replacement to 20% for structural concrete [
16]. The diversification in these guidelines reflects regional considerations, experiences, and research findings, emphasizing the need for a nuanced approach in addressing the challenges associated with incorporating recycled materials in concrete production.
In conventional concrete, the use of aggregates with a diverse range of particle sizes is a common practice aimed at enhancing packing density and overall strength. However, in the realm of 3D-printed concrete, a departure from this conventional approach is observed. Instead, a more deliberate emphasis is placed on achieving a controlled and uniform particle size distribution of the fine aggregate [
17]. This strategic adjustment is designed to facilitate a consistent flow through the printer nozzle, thereby ensuring the smooth extrusion of the material during the 3D printing process.
Hence, it is essential to determine the optimal replacement level for the recycled aggregate (RA) sourced from 3D-printed concrete waste to uphold the mechanical properties of the concrete. Additionally, a mechanism needs to be developed for incorporating the fine particle size RA into the mix. The decision to include fine recycled aggregate is influenced by the fact that the parental material (i.e., 3D-printed concrete) consists solely of fine aggregate, introducing an additional aspect for investigation.
This study aims to investigate the feasibility of recycling 3D-printed concrete waste as an aggregate in normal strength concrete, focusing on compressive strengths for the C30/37 and C40/50 MPa classes, covering both fine and coarse aggregates in particle size distribution.
Despite the increasing interest in 3D-printed concrete, there is a notable gap in comprehensive research on utilizing recycled aggregate (RA) from this material in conventional concrete production. This study seeks to bridge the divide between cutting-edge construction techniques and sustainable resource management. By repurposing waste materials from 3D-printed concrete processes, the objective is to showcase the potential for establishing a closed-loop system within the construction industry.
2. Materials and Methods
2.1. Materials
The material employed in the fabrication of 3D-printed concrete is the premixed white powder known as Sikacrete
®-752 3D, combined solely with water. Sikacrete
®-752 3D incorporates a fine aggregate with a maximum size of 2 mm, along with Portland cement and additives [
18]. The specific type and proportions of these constituents are proprietary to the Sika company (Biatorbágy, Hungary). When mixing this powder with water, the company prescribes a water-to-powder ratio (w/p) ranging from 14% to 16%, based on the weight of the powder [
18].
The 3D-printed concrete waste, obtained after Kovács [
19] conducted a comprehensive investigation into the material properties of Sikacrete
®-752 using both conventional and 3D printing casting methods for her MSc thesis work, is outlined in
Table 1. The table includes relevant information on casting types, the material’s water-to-powder ratio (w/p), and printing directions, with the symbol N/A indicating ‘Not Applicable’. Following this study, the 3D-printed concrete waste was processed by crushing it into fine and coarse aggregates using a jaw crusher in one step.
In the recycling approach, all crushed particle sizes, including both fine and coarse particles, were used as recycled aggregates. This approach towards recycled aggregate usage emphasizes a comprehensive and sustainable recycling strategy. By incorporating the full spectrum of particle sizes, the aim is to optimize the potential for reusing 3D-printed concrete waste in a manner that enhances the overall material sustainability and minimizes environmental impact.
In this experimental study, a two-stage investigation was conducted to evaluate the performance of concrete specimens in terms of compressive strength using a 150 mm cube mold [
20]. The initial stage concentrated on producing reference specimens, representing conventional concrete with no replacement. The materials used in this phase included CEM II/AS 42.5 N [
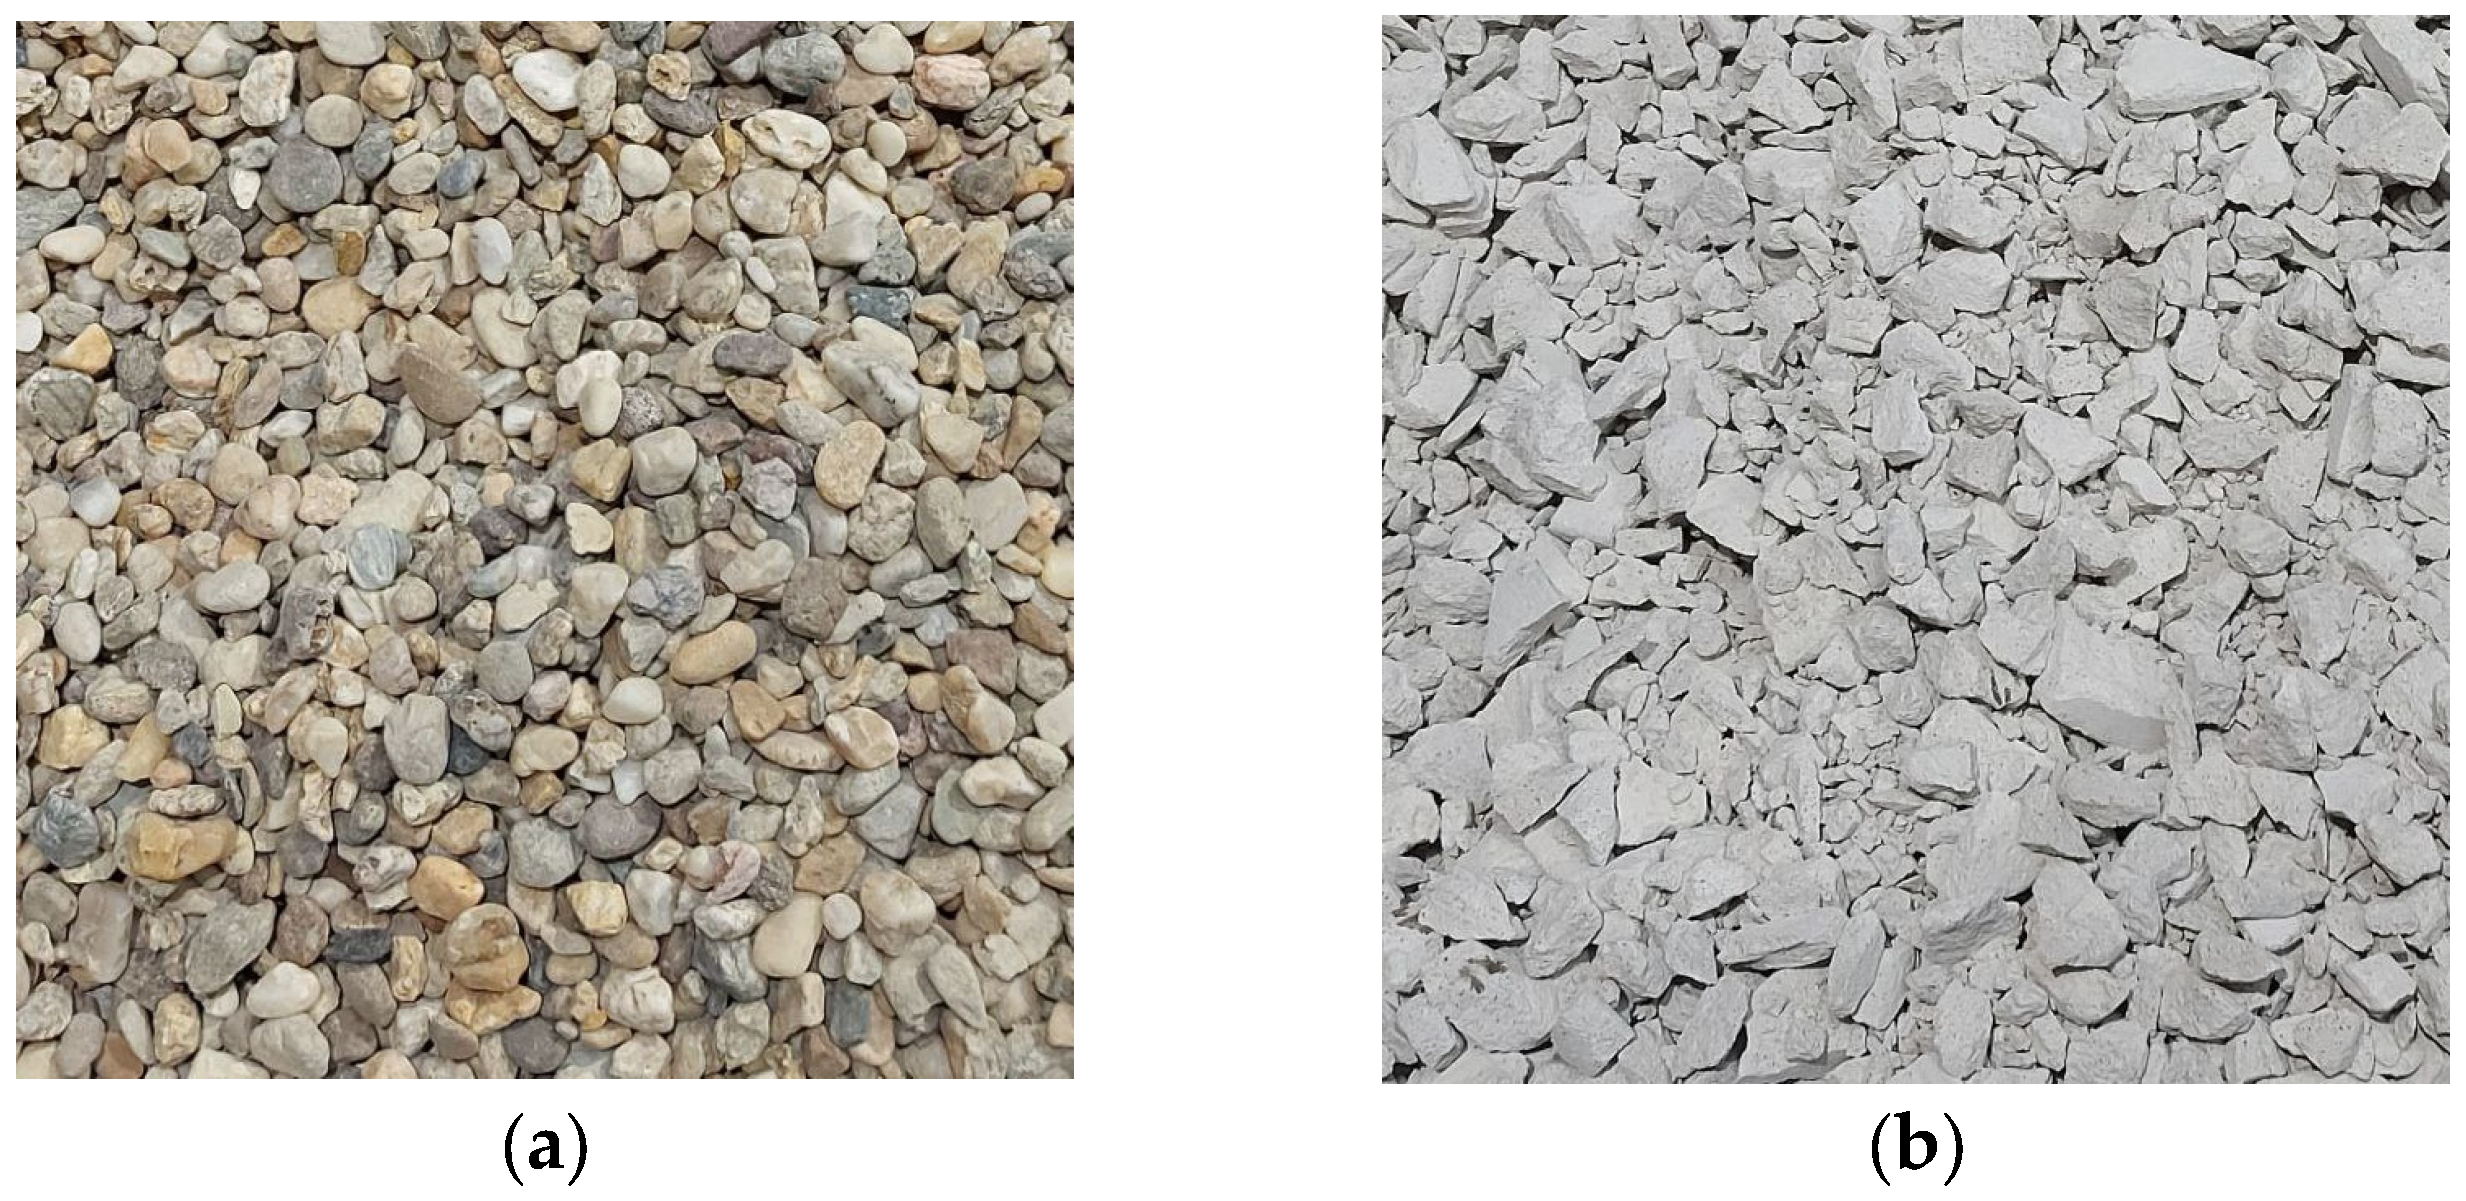
21], river sand, and quartz gravel, aiming to establish a baseline for standard or reference mixes. These reference specimens, following conventional practices, serve as a reference point for subsequent comparisons. Having completed the first stage, the transition to the second phase emphasized the incorporation of recycled aggregate (RA) sourced from 3D-printed concrete. Visual representations of both quartz gravel and recycled aggregates from the 3D printed concrete are presented in
Figure 1.
The specimens in this stage, still utilizing a 150 mm cube mold, showcase the potential of recycled materials in concrete production.
2.2. Particle Size Distribution
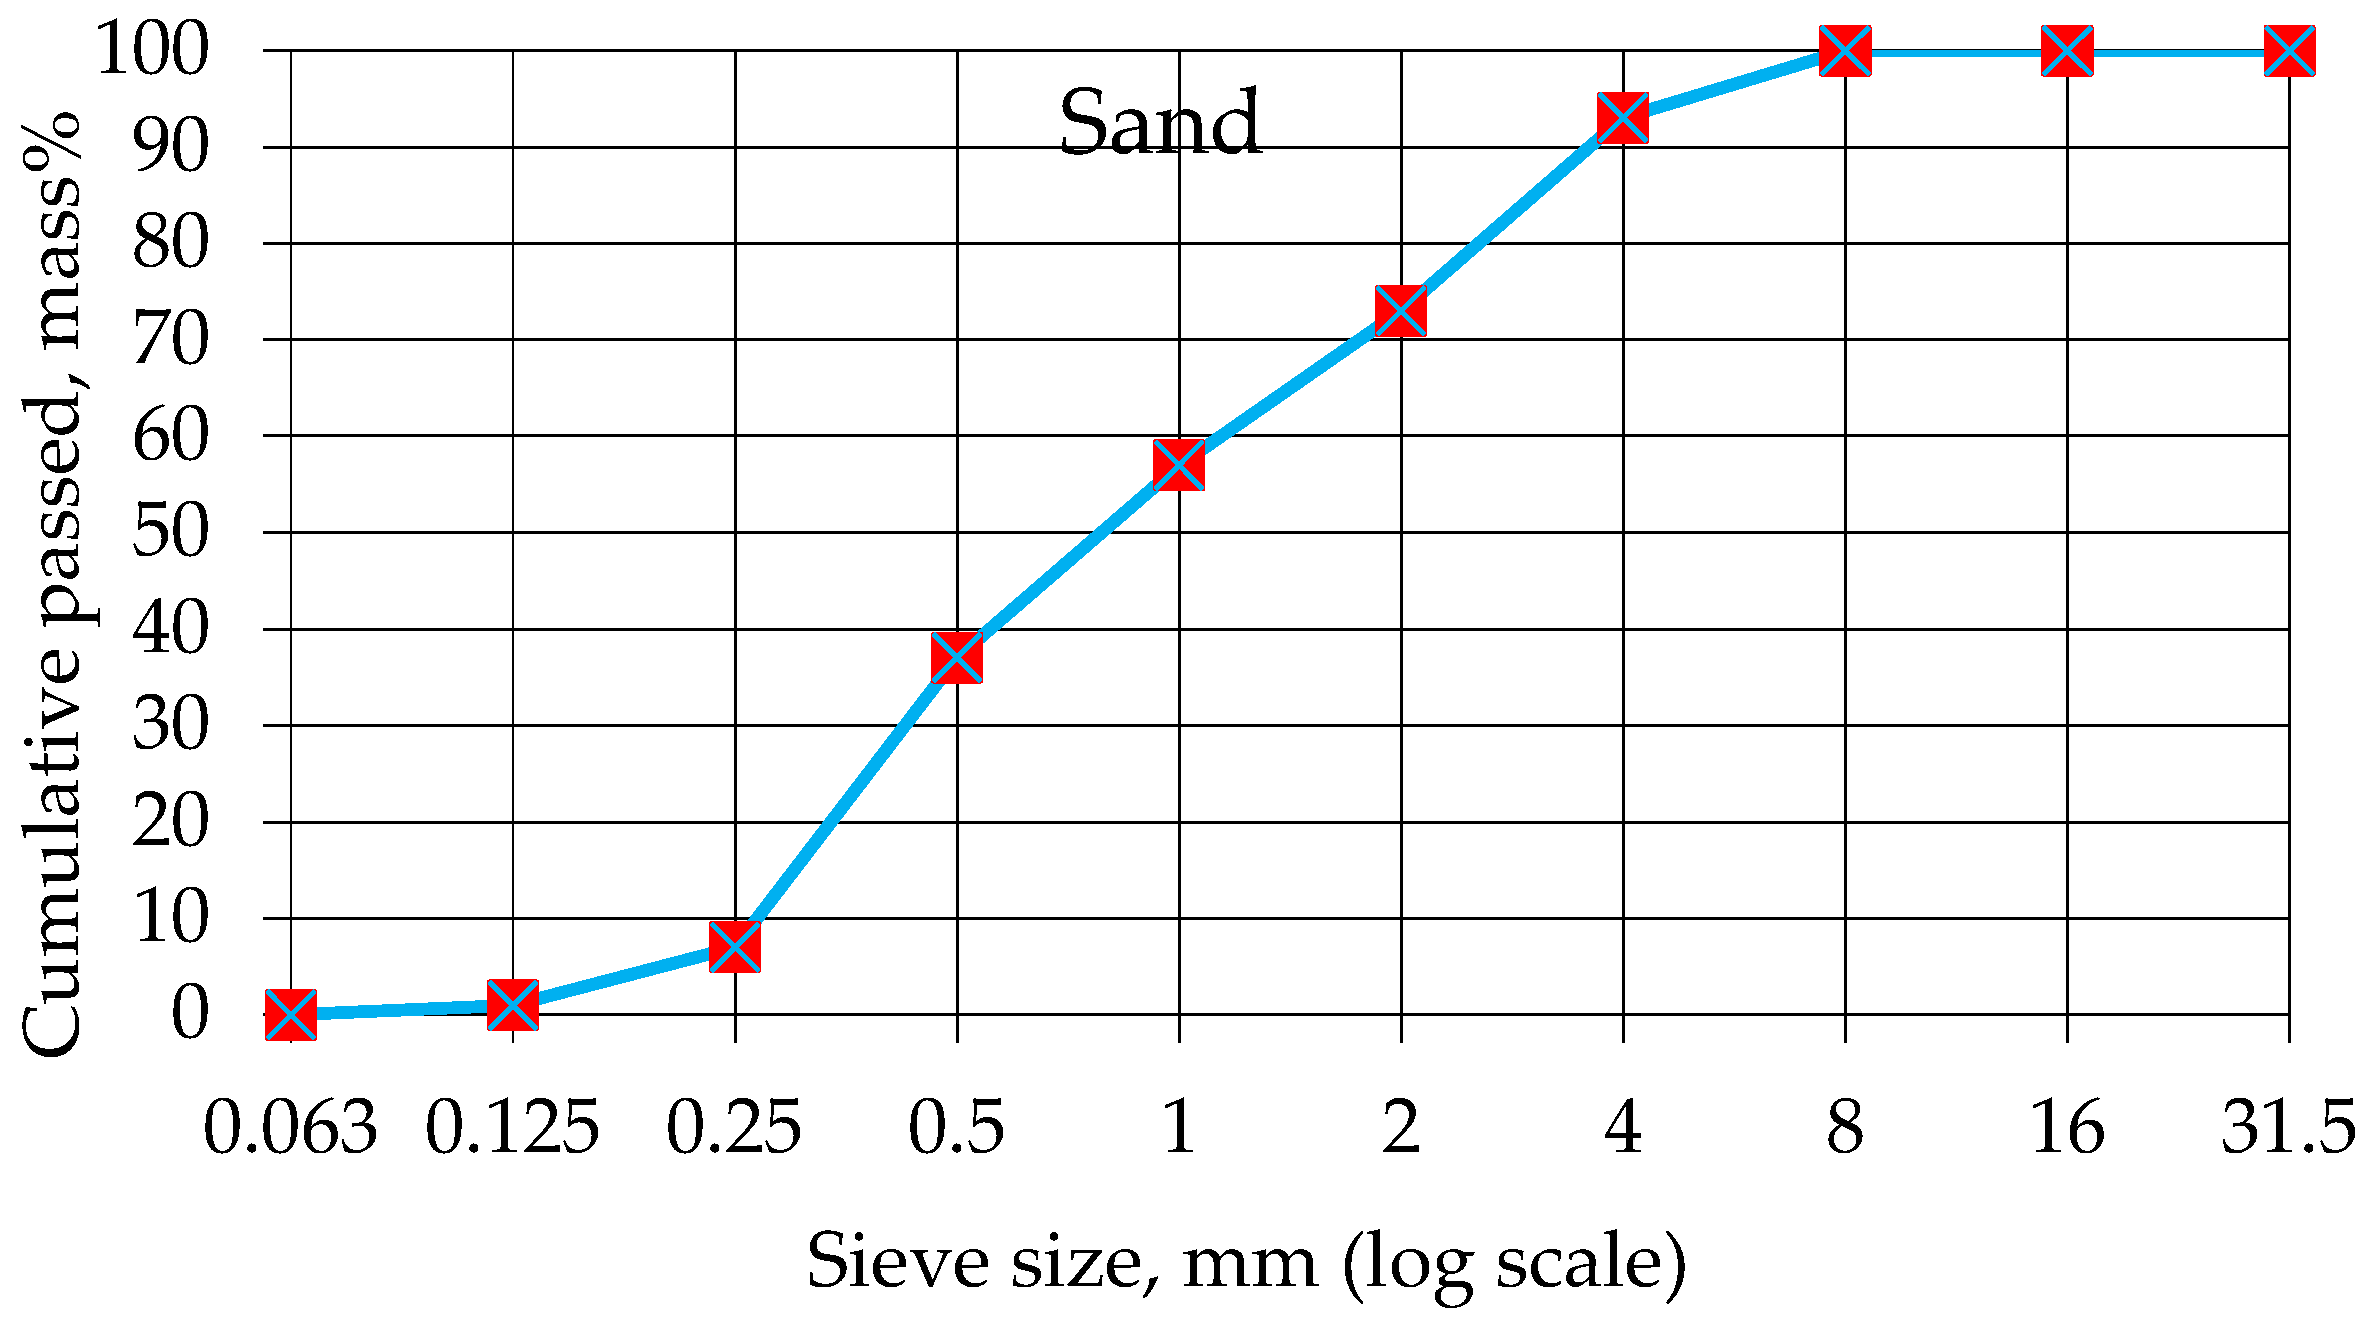
The meticulous attention to adhering to established particle distribution grading curves underscores the importance of maintaining compatibility with industry standards, particularly in the pursuit of sustainable and performance-enhancing concrete formulations. To determine the extent of recycled aggregate (RA) replacement, a precise sieve analysis was performed on the RA sourced from 3D-printed concrete and the river sand in accordance with the specifications outlined in EN 933-1:2012 [
22]. This standardized procedure ensures the accurate assessment and comparison of particle size distribution for both types of aggregates. The resulting grading curves for each aggregate are visually represented in
Figure 2 and
Figure 3, providing a clear depiction of the size distribution characteristics.
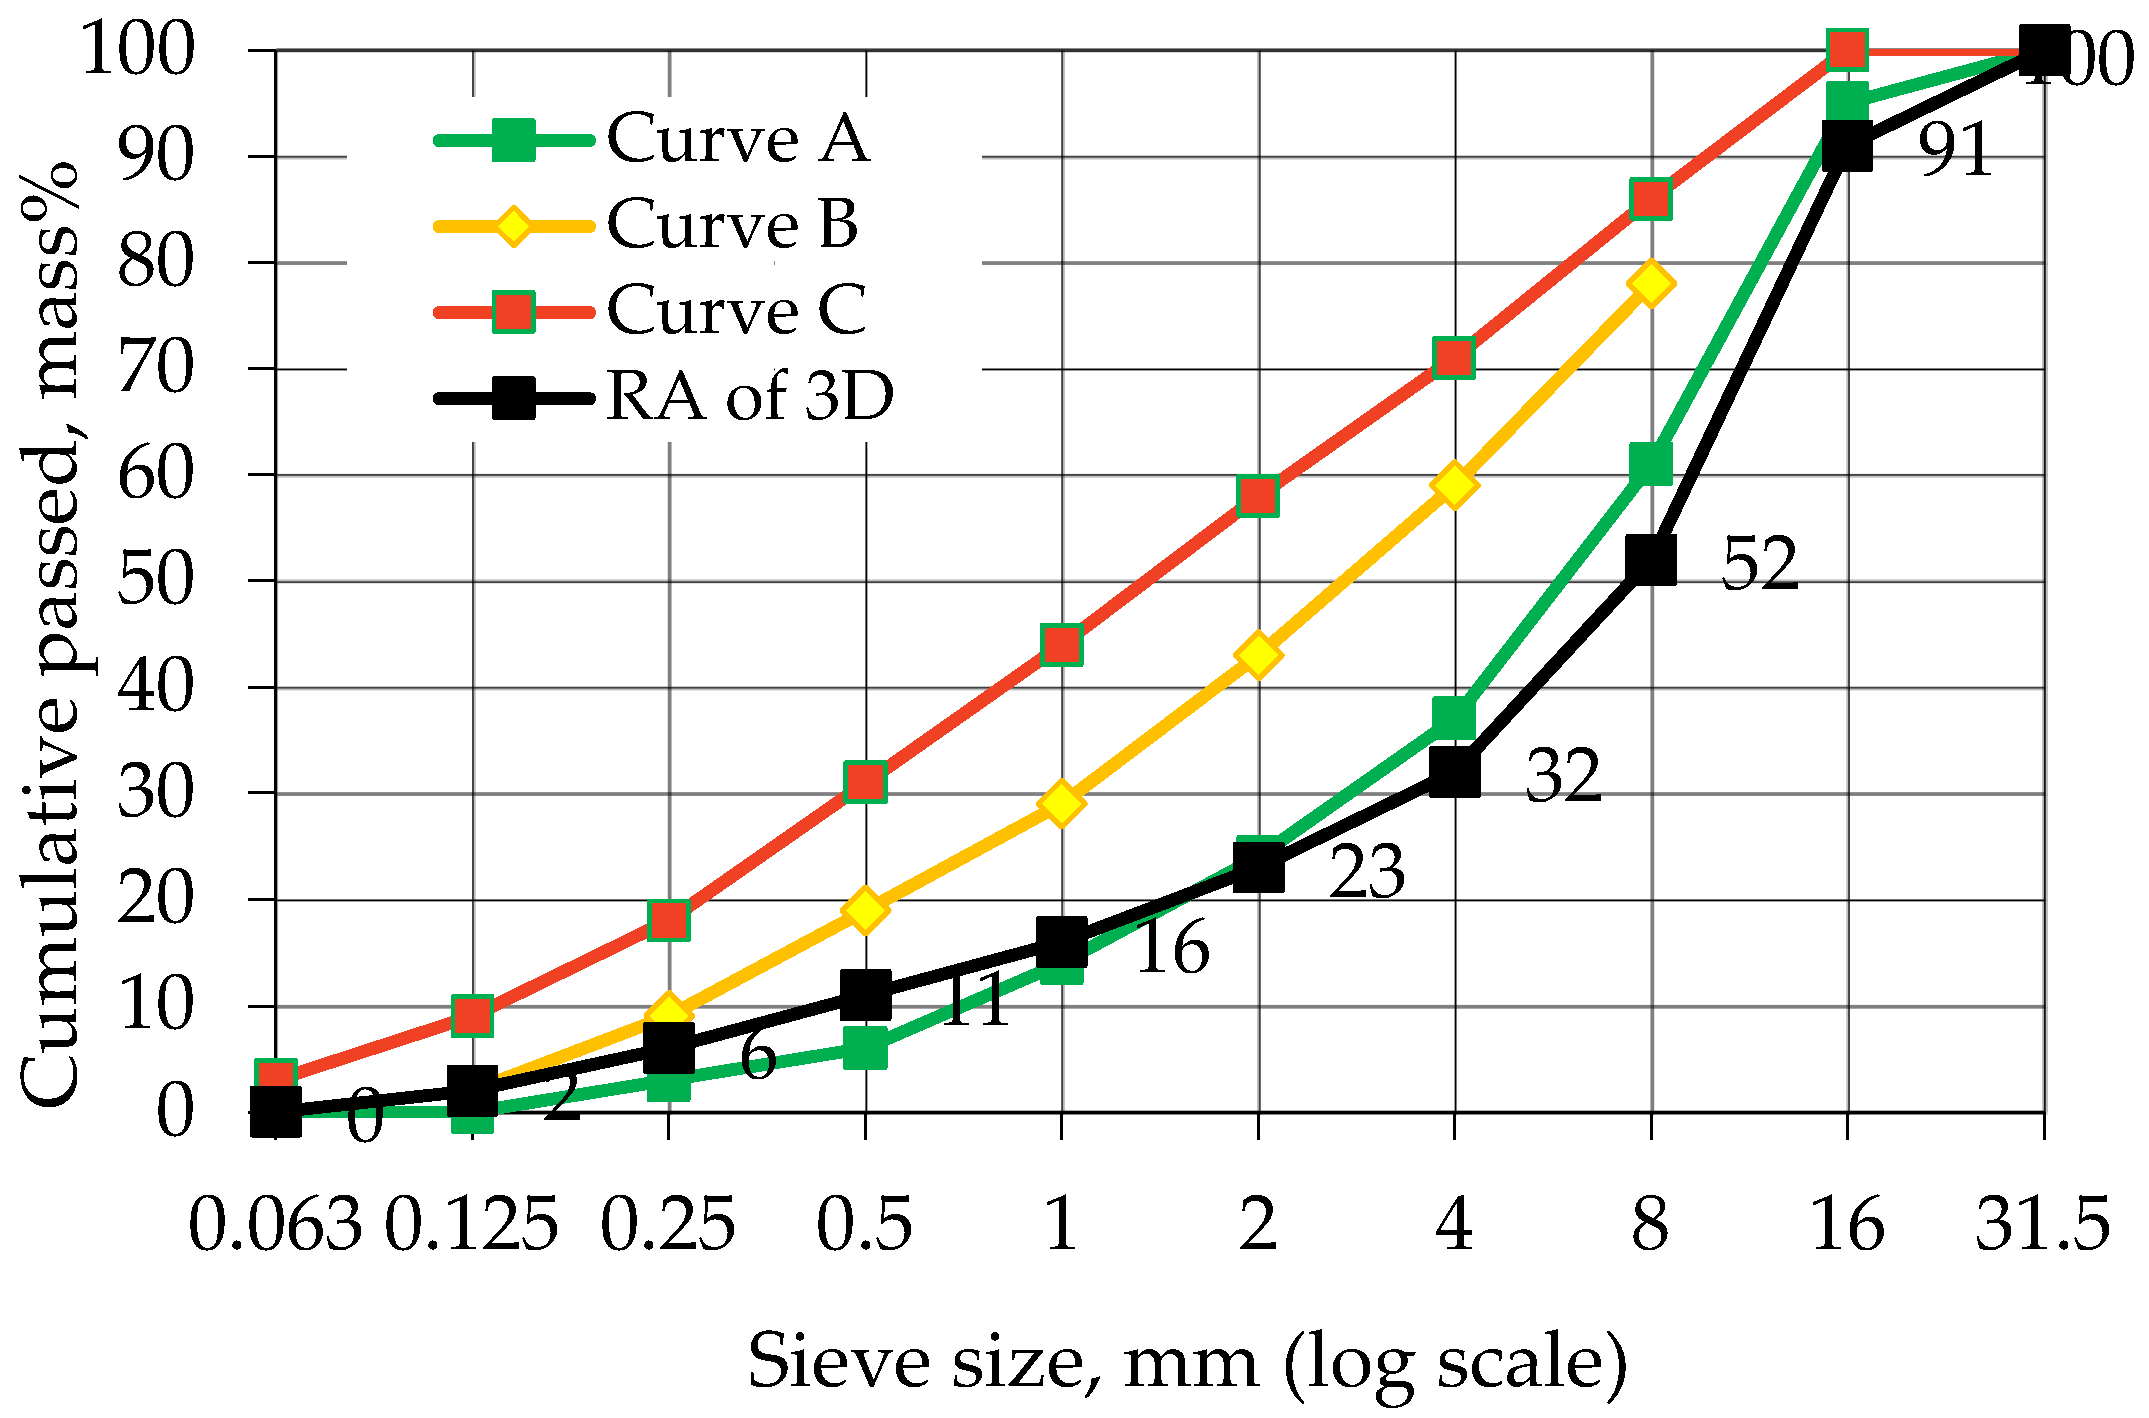
Notably, river sand predominantly functions as a fine aggregate; however, a more detailed examination, illustrated in
Figure 2, reveals the presence of 7% coarse aggregate with a particle size of 4mm by mass. This observation requires careful consideration during the mix design phase when proportioning the various ingredients for the overall construction material. By addressing these intricacies in the mix design, the goal is to achieve a composition that aligns with the specified requirements and ensures the desired performance characteristics of the resulting construction material.
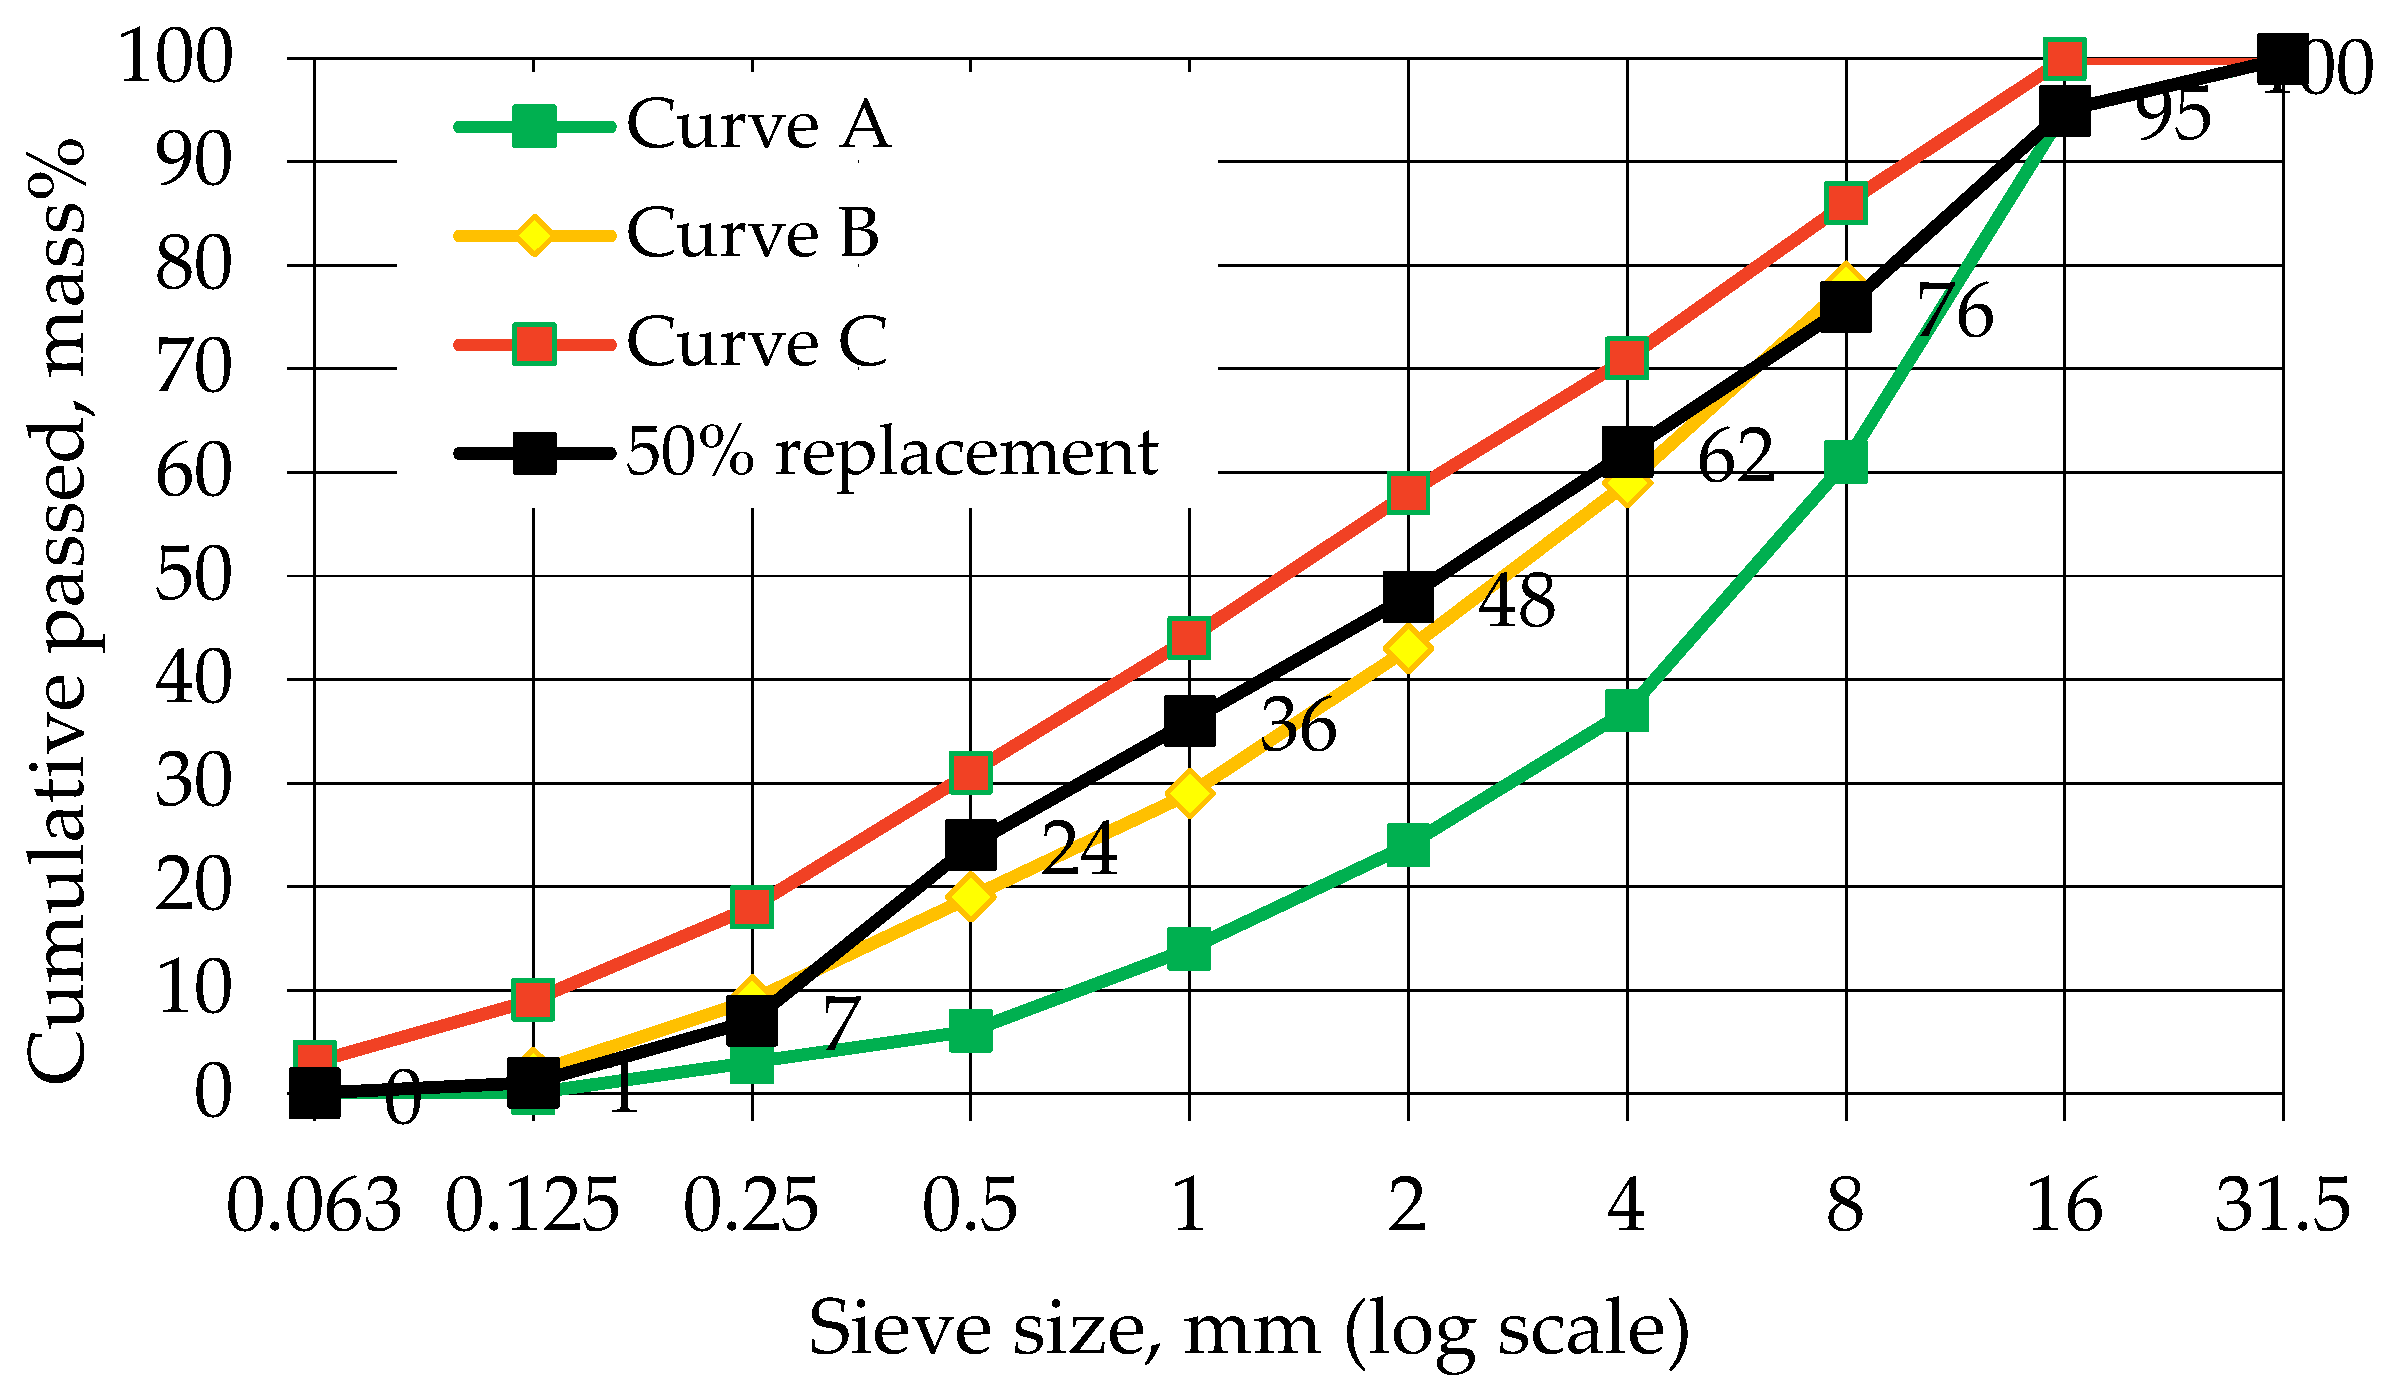
In
Figure 3, the data reveals that 68% of the recycled aggregate, based on mass, constitutes a coarse aggregate. Especially, its grading curve deviates from the specified boundaries of curves A and C, contravening the stipulations outlined in MSZ 4798-1 [
23] regarding grading distribution.
To rectify this discrepancy, a crucial step involves blending the recycled aggregate with sand in carefully determined proportions. The key objective is to establish a specific grading for the combined fine and coarse aggregates, ensuring an optimal distribution that maximizes the aggregate content while minimizing void spaces. This approach serves to reduce reliance on paste (water and cementitious material) in concrete formulations, consequently enhancing dimensional stability and overall durability.
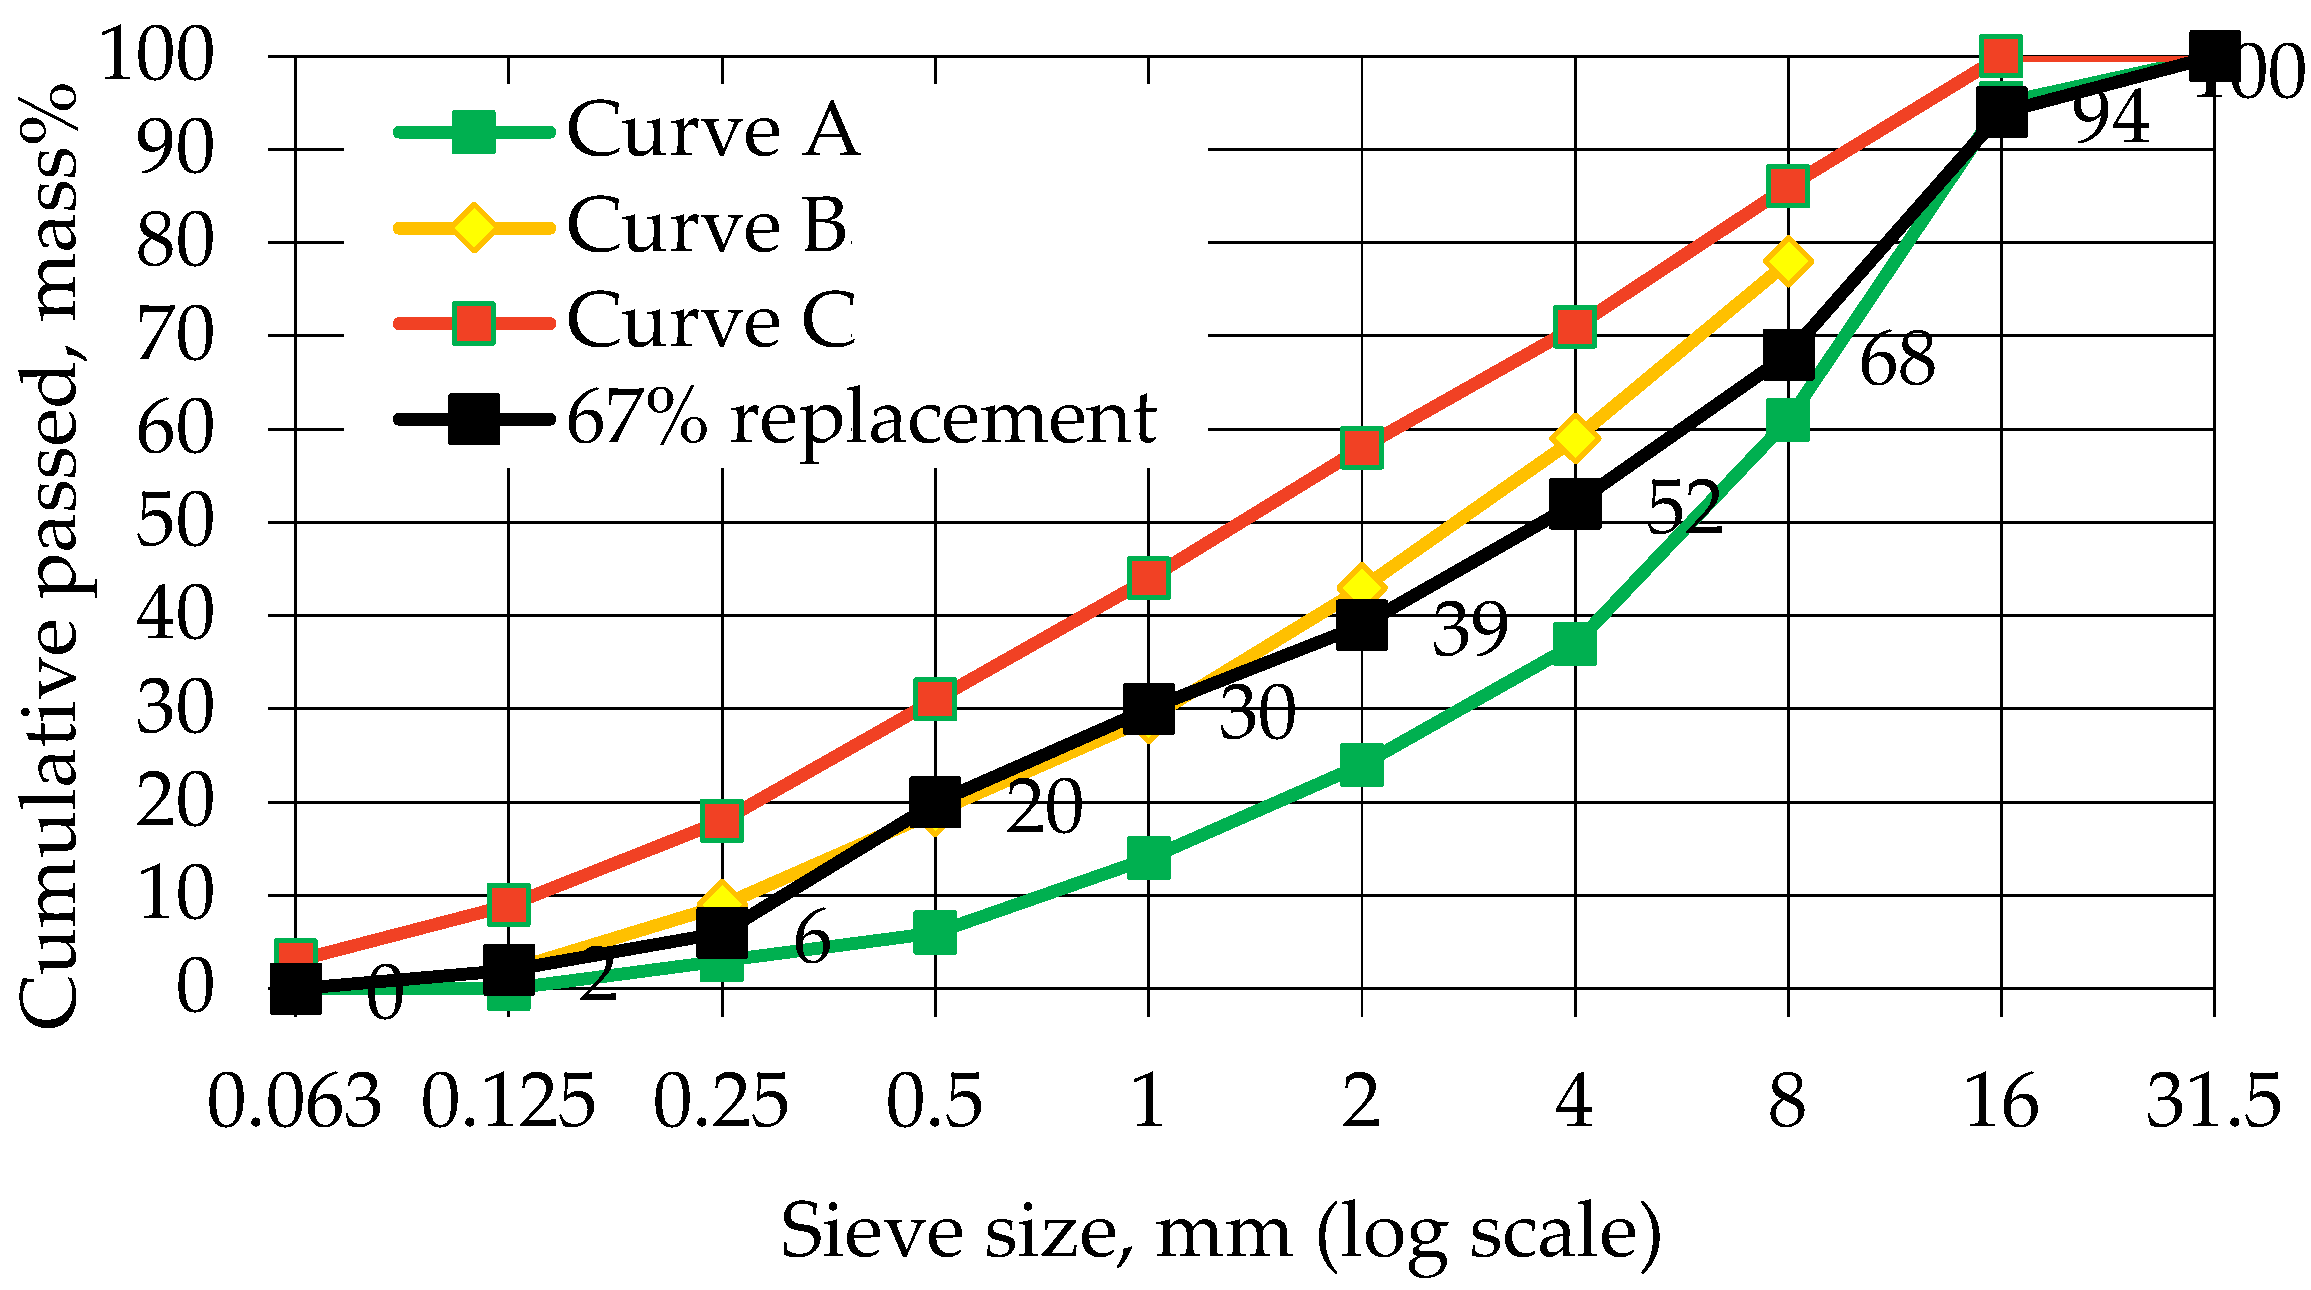
Adhering to this guiding principle, the integration of recycled aggregates with sand has been executed with a specific approach, taking into account both the maximum level of replacement required to achieve a Class I and Class II aggregate size distribution [
15,
23]. Illustrated in
Figure 4 and
Figure 5 are the replacement levels that successfully meet these criteria, represented by recycled aggregate to sand mass ratios of 2:1 (67% replacement) and 1:1 (50% replacement). This visual representation serves as a clear demonstration of the effectiveness of these specific ratios in achieving the desired aggregate classifications.
By strategically incorporating these replacement levels, the aim is to strike a balance between sustainable practices and meeting the specified standards for aggregate distribution. The selection of these replacement levels is informed by careful consideration of the desired concrete properties and the need to optimize the use of recycled materials.
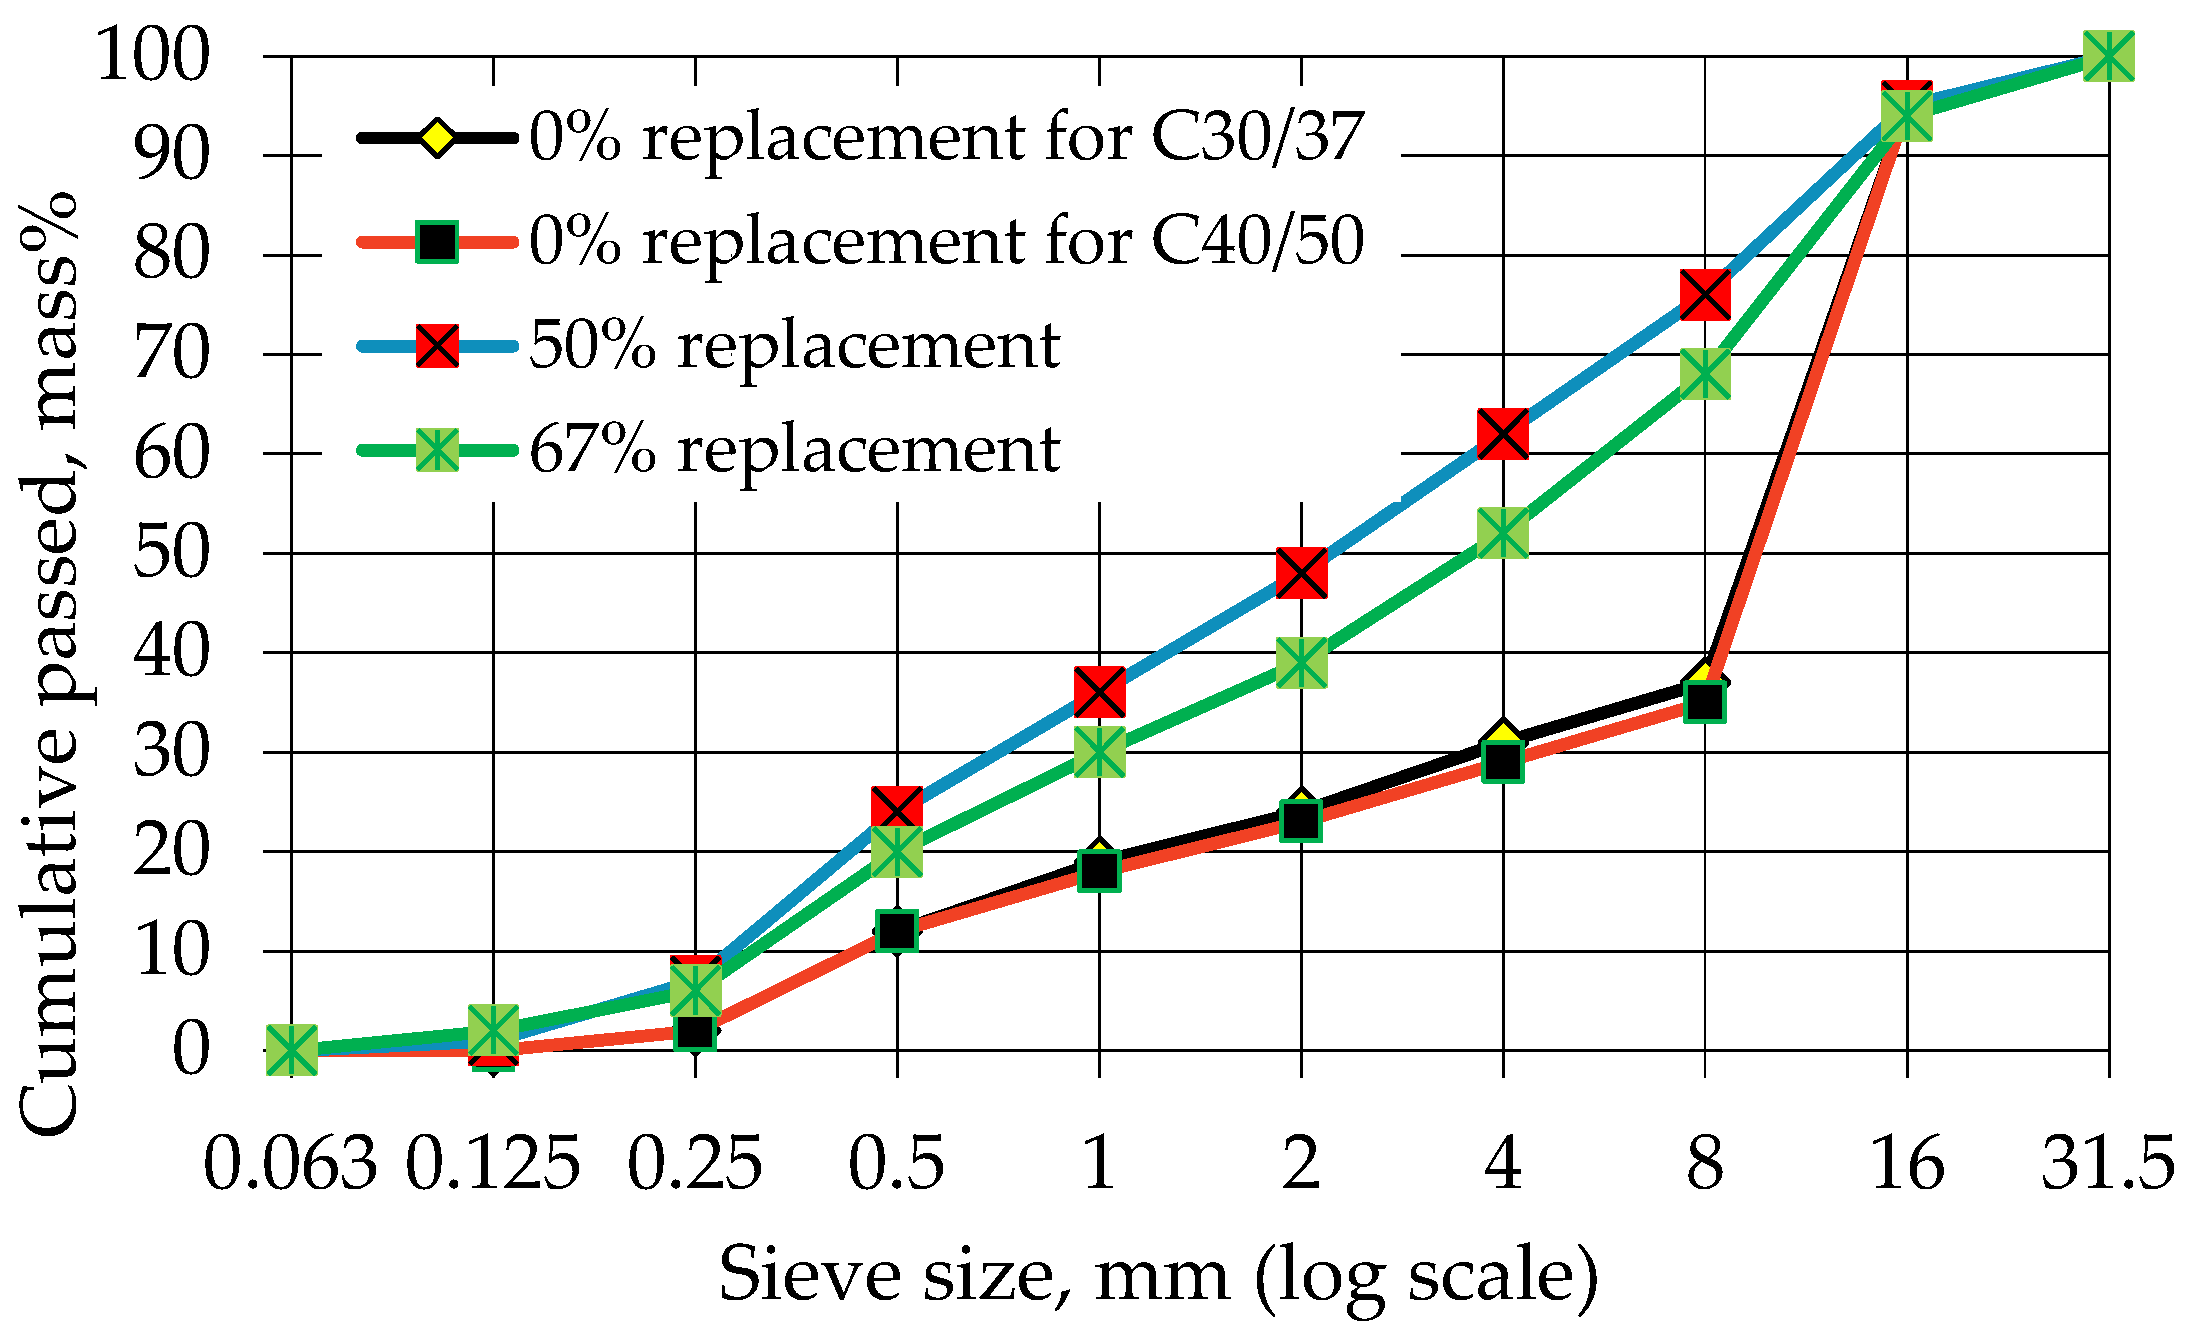
The concrete selected for this study belongs to the strength classes of C30/37 and C40/50, both of which fall within the category of normal strength concrete, as they are under the C50/60 threshold [
24]. In summary,
Figure 6 illustrates the grading curve of the aggregate, representing the combined fine and coarse aggregate particle size distribution, for both strength classes of concrete when there is 0% (i.e., no replacement level), 50% and 67% replacements.
However, when we examine the scenarios with 50% and 67% replacement levels, irrespective of the concrete’s strength class, a notable observation emerges. In these instances, the grading curve of the aggregate remains identical, as depicted in
Figure 6. This indicates a consistent pattern in particle size distribution when a substantial portion of the aggregate is replaced, emphasizing a crucial aspect of the study’s findings.
2.3. Mix Design
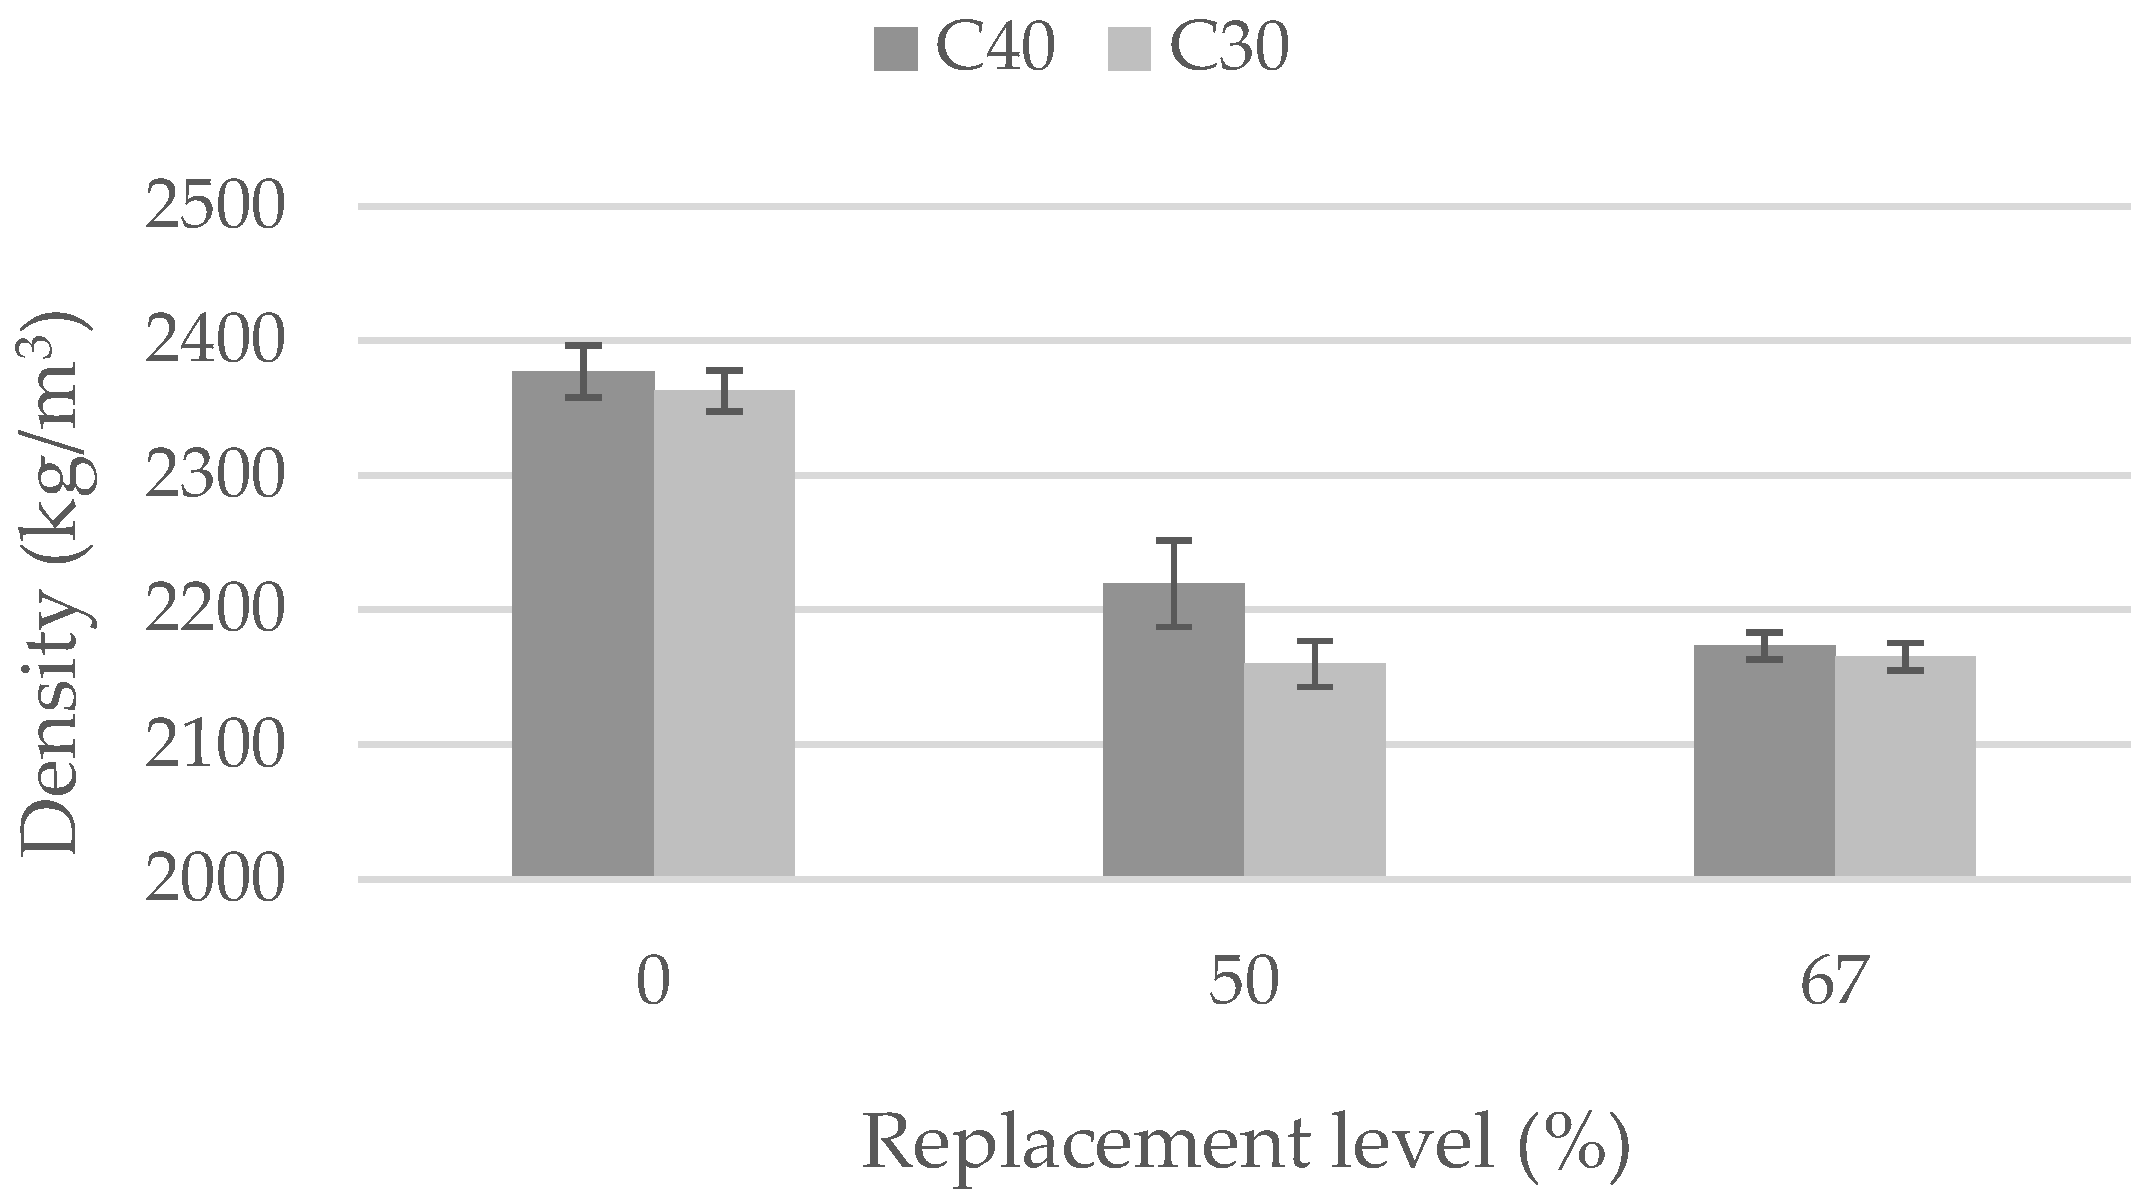
Table 2 provides a comprehensive breakdown of mix designations and the respective percentages of different materials incorporated into the mix. In parallel,
Table 3 offers a detailed presentation of the mix proportions measured in kg/m
3, accompanied by the fresh concrete density for various mixtures. The focal points of this study encompass three main parameters: (i) the type of aggregate (natural or recycled), with varying proportions, (ii) the variation of water amount with constant cement content, and (iii) the strength class of the concrete, represented by C30/37 and C40/50.
To systematically explore the impact of these parameters, ten concrete mixtures, each comprising four specimens, were carefully prepared. These mixtures encompass different aggregate replacement percentages and water amounts, tailored for the selected concrete strength classes. The mix designations outlined in
Table 2 and
Table 3 utilize specific labels: ‘C’ for concrete, ‘NA’ for natural aggregates, and ‘RA’ for recycled aggregates. The numerical values following ‘C’ and ‘RA’ denote the cylindrical characteristic compressive strength in MPa at the age of 28 days and the percentage of recycled aggregate by weight in the total aggregate, respectively. The symbols ‘w+’ and ‘w−’ represent the utilization of additional water without superplasticizer and the use of superplasticizer with a reduced water amount compared to the reference mix to achieve the desired workability in the recycled concrete mix. This systematic nomenclature provides a clear and organized framework for understanding the composition and characteristics of each concrete mixture in the study.
The primary source of natural coarse aggregate (NCA) is quartz gravel, with a minor fraction sourced from sand—this accounts for a maximum of 3%. River sand is employed as the natural fine aggregate. Recycled coarse and fine aggregates (RCA and RFA) are derived from crushed 3D-printed concrete waste.
The water-cement (w/c) ratio is a pivotal factor with a direct impact on the properties and workability of concrete mixes. In light of this, we introduce different water-cement ratios (w/c) beyond those of the reference mixes. In the absence of a superplasticizer, determining the highest permissible w/c ratio becomes crucial, aligning with the natural workability of recycled concrete. Conversely, the introduction of a superplasticizer into the mix presents another dimension. Superplasticizers, as chemical admixtures, enhance the workability of concrete without significantly altering the w/c ratio. In this scenario, selecting the lowest possible w/c ratio becomes imperative to maintain the desired workability with the assistance of the plasticizer. This allows for greater control over the mix’s consistency and flow, even at a lower w/c ratio, offering advantages in achieving the desired properties in the final concrete while conserving water.
In both scenarios, the main emphasis is on adjusting the water content, while keeping the other mixing ingredients constant. This is done to evaluate the necessity of pre-saturation of the recycled aggregates (RA) with water before concrete mixing, given that 3D-printed concrete waste has a water absorption capability of 4.5% in its saturated state and a particle density of 2116 kg/m
3. This precautionary measure aims to prevent water absorption by the RA during the mixing process, aligning with recommendations from various researchers and guidelines [
14,
15]. This exploration also contributes to an enhanced understanding of how moisture conditions influence the performance of recycled aggregates in concrete mixes.
Four specimens of 150 mm cube size were cast using steel molds for each concrete mix. Subsequently, these cubes underwent a carefully devised mixed curing process. During the initial seven days, the cubes were immersed in water, providing a controlled environment for the crucial early stages of hydration. Following this submerged period, the specimens were exposed to the open air for the subsequent 21 days. This mixed curing approach is strategically designed to optimize the concrete’s development of strength and durability. The initial submersion in water serves to create favorable conditions for the hydration process, crucial for the formation of a robust concrete structure. The subsequent exposure to open air replicates real-world atmospheric conditions, contributing to the concrete’s long-term curing and enhancing its overall performance.
2.4. Testing Methods
The testing method employed is the standard compression test, conducted in accordance with EN 12390-3:2001 [
20], to determine the compressive strength of cubic specimens. The results of the test are then checked for adherence to the criteria specified in EN 206:2013 [
25]. The compressive strength testing utilizes a standardized compression testing machine, specifically the FORMTEST ALPHA 3-3000. Within this controlled testing environment, the specimens undergo a carefully regulated testing process, exposed to a consistent rate of loading set at 11.5 kN/s. As per EN 1992-1-1:2004 [
26] standard, the cylindrical mean compressive strength value (
fcm,cyl) in MPa is determined by adding 8 to its cylindrical characteristic compressive strength value (
fck,cyl). It is important to note that this relationship specifically applies to cylindrical samples measuring 150 mm in diameter, 300 mm in height, aged for 28 days, and cured underwater throughout the entire duration (wet cured) [
27]. In practical concrete technology, the conformity of compressive strength is commonly assessed using 150 mm-sized cubes, tested at the age of 28 days, and subjected to mixed curing. For such scenarios, the required minimum mean cubic compressive strength values (
fcm,cube,H) for concrete classes up to C45/55 are provided in the BV-MI 01:2005 (H) [
15], specifically for specimens aged 28 days and subjected to mixed curing as per MSZ 4798-1:2004 [
23]. To meet the conformity criteria of EN 206:2013 [
23] for compressive strength, this value should be less than or equal to the measured average value of its compressive strength (
fcm,cube,test,H) in accordance with BV-MI 01:2005 (H) [
15].
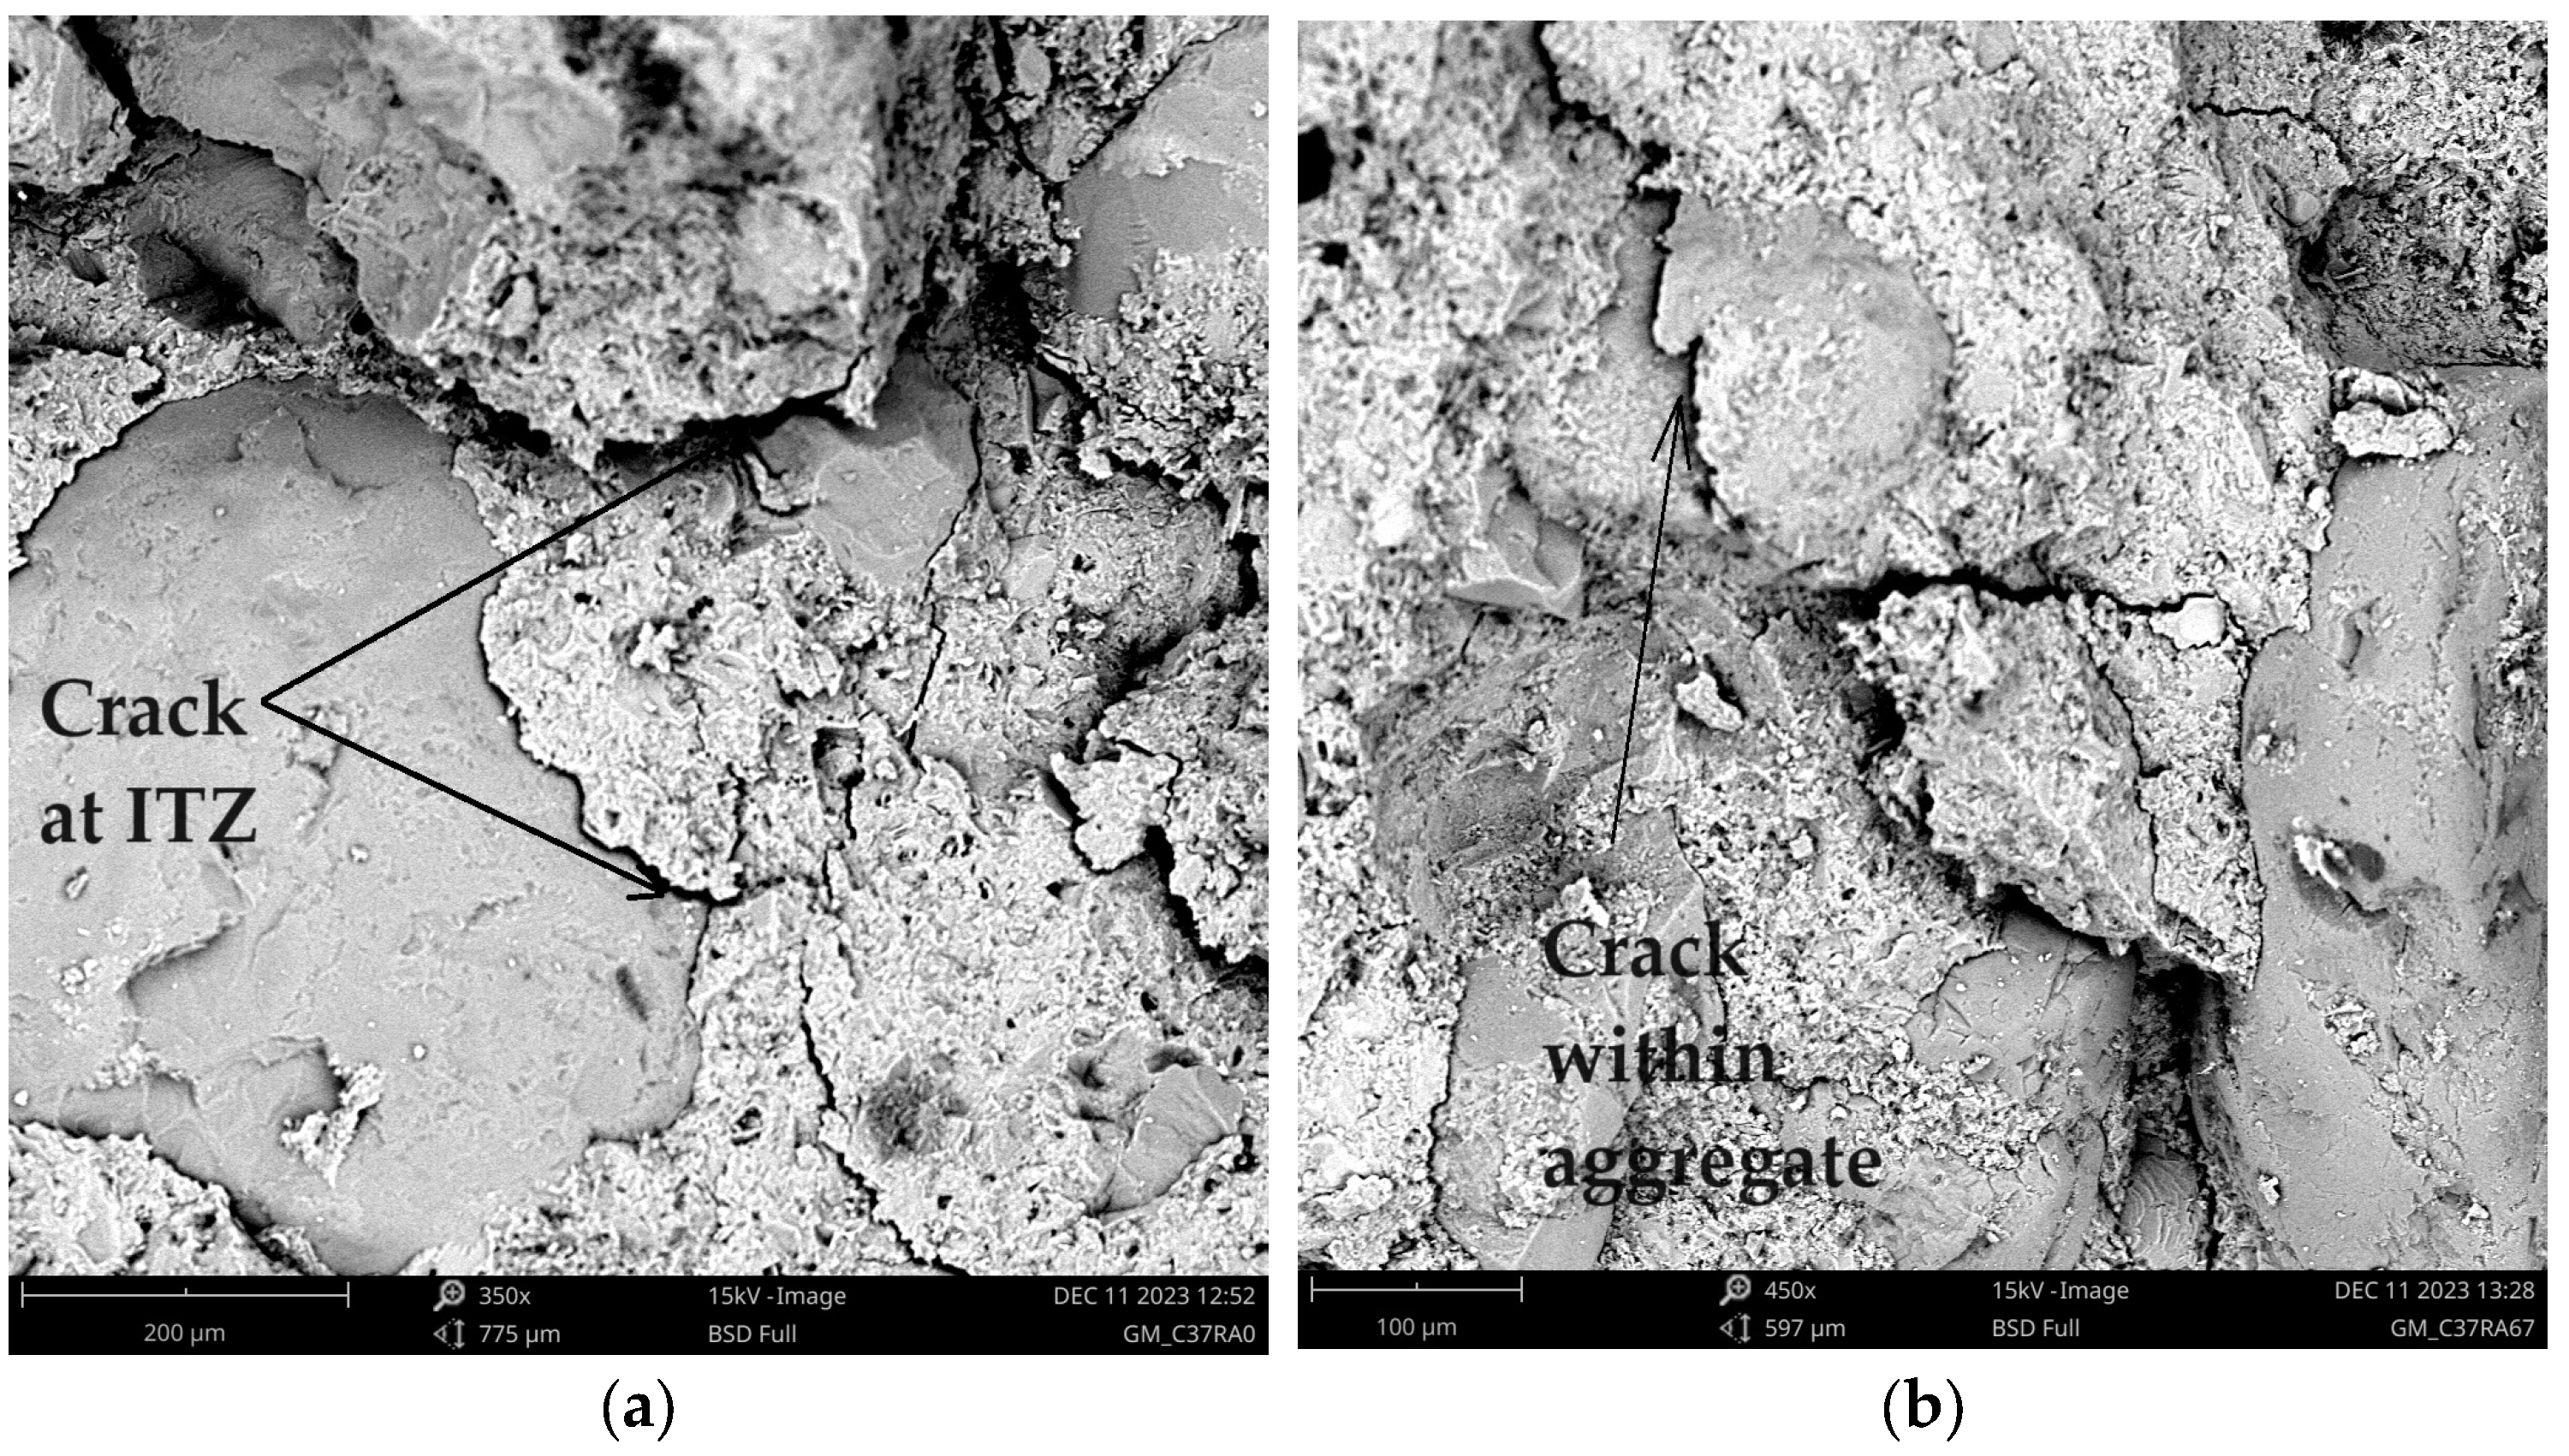
In concrete, the interfacial transition zones (ITZs) serve as a bridge between the mortar matrix and the coarse aggregate particles. Even when the individual components are of high stiffness, the stiffness of the concrete may be low because of breaks in these bridges (i.e., voids and micro-cracks in the interfacial transition zone), which do not permit stress transfer [
28]. In recycled aggregate concrete, there are more interfacial transition zones than normal aggregate concrete [
29]. Therefore, the interfacial transition zone should be considered when the strength of the concrete is evaluated. Taking this into account, scanning electron microscopy (SEM) testing is conducted to assess the microstructure of the concrete at ITZ. The significance of the interfacial bond between the aggregate and the cementitious matrix has been underscored by various researchers [
29,
30,
31]. The ITZ is commonly regarded as the weakest region in concrete, impacting both mechanical properties and durability. Understanding the stress deformation behavior of concrete is crucial, particularly in this zone, as it differs from that of its individual components; namely, hydrated cement paste and aggregate. This test examines the SEM images of the specimens at the interfacial transition zone (ITZ) to assess how the aggregate types influence the nature of aggregate-cement paste interfacial bonding.
4. Conclusions
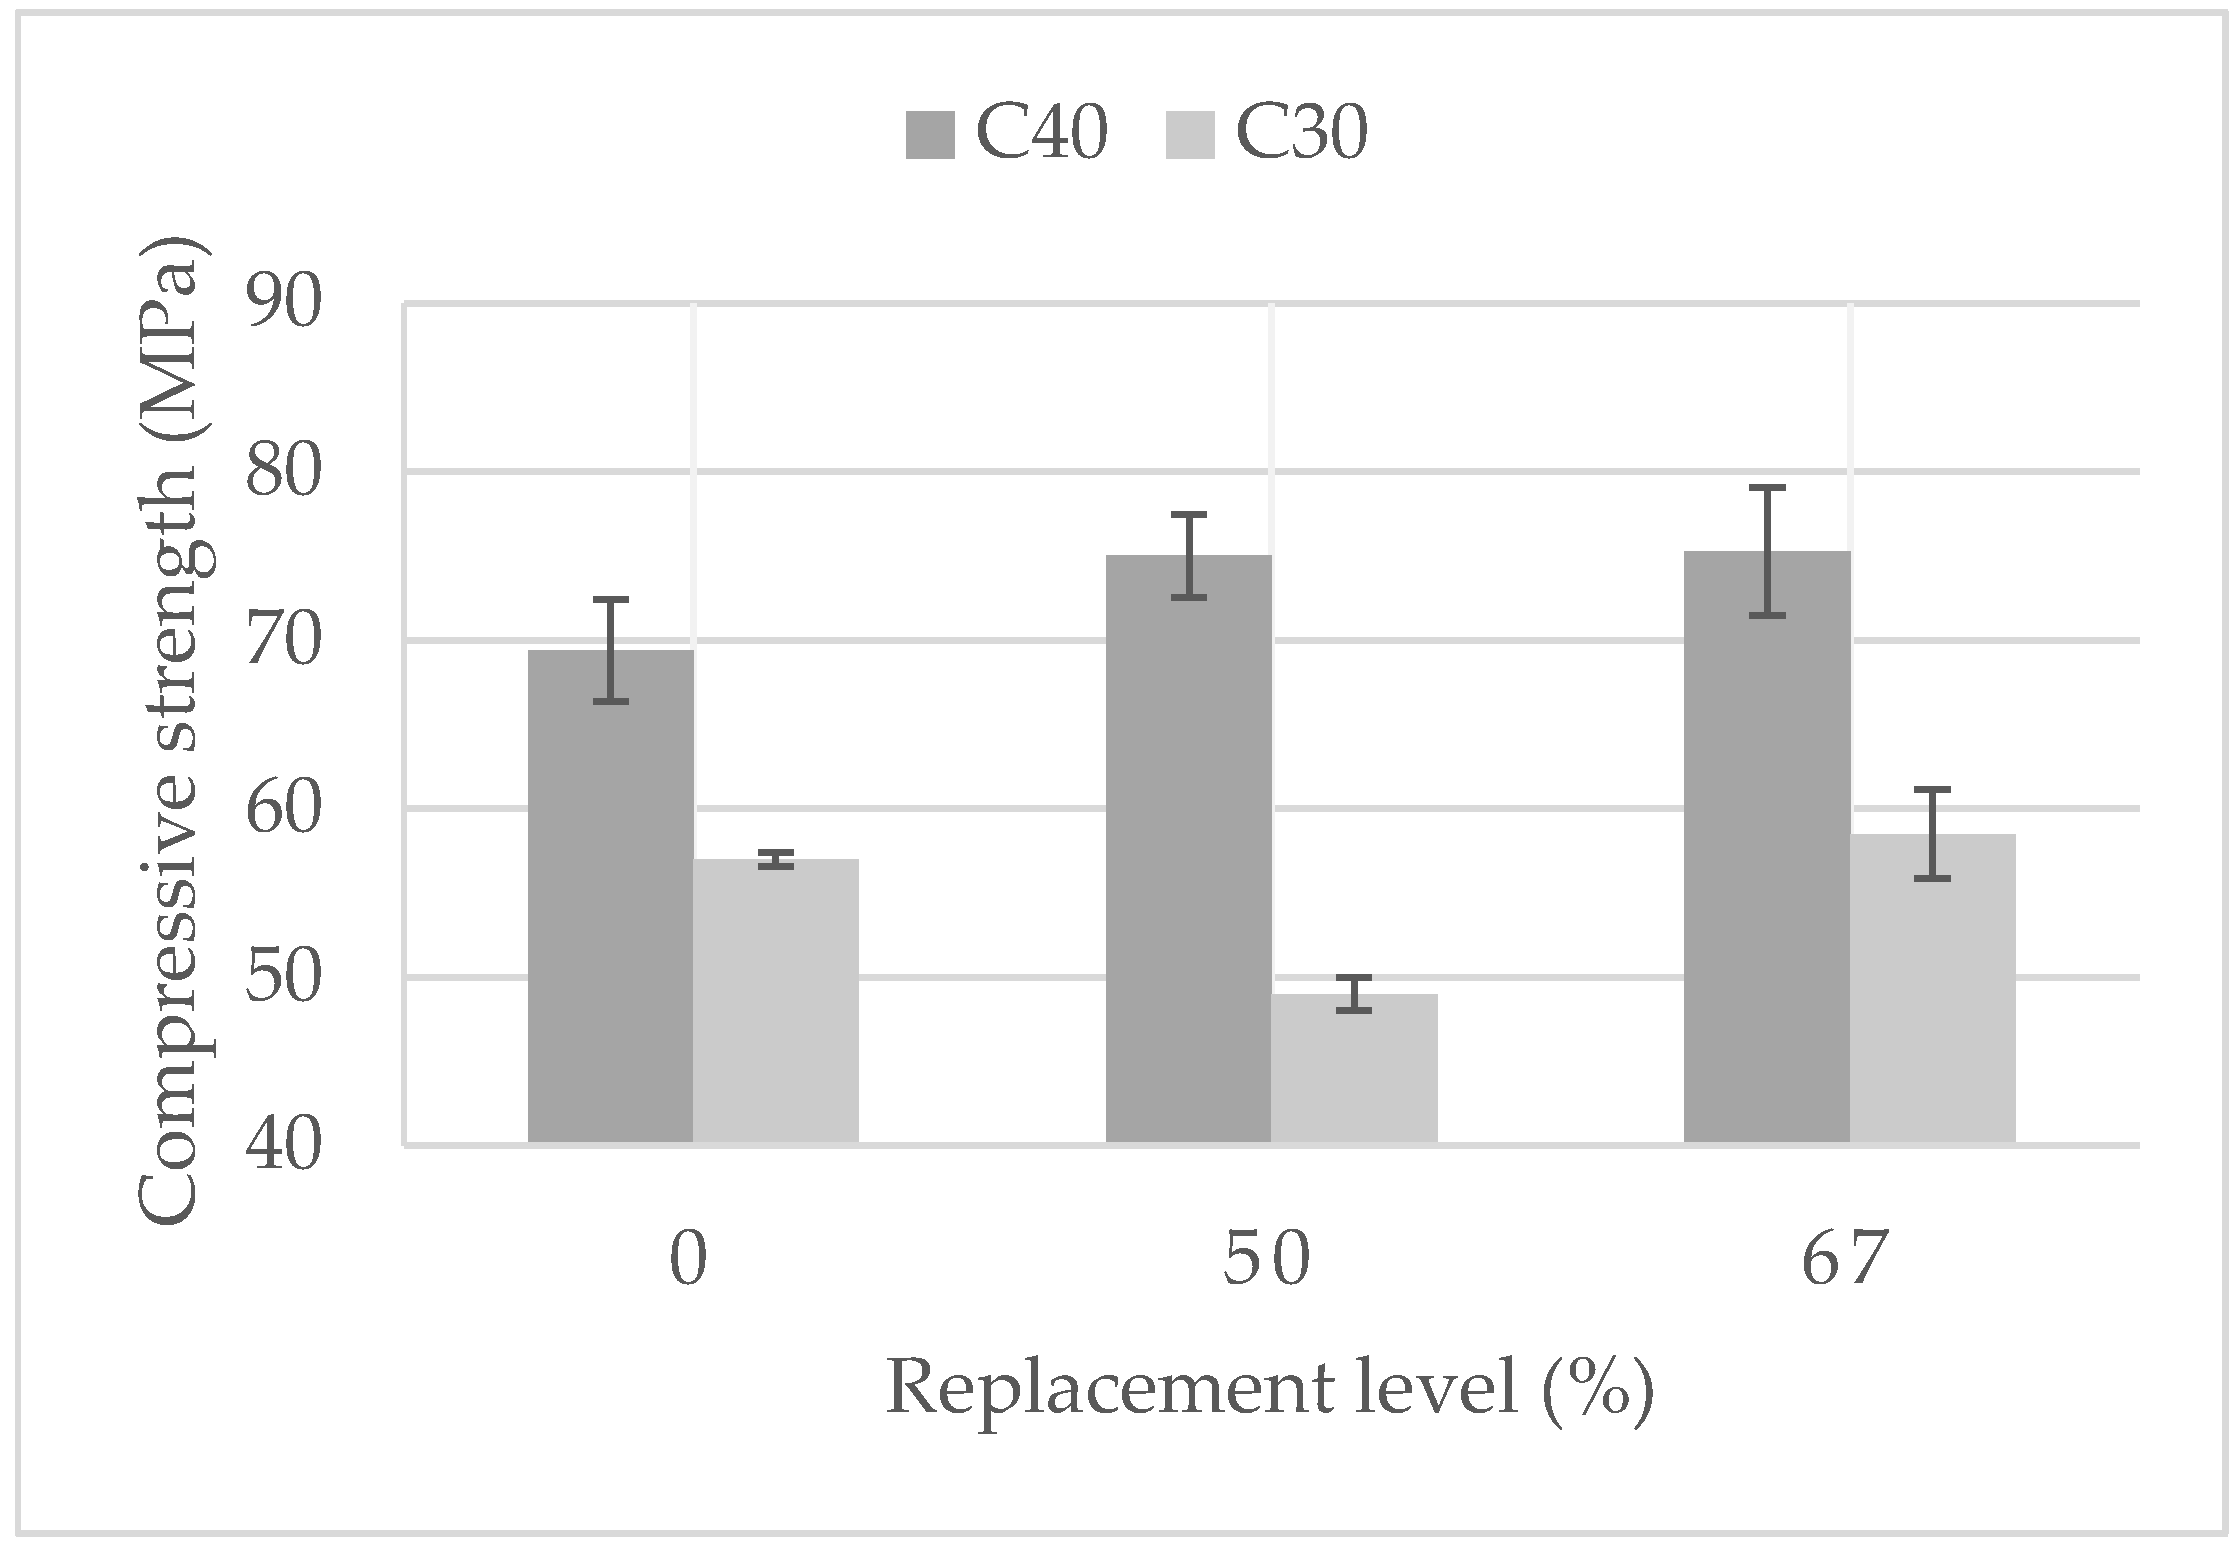
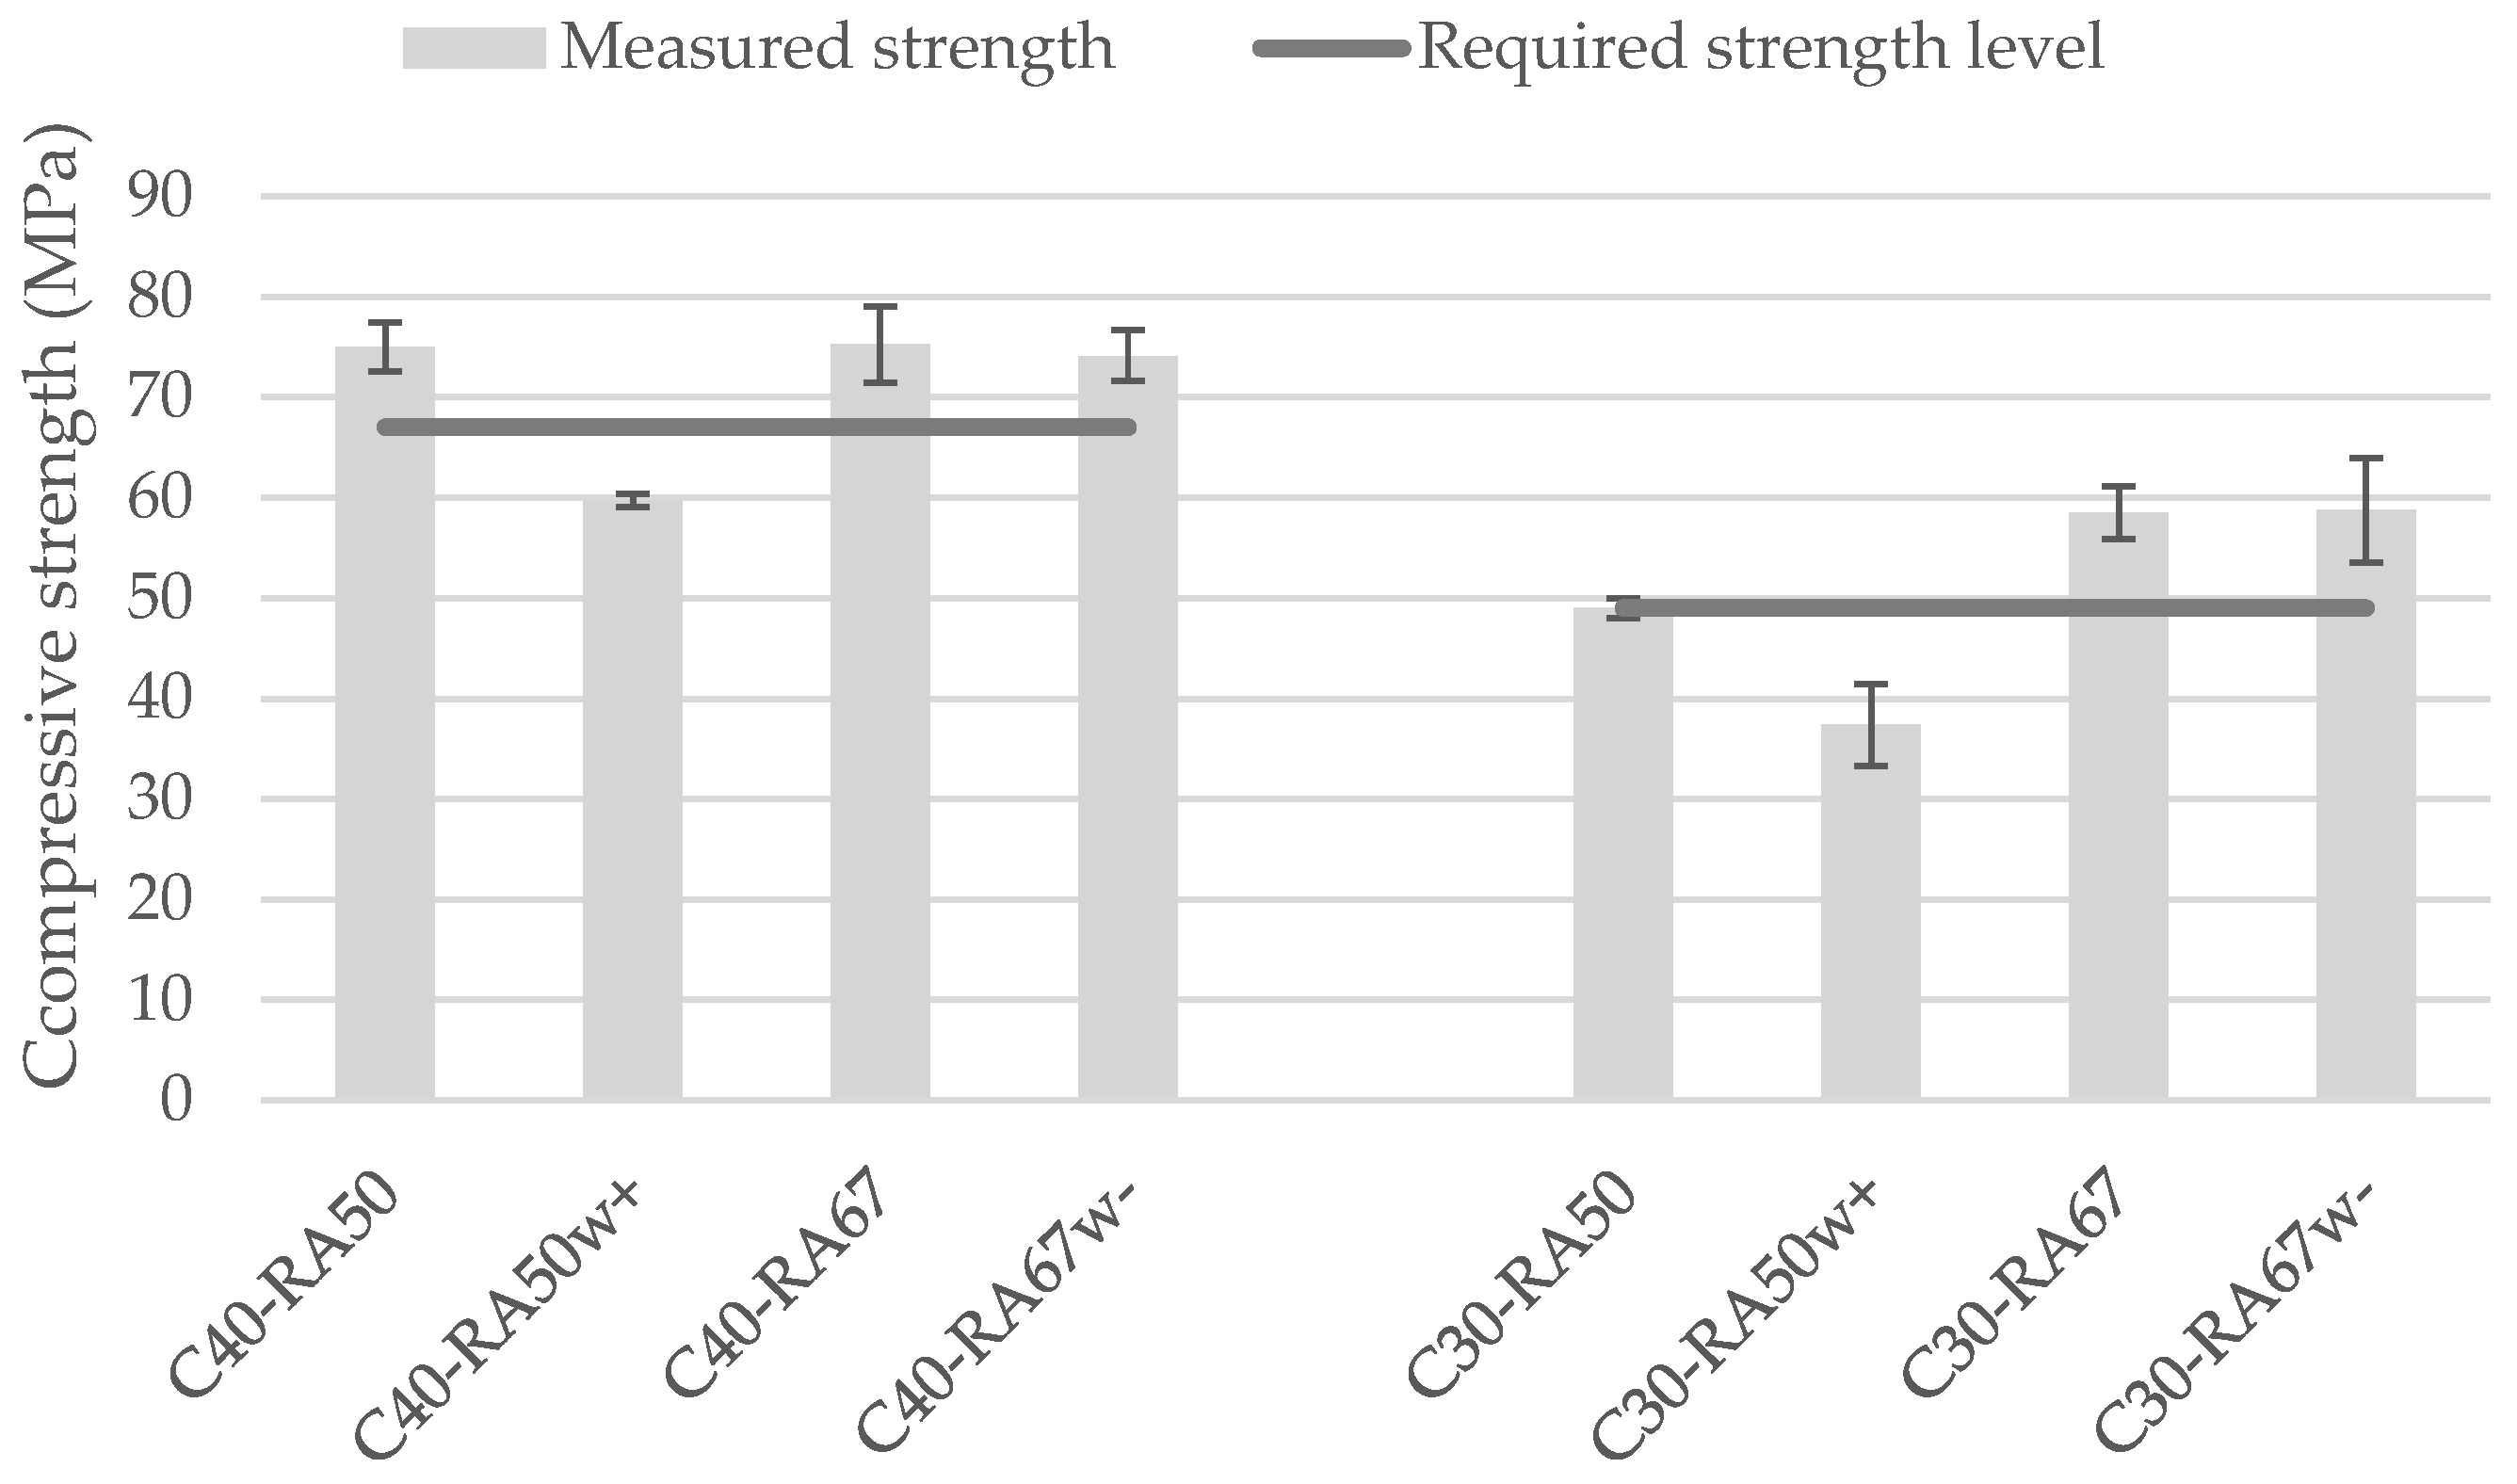
In conclusion, empirical testing of the mean compressive strength confirms the robustness of the concrete mixes, aligning with BV-MI 01: 2005(H) standards for respective strength classes. In C40/50 concrete, both the 50% and 67% replacement levels consistently exhibit higher compressive strength than the 0% replacement level. Transitioning to C30/37, a notable trend emerges: the 50% replacement level shows decreased strength compared to both the 0% and 67% replacement levels, while the 67% replacement level consistently displays superior compressive strength. In this range of replacement, the use of crushed concrete waste from 3D-printed concrete (3D RCA) is more similar to that of the RCAs from normal concrete. Additionally, adjusting the water content impacts the compressive strength in concrete mixes. At a 67% replacement, slight variations occur, while at 50%, additional water leads to a significant strength decrease.
SEM analysis of normal and recycled concrete specimens post-compressive test revealed distinctive cracking patterns. Normal concrete showed cracks in the interfacial transition zone (ITZ) between the natural coarse aggregate and the cement mortar, resulting in easy separation. Recycled concrete exhibited cracks in the ITZ between the recycled coarse aggregate and the cement mortar, along with aggregate failure. These findings highlight divergent failure mechanisms and underscore the importance of crack analysis for concrete performance enhancement.
An overarching discovery is that the efficacy of the 67% replacement level holds regardless of the concrete strength class. Remarkably, it not only outperforms the no-replacement scenario but even exceeds the compressive strength of reference specimens. This underscores the strategic advantage of a 67% replacement level in optimizing compressive strength across diverse concrete classes.


