Article

Risk Assessment of Metals in Black Fungus and Culture Substrates Based on Monte Carlo Simulation

1
College of Horticulture, Jilin Agricultural University, Changchun 130118, China
2
Jilin Academy of Agricultural Science (Northeast Agricultural Research Center of China), Risk Assessment Lab of Agri-Products Quality and Safety (Changchun), Ministry of Agriculture and Rural Affairs of the People’s Republic of China, Changchun 130033, China
*
Authors to whom correspondence should be addressed.
These authors contributed equally to this work.
Appl. Sci. 2024, 14(3), 1082; https://doi.org/10.3390/app14031082
Submission received: 9 November 2023 / Revised: 23 December 2023 / Accepted: 13 January 2024 / Published: 26 January 2024

Abstract

:
Black fungus is the second-most consumed edible fungus in China. The establishment of a risk assessment mechanism for heavy metals in black fungus is particularly critical to the safety of edible fungi. To clarify a risk assessment mechanism of heavy metal pollution of edible fungi in northeast China, in this study, the contents of Pb, Cr, CD and As in 415 samples were determined, and a total of 1660 valid data were obtained. Then, based on Monte Carlo simulation, a non-parametric probability assessment system for heavy metals in black fungus was established and improved. The results showed that the residual amounts of As, Pb, Cd and Cr in black fungus were in the order of Cr > Pb > As > Cd. The background content of four heavy metals in the main raw materials was preliminarily clarified. Among them, the content of As is between 0.010–0.320 mg·kg−1, Pb is between 0.051–0.792 mg·kg−1, Cd is between 0.019–0.236 mg·kg−1, and Cr is between 0.06–3.41 mg·kg−1. These results indicate that the dietary exposure risk of heavy metals ingested by dried black fungus in Chinese minors and adults is basically safe, but at the high exposure levels of 97.5% sites and 99% sites, Cr is at the light pollution level, and the comprehensive pollution of four heavy metals is at the moderate pollution level. In addition, this study found that raw materials can cause heavy metal accumulation in black fungus, mainly from sawdust, followed by rice bran and wheat bran.

1. Introduction

China is the main producer, consumer and exporter of edible fungi in the world. Black fungus (Auricularia heimuer) is the second-most consumed edible fungus in China, accounting for a large proportion of edible fungus consumption [1]. Black fungus is a fungus of the auricularia family. Black fungus is one of the four major edible fungi in the world. Because of its unique nutritional value, it has been favored by people since ancient times. Studies have shown that black fungus is rich in protein, crude fiber, vitamins, and fungus polysaccharides, but also contains calcium, iron and other mineral elements, with enhanced immunity, cancer prevention and alcohol reduction, ability to reduce blood clots, alleviate atherosclerosis and other effects [2,3,4,5]. In recent years, as people pay more and more attention to nutrition and health, black fungus is more and more favored by the majority of consumers, and has broad market prospects.
As early as 1998, it was found that cadmium accumulation in Agaricus bisporus (Large) Sing was serious, and studies proved that there were differences in the accumulation and adsorption of heavy metals by edible fungi. Malinowska et al. (2004) [6] analyzed 14 kinds of metal elements in the fruit bodies of bolus hepaticus and found that the metal concentration in the fungus cap was higher than that in the fungus stalk, but the ratio of the fungus cap to the fungus stalk concentration in the samples collected from different regions was similar. The research results of Lsildak et al. (2007) [7] show that Ganoderma lucidum (Curtis) P. Karst., mushroom and Agaricus bisporus (Large) Sing have a strong ability to enrich heavy metals, have a high tolerance to heavy metals, and can enrich a variety of heavy metals. The same variety of edible fungi can enrich a variety of heavy metals at the same time. Ozcan et al. (2013) [8] proved that edible fungi could absorb more heavy metals than green plants. Severoglu et al. (2013) [9] found that the contents of nickel, radiation, chromium and lead in edible fungi were higher than those of corresponding heavy metals in soil, which also indicated that edible fungi could actively absorb heavy metals. Didier et al. (1998) [10] pointed out that mushroom fungi showed obvious affinity for Cu (copper), Ag (argentum) and Cd (cadmium), while wood rot fungi showed an obvious tendency to enrich Cr (chromium), Mg (magnesium), Se (selenium) and Pb (lead). Lsildsk et al. (2007) [7] found that when the Cd content in soil increased, the Cr content in edible fungi was positively correlated with the Cd content in soil, but the lead content in soil had little effect on the lead enrichment in edible fungi. Demirbas et al. (2002) [11] found that there was a positive correlation between the accumulation of Hg (hydrargyrum) and cadmium in edible fungi and the contents of mercury and radiation in soil, while no similar relationship was found for lead. Zhu et al. (2011) [12] also studied the relationship between the enrichment of various heavy metals in edible fungi, among which there was a good correlation between Cr and Ni (niccolum), Cd and Mn (manganese), and Zn (zinc).
In China, Jilin and Heilongjiang provinces, the main producing areas of black fungus, account for more than 70% of the national output. At the same time, these areas contain rich mineral deposits, which lead to high levels of metallic elements in the soil. Therefore, the risk of excessive heavy metals in black fungus also increases, but the risk assessment system for these two provinces has not been established. Therefore, a comprehensive study on the assessment of known risk factors and exploration of unknown risk factors in auricularia in these two provinces should be carried out. It is of great significance to effectively identify the potential risks of quality and safety of Chinese black fungus products, scientifically respond to quality and safety emergencies, formulate black fungus pollution control and risk management measures, improve the quality and safety supervision level of black fungus, and promote the healthy development of the black fungus industry.
In this study, the Monte Carlo simulation was used to determine the contents of Pb, Cr, Cd and As (arsenic) in 415 black fungus samples from Heilongjiang and Jilin provinces, establish a non-parametric probability assessment system, clarify the heavy metal risk level of black fungus in China, and explore the sources of heavy metal pollution in order to fully grasp the basic situation of black fungus risk factors, provide objective basic data for risk management and provide scientific basis for objective and efficient risk management of the government.

2. Materials and Methods

2.1. Source of Samples

In this study, a total of 415 samples were collected from 22 major producing counties in Changbai Mountain, Greater Khingan Mountains and Lesser Khingan Mountains of Jilin Province and Heilongjiang Province, including 179 black fungus samples, 30 raw materials sawdust samples, 19 soybean meal samples, 18 wheat bran samples, 12 rice bran samples, 4 corn flour samples, and 26 uncontaminated culture medium, while 32 samples of waste fungus sticks, 8 samples of ground pendulum soil, 34 samples of irrigation water, 27 samples of lime and 26 samples of gypsum were determined in the same year.

2.2. Determination of Heavy Metal Content in Samples and Raw Materials

According to the local standard of Jilin Province “DB22/T 2345-2015 [13] Determination of lead, chromium, cadmium, arsenic, mercury, selenium, copper and zinc in crops by inductively coupled plasma mass spectrometry,” the determination was performed by wet electrothermal digestion ICP-MS. The detection limit of total arsenic was 0.003 mg·kg−1, cadmium detection limit 0.002 mg·kg−1, chromium detection limit 0.006 mg·kg−1, and detection limit of lead 0.005 mg·kg−1. The detection limit of selenium is 0.002 mg·kg−1. 7500CX (G3272B) using an inductively coupled plasma mass spectrometer (Agilent, Santa Clara, CA, USA), XSE105DU electronic balance (sensitivity: 0.0001, Mettler Toledo, Greifensee, Switzerland), and an EHD54 Electrothermal Digester (Lebertec). The tuning parameters and optimized state indicators are shown in Table 1 and Table 2.

2.3. Establishment of Evaluation Standard of Pollution Index

The limits of heavy metals in auriculus fruiting bodies refer to the Limits of Contaminants in Food under the National Standard for Food Safety of GB2762-2017 [14]. The maximum residue limits of Pb, Cd and As are 1 mg·kg−1, 0.5 mg·kg−1 and 0.5 mg·kg−1, respectively. The standard is for the limit of Cr in edible fungi, and the reference grain limit is 1.0 mg·kg−1.
The limits of heavy metals in cultivation substrate and production water are referred to in NY/T 391-2013 [15] Environmental Quality of Green Food Origin, and the maximum residue limits of Pb, Cd and As for processing water are 0.01 mg·L−1, 0.005 mg·L−1 and 0.01 mg·L−1, respectively. The maximum residue limit of Cr with reference to hexavalent chromium was 0.05 mg·L−1. The MRLs (maximum residue limits) for cultivated substrate are 35 mg·kg−1 for Pb, 0.3 mg·kg−1 for Cd and 0.8 mg·kg−1 for As.

2.4. Establishment of Risk Assessment Methods

Exposure Assessment Model

Exposure assessment is a qualitative or quantitative assessment of the biological, chemical and physical factors that may be exposed to humans or the environment through food intake or other relevant pathways. Exposure assessment describes the pathway by which the hazard enters the body and estimates the level of exposure to the hazard in different populations. The amount of human exposure to this chemical is calculated based on data from dietary surveys and surveys of exposure levels of chemical substances in various foods.
The @Risk 8.0 (Palisade, NY, USA) software was used to conduct a non-parametric probability assessment of exposure to heavy metals in black auriculeus auriculeus, and heavy metal pollution data were randomly selected to calculate daily exposure per unit body weight of different populations. The simulation method was Monte Carlo simulation with 10,000 simulations. The distribution of daily exposure per unit body weight of black fungus heavy metals in different populations was obtained by calculation.
(1)
Risk description formula
The health risk exposure of heavy metals in black fungus is calculated as follows:
EDI = EF r × ED × F IR × C × F P × F m W AB × AT n × 10 3
EDI [mg·(kgmg·L−1d)−1]: Assessment of daily exposure, EFr (d·a−1): exposure frequency, ED (a): Exposure persistence, FIR g·(d·person)−1: Per capita daily dietary intake of edible fungi, C: (mg·kg−1) black fungus heavy metal content, FP: processing factor, Fm: variation factor, WAB (kg·person−1): Body weight per capita, ATn (d): Mean cancer-free response time.
(2)
Expose sources of assessment data
Exposure frequency and duration: According to the relevant data in the Risk Analysis Manual of the United States Environmental Protection Agency, the exposure frequency is 350 a·d−1, and the lifetime duration of exposure is 70 a·d−1 dietary intake of edible fungi. According to the data of the 2015 Report on Nutrition and Chronic Diseases of Chinese residents, the dietary intake of edible fungi of Chinese residents was 134.7 g·d−1 for adults and 93.4 g·d−1 for children, which was equivalent to 13.47 g·d−1 for dried fungus for adults and 9.34 g·d−1 for children. Heavy metal content in black fungus: calculated by the average value of the samples, and the undetected samples were assigned a uniform value of 1/2 LOD (limit of detection). The detection limit of total arsenic is 0.005 mg·kg−1, cadmium detection limit 0.0005 mg·kg−1, chromium detection limit 0.005 mg·kg−1, detection limit of lead 0.01 mg·kg−1, and detection limit of selenium 0.005 mg·kg−1. Processing factor: refers to the proportion of its concentration decrease after cooking and other processing links, using the national general practice, and the default is 1. Variation factor: refers to the degree of variation in the unit food, using the national general practice, the default is 1. Per capita weight: According to the Nutrition and Health Survey report of Chinese residents in 2008, the per capita weight of Chinese residents is 61.75 kg for adults and 25.6 kg for children. The mean cancer-free response time was 70 a × 365 d·a−1 for 25,550 d.

2.5. Dietary Risk Assessment Model

The target hazard quotient (THQ) method established by the United States Environmental Protection Agency (USEPA) was used to evaluate the potential risk to human health caused by different heavy metals when consumers eat black fungus. The THQ method assumes that the heavy metal absorption is equal to the ingested dose, and calculates the ratio of the ingested pollutant dose to the reference dose. A single heavy metal coefficient THQ value < 1 indicates that the intake of heavy metals in black fungus poses no significant health risk to the exposed population. When THQ ≥ 1, it indicates that the intake of heavy metals in black fungus poses health risks to the exposed population. The higher the THQ value, the greater the risk to human health arising from the intake of heavy metals in black fungus. The THQ method can also further evaluate the impact of pollutants in products on the health risks of adults and children, and the parameter settings for different age groups in the method are different. Therefore, it is possible to distinguish the degree of health risk for intake of cadmium in black fungus between different age groups.
The @Risk 8.0 software was used to assess the risk of heavy metals in auriculae auriculae, and the heavy metal pollution data were randomly selected to calculate the heavy metal dietary risk quotient of different populations. The simulation method was Monte Carlo simulation with 10,000 simulations. The distribution of the dietary risk quotient of auricularia auricularia in different heavy metal populations was obtained by calculation.
(1)
Risk description formula
The target risk quotient of heavy metals in black fungus is calculated as follows:
THQ = EF r × ED × F IR × C × F P × F m R fD × W AB × AT n × 10 3
THQ: target risk quotient; EFr (d·a−1): exposure frequency; ED (a): exposure persistence; FIR [g·(d·person)−1]: per capita daily dietary intake of edible fungi; C (mg·kg−1) black fungus heavy metal content; FP: processing factor; Fm: variation factor; RfD (mg·kg−1·bw): reference dose; WAB (kg·person−1): body weight per capita; ATn (d): mean cancer-free response time.
(2)
Expose the source of assessment data
Exposure frequency and duration, per capita dietary intake of edible fungi, heavy metal content in black fungus, processing factors, variation factors, per capita body weight and mean cancer-free response time were all associated with risk description formula.
Daily reference dose: According to nutrition and chronic diseases among residents in China in 2015, the report data are RfD (Cd) = 1 × 10⁻³ mg·kg−1·d 1, RfD (As) = 3 ×10⁻⁴ mg·kg−1·d−1, and RfD (Pb) = 3.5 × 10⁻³ mg·kg −1·d−1. The recommended optimal intake (AI) RfD (Cr) in the Reference Intake of Dietary Nutrients for Chinese Residents (2013 edition) is 3 × 10⁻³ mg·kg−1·d−1.
(3)
Heavy metal pollution classification standards
As to Table 3.

3. Results

3.1. Analysis of Heavy Metal Content in Black Fungus and Risk Assessment of Dietary Exposure Analysis of Heavy Metal Content in Black Fungus

The residual distribution of heavy metals in black fungus from different sources (Table 4) showed that the detection rate of all heavy metals in dried black fungus was 100%. Content ranged from 0.007–0.966 mg·kg−1, with an average value of 0.177 mg·kg−1 and a median value of 0.143 mg·kg−1. There were three market samples exceeding the standard, and the over-standard rate was 1.68%. Pb content ranged from 0.018 to 1.300 mg·kg−1, with an average value of 0.315 mg·kg−1 and a median value of 0.233 mg·kg−1. One base sample exceeded the standard, and the over-standard rate was 0.59%. The content of Cd ranged from 0.003 to 0.511 mg·kg−1, with an average value of 0.097 mg·kg−1 and a median value of 0.082 mg·kg−1. One base sample exceeded the standard, and the over-standard rate was 0.59%. The content of Cr was 0.056–5.602 mg·kg−1, with an average value of 1.689 mg·kg−1 and a median value of 1.426 mg·kg−1. The limit standard of Cr in reference grains was 1.0 mg·kg−1, and 68 samples exceeded the standard, including 12 market samples and 56 base samples, with an over-standard rate of 37.99%. There was no significant difference between black fungus samples collected from base and market (p > 0.05). From the point of view of residue, the performance was Cr > Pb > As > Cd, and there was no significant difference between the black fungus samples collected at base and market (p > 0.05).

3.2. Comparative Analysis of Simulated Distribution of Heavy Metal Content in Black Fungus

The distribution of residual heavy metals in auriculus auriculus samples from different collection links was simulated, and each simulation process was repeated 10,000 times. The simulation results of residual heavy metals in auriculus auriculus samples from different sources showed that the residual heavy metals in auriculus auriculus samples collected from bases and markets showed a distribution state of low residual concentration and partial extreme values. Figure 1A shows that the MRL value of As in black fungus after simulation is 1.021 mg·kg−1, the minimum value is 0.004 mg·kg−1, the average residual amount is 0.110 mg·kg−1, and the 90% confidence interval is mainly distributed in the range of 0.010–0.320 mg·kg−1. The maximum residual amount of As in the base sample was 0.889 mg·kg−1, the minimum value was 0.004 mg·kg−1, and the average value was 0.085 mg·kg−1. The 90% confidence interval was mainly distributed in the range of 0.009–0.244 mg·kg−1. The maximum residual amount of As in market samples was 1.986 mg·kg−1, the minimum value was 0, the average value was 0.205 mg·kg−1, and the 90% confidence interval was mainly distributed in the range of 0.010–0.616 mg·kg−1. The residual amount of As in black fungus collected in the market is relatively higher than that in the base, and the probability of an extreme value is relatively high, but the results show that the difference between the sampling links is not significant, that is, the sampling link has no significant impact on the content of heavy metal As.
Figure 1B shows that the MRL value of Pb in black fungus after simulation is 2.699 mg·kg−1, the minimum value is 0.016 mg·kg−1, the average residue is 0.315 mg·kg−1, and the 90% confidence interval is mainly distributed in the range of 0.051–0.792 mg·kg−1. The maximum residual amount of Pb in the base sample was 1.371 mg·kg−1, the minimum value was 0.030 mg·kg−1, and the average value was 0.308 mg·kg−1. The 90% confidence interval was mainly distributed in the range of 0.037–0.853 mg·kg−1. The maximum residual amount of Pb in the market samples was 1.640 mg·kg−1, the minimum value was 0 mg·kg−1, and the average value was 0.340 mg·kg−1. The 90% confidence interval was mainly distributed in the range of 0.088–0.699 mg·kg−1. The residual amount of Pb in black fungus collected in the market is relatively lower than that in the base, and the probability of extreme value is relatively high, but the results show that the difference between the sampling links is not significant, that is, the sampling link has no significant impact on the content of heavy metal Pb.
Figure 1C shows that the MRL value of Cd in black fungus after simulation is 4.42 mg·kg−1, the minimum value is 0 mg/kg, the average residual amount is 0.097 mg·kg−1, and the 90% confidence interval is mainly distributed in the range of 0.019–0.236 mg·kg−1. The maximum residual amount of Cd in the base sample was 3.508 mg·kg−1, the minimum value was 0 mg·kg−1, the average value was 0.103 mg·kg−1, and the 90% confidence interval was mainly distributed in the range of 0.017–0.262 mg·kg−1. The maximum residual amount of Cd in the market sample was 0.347 mg·kg−1, the minimum value was 0 mg·kg−1, and the average value was 0.077 mg·kg−1. The 90% confidence interval was mainly distributed in the range of 0.028–0.147 mg·kg−1. The residual amount of Cd in black fungus collected in the market is relatively lower than that in the base, and the probability of extreme value is relatively high, but the results show that the difference between the sampling links is not significant, that is, the sampling link has no significant impact on the heavy metal Cd content.
Figure 1D shows that the MRL value of Cr in black fungus after simulation is 12.188 mg·kg−1, the minimum value is 0 mg·kg−1, the average residue is 1.137 mg·kg−1, and the 90% confidence interval is mainly distributed in the range of 0.06–3.41 mg·kg−1. The maximum residual amount of Cr in the base sample was 13.617 mg·kg−1, the minimum value was 0 mg·kg−1, and the average value was 1.133 mg·kg−1. The 90% confidence interval was mainly distributed in the range of 0.06–3.40 mg·kg−1. The maximum residual amount of Cr in the market sample was 10.944 mg·kg−1, the minimum value was 0 mg·kg−1, the average value was 1.122 mg·kg−1, and the 90% confidence interval was mainly distributed in the range of 0.03–3.41 mg·kg−1. The residual amount of Cr in black fungus collected in the market is basically no different from that in the base, and the difference is not significant, that is, the sampling link has no significant impact on the heavy metal Cr content.

3.3. Risk Assessment of Dietary Exposure to Heavy Metals in Black Fungus

The @Risk 8.0 software was used to simulate the distribution of heavy metal residues in 179 dried black fungus. Each simulation cycle was 10,000 times. The simulation results showed that the residual distribution of heavy metal As in black fungus met the exponential distribution, denoted as RiskExpon (0.10546, RiskShift (0.0044109). The distribution of Cd residue satisfies the logical distribution RiskLoglogistic (−0.012793, 0.088553, 2.8455), The residual Pb distribution meets the gamma distribution RiskGamma (1.5252, 0.19681, RiskShift (0.01518), Cr residue distribution meets exponential distribution, denoted RiskExpon (1.1386, RiskShift (−0.0013609). The residual heavy metal data and other relevant exposure parameters were substituted into the formula, and the risk probability distribution of heavy metal ingestion by black fungus in Chinese minors and adults was calculated using @Risk 8.0 software. Each simulation cycle was 10,000 times, the results are shown in Figure 2. The average risk quotient of As ingested by black fungus in minors was 0.128, the minimum value was 0.005, and the maximum value was 1.204. The 90% confidence interval was mainly distributed in the range of 0.011–0.374. The average risk quotient of As ingested by black fungus in adults was 0.077, the minimum value was 0.003, and the maximum value was 0.717. The 90% confidence interval was mainly distributed in the range of 0.007–0.223. The average risk quotient of Pb ingested by black fungus in minors was 0.032, the minimum value was 0.002, and the maximum value was 0.230. The 90% confidence interval was mainly distributed in the range of 0.005–0.079. The average risk quotient of Pb ingested by black fungus in adults was 0.019, the minimum value was 0.001, the maximum value was 0.135, and the 90% confidence interval was mainly distributed in the range of 0.003–0.047. In addition, the average risk quotient of minors ingesting Cd through black fungus was 0.034, the minimum value was 0, the maximum value was 0.848, and the 90% confidence interval was mainly distributed in the range of 0.007–0.083. For adults, it was 0.020, 0.0820 and 0.004–0.049, respectively. The mean, minimum, maximum and 90% confidence intervals of Cr ingest by black fungus in minors and adults were 0.133 and 0.079, 0 and 0, 1.443 and 0.817, 0.007–0.398 and 0.004–0.238, respectively.
As shown in Table 5 and Figure 3, overall, the dietary risk of heavy metal ingestion through black fungus is higher in minors than in adults. Specifically, the average risk quotient of As, Pb, Cd and Cr ingested by Chinese minors through black fungus pathway was 0.1281, 0.0315, 0.0338 and 0.1326, respectively, and the comprehensive pollution index was 0.3260, which was in the overall safety level. However, at the high exposure levels of 97.5% sites and 99% sites, the risk quotient of single element was in the safe level, and the risk quotient of comprehensive pollution index was 1.1500 and 1.4466, respectively, in the light pollution level.
The average risk quotients of As, Pb, Cd and Cr ingestion in the Chinese adult population through black fungus pathway were 0.0766, 0.0188, 0.0202 and 0.0794, respectively, and the comprehensive pollution index was 0.1950, which was within the overall safety level. However, at the high exposure level of 99% sites, the risk quotient of single element was within the safe level, and the risk quotient of comprehensive pollution index was 0.8649, which was at the warning limit.

3.4. Analysis and Simulation Distribution of Heavy Metals in Black Fungus Cultivation Medium

3.4.1. Analysis of Heavy Metal Content in Black Fungus Cultivation Medium

Heavy metals As, Pb, Cd and Cr were detected on raw materials commonly used in black fungus bag cultivation. The residual distribution results of heavy metals in different black fungus cultivation substrates showed (Table 6) that from the point of view of detection rate, the detection rate of As and Cr in irrigation water was 2.94%, Pb and Cd were not detected, and all other raw materials were detected. From the qualification rate, the qualification rate of four heavy metals in culture medium, sawdust, soybean meal, wheat bran, corn flour and irrigation water, Pb and Cr in waste fungus rod, Pb and Cd and Cr in rice bran are 100%, the excess rate of As in waste fungus rod is 6.25%, the excess rate of Cd is 9.38%, and the excess rate of As in rice bran is 20%; no passing judgment). From the residual point of view, the heavy metals in culture medium, waste fungus sticks, sawdust, rice bran, wheat bran and corn flour showed Cr > Pb > As > Cd, the heavy metals in soybean meal showed Cr > Pb > Cd > As, and the heavy metals in lime and gypsum showed Cr > As > Pb > Cd. In terms of the residual amount of heavy metals, As was lime > gypsum > rice bran > waste fungus sticks > medium > sawdust > wheat bran > soybean meal > > irrigation water. Pb in different raw materials is lime > sawdust > rice bran > waste fungus sticks > wheat bran > gypsum > medium > corn flour > soybean meal > irrigation water; Cd in different raw materials is waste fungus sticks > lime > gypsum > sawdust > medium > wheat bran > soybean meal > rice bran > corn flour > irrigation water; Cr in different raw materials is lime > rice bran > gypsum > sawdust > waste fungus sticks > medium > wheat bran > corn flour > soybean meal > irrigation water.

3.4.2. Comparative Analysis of Simulated Distribution of Heavy Metals in Black Fungus Cultivation Medium

In this study, the distribution of residual heavy metals in the samples of different cultivation substrates was simulated, and each simulation process was cycled 10,000 times. The results of the simulation distribution of residual heavy metals in different cultivation substrates showed that the residual concentrations were low and some extreme values existed.
Supplemental Figure S1 shows that the maximum, minimum and average As content in the simulated medium was 1.303 mg/kg, 0 mg/kg, and 0.132 mg/kg. The 90% confidence interval was mainly distributed in the range of 0.007–0.396 mg/kg. The maximum content of Pb was 1.147 mg/kg, the minimum value was 0.030 mg/kg, and the average value was 0.405 mg/kg. The 90% confidence interval was mainly distributed in the range of 0.059–0.902 mg/kg. The maximum value of Cd was 0.104 mg/kg, the minimum value was 0 mg/kg, and the average value was 0.047 mg/kg. The 90% confidence interval was mainly distributed in the range of 0.013–0.086 mg/kg. The maximum value of Cr was 13.665 mg/kg, the minimum value was 0 mg/kg, and the average value was 1.385 mg/kg. The 90% confidence interval was mainly distributed in the range of 0.020–4.250 mg/kg. And Cr > Pb > As > Cd.
Supplemental Figure S2 shows that after simulation, the maximum value of As in waste bacteria rods is 2.194 mg/kg, the minimum value is 0 mg/kg, and the average value is 0.209 mg/kg. The 90% confidence interval is mainly distributed in the range of 0.009–0.628 mg/kg. The maximum content of Pb was 1.427 mg/kg, the minimum value was 0 mg/kg, and the average value was 0.702 mg/kg. The 90% confidence interval was mainly distributed in the range of 0.156–1.206 mg/kg. The maximum value of Cd content was 1.119 mg/kg, the minimum value was 0.034 mg/kg, and the average value was 0.143 mg/kg. The 90% confidence interval was mainly distributed in the range of 0.039–0.360 mg/kg. The maximum value of Cr was 4.6424 mg/kg, the minimum value was 0.513 mg/kg, and the average value was 1.901 mg/kg. The 90% confidence interval was mainly distributed in the range of 0.618–3.746 mg/kg. And Cr > Pb > As > Cd.
Supplemental Figure S3 shows that after simulation, the maximum value of As content in sawdust is 0.323 mg/kg, the minimum value is 0.004 mg/kg, and the average value is 0.035 mg/kg. The 90% confidence interval is mainly distributed in the range of 0.006–0.097 mg/kg. The maximum content of Pb is 1.713 mg/kg, the minimum value is 0 mg/kg, and the average value is 0.804 mg/kg. The 90% confidence interval is mainly distributed in the range of 0.124–1.44 mg/kg. The maximum content of Cd is 1.147 mg/kg and the minimum value is 0.030 mg/kg. The average value was 0.405 mg/kg, and the 90% confidence interval was mainly distributed in the range of 0.059–0.902 mg/kg. The maximum value of Cr was 105.40 mg/kg, the minimum value was 0 mg/kg, and the average value was 2.480 mg/kg. The 90% confidence interval was mainly distributed in the range of 0.300–6.500 mg/kg. And Cr > Pb > Cd > As.
Supplemental Figure S4 shows that the maximum, minimum and average As content in soybean meal after simulation is 0.021 mg/kg, 0.005 mg/kg, and 0.006 mg/kg. The 90% confidence interval is mainly distributed in the range of 0.005–0.008 mg/kg. The maximum content of Pb was 11.182 mg/kg, the minimum value was 0.009 mg/kg, and the average value was 0.106 mg/kg. The 90% confidence interval was mainly distributed in the range of 0.020–0.300 mg/kg. The maximum value of Cd content was 0.516 mg/kg, the minimum value was 0.009 mg/kg, and the average value was 0.048 mg/kg. The 90% confidence interval was mainly distributed in the range of 0.011–0.125 mg/kg. The maximum value of Cr was 1.463 mg/kg, the minimum value was 0.005 mg/kg, and the average value was 0.496 mg/kg. The 90% confidence interval was mainly distributed in the range of 0.042–1.147 mg/kg. And Cr > Pb > Cd > As.
Supplemental Figure S5 shows that after simulation, the maximum value of As content in rice bran is 2.943 mg/kg, the minimum value is 0 mg/kg, and the average value is 0.284 mg/kg. The 90% confidence interval is mainly distributed in the range of 0–0.892 mg/kg. The maximum content of Pb is 1. The minimum value was 0 mg/kg, and the average value was 0.714 mg/kg. The 90% confidence interval was mainly distributed in the range of 0.090–1.150 mg/kg. The maximum value of Cd content was 0.298 mg/kg, the minimum value was 0.009 mg/kg, and the average value was 0.035 mg/kg. The 90% confidence interval was mainly distributed in the range of 0.010–0.087 mg/kg. The maximum value of Cr was 17.340 mg/kg, the minimum value was 0 mg/kg, and the average value was 3.010 mg/kg. The 90% confidence interval was mainly distributed in the range of 0.280 to 6.900 mg/kg. And Cr > Pb > As > Cd.
Supplemental Figure S6 shows that after simulation, the maximum value of As in wheat bran is 0.383 mg/kg, the minimum value is 0.003 mg/kg, and the average value is 0.035 mg/kg. The 90% confidence interval is mainly distributed in the range of 0.005–0.097 mg/kg. The maximum content of Pb was 7.199 mg/kg, the minimum was 0 mg/kg, and the average value was 0.597 mg/kg. The 90% confidence interval was mainly distributed in the range of 0.010–1.840 mg/kg. The maximum value of Cd content was 0.675 mg/kg, the minimum value was 0.007 mg/kg, and the average value was 0.061 mg/kg. The 90% confidence interval was mainly distributed in the range of 0.010–0.169 mg/kg. The maximum value of Cr was 31.70 mg/kg, the minimum value was 0 mg/kg, and the average value was 2.9 5 mg/kg. The 90% confidence interval was mainly distributed in the range of 0–8.000 mg/kg. And Cr > Pb > Cd > As.
Figure 4A shows the content of heavy metals in lime and gypsum after simulation. The results show that Cr is the highest, Pb is the second, and As and Cd are less. Figure 4B shows the comparison of the same heavy metal in different raw materials after simulation. The results show that the content of As in the medium is rice bran > gypsum > waste fungus sticks > medium > sawdust > wheat bran > lime > soybean meal; Pb content lime > sawdust > waste fungus rod > rice bran > wheat bran > gypsum > medium > soybean meal; Cd gypsum content waste fungus sticks > lime > sawdust > wheat bran > medium > soybean meal > rice bran; and Cr content lime > rice bran > sawdust > wheat bran > gypsum > waste fungus sticks > medium > soybean meal.

3.4.3. Analysis of the Sources of Pb, Cd and Cr of Heavy Metals in Black Fungus

The content of sawdust, wheat bran, rice bran, soybean meal, corn flour, lime, gypsum, irrigated water and heavy metal in all raw materials were tested comprehensively, and the contribution rate of each raw material was calculated. The raw material distribution of each base is shown in Table 5.
After detection, Pb, Cd and Cr were detected in all samples except for most elements not detected in water samples. According to the formula: contribution rate (element content × weight)/total content)), the contribution rate of each raw material to heavy metals in fruiting bodies was calculated. The contribution rate of each raw material to Pb was analyzed (Figure 5A): sawdust 73.57–96.55%, wheat bran 2.02–16.55% accounted for 3.39% of rice bran 17.67%, soybean meal 0.04–3.07%, corn 0.07–0.30%, lime 0.09–9.10%, gypsum 0.07–2.79%. The average value of sawdust was 82.32% > rice bran 7.63% > wheat bran 7.05% > lime 1.39% > gypsum 1.05% > soybean meal 0.39% > corn flour 0.17%.
The contribution rate of each raw material to Pb (Figure 5B): sawdust 73.57–96.55%, wheat bran 2.02–16.55% accounted for 3.39% of rice bran 17.67%, soybean meal 0.04–3.07%, corn 0.07–0.30%, lime 0.09–9.10%, gypsum 0.07–2.79%. The average value of sawdust was 82.32% > rice bran 7.63% > wheat bran 7.05% > lime 1.39% > gypsum 1.05% > soybean meal 0.39% > corn flour 0.17%. As to Cd: sawdust 56.45–97.58%, wheat bran 1.82–21.57% accounted for 3.14% of rice bran 18.50%, soybean meal 0.23–10.20%, corn 0.05–0.98%, lime 0.01–17.51%, gypsum 0.01–11.26%. The average value of sawdust 77.83% > rice bran 7.82% > wheat bran 6.62% > gypsum 2.80% > lime 2.36% > soybean meal 2.22% > corn flour 0.34%. As to Cr (Figure 5C), sawdust 75.31–98.32%, wheat bran 0.41–38.86% accounted for 2.15% of rice bran 20.79%, soybean meal 0.12–4.17%, corn 0.28–1.62%, lime 0.31–4.36%, gypsum 0.20–3.88%. The average value of sawdust was 81.35% > rice bran 8.49% > wheat bran 6.01% > lime 1.34% > gypsum 1.19% > corn flour 1.06% > soybean meal 0.57%.

4. Discussion

Black fungus is one of the most consumed edible fungi in the world, and northeast China is the main producing area of black fungus [16,17,18] (Ren et al., 2022; Pak et al., 2021; Li et al.). In addition, black fungus is susceptible to heavy metal pollution, which brings potential threats to consumers’ lives and health [19,20,21] (Silva-Bailao et al., 2018; Damodaran et al., 2014; Hamilton et al., 2023). It is of guiding significance for the development of edible mushroom industry to clarify the assessment method of heavy metal content in black fungus and to find out the potential risk matrix [12,22,23] (Zhu et al., 2011; Chen et al., 2009; Voidaleski et al., 2023). However, there have been few studies on the heavy metal assessment of auriculus auriculus in northeast China, especially in Heilongjiang and Jilin provinces. This study aims to provide theoretical basis for auriculus auriculus production and processing in these two provinces.

5. Conclusions

This study evaluated the background value of heavy metals in auriculus auriculus fruiting bodies and raw materials and the risk assessment of dietary intake of auriculus auriculus, and made a preliminary discussion on the sources of heavy metals in auriculus auriculus. The main research results are as follows:
  • As, Pb, Cd and Cr were detected in auriculus auriculus auriculus, and the cumulative quantity showed Cr > Pb > As > Cd, and there was no significant difference between auriculus auriculus samples collected from the base and the market (p > 0.05), indicating that there was no external risk during storage and transportation.
  • In this study, the background values of four heavy metals in auricularia auriculata were determined, and the background values of As were 0.010–0.320 mg/kg, Pb 0.051–0.792 mg/kg, and Cd 0.019–0.236 mg/kg. The background value of Cr ranges from 0.06 to 3.41 mg/kg. The over-standard rate of As, Pb and Cd in black fungus was 1.68%, 0.59% and 0.59% respectively. Since there is no limit standard for Cr, the reference grain limit has an over-standard rate of 37.99%. In view of this, it is recommended to develop the limit standard for Cr in black fungus as soon as possible.
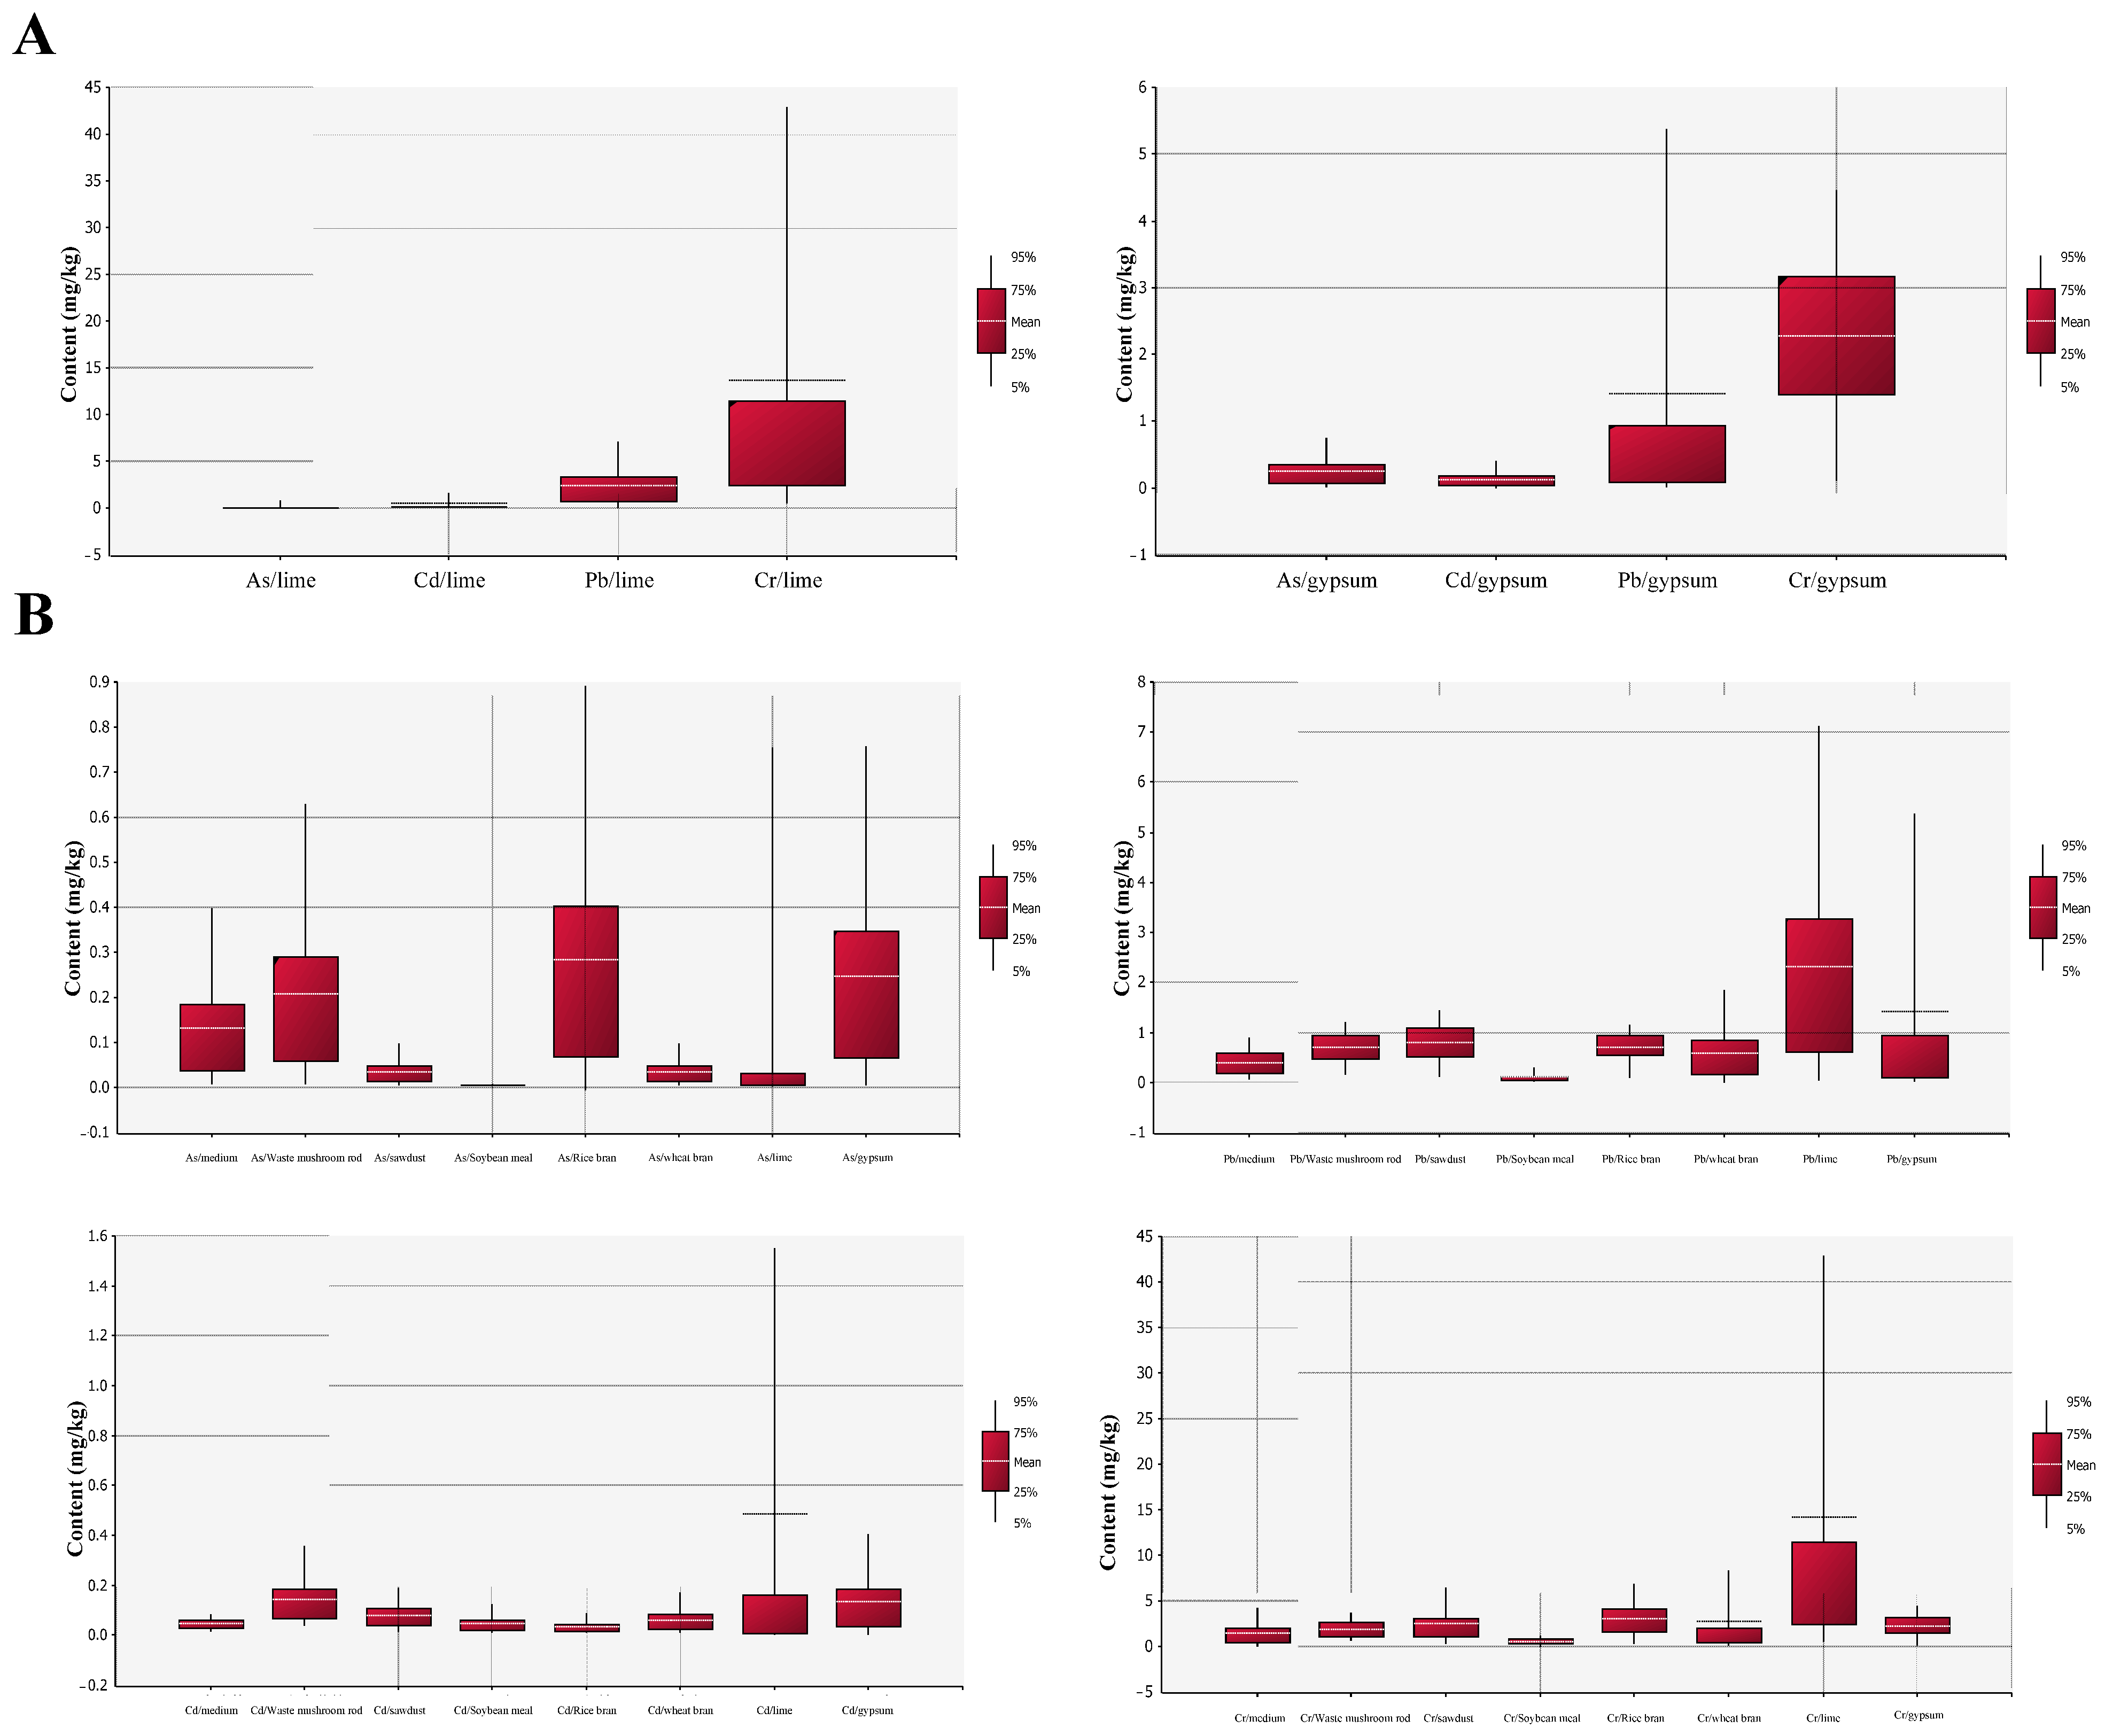
  • The background values of the four heavy metals in the main raw materials were determined. As in sawdust was between 0.006–0.097 mg/kg, Pb was 0.124–1.44 mg/kg, Cd was 0.059–0.902 mg/kg, and Cr was 0.300–6.500 mg/kg, and Cr > Pb > Cd > As. In soybean meal, As was 0.005–0.008 mg/kg, Pb ranged from 0.020–0.300 mg/kg, Cd 0.011–0.125 mg/kg, Cr 0.042–1.147 mg/kg, and Cr > Pb > Cd > As. The contents of As in rice bran ranged from 0 to 0.892 mg/kg, Pb from 0.090 to 1.150 mg/kg, Cd from 0.010 to 0.087 mg/kg, Cr from 0.280 to 6.900 mg/kg, and Cr > Pb > As > Cd. In wheat bran, As was 0.005–0.097 mg/kg, Pb 0.010–1.840 mg/kg, Cd 0.010–0.169 mg/kg, Cr 0–8.000 mg/kg, and Cr > Pb > Cd > As. The content of heavy metals in lime and gypsum is the highest in Cr, followed by Pb, and less in As and Cd.
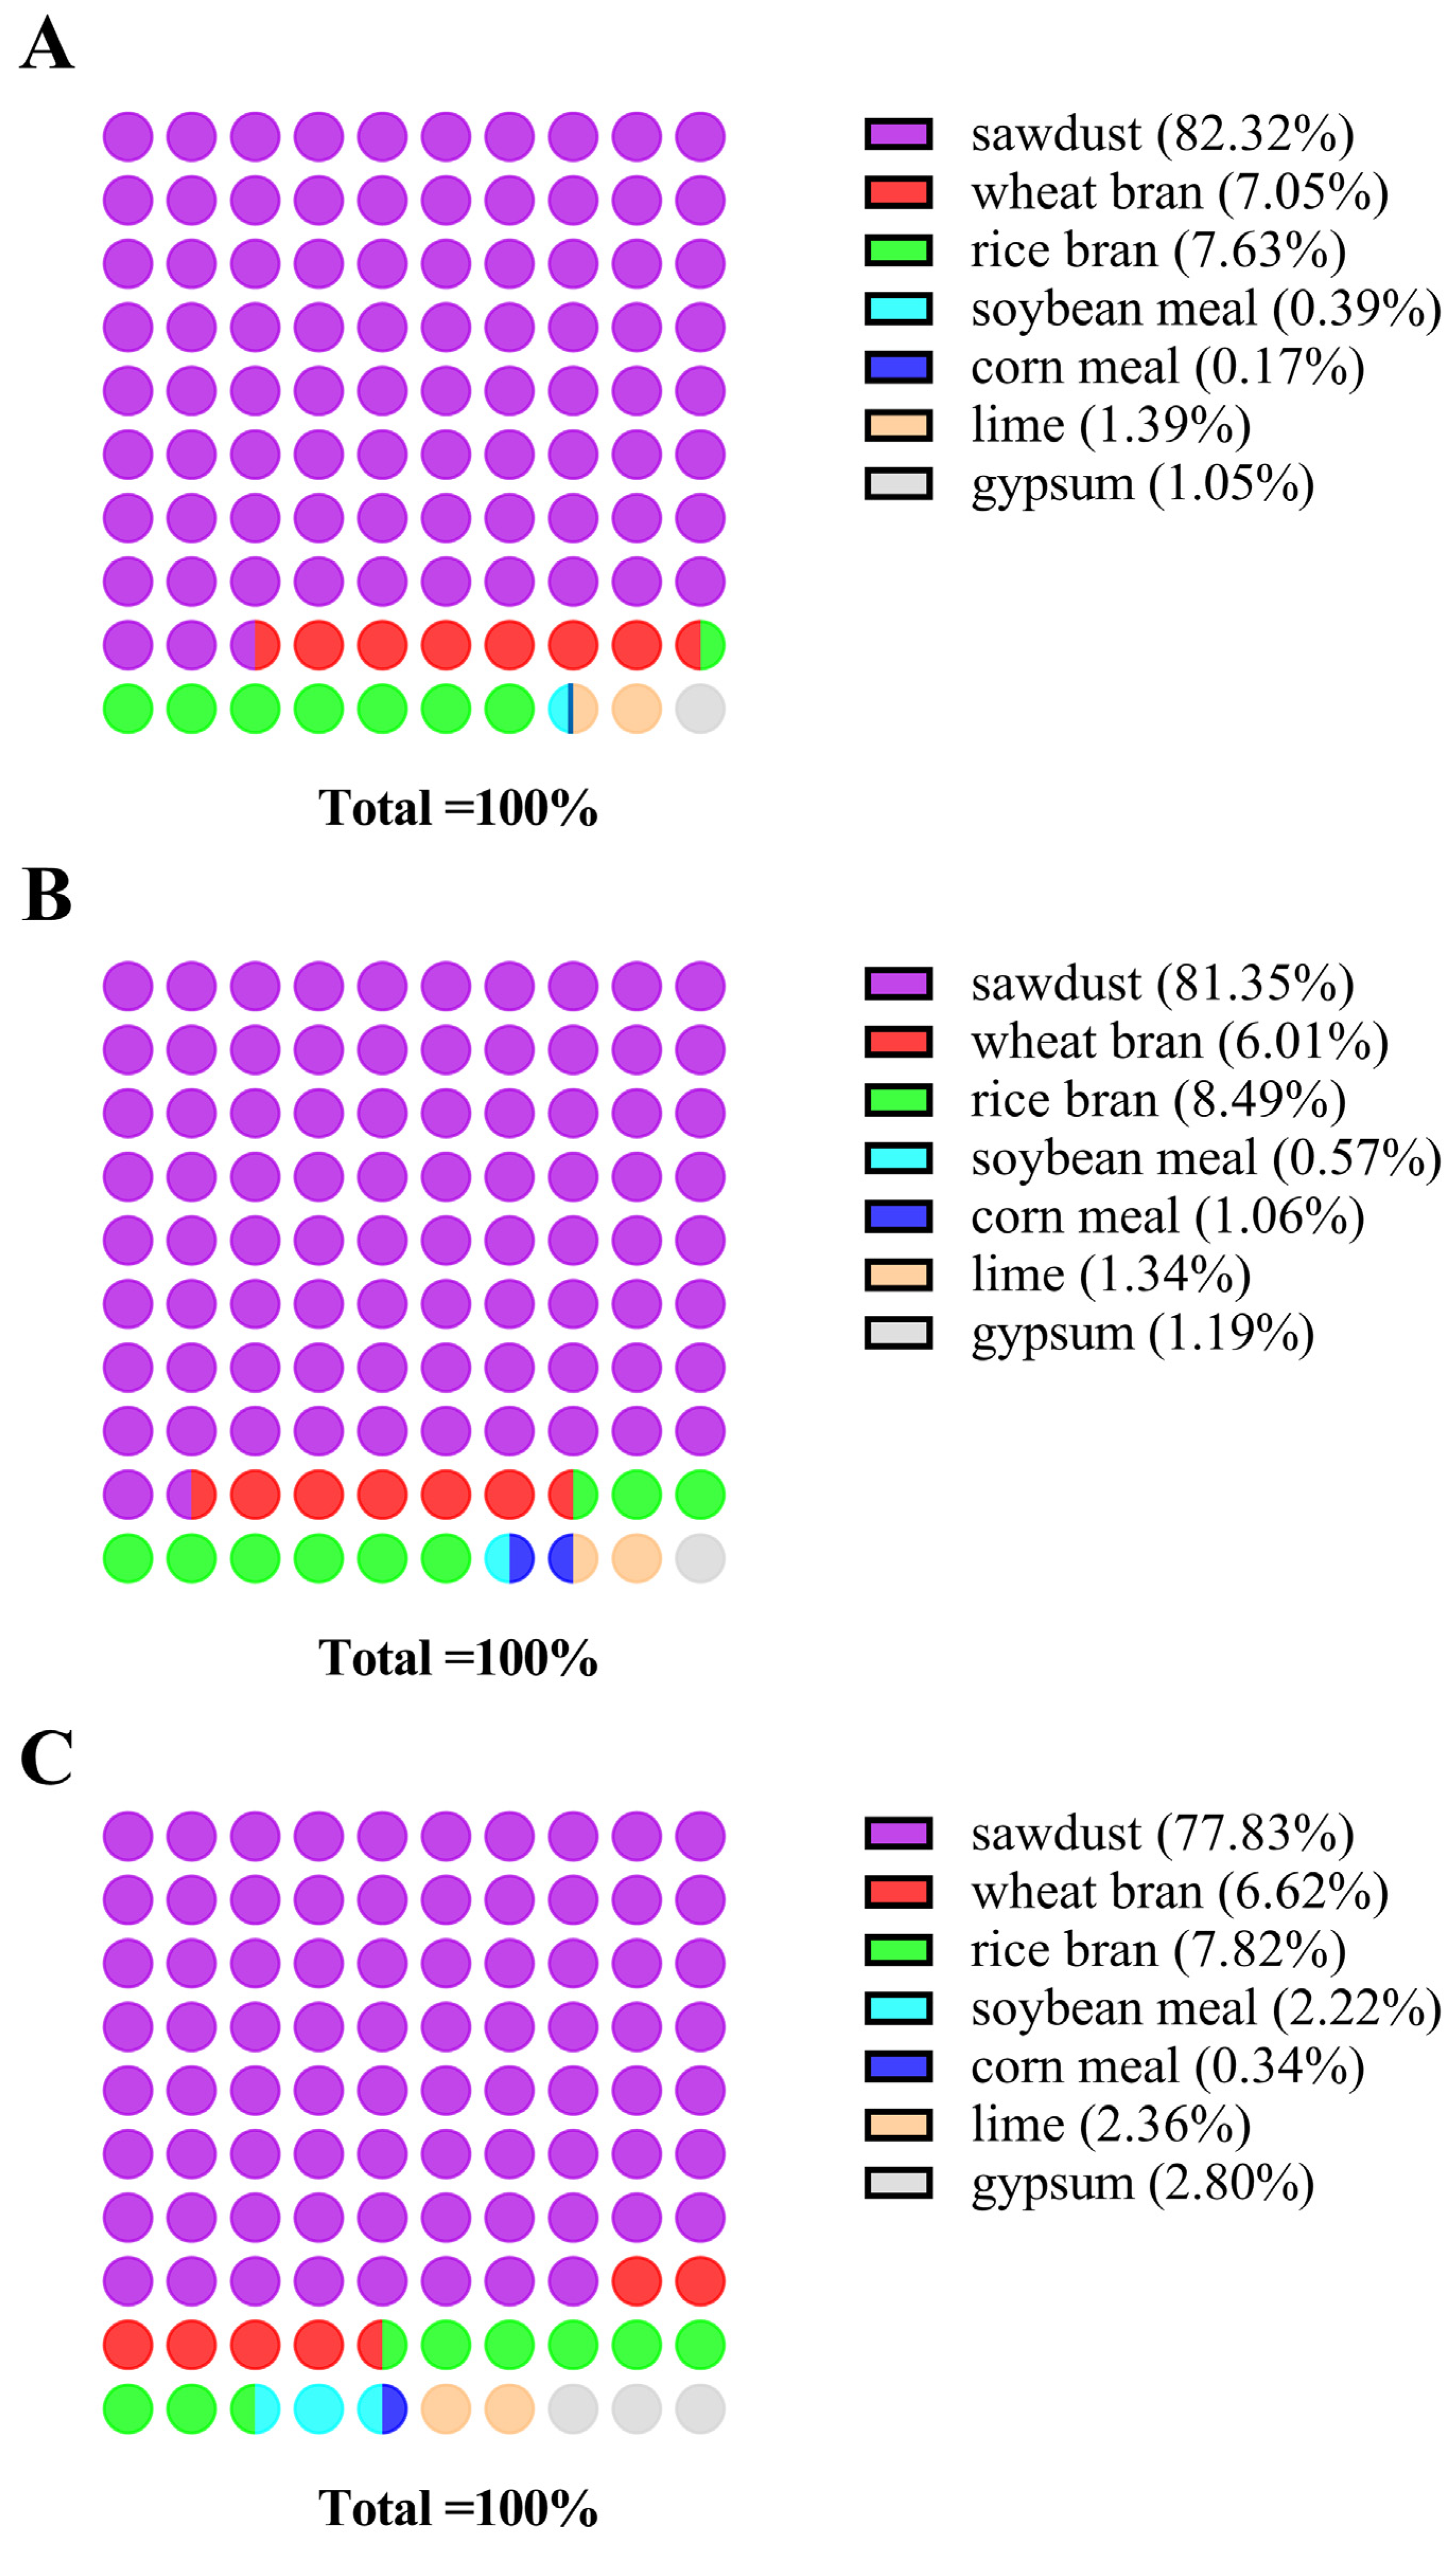
  • Without considering irrigation water and external factors, the contribution of raw materials to heavy metals mainly came from sawdust, followed by rice bran and wheat bran. The contribution rate of Pb is as follows: sawdust 82.32% > rice bran 7.63% > wheat bran 7.05% > lime 1.39% > gypsum 1.05% > soybean meal 0.39% > corn flour 0.17%. The contribution rate of Cd was 77.83% sawdust > rice bran 7.82% > wheat bran 6.62% > gypsum 2.80% > lime 2.36% > soybean meal 2.22% > corn flour 0.34%. The contribution rate of Cr was 81.35% sawdust > rice bran 8.49% > wheat bran 6.01% > lime 1.34% > gypsum 1.19% > corn flour 1.06% > soybean meal 0.57%.
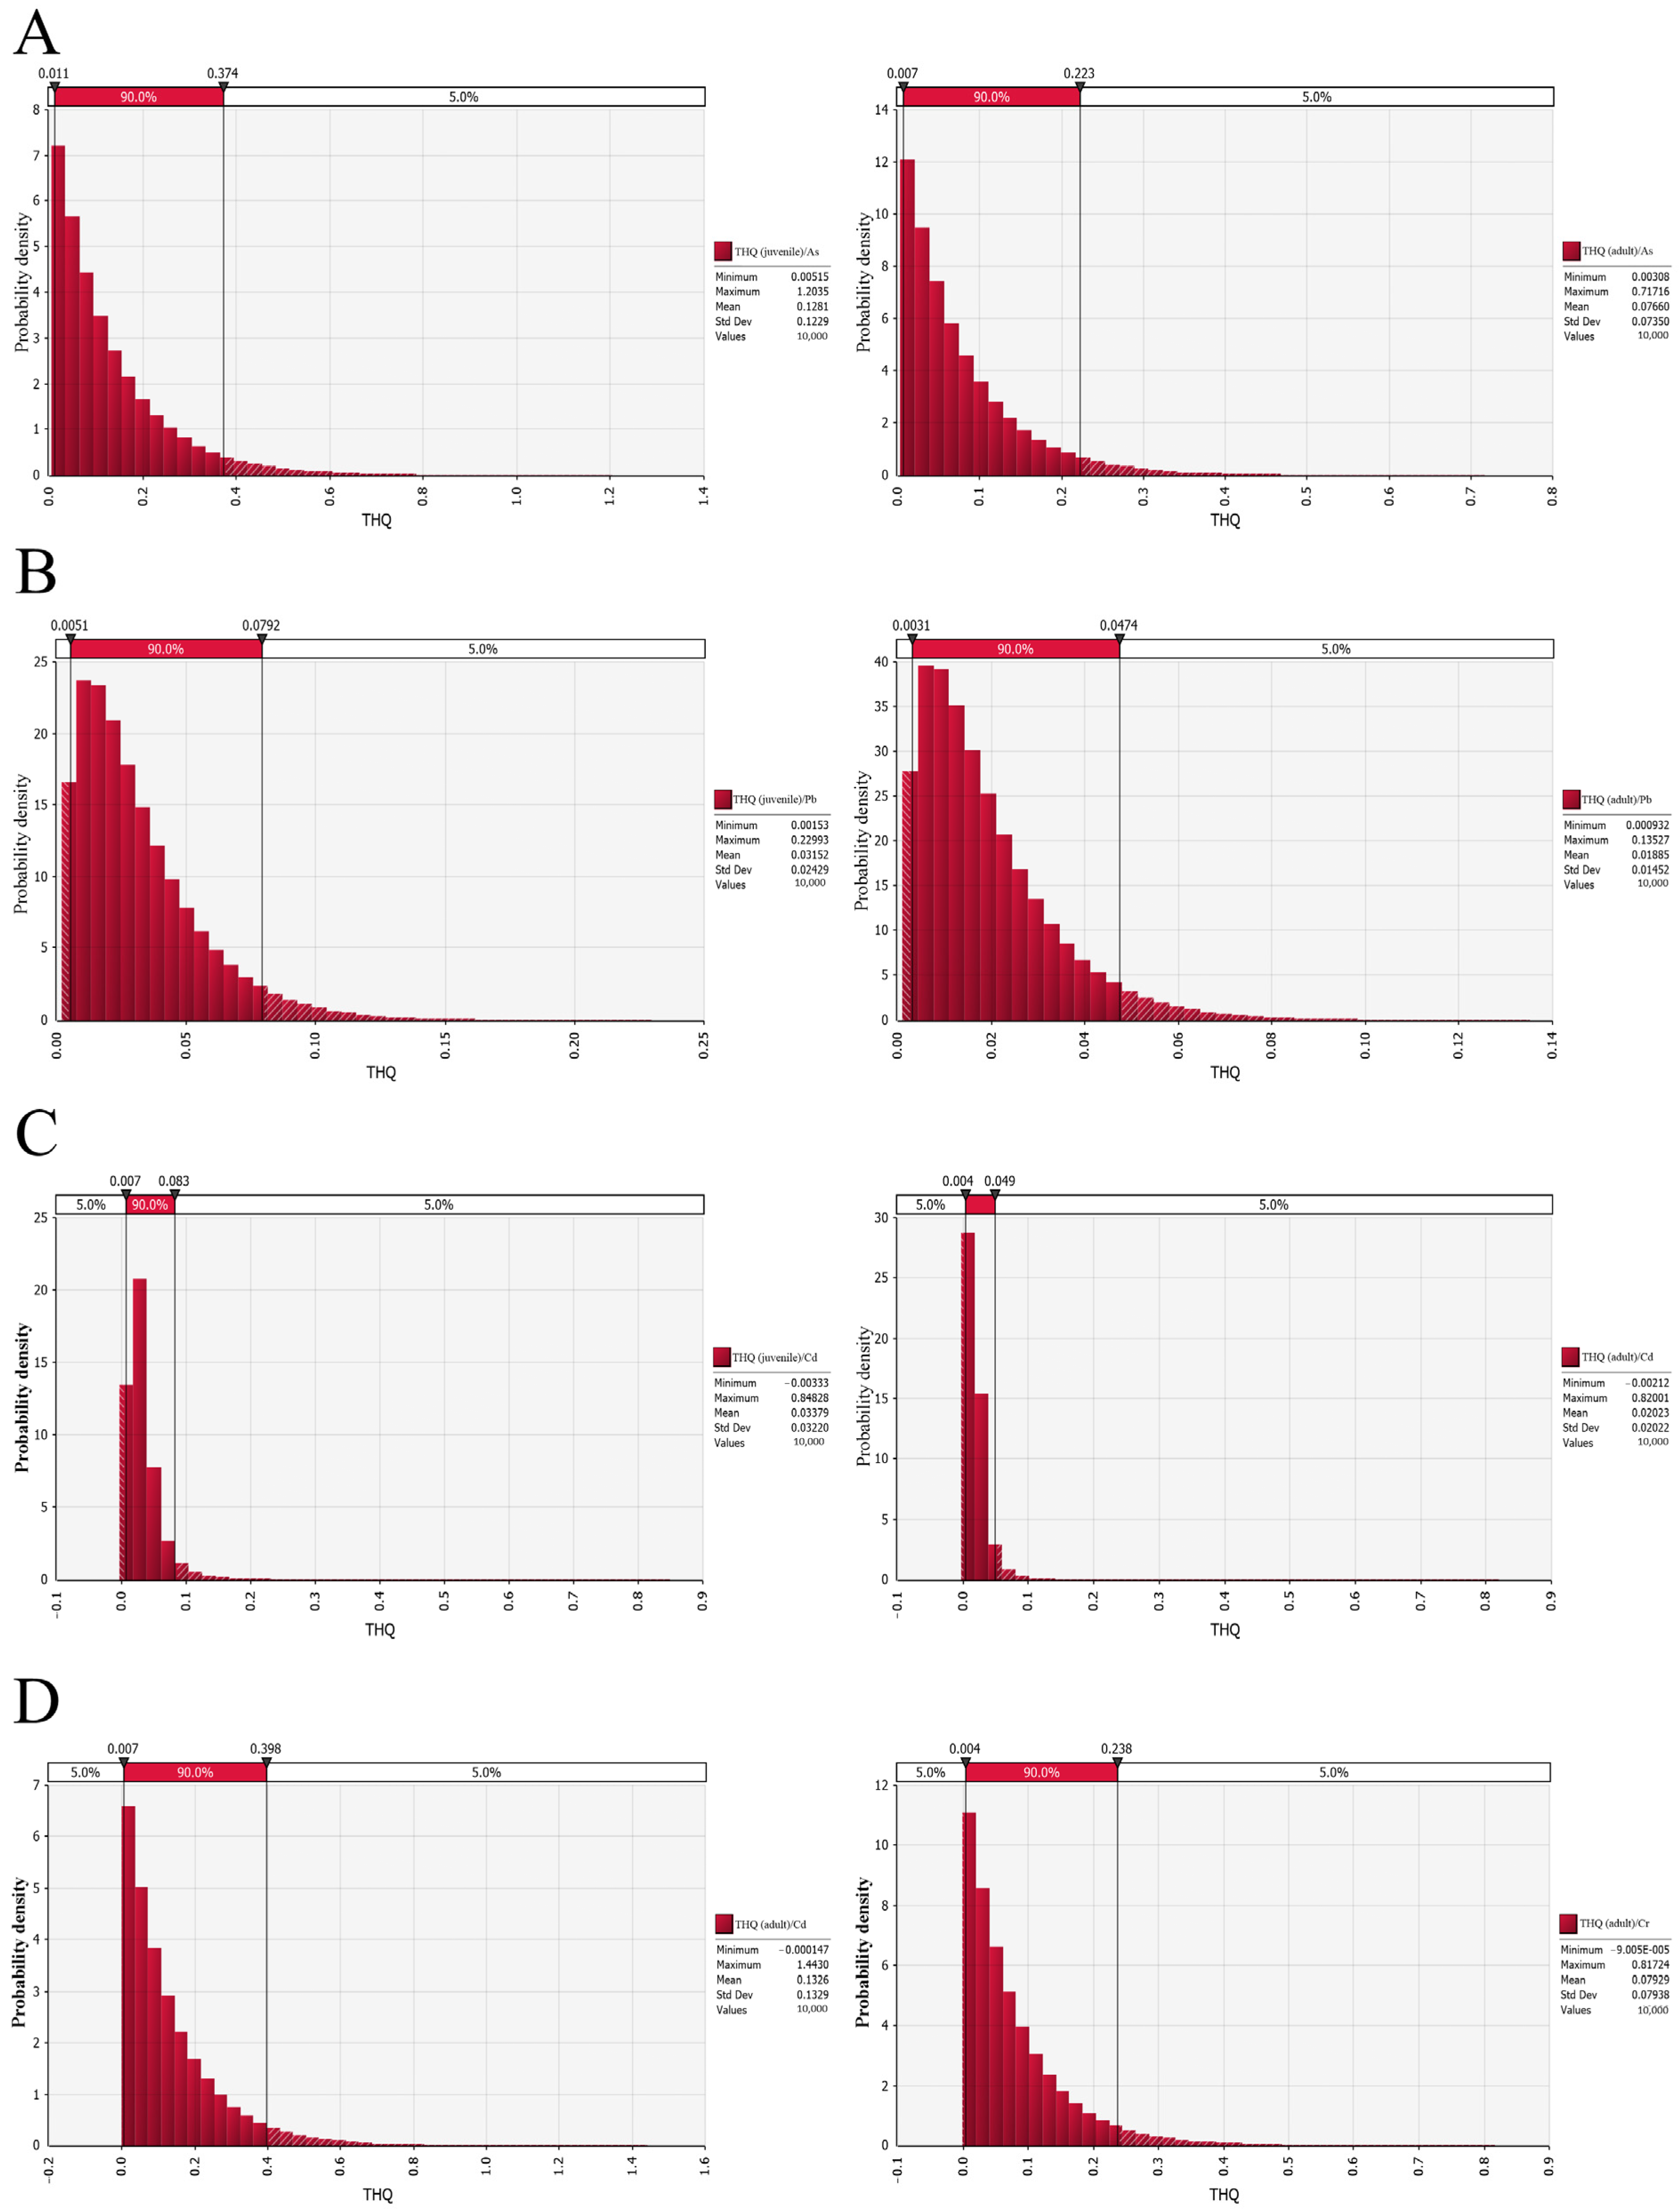
  • Risk assessment results showed that the risk of heavy metals As, Pb, Cd and Cr in black fungus through dietary intake was higher in minors than in adults. The average risk quotient of As, Pb, Cd and Cr ingested by the black fungus pathway in the juvenile population was 0.1281, 0.0315, 0.0338 and 0.1326, respectively, and the comprehensive pollution index was 0.3260. However, at the high exposure levels of 97.5% sites and 99% sites, the risk quotient of single element was within the safe level, and the risk quotient of comprehensive pollution index was 1.1500 and 1.4466, respectively, in the light pollution level. The average risk quotient of As, Pb, Cd and Cr ingestion in the adult population through black fungus pathway were 0.0766, 0.0188, 0.0202 and 0.0794, respectively, and the comprehensive pollution index was 0.1950, which was within the overall safety level. However, at the high-exposure level of 99% sites, the risk quotient of single element was within the safe level, and the risk quotient of comprehensive pollution index was 0.8649, which was at the warning limit.
To sum up, this study established a Monte Carlo simulation-based non-parametric probability assessment system for heavy metals in auriculus auriculus. The hazard degree of heavy metals in auriculus auriculus on dietary intake of different populations was evaluated by the target hazard coefficient method. This method can simulate and calculate the risk probability distribution, and quantify the variability of the model through random sampling of risk variables, better reflecting the true distribution of risk.

Supplementary Materials

The following supporting information can be downloaded at: https://www.mdpi.com/article/10.3390/app14031082/s1, Figure S1: Residual Arsenic of four heavy metal residues in culture medium based on Monte Carlo simulation; Figure S2: Residual Arsenic of four heavy metal residues in Waste mushroom rod based on Monte Carlo simulation; Figure S3: Residual Arsenic of four heavy metal residues in sawdust based on Monte Carlo simulation; Figure S4: Residual Arsenic of four heavy metal residues in Soybean meal based on Monte Carlo simulation; Figure S5: Residual Arsenic of four heavy metal residues in Rice bran based on Monte Carlo simulation; Figure S6: Residual Arsenic of four heavy metal residues in Lime and gypsum based on Monte Carlo simulation.

Author Contributions

Formal analysis, C.W.; Data curation, H.F.; Writing—original draft, J.Q.; Supervision, F.Y.; Project administration, Z.S. All authors have read and agreed to the published version of the manuscript.

Funding

This study was supported by the Fungus product quality safety risk factor investigation and critical control point evaluation (GJFP20170060301).

Data Availability Statement

Data are contained within the article.

Conflicts of Interest

The authors declare no conflicts of interest.

References

  1. Guo, Y.J.; Deng, G.F.; Xu, X.R.; Wu, S.; Li, S.; Xia, E.Q.; Li, F.; Chen, F.; Ling, W.H.; Li, H.B. Antioxidant capacities, phenolic compounds and polysaccharide contents of 49 edible macro-fungi. Food Funct. 2012, 3, 1195–1205. [Google Scholar] [CrossRef] [PubMed]
  2. Yao, H.W.; Liu, Y.; Ma, Z.F.; Zhang, H.X.; Fu, T.T.; Li, Z.Q.; Li, Y.J.; Hu, W.; Han, S.C.; Zhao, F.C.; et al. Analysis of Nutritional Quality of Black Fungus Cultivated with Corn Stalks. J. Food Quality 2019, 2019, 9590251. [Google Scholar] [CrossRef]
  3. Watanabe, F.; Schwarz, J.; Takenaka, S.; Miyamoto, E.; Ohishi, N.; Nelle, E.; Hochstrasser, R.; Yabuta, Y. Characterization of Vitamin B12 Compounds in the Wild Edible Mushrooms Black Trumpet (Craterellus cornucopioides) and Golden Chanterelle (Cantharellus cibarius). J. Nutr. Sci. Vitaminol. 2012, 58, 438–441. [Google Scholar] [CrossRef] [PubMed]
  4. Türkmen, M.; Budur, D. Heavy metal contaminations in edible wild mushroom species from Turkey’s Black Sea region. Food Chem. 2018, 254, 256–259. [Google Scholar] [CrossRef] [PubMed]
  5. Liu, B.; Lu, H.Y.; Shu, Q.; Chen, Q.H.; Wang, J.L. The Influence of Different Pretreatment Methods of Highland Barley by Solid-State Fermentation with Agaricus sinodeliciosus var. Chaidam ZJU-TP-08 on Its Nutrient Content, Functional Properties and Physicochemical Characteristics. J. Fungi 2022, 8, 940. [Google Scholar] [CrossRef]
  6. Malinowska, E.; Zefer, P.; Falandysz, J. Metals bioaccumulation by bay bolete, Xerocomus badius, from selected sites in Poland. Food Chem. 2004, 84, 405–416. [Google Scholar] [CrossRef]
  7. Lsildak, O.; Turkekul, I.; Elmastas, M. Bioaccumulation of heavy metals in some wild grown edible mushrooms. Anal. Lett. 2007, 40, 1099–1116. [Google Scholar] [CrossRef]
  8. Özcan, M.M.; Dursun, N.; Juhaimi, F.A.L. Macro- and microelement contents of some legume seeds. Environ. Monit. Assess. 2013, 185, 9295–9298. [Google Scholar] [CrossRef] [PubMed]
  9. Severoglu, Z.; Sumer, S.; Yalcin, B. Trace metal levels in edible wild fungi. Int. J. Environ. Sci. Technol. 2013, 10, 295–304. [Google Scholar] [CrossRef]
  10. Didier, M.; Eliane, S.; Jean-Christophe, D. Update on metal content profiles in mushrooms-toxicological implications and tentative approach to the mechanisms of bioaccumulation. Toxicon 1998, 36, 1997–2012. [Google Scholar]
  11. Demirbas, A. Metal ion uptake by mushrooms from natural and artificially enriched soils. Food Chem. 2002, 78, 89–93. [Google Scholar] [CrossRef]
  12. Zhu, F.K.; Qu, L.; Fan, W.X.; Qiao, M.Y.; Hao, H.L.; Wang, X.J. Assessment of heavy metals in some wild edible mushrooms collected from Yunnan Province, China. Environ. Monit. Assess. 2011, 179, 191–199. [Google Scholar] [CrossRef] [PubMed]
  13. SFDA (State Food and Drug Administration). GB2762-2017; National Standard for Food Safety—Contamination Limit in Food. National Health and Family Planning Commission, People’s Republic of China: Beijing, China, 2017.
  14. DB22/T 2345-2015; Determination of Lead, Chrominum, Cadimium, Arsenic, Mercury, Selenium, Copper and Zinc in Crops—Inductively Coupled Plasma Mass Spectrometry. Jilin Provincial Bureau of Quality and Technical Supervision: Changchun, China, 2015.
  15. NY/T 391-2013; Green Food-Environmental Quality for Production Area. Ministry of Agriculture and Rural Affairs of the People’s Republic of China: Beijing, China, 2013.
  16. Ren, Y.C.; Huang, J.T.; Wang, X.N.; Wang, Y.Q.; Li, H.C.; Yue, T.L.; Gao, Z.P. Effects of sulfite treatment on the quality of black fungus. Food Chem. 2022, 385, 132685. [Google Scholar] [CrossRef] [PubMed]
  17. Li, Y.J.; Pu, M.Y.; Cui, Y.S.; Gu, J.; Chen, X.; Wang, L.Q.; Wu, H.Z.; Yang, Y.Y.; Wang, C. Research on the isolation and identification of black spot disease of Rosa chinensis in Kunming, China. Sci. Rep. 2023, 13, 8829. [Google Scholar] [CrossRef] [PubMed]
  18. Pak, S.; Chen, F.; Ma, L.J.; Hu, X.S.; Ji, J.F. Functional perspective of black fungi (Auricularia auricula): Major bioactive components, health benefits and potential mechanisms. Trends Food Sci. Technol. 2021, 114, 245–261. [Google Scholar] [CrossRef]
  19. Silva-Bailao, M.G.; da Silva, K.L.P.; dos Anjos, L.R.B.; Lima, P.D.; Teixeira, M.D.; Soares, C.M.D.; Bailao, A.M. Mechanisms of copper and zinc homeostasis in pathogenic black fungi. Fungal Biol. 2018, 122, 526–537. [Google Scholar] [CrossRef] [PubMed]
  20. Damodaran, D.; Shetty, K.V.; Mohan, B.R. Uptake of certain heavy metals from contaminated soil by mushroom—Galerina vittiformis. Ecotoxicol. Environ. Saf. 2014, 104, 414–422. [Google Scholar] [CrossRef] [PubMed]
  21. Hamilton, G.E.; Gladfelter, A.S. Dissection of a potentially ancient septin in the emerging model black fungus Knufia petricola. Mol. Biol. Cell 2023, 34, 297. [Google Scholar]
  22. Chen, X.H.; Zhou, H.B.; Qiu, G.Z. Analysis of Several Heavy Metals in Wild Edible Mushrooms from Regions of China. Bull. Environ. Contam. Toxicol. 2009, 83, 280–285. [Google Scholar] [CrossRef] [PubMed]
  23. Voidaleski, M.F.; Costa, F.D.; de Hoog, G.S.; Gomes, R.R.; Vicente, V.A. Metagenomics reveals an abundance of black yeast-like fungi in the skin microbiome. Mycoses 2023, 66, 488–496. [Google Scholar] [CrossRef] [PubMed]
Figure 1. Residual arsenic (A), plumbum (B), cadmium (C) and chromium (D) in dried black fungus based on Monte Carlo simulation.
Applsci 14 01082 g001
Figure 2. Hazard quotient probability distribution of As (A), Pb (B), Cd (C) and Cr (D) intake by Auricularia heimuer in different populations based on Monte Carlo simulation.
Applsci 14 01082 g002
Figure 3. Hazard quotient probability distribution of heavy metal intake by different populations through Auricularia heimuer based on Monte Carlo simulation.
Applsci 14 01082 g003
Figure 4. (A) Residual As of four heavy metal residues in lime and gypsum based on Monte Carlo simulation. (B) Residual As of four heavy metal residues in different raw and auxiliary materials based on Monte Carlo simulation.
Applsci 14 01082 g004
Figure 5. (A) Contribution rate of raw and auxiliary materials to lead in Auricularia heimuer. (B) Contribution rate of raw and auxiliary materials to cadmium in Auricularia heimuer. (C) Contribution rate of raw and auxiliary materials to chromium in Auricularia heimuer.
Applsci 14 01082 g005
Table 1. Tuning parameters of inductively coupled plasma mass spectrometer.
ParameterRF Power/wSampling Depth/mmFlow Rate of Carrier Gas/(L/min)Compensated Gas Flow Rate/(L/min)Peristaltic Pump Speed/(r/min)Atomizing Chamber Temperature/°C
Set value1300–15006–96.0–10.00.4–0.60.12
Table 2. Tuning index of inductively coupled plasma mass spectrometer.
ParameterMass Axis/%Mass Resolution a/amuSensitivity bOxide c/%Double Charge d/%
Co (59)Y (89)Tl (205)Y (89)Tl (205)
required value±50.65–0.80≥20,000≥12,000≤1.5≤3.0
Note: a The required value of this parameter is a reference value, and should be adjusted according to different types of instruments in actual work. Mass resolution of 10% peak width. b The integration time is 0.1 s and the sensitivity is 1 ng/mL of the tuning fluid concentration. c CeO/Ce. d Ce2+/Ce.
Table 3. Classification standard for heavy metal pollution.
LevelPollution IndexClass of Pollution
1THQ ≤ 0.70safe
20.70 < THQ ≤ 1.00Warning limit
31.00 < THQ ≤ 2.00mild pollution
42.00 < THQ ≤ 3.00middle level pollution
5THQ ≥ 3.00heavy pollution
Table 4. Concentrations of heavy metal residues in different black fungi.
Sample CategoryElementAverage Content (mg/kg)Minimum Value
(mg/kg)
Maximum Value
(mg/kg)
Median
(mg/kg)
Limit Value
(mg/kg)
Samples of Exceeded the Standard/Total SampleExcess Ratio
(%)
Black fungusAs0.177 ± 0.1430.0070.9660.1430.53/1791.68
Pb0.315 ± 0.2330.0181.3000.2331.01/1790.59
Cd0.097 ± 0.0820.0030.5110.0820.51/1790.59
Cr1.689 ± 1.4260.0565.6021.4261.068/17937.99
Market black fungusAs0.261 ± 0.1990.0520.9660.2000.53/368.33
Pb0.340 ± 0.1980.0180.9680.2941.00/360
Cd0.079 ± 0.0470.0200.2870.0660.50/360
Cr3.187 ± 1.6970.0565.6023.4841.012/3633.33
Base black fungusAs0.146 ± 0.1040.0070.4810.1290.50/1430
Pb0.309 ± 0.2430.0301.3000.2431.01/1430.69
Cd0.102 ± 0.0710.0030.5110.0710.51/1430.69
Cr1.509 ± 1.0420.0945.3081.0421.056/14339.16
Table 5. Hazard quotient statistics of heavy metal intake through Auricularia heimuer in different populations.
PopulationElement ClassRisk Quotient
MeanModeStd. DeviationP50 *P97.5P99
JuvenileAs0.12810.00580.12290.09040.45850.5708
Pb0.03150.01230.02430.02530.09430.1140
Cd0.03380.01910.03210.02650.10780.1511
Cr0.13260.00050.13280.09190.48940.6107
THQ0.3260//0.23411.15001.4466
AdultAs0.07660.00340.07350.05400.27410.3413
Pb0.01880.00740.01450.01510.05640.0682
Cd0.02020.01140.01920.01580.06440.0903
Cr0.07940.00030.07940.05490.29260.3651
THQ0.1950//0.13990.68750.8649
* P50 is the 50th percentile, that is, the value of the variable in order of size, which is 50% of the total number of variables. The same is true for P95 and P97.
Table 6. Concentrations of heavy metal residues in different culture substrates.
Sample ClassElementAverage Content
mg/kg
Minimum Value
mg/kg
Maximum Value
mg/kg
Median
mg/kg
Limit Value
mg/kg
Detection Ratio
%
Over Standard Rate
%
MediumAs0.349 ± 0.1220.1850.4930.3170.81000
Pb0.380 ± 0.2780.0301.0530.329351000
Cd0.048 ± 0.0240.0070.0920.0480.31000
Cr2.078 ± 2.0460.4897.3521.434/100/
Waste fungus stickAs0.522 ± 0.2150.1100.8680.5400.81006.25
Pb0.669 ± 0.3430.0701.3090.711351000
Cd0.146 ± 0.1030.0520.4550.0950.31009.38
Cr1.898 ± 1.0640.5134.2521.658/100/
Saw dustAs0.122 ± 0.1420.0380.4470.0600.81000
Pb0.783 ± 0.4300.0531.5830.835351000
Cd0.079 ± 0.0570.0090.2720.0610.31000
Cr2.797 ± 2.9350.89414.7881.696/100/
Bean pulpAs0.019 ± 0.0170.0100.0190.0180.81000
Pb0.097 ± 0.1010.0160.3720.055351000
Cd0.050 ± 0.0380.0110.1200.0370.31000
Cr0.504 ± 0.3450.1331.3290.338/100/
Rice chaffAs0.736 ± 0.1060.6470.9050.6840.810020
Pb0.705 ± 0.3600.0051.5150.820351000
Cd0.037 ± 0.0260.0110.0950.0310.31000
Cr3.265 ± 1.9010.5827.0842.486/100/
Wheat branAs0.118 ± 0.1730.0160.4250.0590.81000
Pb0.632 ± 0.6130.0082.2210.608351000
Cd0.064 ± 0.0650.0100.2170.0470.31000
Cr2.831 ± 5.4530.34420.6200.692/100/
Corn mealAs////0.8100/
Pb0.084 ± 0.0490.0440.1760.058351000
Cd0.010 ± 0.0060.0020.0180.0090.31000
Cr0.740 ± 0.3750.4101.4430.554/100/
LimeAs9.810 ± 7.6151.94121.2156.891/100/
Pb2.606 ± 2.5470.0889.3442.014/100/
Cd0.151 ± 0.2280.0011.0560.072/100/
Cr17.709 ± 42.4771.574197.7205.659/100/
GypsumAs1.318 ± 1.2000.3093.2951.024/100/
Pb1.071 ± 1.8770.0604.1720.498/100/
Cd0.155 ± 0.2090.0010.7150.061/100/
Cr2.573 ± 1.0881.1475.0402.373/100/
Irrigation waterAs0.001///0.012.940
PbNo detected///0.0100
CdNo detected///0.00500
Cr0.001///0.052.940
Disclaimer/Publisher’s Note: The statements, opinions and data contained in all publications are solely those of the individual author(s) and contributor(s) and not of MDPI and/or the editor(s). MDPI and/or the editor(s) disclaim responsibility for any injury to people or property resulting from any ideas, methods, instructions or products referred to in the content.

