Article

A New Car-Body Structure Design for High-Speed EMUs Based on the Topology Optimization Method

1
State Key Laboratory of Rail Transit Vehicle System, Southwest Jiaotong University, Chengdu 610031, China
2
CRRC Changchun Railway Vehicles Co., Ltd., Changchun 130062, China
3
School of Mechanical Engineering, Southwest Jiaotong University, Chengdu 610031, China
*
Author to whom correspondence should be addressed.
Appl. Sci. 2024, 14(3), 1074; https://doi.org/10.3390/app14031074
Submission received: 11 December 2023 / Revised: 15 January 2024 / Accepted: 17 January 2024 / Published: 26 January 2024
(This article belongs to the Collection Analysis of Dynamics of Railway Vehicles)

Abstract

:
In recent years, the research and development of high-speed trains has advanced rapidly. The main development trends of high-speed trains are higher speeds, lower energy consumption, higher safety, and better environmental protection. The realization of a lightweight high-speed car body is one of the key features in the development trend of high-speed trains. Firstly, the basic dimensions of the car body’s geometric model are determined according to the external dimensions of the body of a CRH EMU, and the specific topology optimization design domain is selected to establish the finite element analysis model; secondly, the strength and modal analyses of the topology optimization design domain are carried out to check the accuracy of the design domain and provide a comparative analysis for subsequent design. Then, the variables, constraints, and objective functions of the topology optimization design are determined to establish the mathematical model of topology optimization, and the design domain is calculated for topology optimization under single and multiple conditions, respectively. Finally, based on the topology optimization calculation results, truss-type reconstruction modeling is carried out for the car body’s side walls, roof, underframe, end walls, and other parts. Compared with the conventional EMU body structure, the weight of the reconstructed body structure is reduced by about 18%. The results of the finite element analysis of the reconstructed car-body structure prove the reliability and safety of the structure, indicating that the reconstructed car-body scheme meets the corresponding performance indicators.

1. Introduction

In recent years, the research and development of high-speed trains has advanced rapidly. The main development trends of high-speed trains are higher speeds, lower energy consumption, higher safety, and better environmental protection. The realization of a lightweight high-speed car body is one of the key features in the development trend of high-speed trains. When a train has higher-speed operation, the car-body structure needs to bear many complex combined load conditions. The bearing structure of the body of electric multiple units (EMUs) is usually welded in a cylinder shape. In order to further reduce the air resistance, the contour of the head and the external frame of the train are streamlined [1].
In the design of high-speed trains’ car-body structures, various factors should be integrated and coordinated to improve the performance of the body. As a large vehicle, the safety of the body structure of a high-speed train EMU has always been an important subject in the design of high-speed trains’ car bodies [2,3,4]. As a complex mechanical structure, the EMU’s body structure should be considered in the design of strength, mode, and other performance indicators because of its various structural forms and changeable load conditions. For the next generation of high-speed EMUs’ body structure design, the traditional CAE/CAD design and analysis process has some shortcomings, such as high R&D costs, long time cycles, and insufficient optimization analysis. With the continuous development of optimization technology, structural optimization design gradually tends to combine multiple disciplines and objectives, which can significantly shorten the optimization design cycle, improve the reliability of the vehicle structure and the degree of optimization analysis, and make full use of materials.
In order to obtain a car-body structure that can meet many design requirements at the same time, extensive research has been carried out in the field of structure optimization. Harte et al. [5] divided the light rail body structure into different subregions based on the calculation and analysis results and then optimized the calculation and analysis of each subregion through size optimization. Chiandussi et al. [6] took the automobile chassis as the research object and realized the light weight of the automobile chassis through topology optimization design, and the dynamic performance of the chassis was also significantly improved. Chen et al. [7] took the train underframe as the main research object, analyzed the results of a material analysis for topological optimization under different loads, determined the optimal distribution position of the inner ribs of the underframe, and obtained the optimal shape of the underframe section. Zhang et al. [8] analyzed the design scheme of the whole vehicle structure of a tracked vehicle, determined the location of the maximum stress and strain point through static analysis results, used Optistruct to optimize its topology, and analyzed the stiffness and strength of the optimization results. Based on a certain type of China Railway High-Speed (CRH) EMU, Ji [9] performed a sectional analysis and comparison of the existing car-body sections; optimized the car-body model in the transverse, longitudinal, and transverse directions with Optistruct; reconstructed the car-body model according to the optimization results; and compared and analyzed the static changes in the car body before and after optimization. Zhang et al. [10,11] established a parameter model for high-speed trains and compared the aerodynamic performance of the front-end model before and after optimization with a crosswind, proving that optimization analysis can effectively improve the anti-crosswind performance of the front end. Many scholars have combined multidisciplinary optimization techniques with vehicle structure optimization to achieve lightweight structures and further improve the performance in terms of vehicle strength [12,13,14], vibration [15,16,17], collision [18,19,20], and other aspects.
To summarize, the existing studies mainly focus on the optimization of the section and local structure of the car body, while research on the topology optimization of the whole vehicle is scarce, which limits the design of the car body. At present, there is an urgent need to carry out the research and development of the next-generation high-speed EMU body. As the main research and design method, structural optimization technology has been highly valued by researchers at home and abroad. Due to its significant challenges, topology optimization technology has been a major focus of research. The purpose and objectives of this study include an investigation of the shortcomings of existing research, aiming to optimize the topology of the whole structure of the car body. Through a simulation analysis platform, the topology optimization design of the car-body structure design domain based on the CRH profile data is carried out. With the aim of developing the structural form of the next-generation high-speed EMU body, a comprehensive and detailed optimization design study is carried out, and the material distribution results of each part of the body are obtained. Based on these results, the main bearing truss structure of each part is established, which provides a certain reference for the research and development of the body structure of the next generation of high-speed EMUs.

2. Topology Optimization Method of Car-Body Structure

2.1. Homogenization Method

In 1978, Benssousan [21] put forward the theoretical basis of the homogenization method to study the relationship between the macroscopic characteristics and microstructures of composite materials. This method can correlate variables of different scales and thus transform macroscopic problems into microscopic ones, such as replacing periodic microscopic structures with single cells, which has been widely used in engineering practice for decades [22]. Guedes and other scholars combined the homogenization method and the finite element method to establish a finite element equation based on the progressive homogenization method, serving to simplify the solution process and expand the solvable range and the complexity of the solution [23]. At the same time, as a calculation method for periodic composite materials, the homogenization method can improve the analysis efficiency, reduce the workload, and significantly shorten the calculation time under the premise of known material properties.

2.2. Variable-Density Method

The variable-density method was developed from the homogenization method, which deals with the intermediate density. It is one of the mainstream topology optimization methods based on finite elements. The optimization criteria adopted by the variable density method have the characteristics of a fast convergence speed, few iterations, and small computation, which is the focus of current structural topology optimization methods. Unlike the homogenization method, the variable-density method mainly uses material description for topology optimization. Upon introducing a reverie material, the material density is between 0 and 1, where 0 represents the hollowed-out state, 1 represents the solid state, and a density between 0 and 1 represents the point between the hollowed-out and solid states. The material’s physical characteristics and the element’s relative density depend on the interpolation function. Considering the relative density of each unit as a design variable, the number of design variables can be significantly reduced, and the computation is also reduced accordingly.
The design domain of the variable-density method is discretized into a finite element set defined by the element set N X = 1 , 2 , , N X in the x-direction and the element set N Y = 1 , 2 , , N Y in the y-direction. The element density is taken as the design variable:
( 0 ρ ( x , y ) 1 , ( x , y ) N X × N Y )
According to the optimality criterion, the element stiffness is effectively controlled. Then, the overall stiffness of the structure can be reasonably regulated, and the materials can be redistributed within the design domain. Thus, the topology optimization structure with the optimum structural stiffness and material distribution can be obtained [24].
E = ρ e E 0
E = ρ e 1 + q ( 1 ρ e ) E 0
Solid isotropic material with penalization (SIMP) is a commonly used density–stiffness interpolation model, a common technique in topology optimization problems. The model assumes that the material density is constant within the cell and takes it as a design variable. In order to simplify the calculation and improve the efficiency, the material properties are simulated by the exponential function of the cell density. The SIMP method introduces relative density ρ e and penalty factor P. When 0 ρ e 1 , the element density is limited by penalty factor P, so the structural elements’ density is as close as possible to 0 or 1. If the element density is 0, the material can be deleted; if the element density is 1, the material should be filled. For the SIMP interpolation model, the larger the penalty factor is, the better it is. When the penalty factor takes different values, the penalty effect is also different. The element density can be expressed as follows.
φ ( x i ) = x i P , x i x min , 1 , i = 1 , 2 , 3 , x n
The relation between element density and elastic modulus is
E ( x i ) = E min + φ ( x i ) ( E E min ) , i = 1 , 2 , 3 , n
where E ( x i ) is the elastic modulus of the element, E min is the elastic modulus of the low-strength material element, and x i represents the relative density of each element. To ensure the stability of numerical calculation, usually, E min = E / 1000 and 0 < E min E ( x i ) E . The general optimization mathematical model of structural topology optimization can be formulated as follows.
Minimize : f ( X ) = f ( x 1 , x 2 , , x n ) Subjectto : g j ( X ) 0 j = 1 , 2 , 3 , , m
where n represents the number of design variables, X is the optimization design variable, f ( X ) is the optimization objective function, g ( X ) represents the design response requiring constraints, and j is the number of constraint equations.

2.3. Progressive Structural Optimization Method

The progressive structural optimization method was first put forward by Xie and Steven [25]. This method involves gradually removing inefficient or ineffective materials from the initial design space so that the final topology optimization result achieved is optimal. In other words, as the iteration progresses, some of the design variables change from 1 to 0.

2.4. Topology Optimization Process of Car-Body Structure

Based on the above optimization methods, the topology optimization process of the new-type car-body structure for EMUs is shown in Figure 1.

3. Selection of Topology Optimization Design Domain and Model Establishment

3.1. Selection of Topology Optimization Design Domain

The topology optimization design domain refers to the design space where the car-body structure can be optimized. A reasonable design domain can ensure the rationality and adaptivity of the topology optimization results, which is a crucial prerequisite for topology optimization calculation. In this paper, the topology optimization design domain is determined according to the outer contour size of the CRH vehicle car-body model, and the structure model is established. The car-body structure dimensions of a CRH vehicle are given in Table 1, including the body length, fixed distance, width, height, and other basic contour dimensions of the car-body structure.
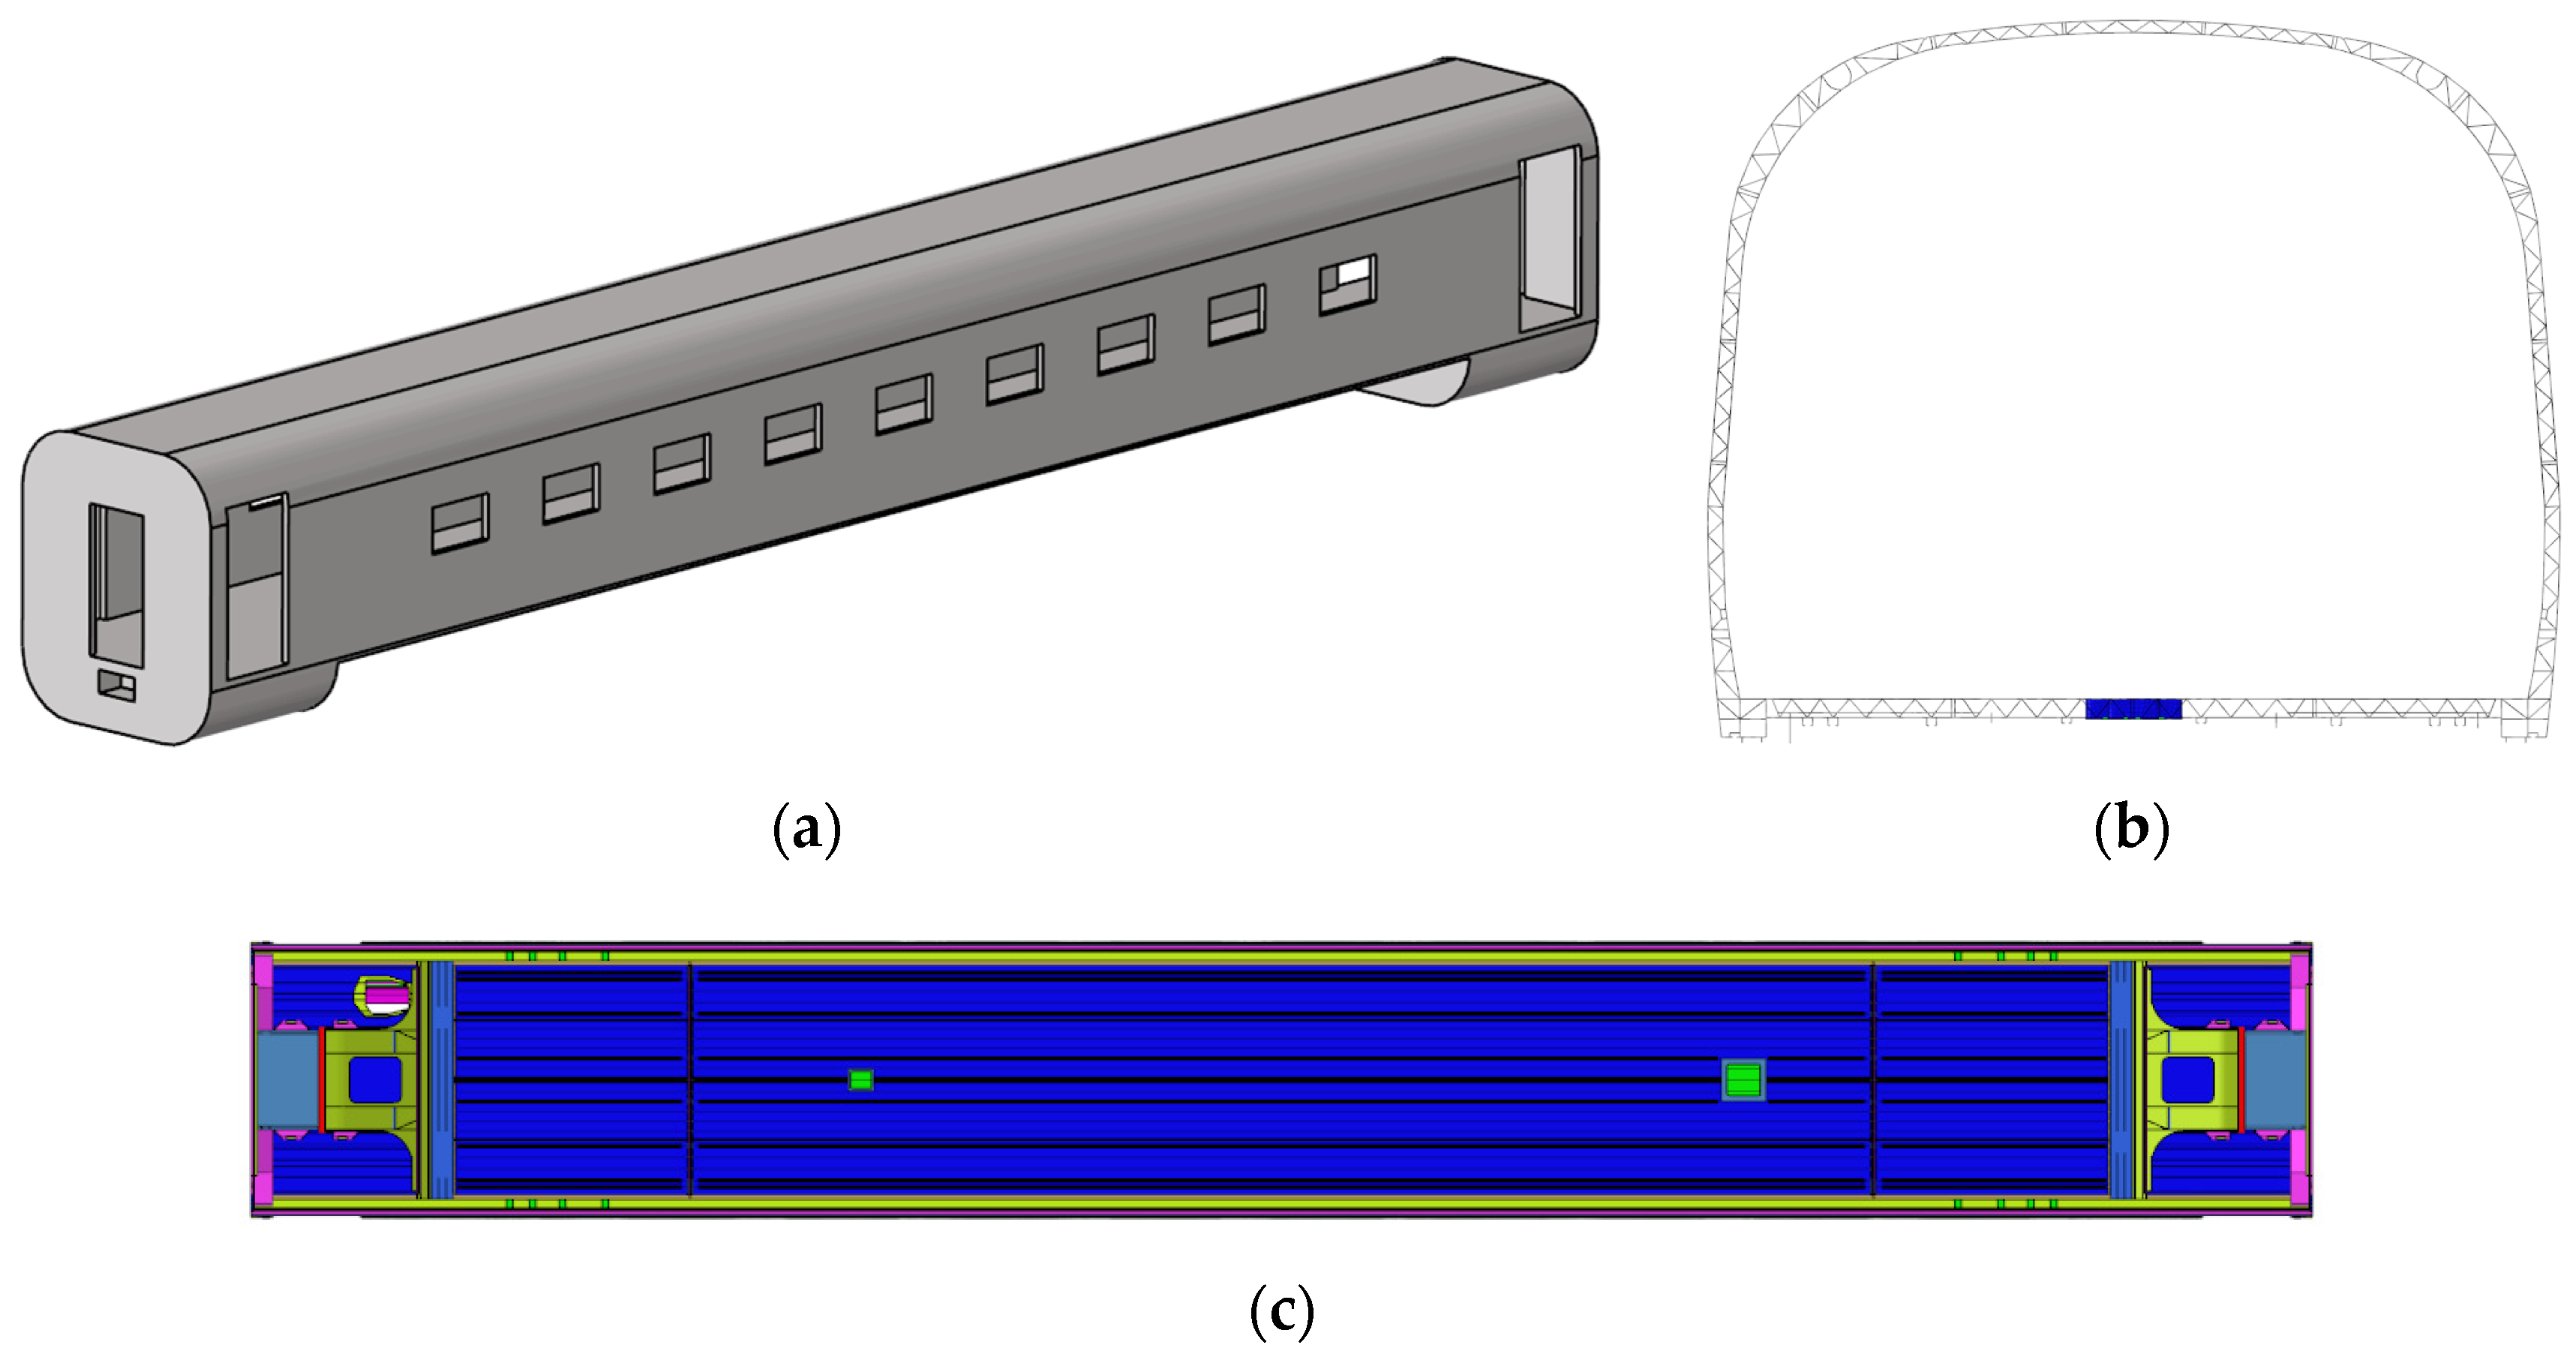
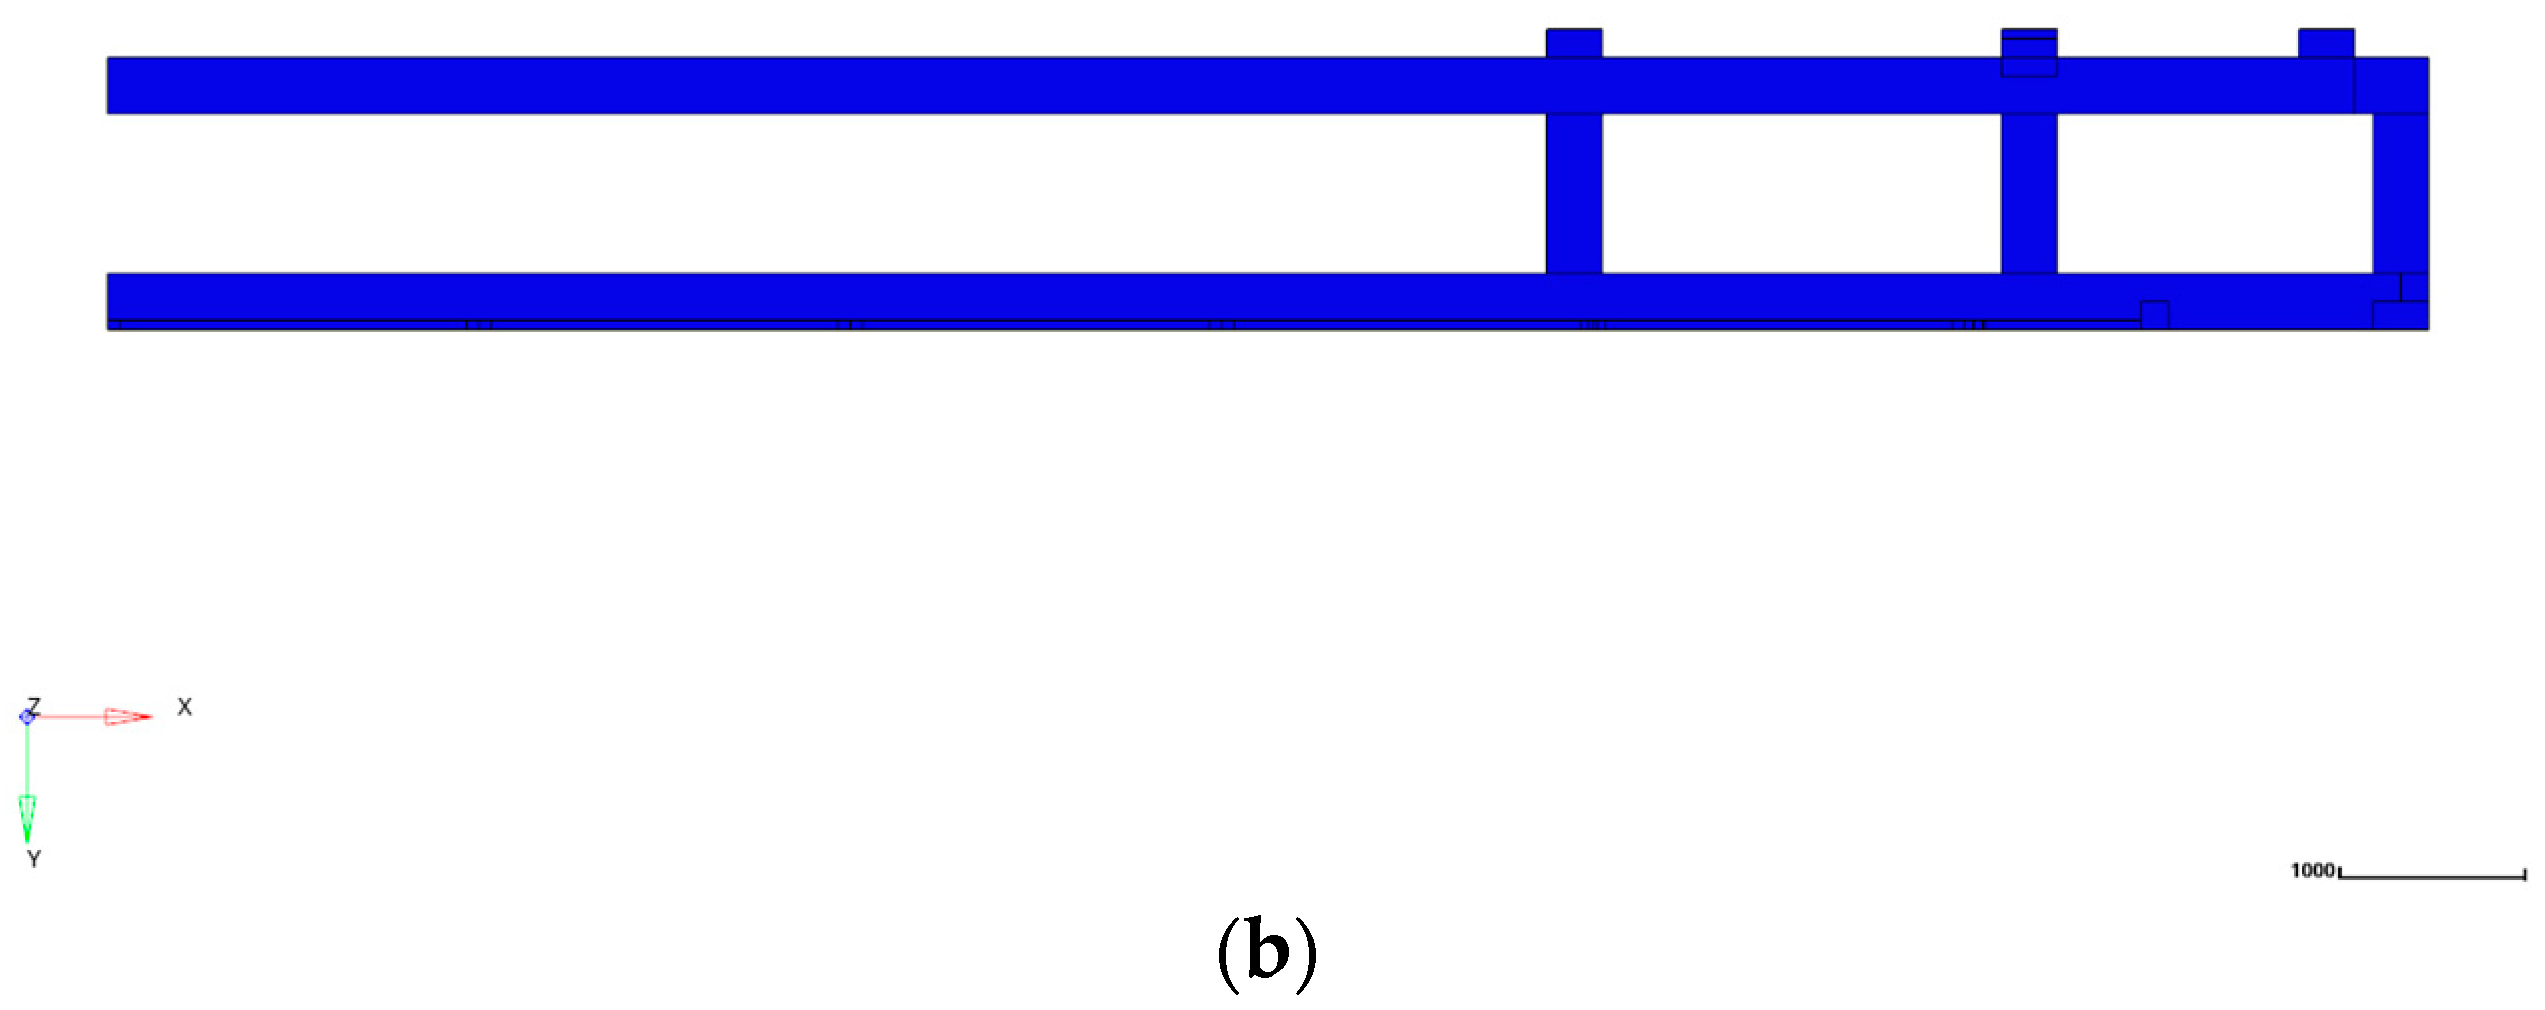
Firstly, the initial topology optimization model is analyzed based on the existing car-body structure, and some structures suitable for topology optimization analysis (mainly considering the conventional extruded profile structure) are selected. Secondly, the selected parts of the car-body structure are classified, dividing it into the end wall, end, bottom frame, side wall, upper beam, and roof structure. Finally, it is necessary to facilitate the welding and manufacturing of the car-body structure and quickly match it with the vehicles already operating. Therefore, some of the necessary structural positions should be set aside, such as the coupler seat, car window, car door, etc. Based on the above analysis, the car-body structure model required for the initial topology optimization can be established. The geometric model of the car-body structure is shown in Figure 2.

3.2. Establishment of Topology Optimization Design Domain Model

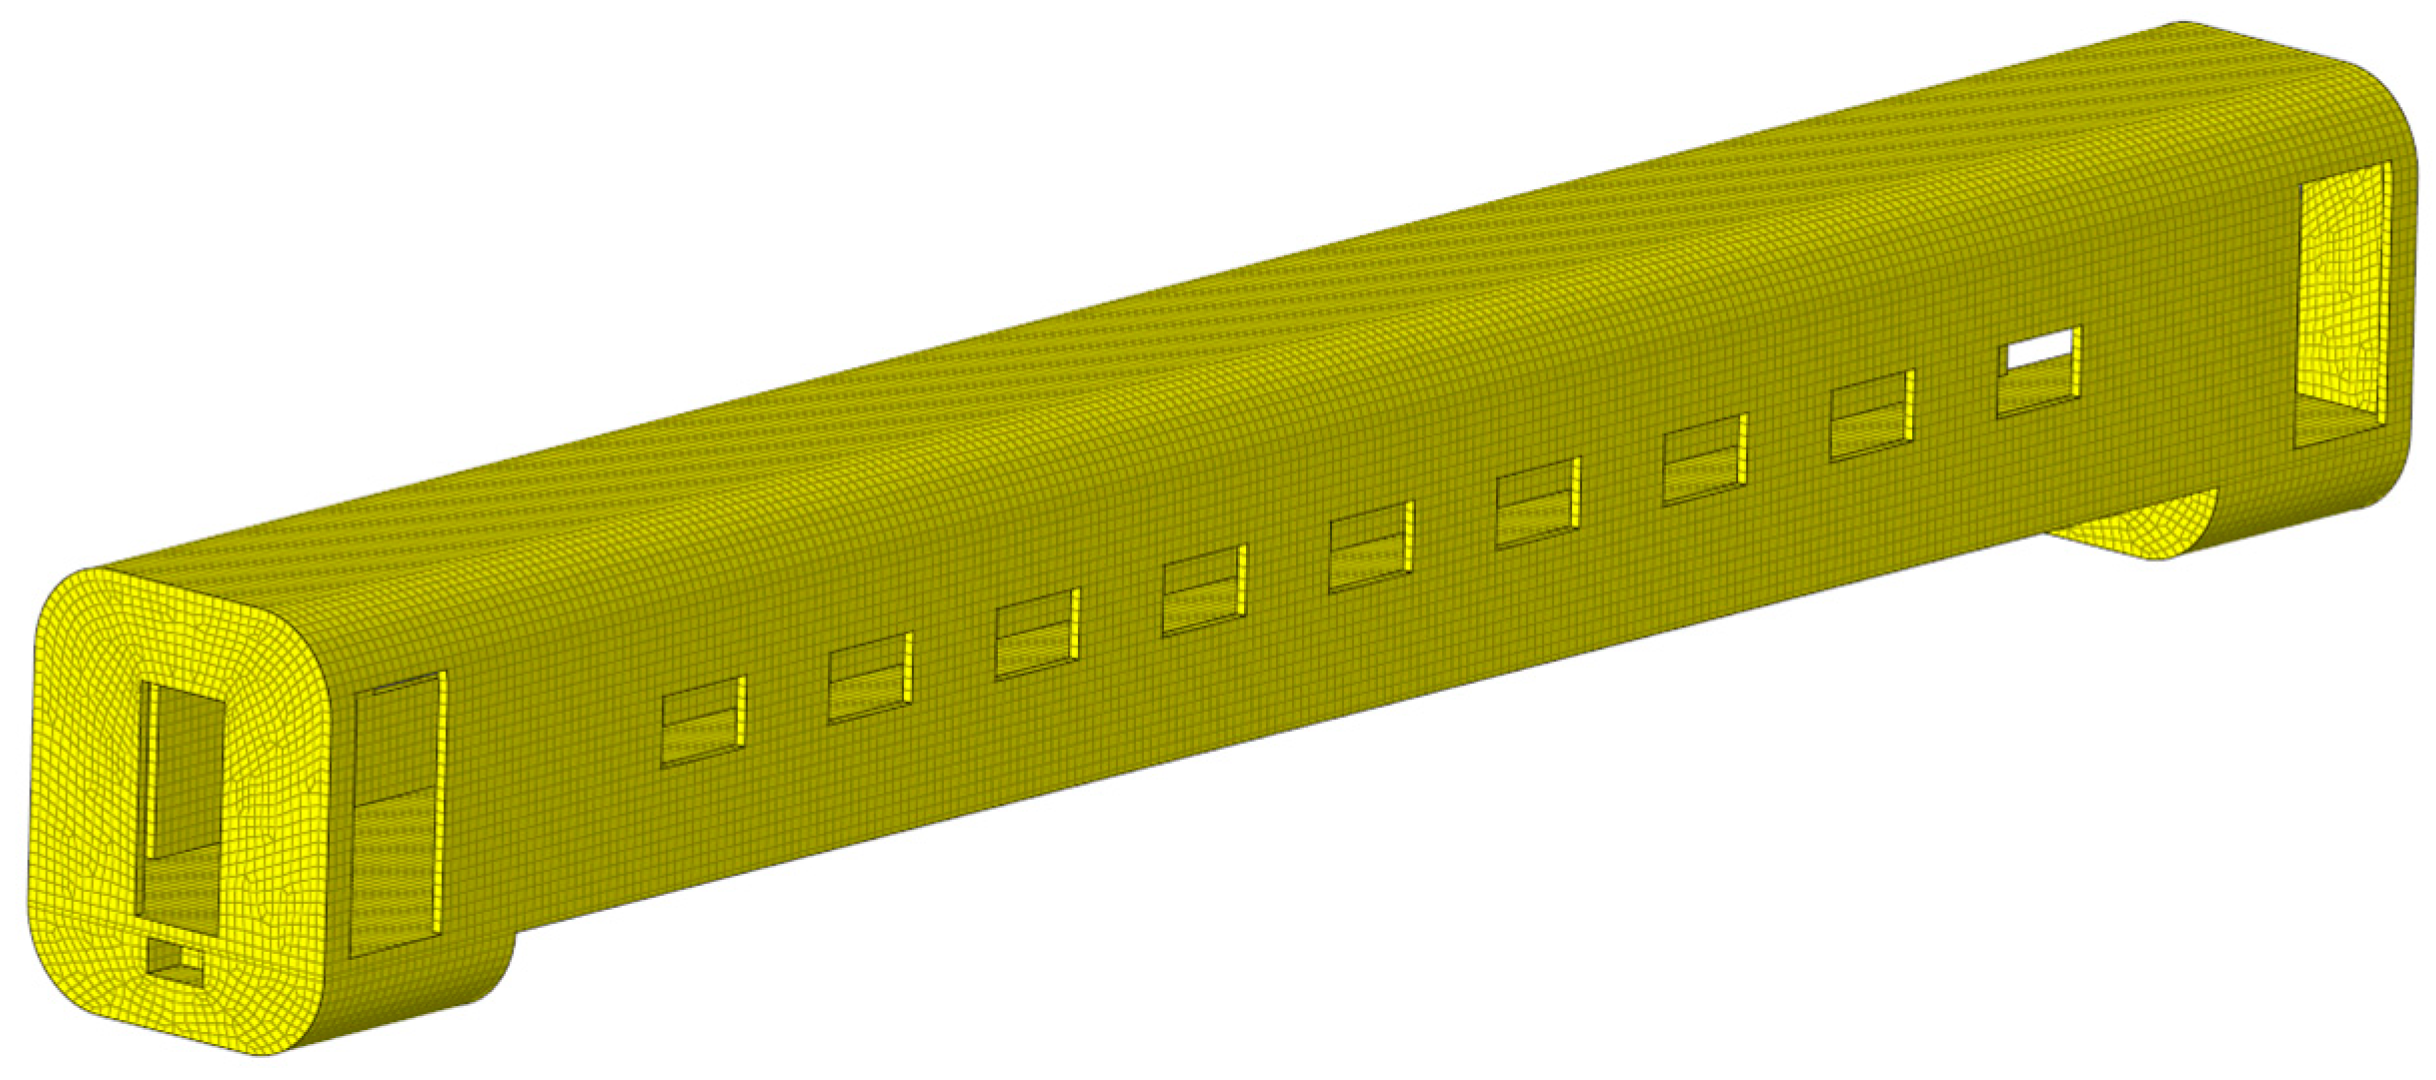
Since the topology optimization model is relatively simple and has few sharp corners or chamfering, the element size of the topology optimization design domain of the vehicle body is 50 mm with an eight-node hexahedral mesh [26]. The number of grid elements is determined by both the car-body structure parameters, as shown in Table 1, and the recommended mesh sizes in the topology optimization model, and the model has 390,620 meshes and 475,326 nodes after mesh division. Figure 3 shows the finite element model of the car-body structure. The selected material is aluminum 6005-T6, commonly used in the production of car-body structures. Its mechanical properties are as follows: the elastic modulus is 6.9 × 10⁴ MPa, the density is 2.7 × 10³ kg/m3, and Poisson’s ratio is 0.33. The working conditions and boundary conditions are shown in Table 2.

3.3. Results of Static Analysis

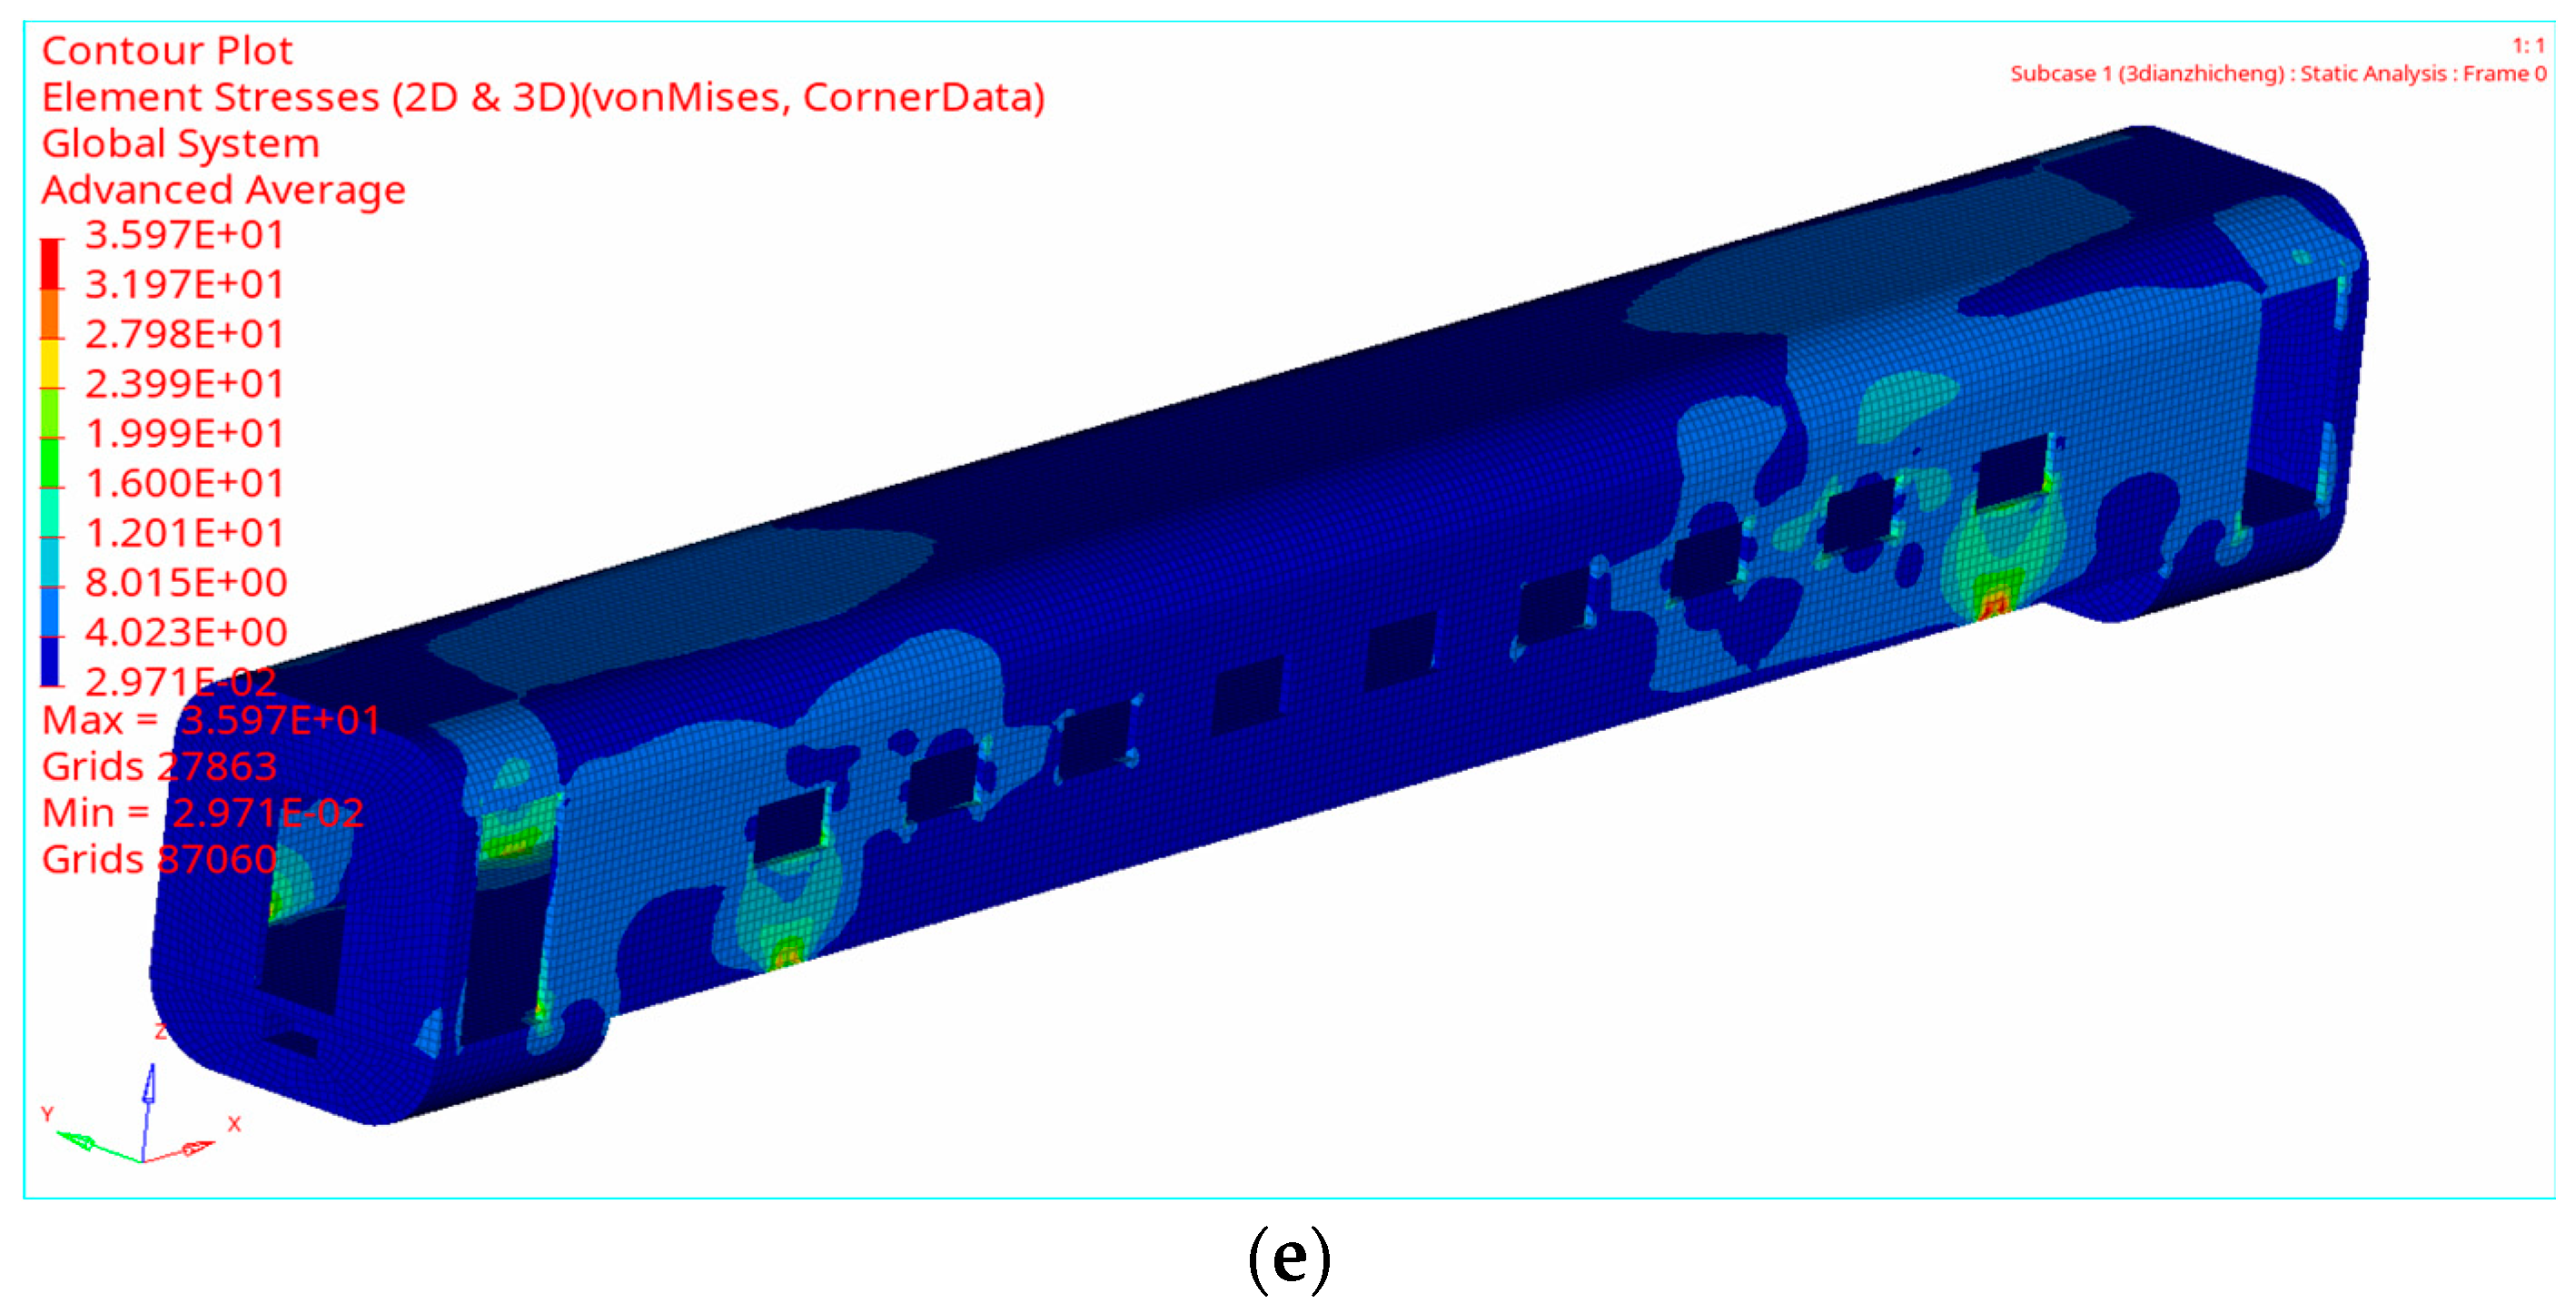
The design domain’s static strength and natural vibration mode are preliminarily analyzed. This can better control the variable parameters of optimization, reduce the scope of constraints, and improve the spatial scope of the design domain. Theoretically, this can also make the structure optimization process more detailed, with better optimization results; secondly, it can also reduce the number of iterations and shorten the computation time. The results are shown in Figure 4 and Table 3.
It can be seen from the calculation results that the maximum Von Mises stress in the design domain is 86.8 Mpa, which is far less than the allowable stress of the material and has ample space for optimization, and the design domain space is reasonable.

3.4. Results of Modal Analysis

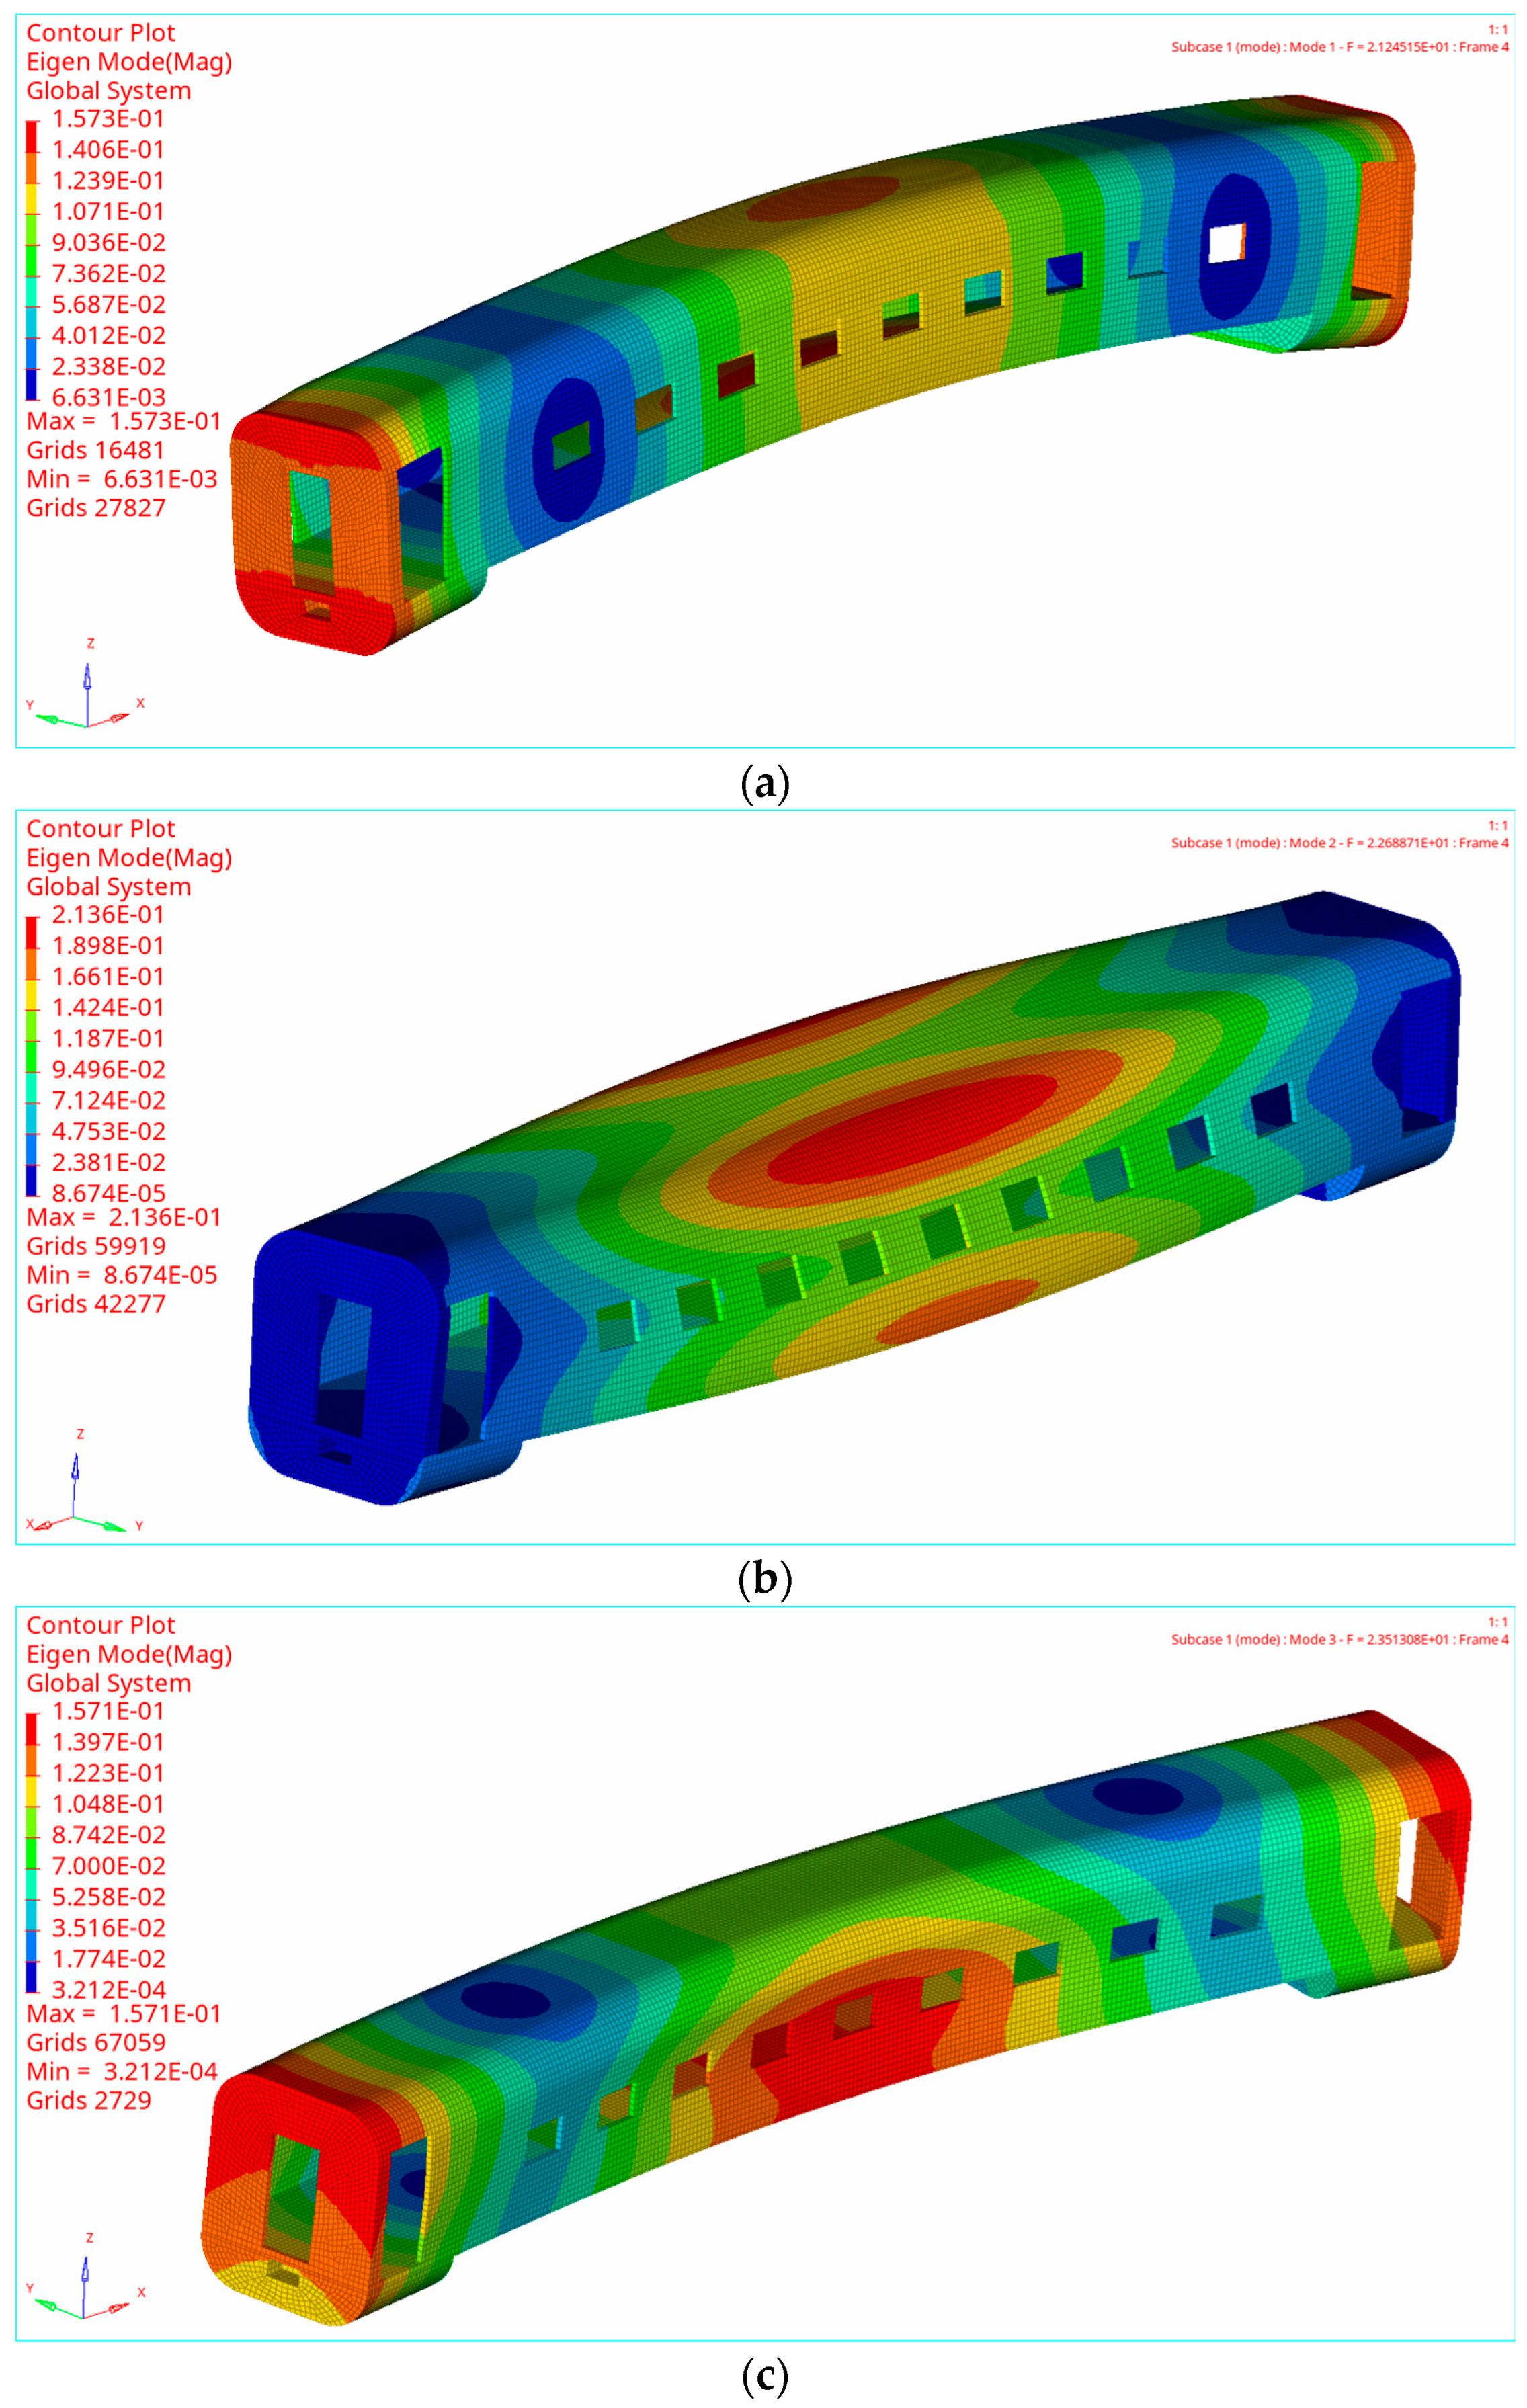
In the general simulation analysis, the mass equipment is applied to the center of gravity by concentrating the mass points, and the rest of the mass of the equipment is loaded by uniformly distributing the mass points. Both structural and reconditioning modes are free vibration modes without any constraint. In the conceptual stage of car-body design, the influence of the equipment quality on the car-body mode should be considered in the topology optimization analysis and calculation. Table 4 and Figure 5 show the magnitude of the vibration frequency and corresponding mode shapes.

4. Topology Optimization of Car-Body Structure

4.1. Topology Optimization Design

Before performing topology optimization, the mathematical model of topology optimization should be established. The design variables, constraints, and objective functions of topology optimization should be determined.
(1) Design variables
In order to ensure that the computer can complete the optimization calculation task and obtain the ideal optimization result, reasonable and appropriate design variables are indispensable. The more design variables, the more detailed the optimization results and the more in-depth the optimization degree, but too many design variables will also cause an increase in computing time. Therefore, when selecting design variables, the design variables should be reduced as much as possible to ensure the complete representation of the requirements. Based on the above principles, this paper takes the whole vehicle as a design variable with a minimum member size of 150 mm and a maximum member size of 400 mm.
(2) Constraints
Constraints are necessary to control the direction of the result generation in the optimization calculation. The constraint conditions can be divided into two types: size constraints and behavior constraints. Size constraints are mainly geometric restrictions on the design variables, while behavior constraints are used to characterize the state of the reaction structure, such as the frequency and intensity.
(1) Yield constraints
The yield strength is used as the constraint condition. The allowable yield utilization factor λ perm is defined, and the finite elements meet the yield criteria as follows.
λ y λ perm
where λ y is the yield utilization factor, λ y = 0.78 σ vm / 235 , and σ vm is the Von Mises stress.
(2) Volume fraction constraints
Different volume fractions are used as response constraints to explore the influence of different volume fraction constraints on the optimization results and determine the value range of volume fractions.
This paper discusses only the constraints on the yield strength and first-order deformation frequency. The yield strength constraint limit is 215 MPa, the first-order deformation frequency constraint limit is 10 Hz, and the second-order deformation frequency constraint limit is 12 Hz.
(3) Objective function
This paper is a topological optimization solution analysis of the car-body structure, aiming to obtain the minimum material surplus in the design space to meet the design requirements. The optimization design should take the minimum volume of the residual material as the objective function. The formula for the volume as the objective function is as follows.
V = i = 1 n ρ i j V i 0
where ρ i j represents the unit material density of the micro-element, and V i 0 is the initial volume of the ith element.
For the car-body model in the initial state, the density of all unit materials is 1. After iterative calculation, if the unit material density is still 1, the unit material is more important for the car-body structure, and the unit is preserved. Meanwhile, when the unit material density is 0 after the iterative calculation is completed, the unit material is not important to the car-body structure, and the unit is deleted. Table 5 shows the specific topology optimization parameter settings.

4.2. Topology Optimization Results

The force flow transfer path of the vehicle body is different under different loads, which leads to different topology optimization results under different loads. Based on different load conditions, this section describes the topology optimization analysis of single and multiple load conditions, respectively, to obtain the new main bearing structure of the vehicle body, satisfying multiple load conditions simultaneously.
(1) Topology optimization results of single working condition
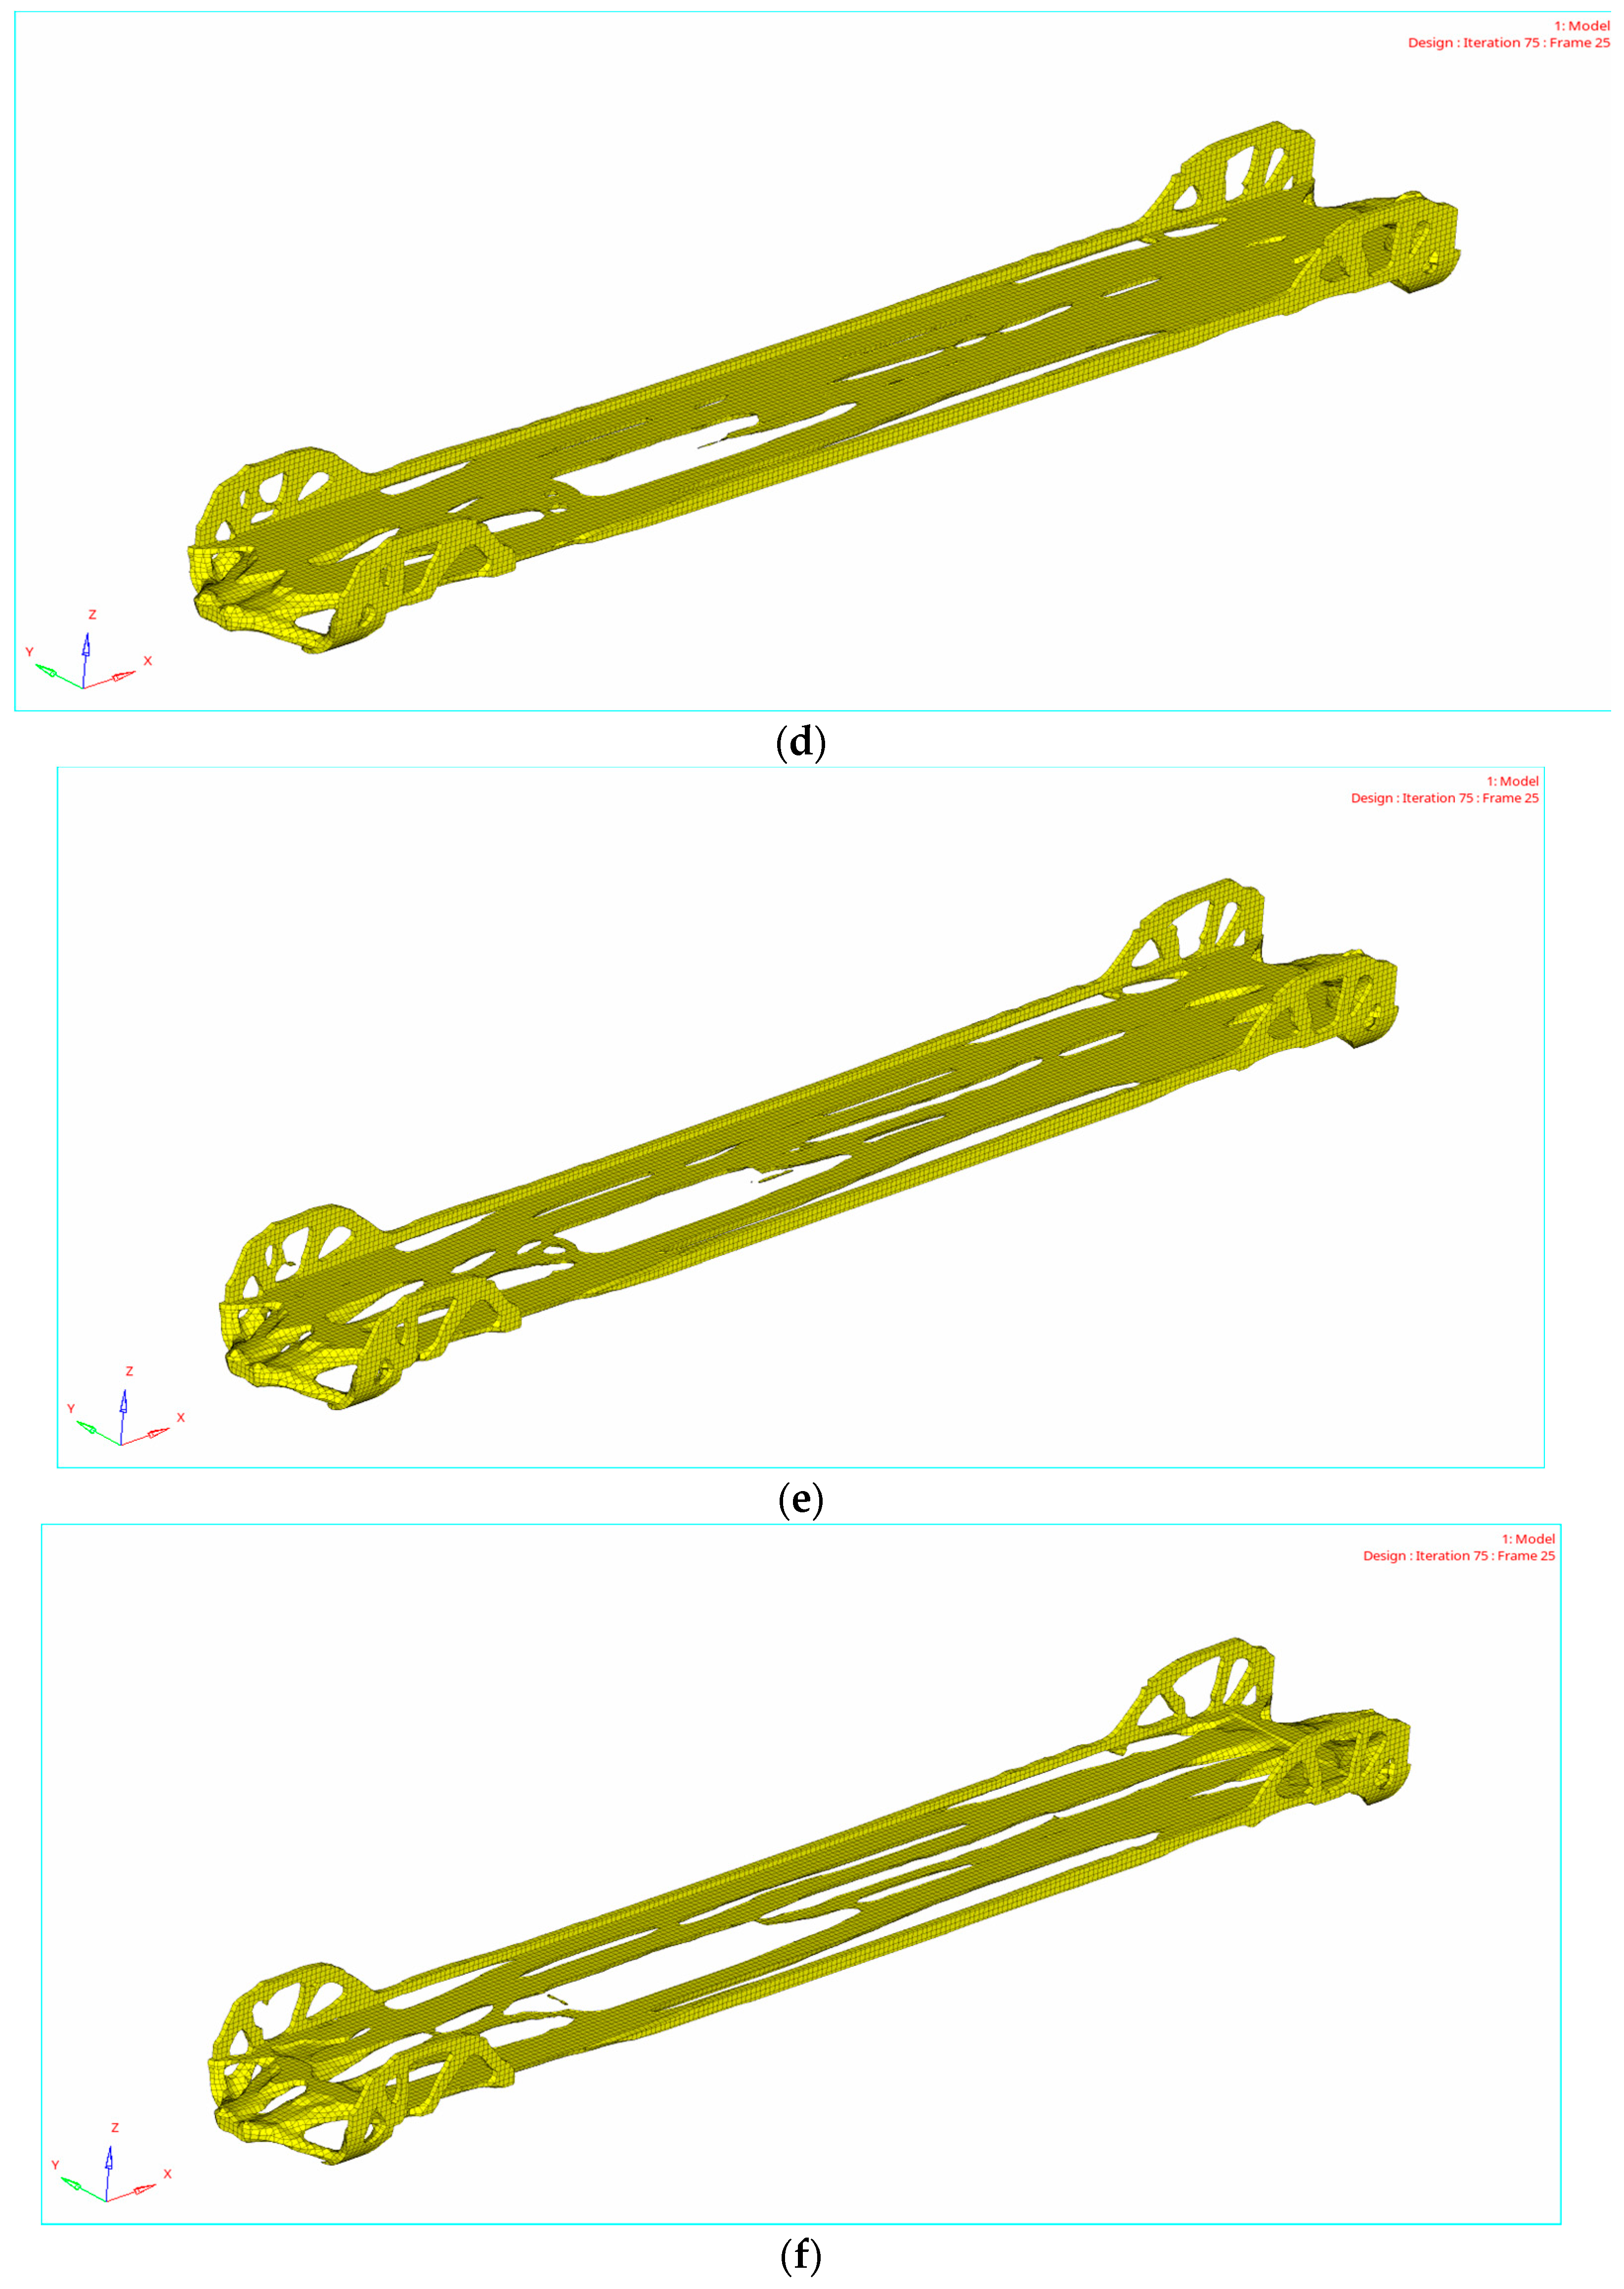
After 75 iterations of analysis and calculation, the topology optimization calculation for the longitudinal load condition is terminated. Figure 6 lists the topological density cloud images with different thresholds.
After 106 iterations of analysis and calculation, topology optimization calculation for vertical load conditions is terminated. Figure 7 lists the topological density cloud images with different thresholds.
After 139 iterations of analysis and calculation, topology optimization calculation for torsional load conditions is terminated. Figure 8 lists the topological density cloud images with different thresholds.
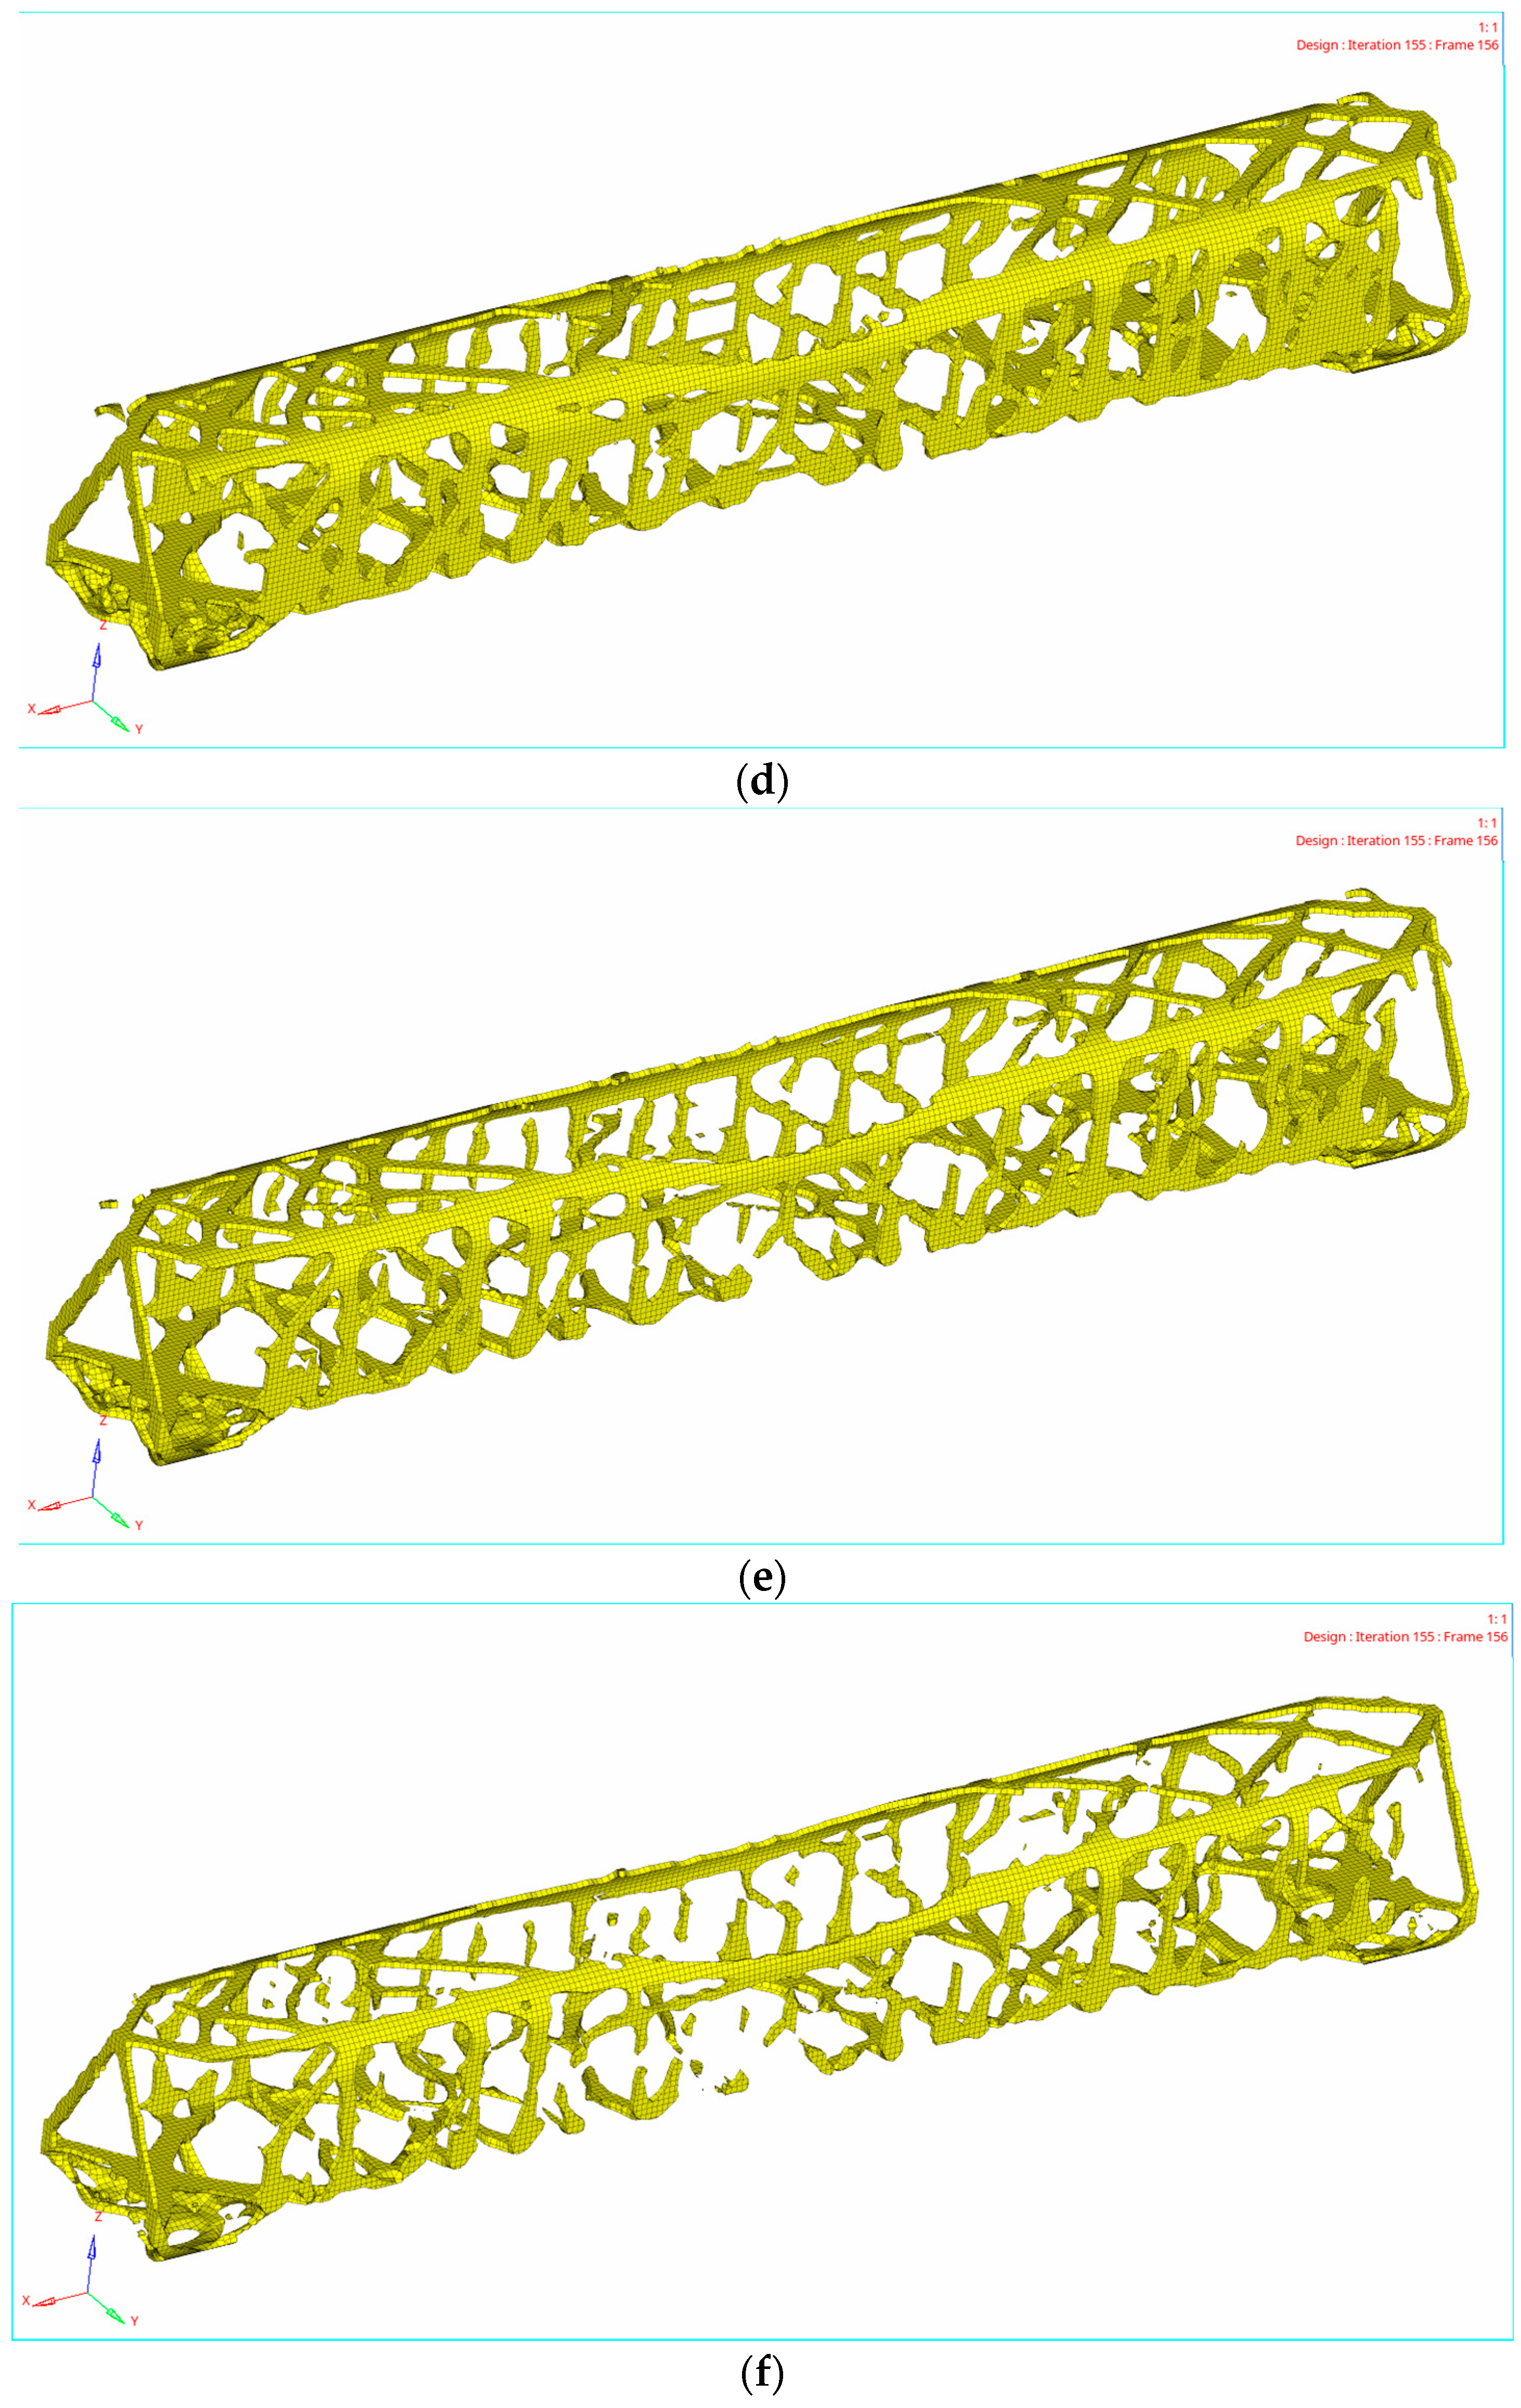
After 155 iterations of analysis and calculation, the topology optimization calculation of crosswind load conditions is terminated. Figure 9 lists the topological density cloud maps with different thresholds.
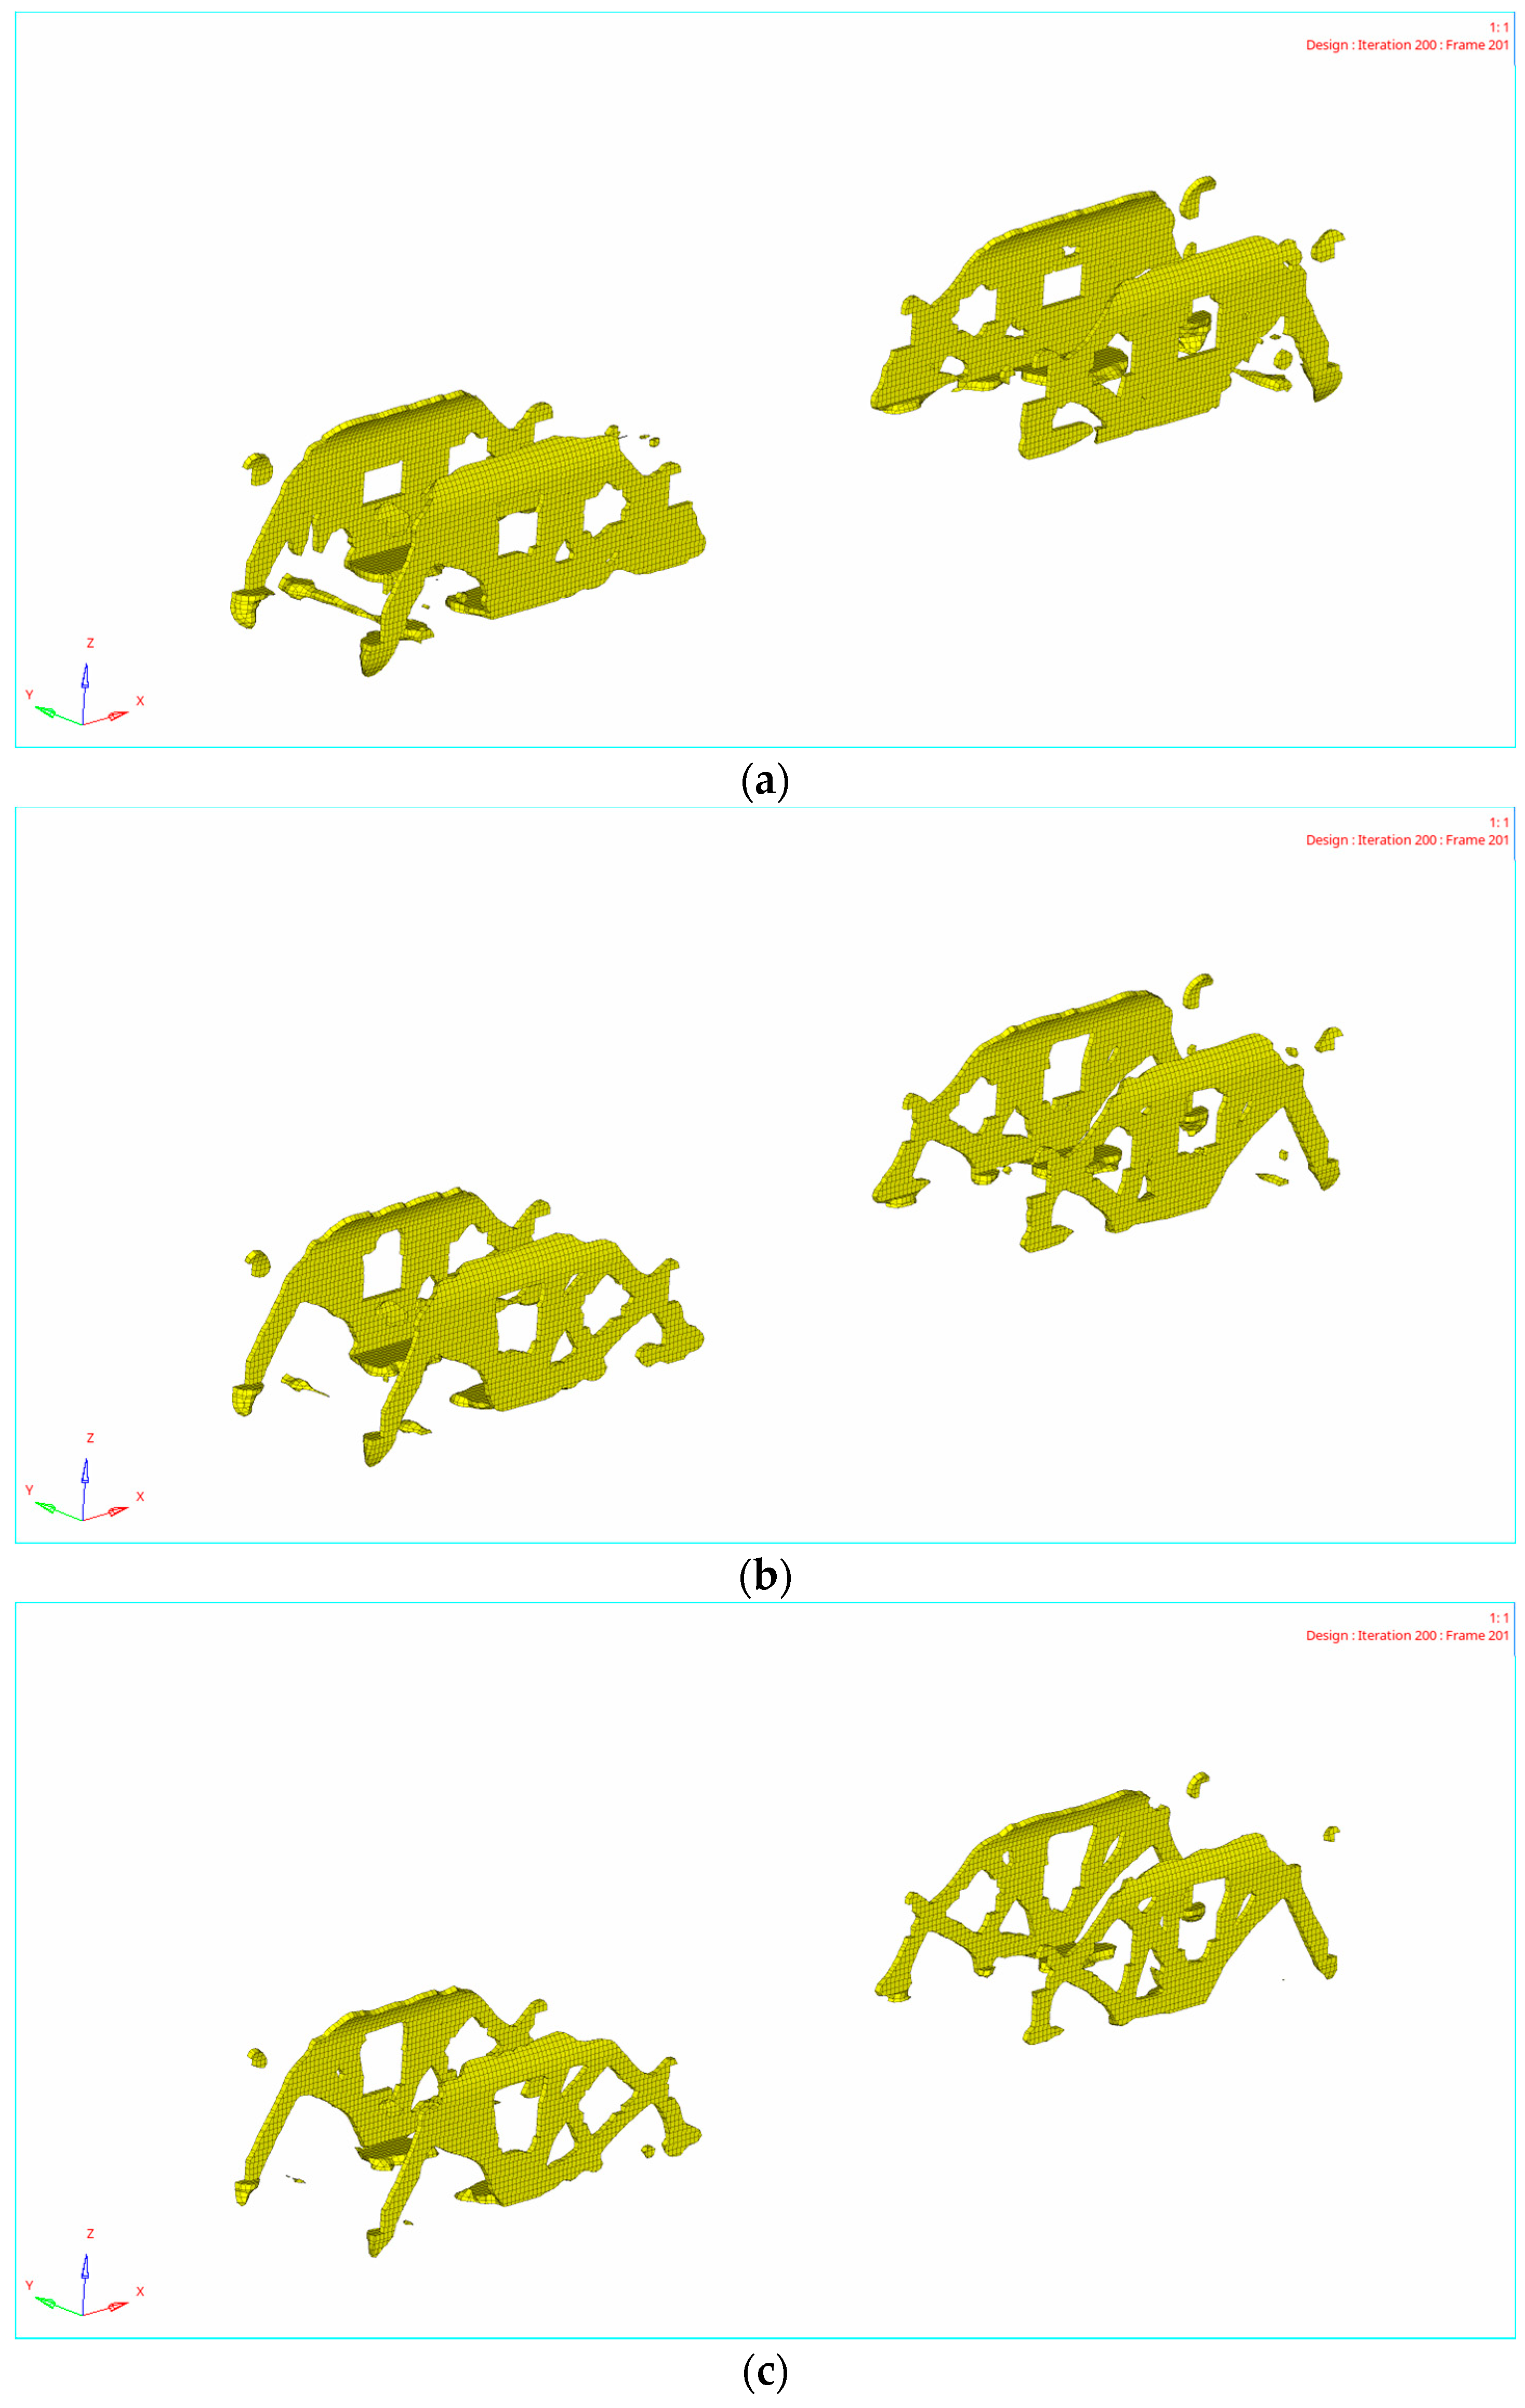
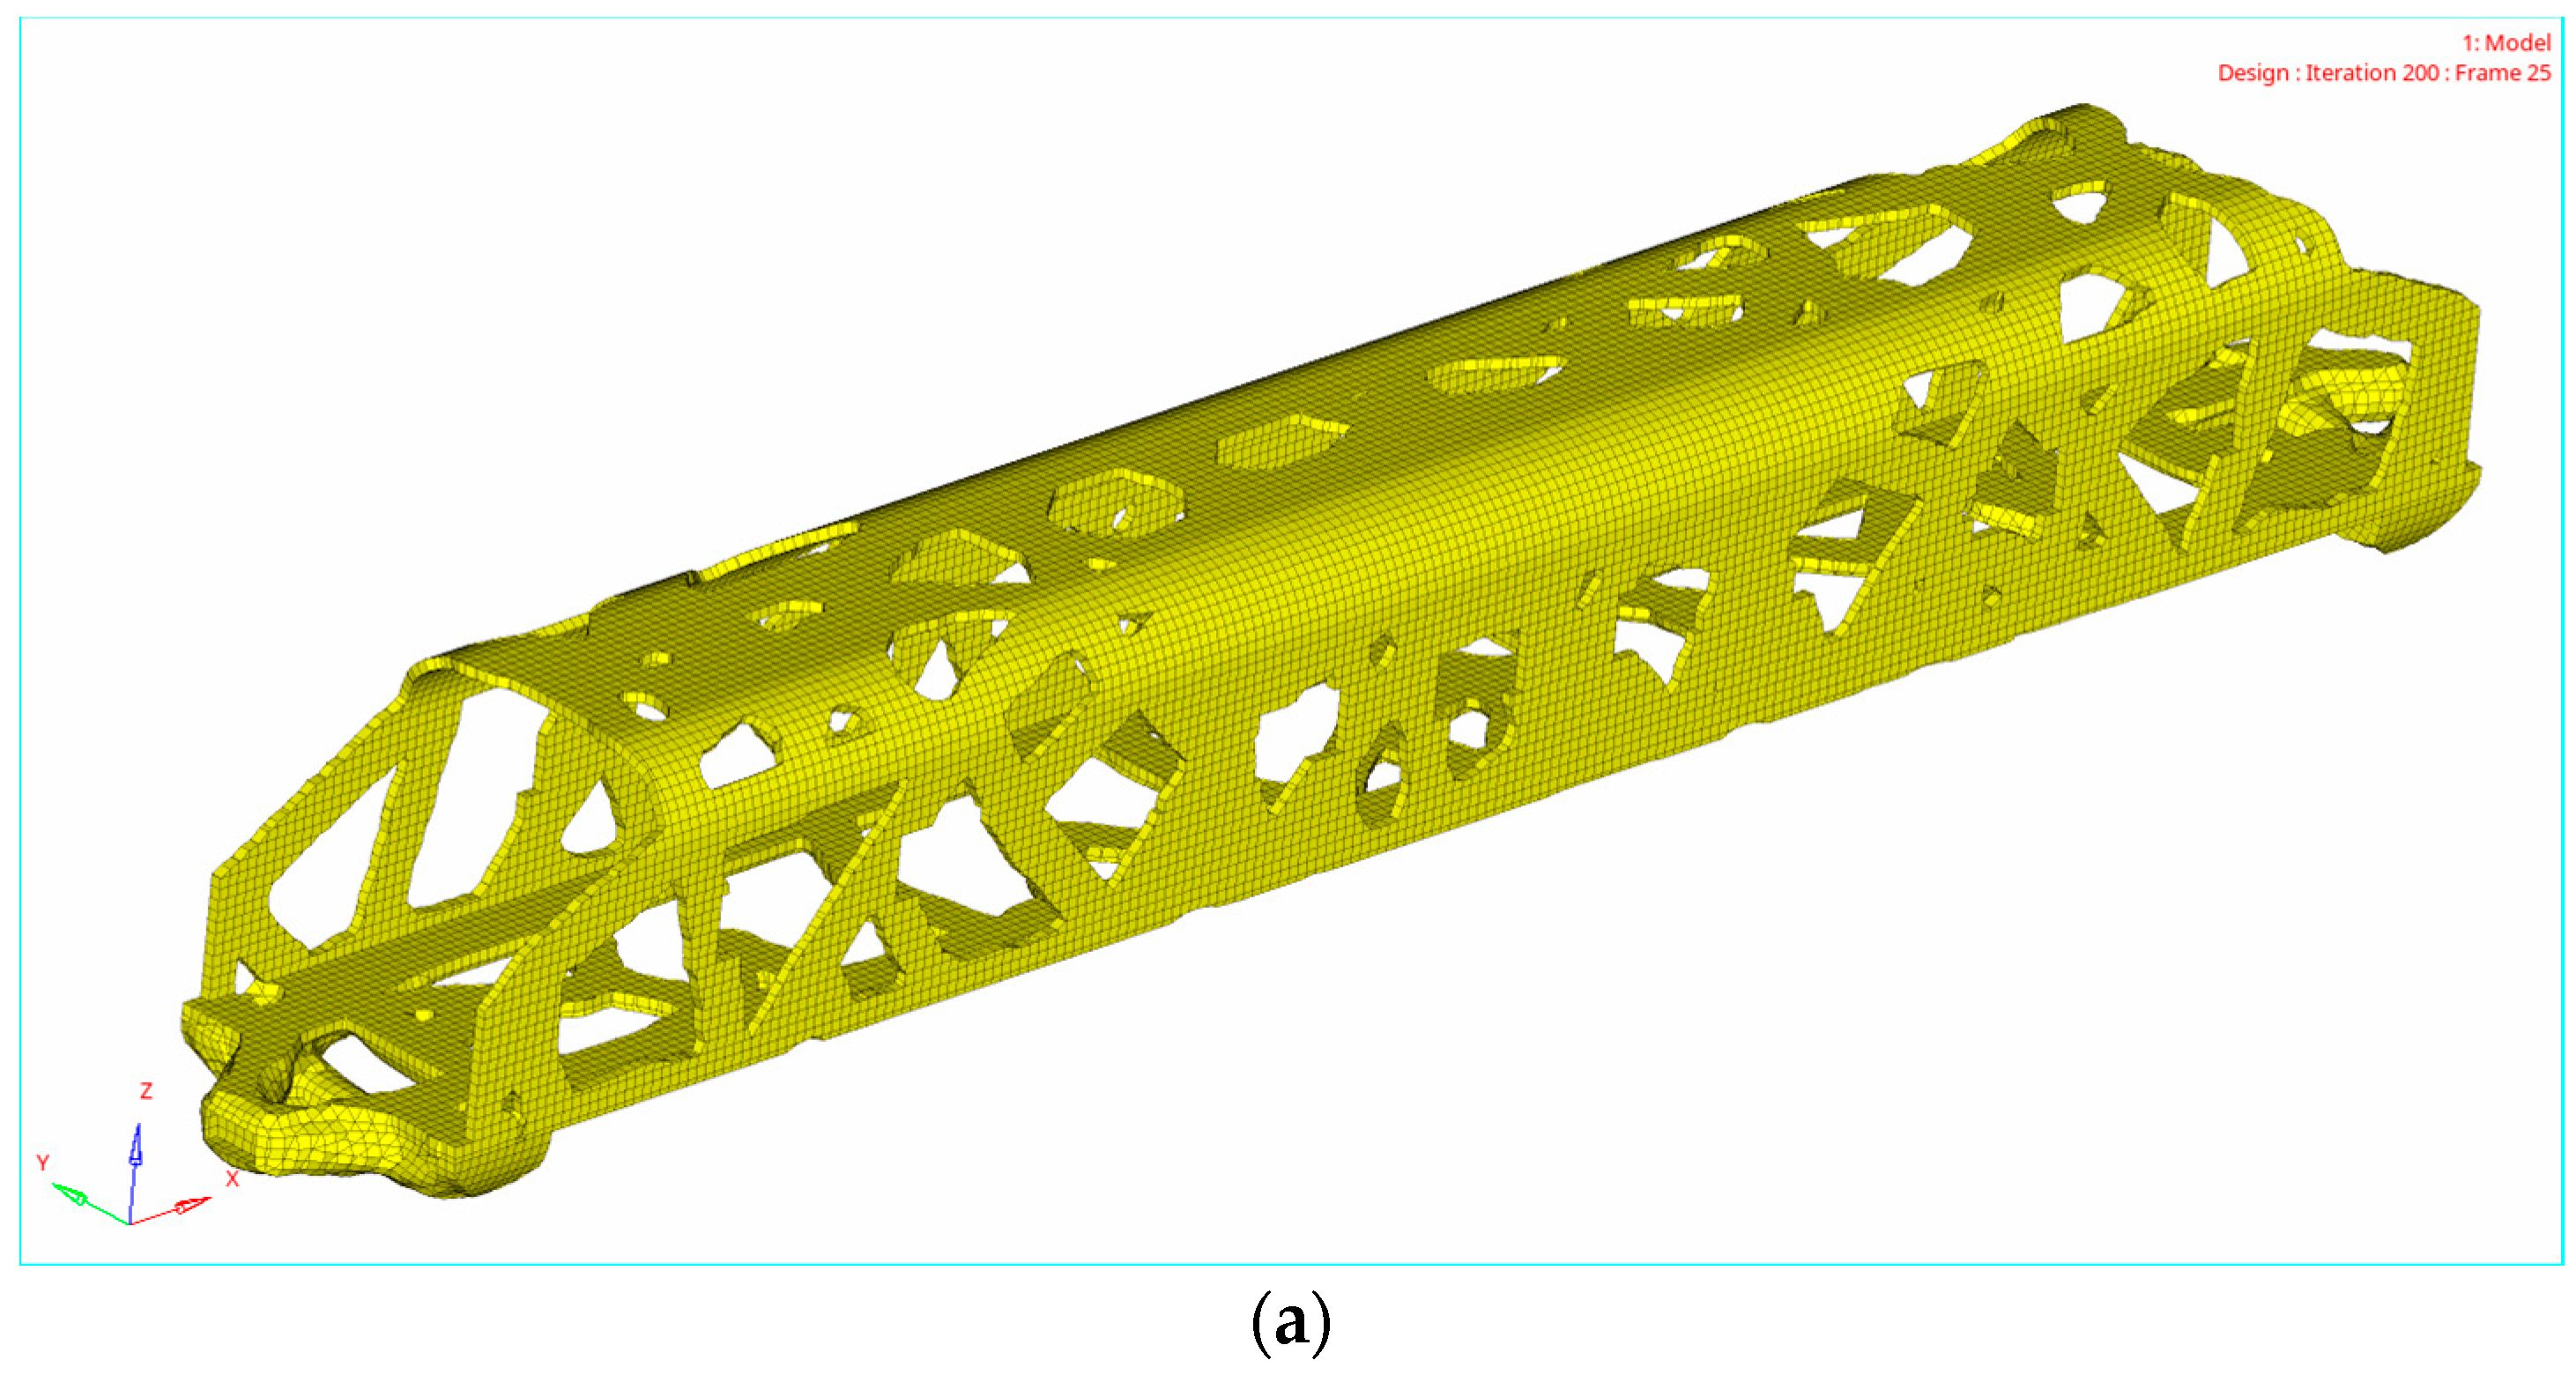
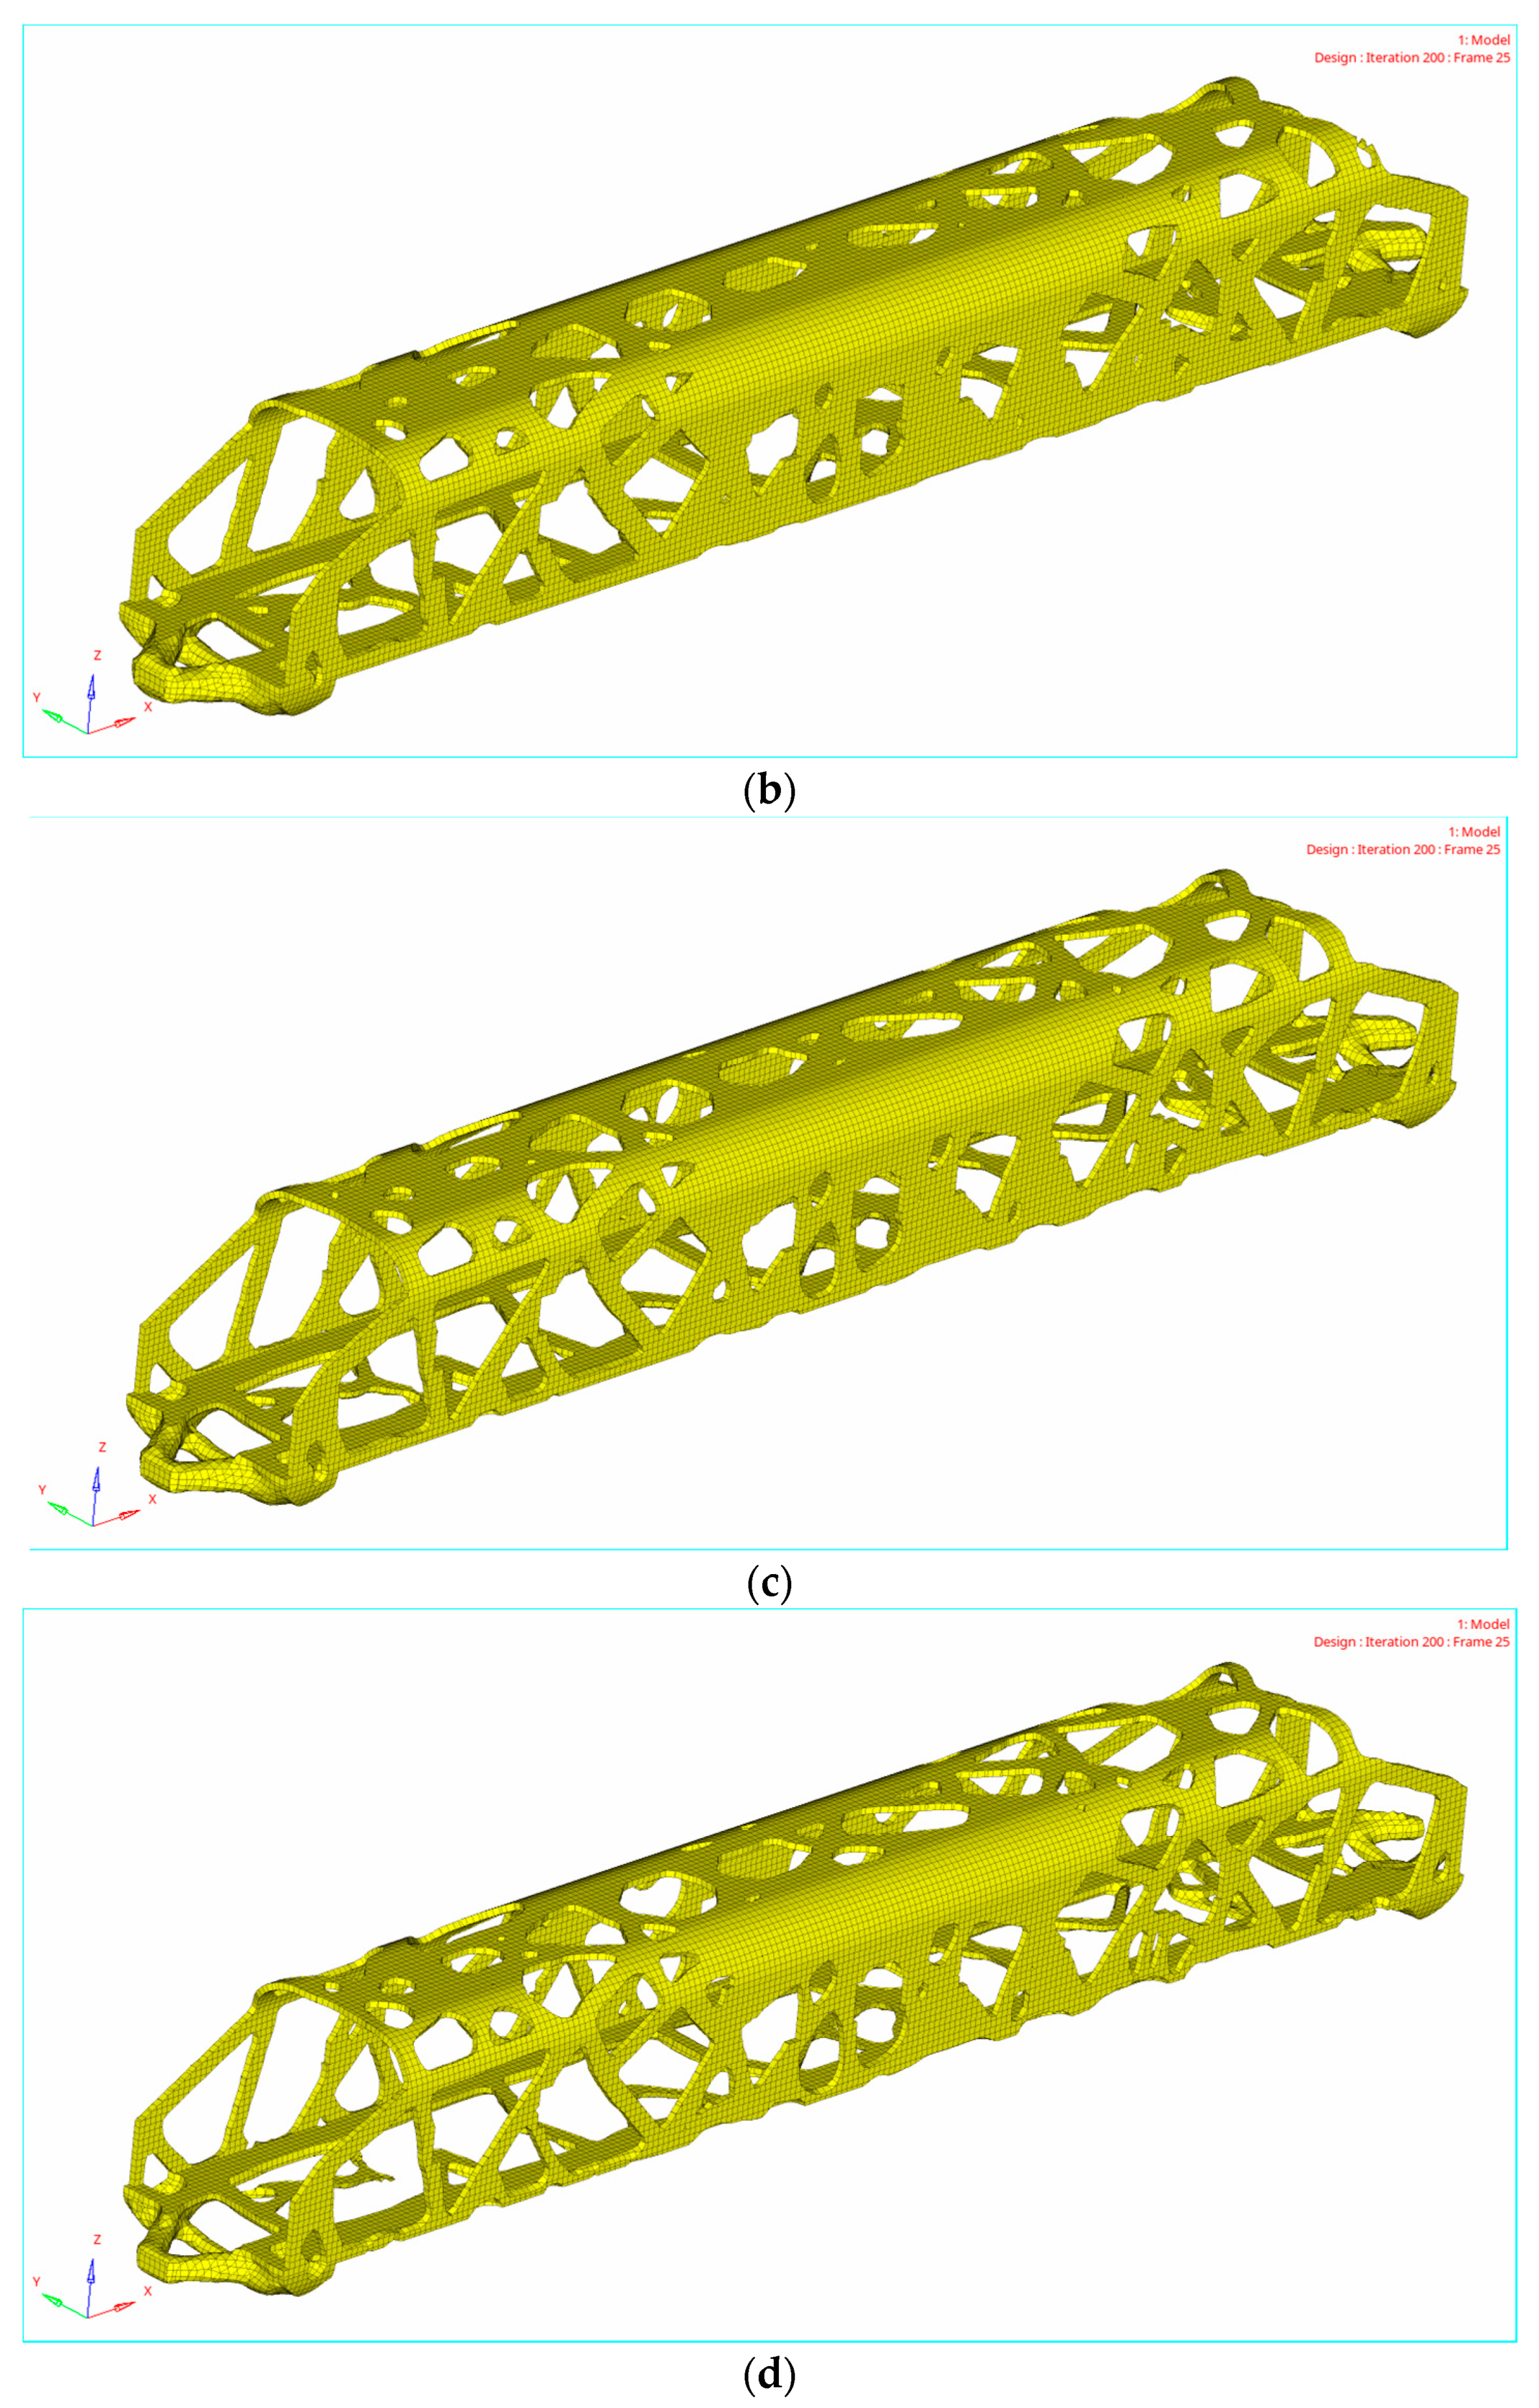
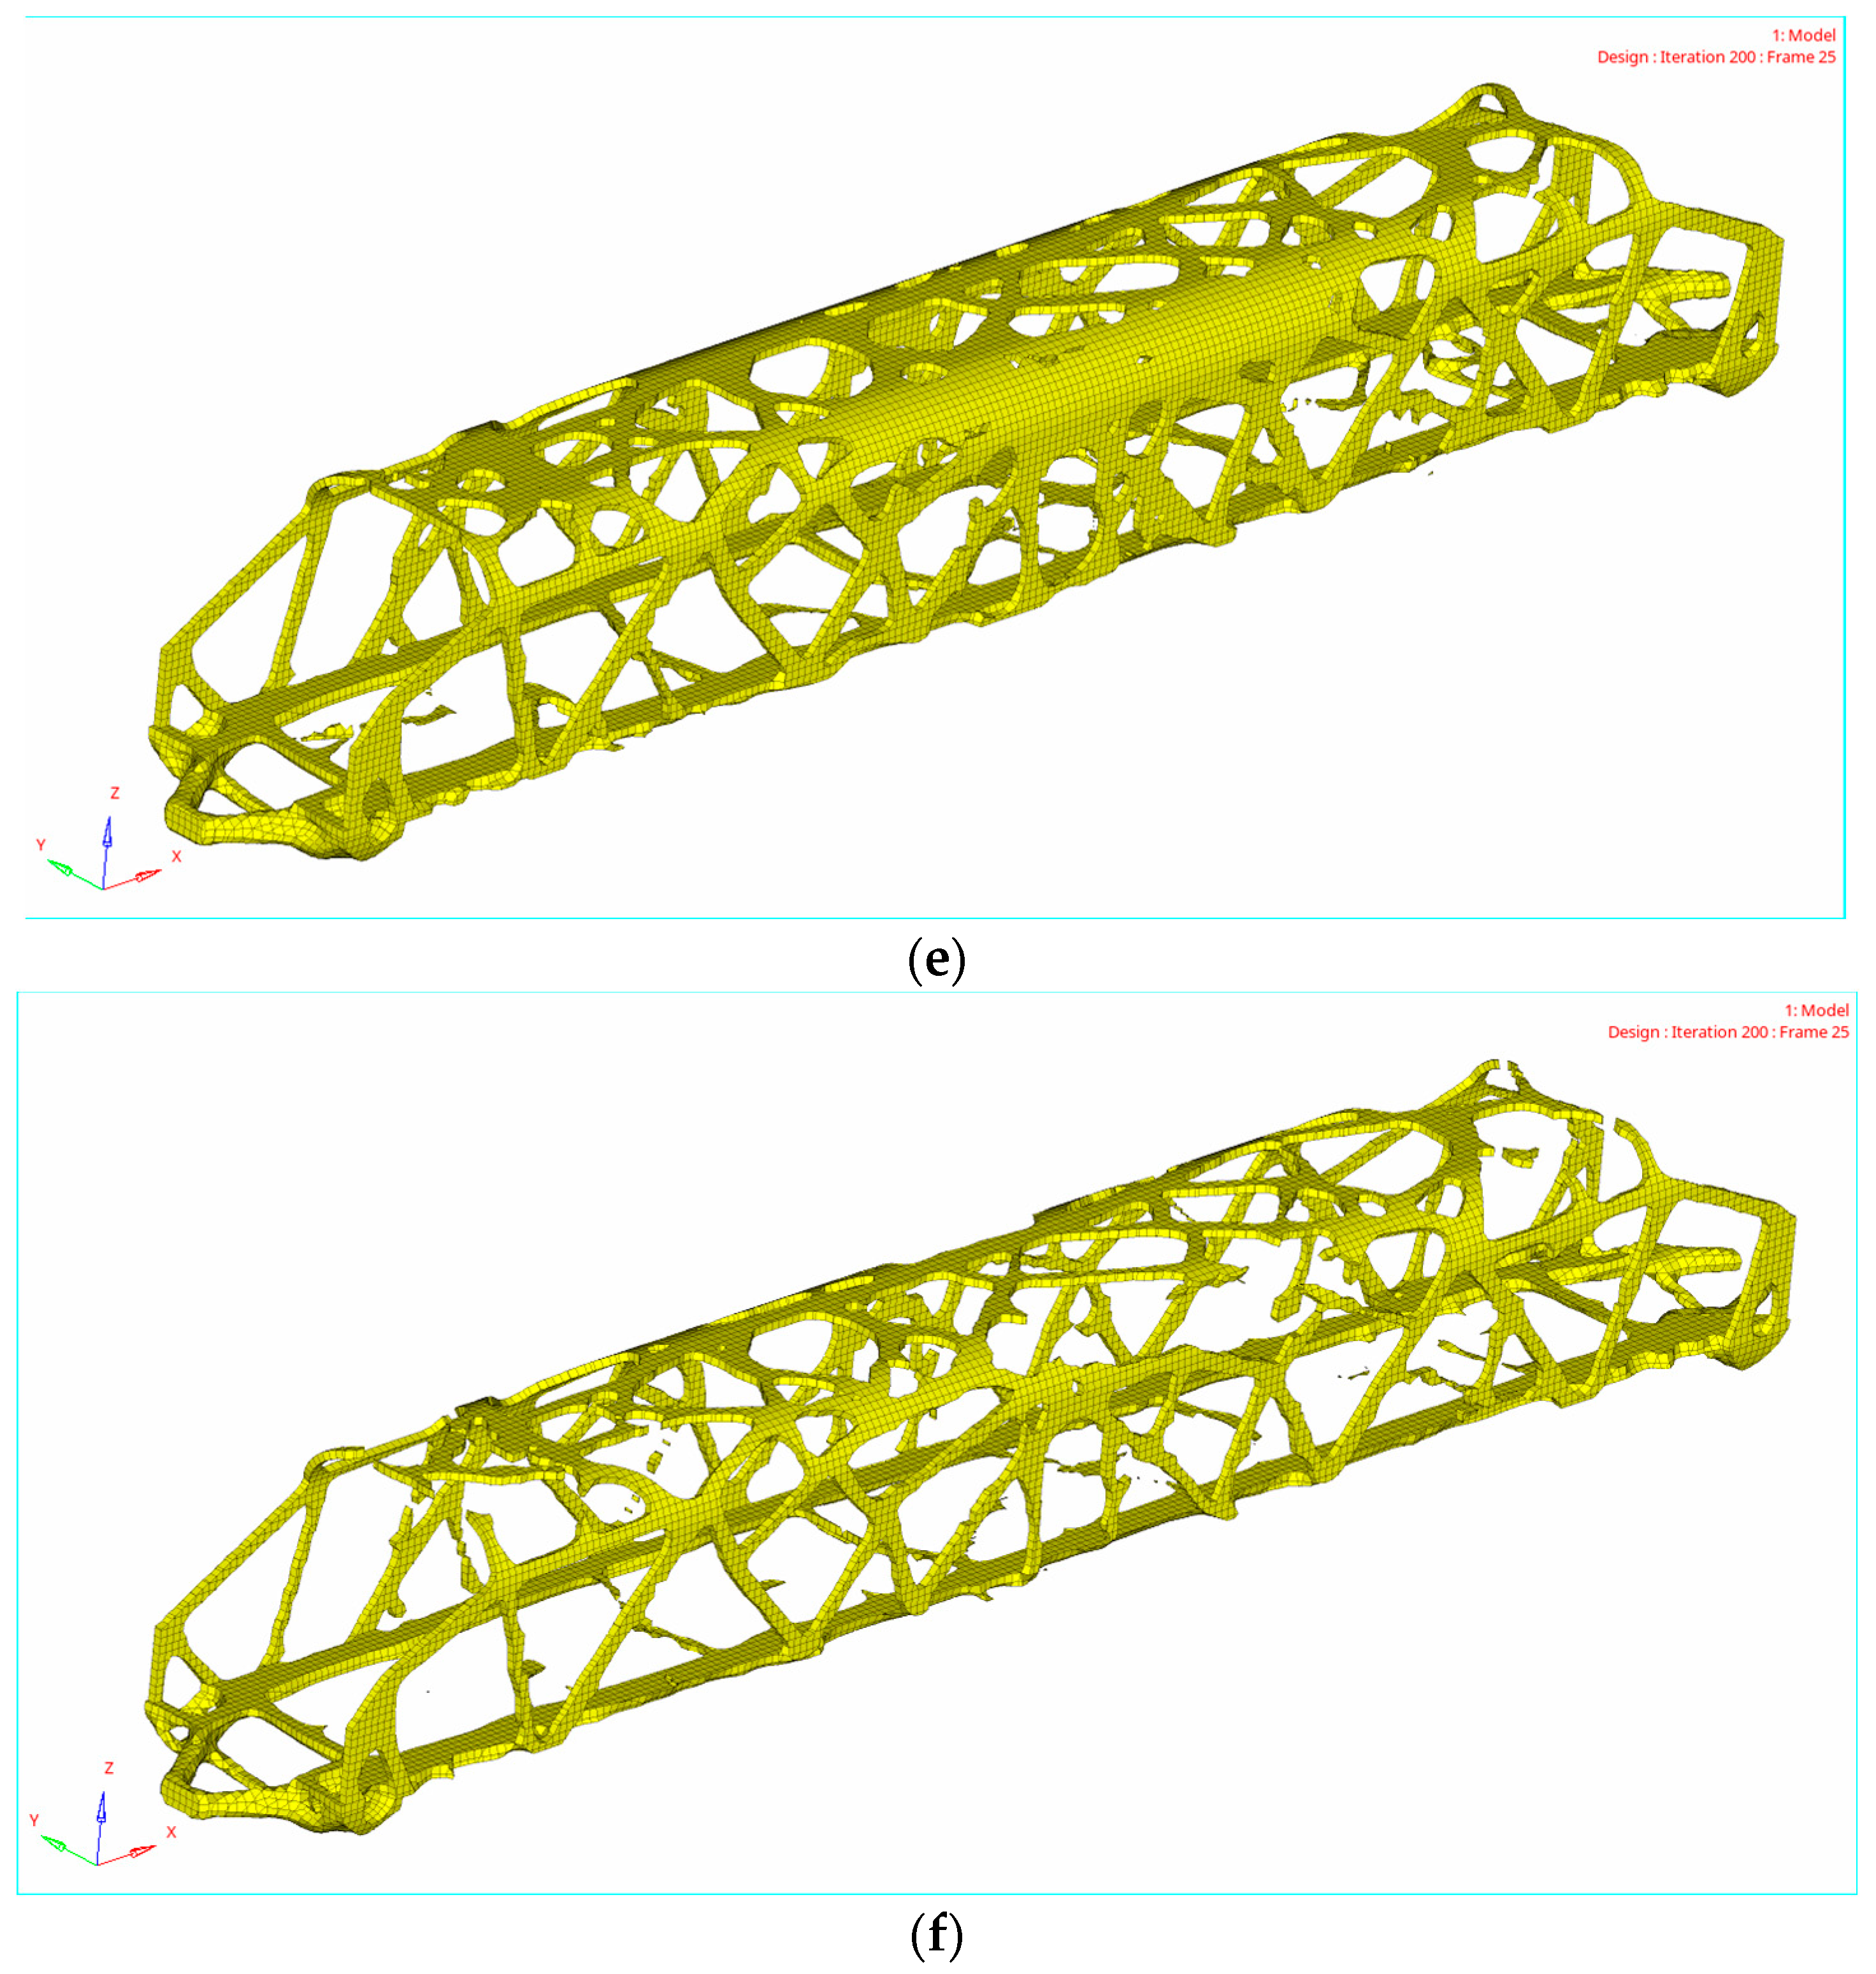
After 200 iterations of analysis and calculation, topology optimization calculation under three-point support load conditions is terminated. Figure 10 lists the topological density cloud diagrams with different thresholds.
(2) Topology optimization results of multiple working conditions
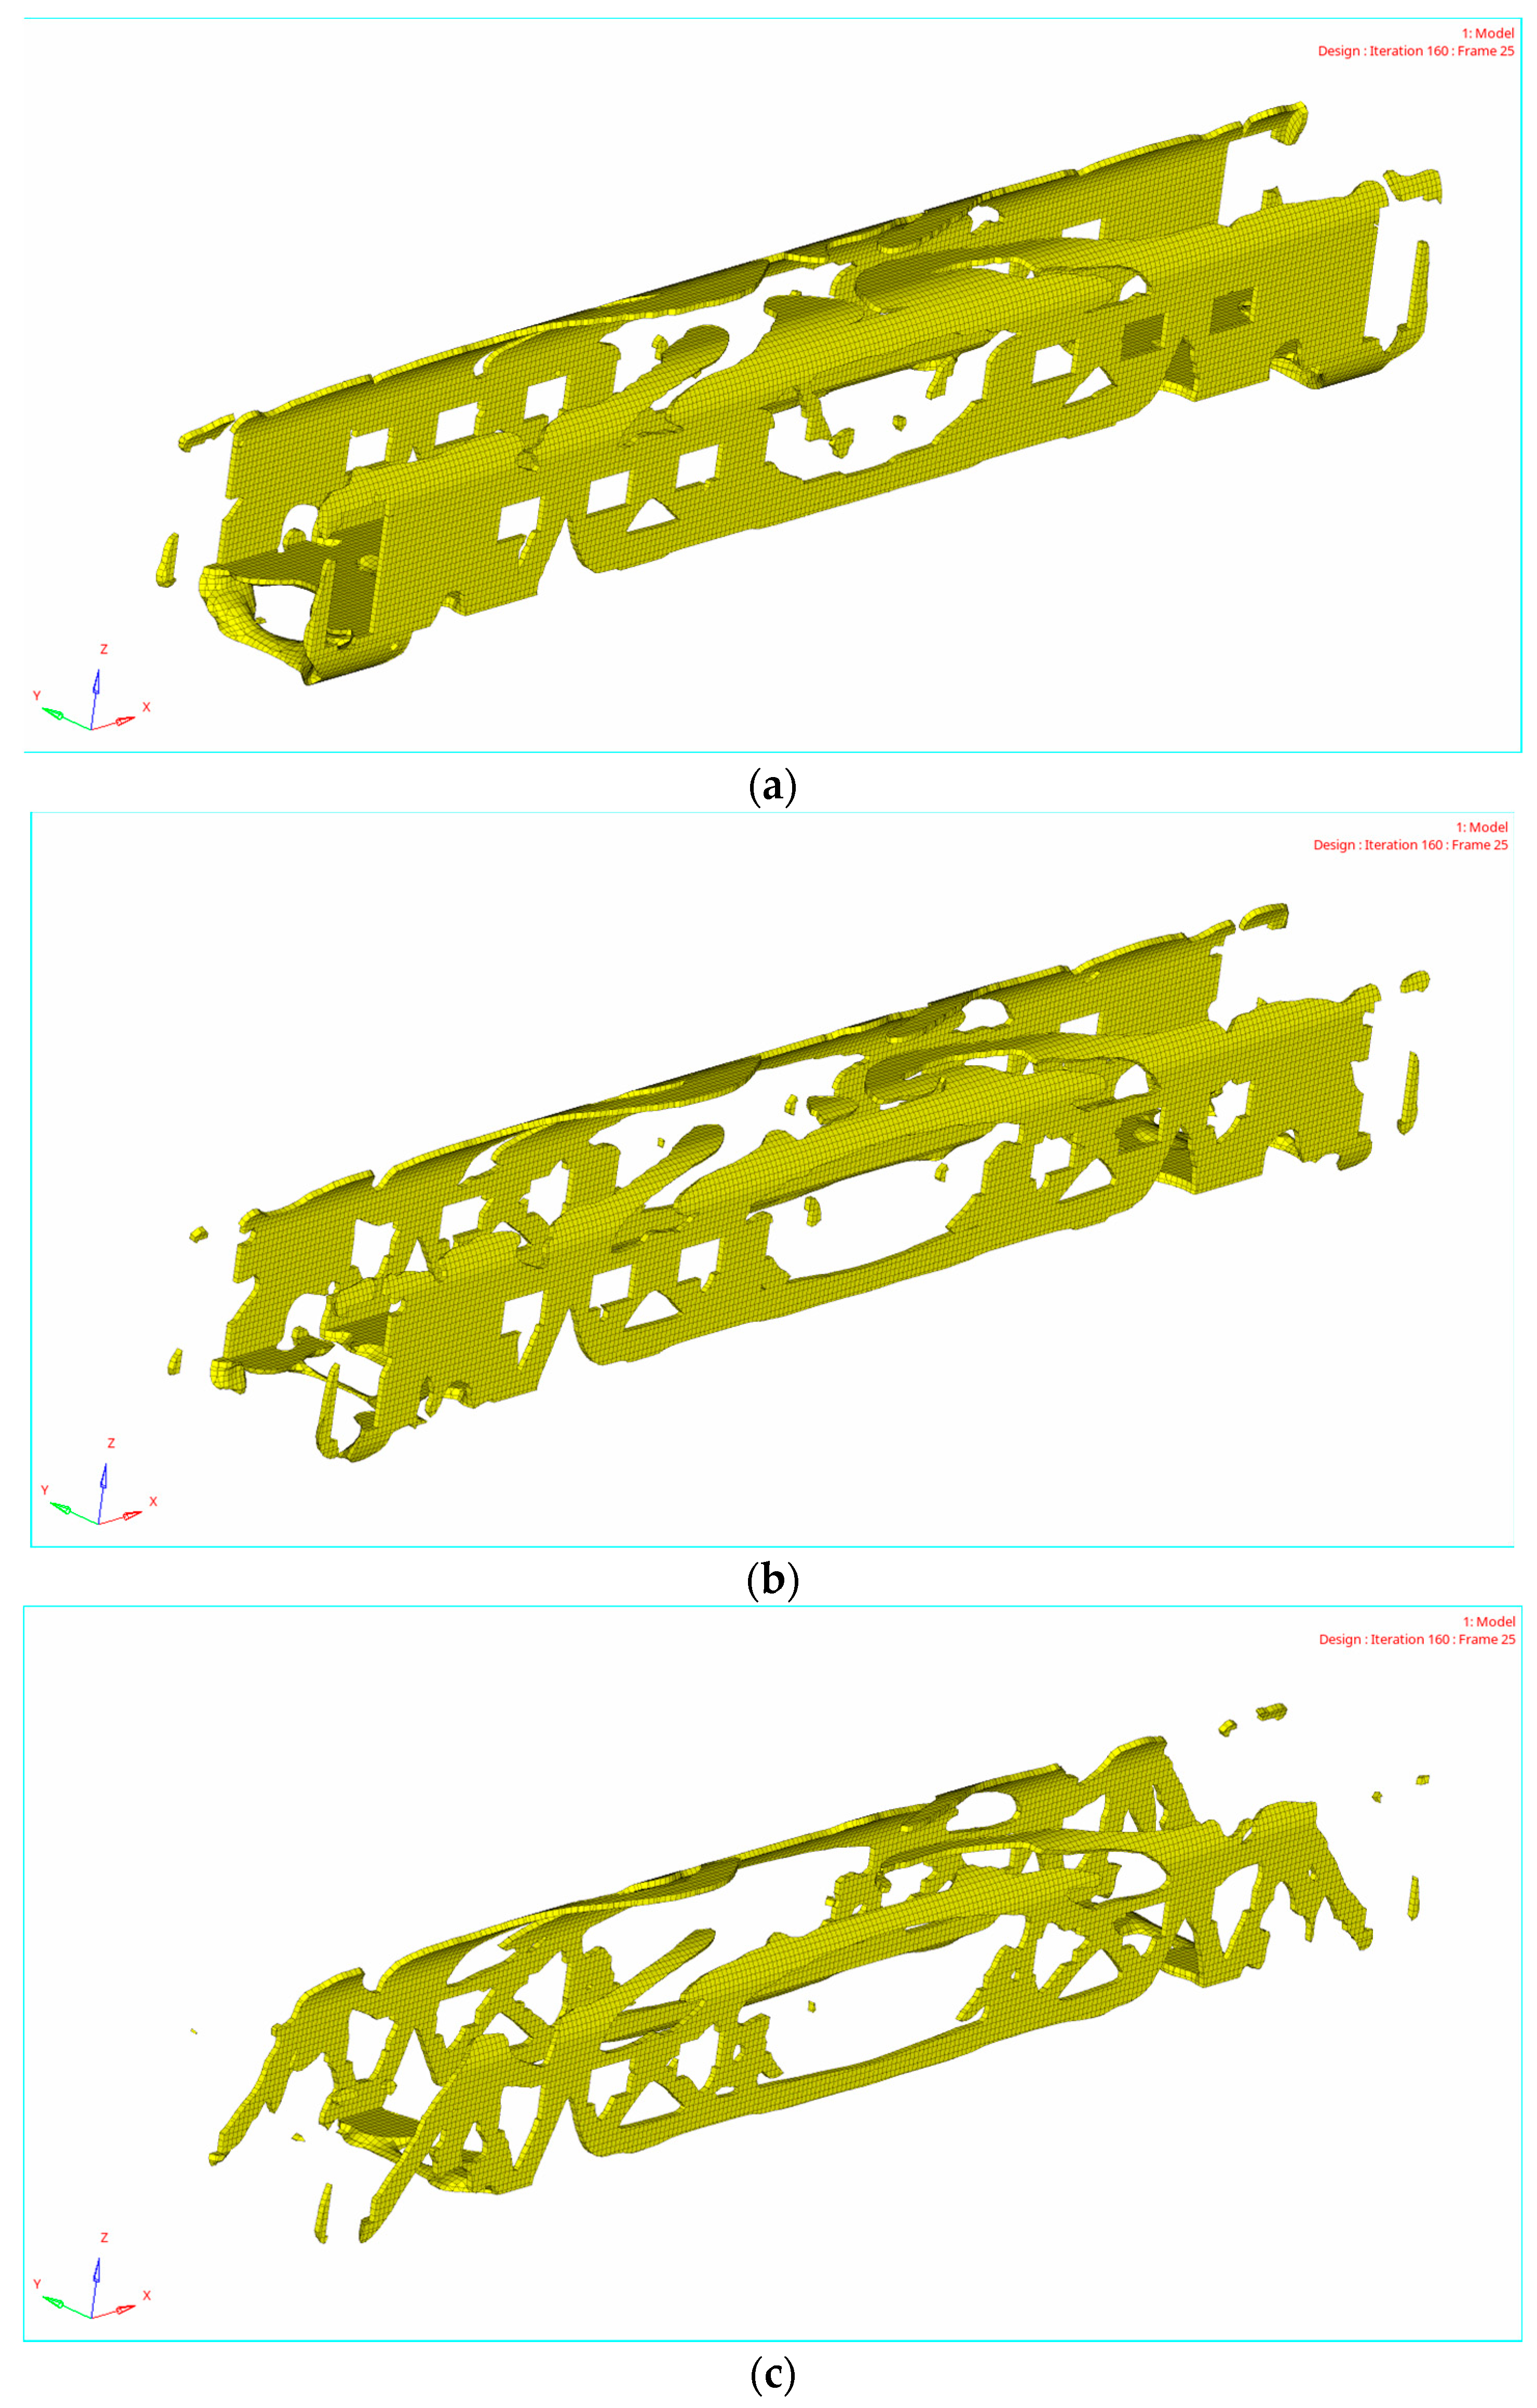
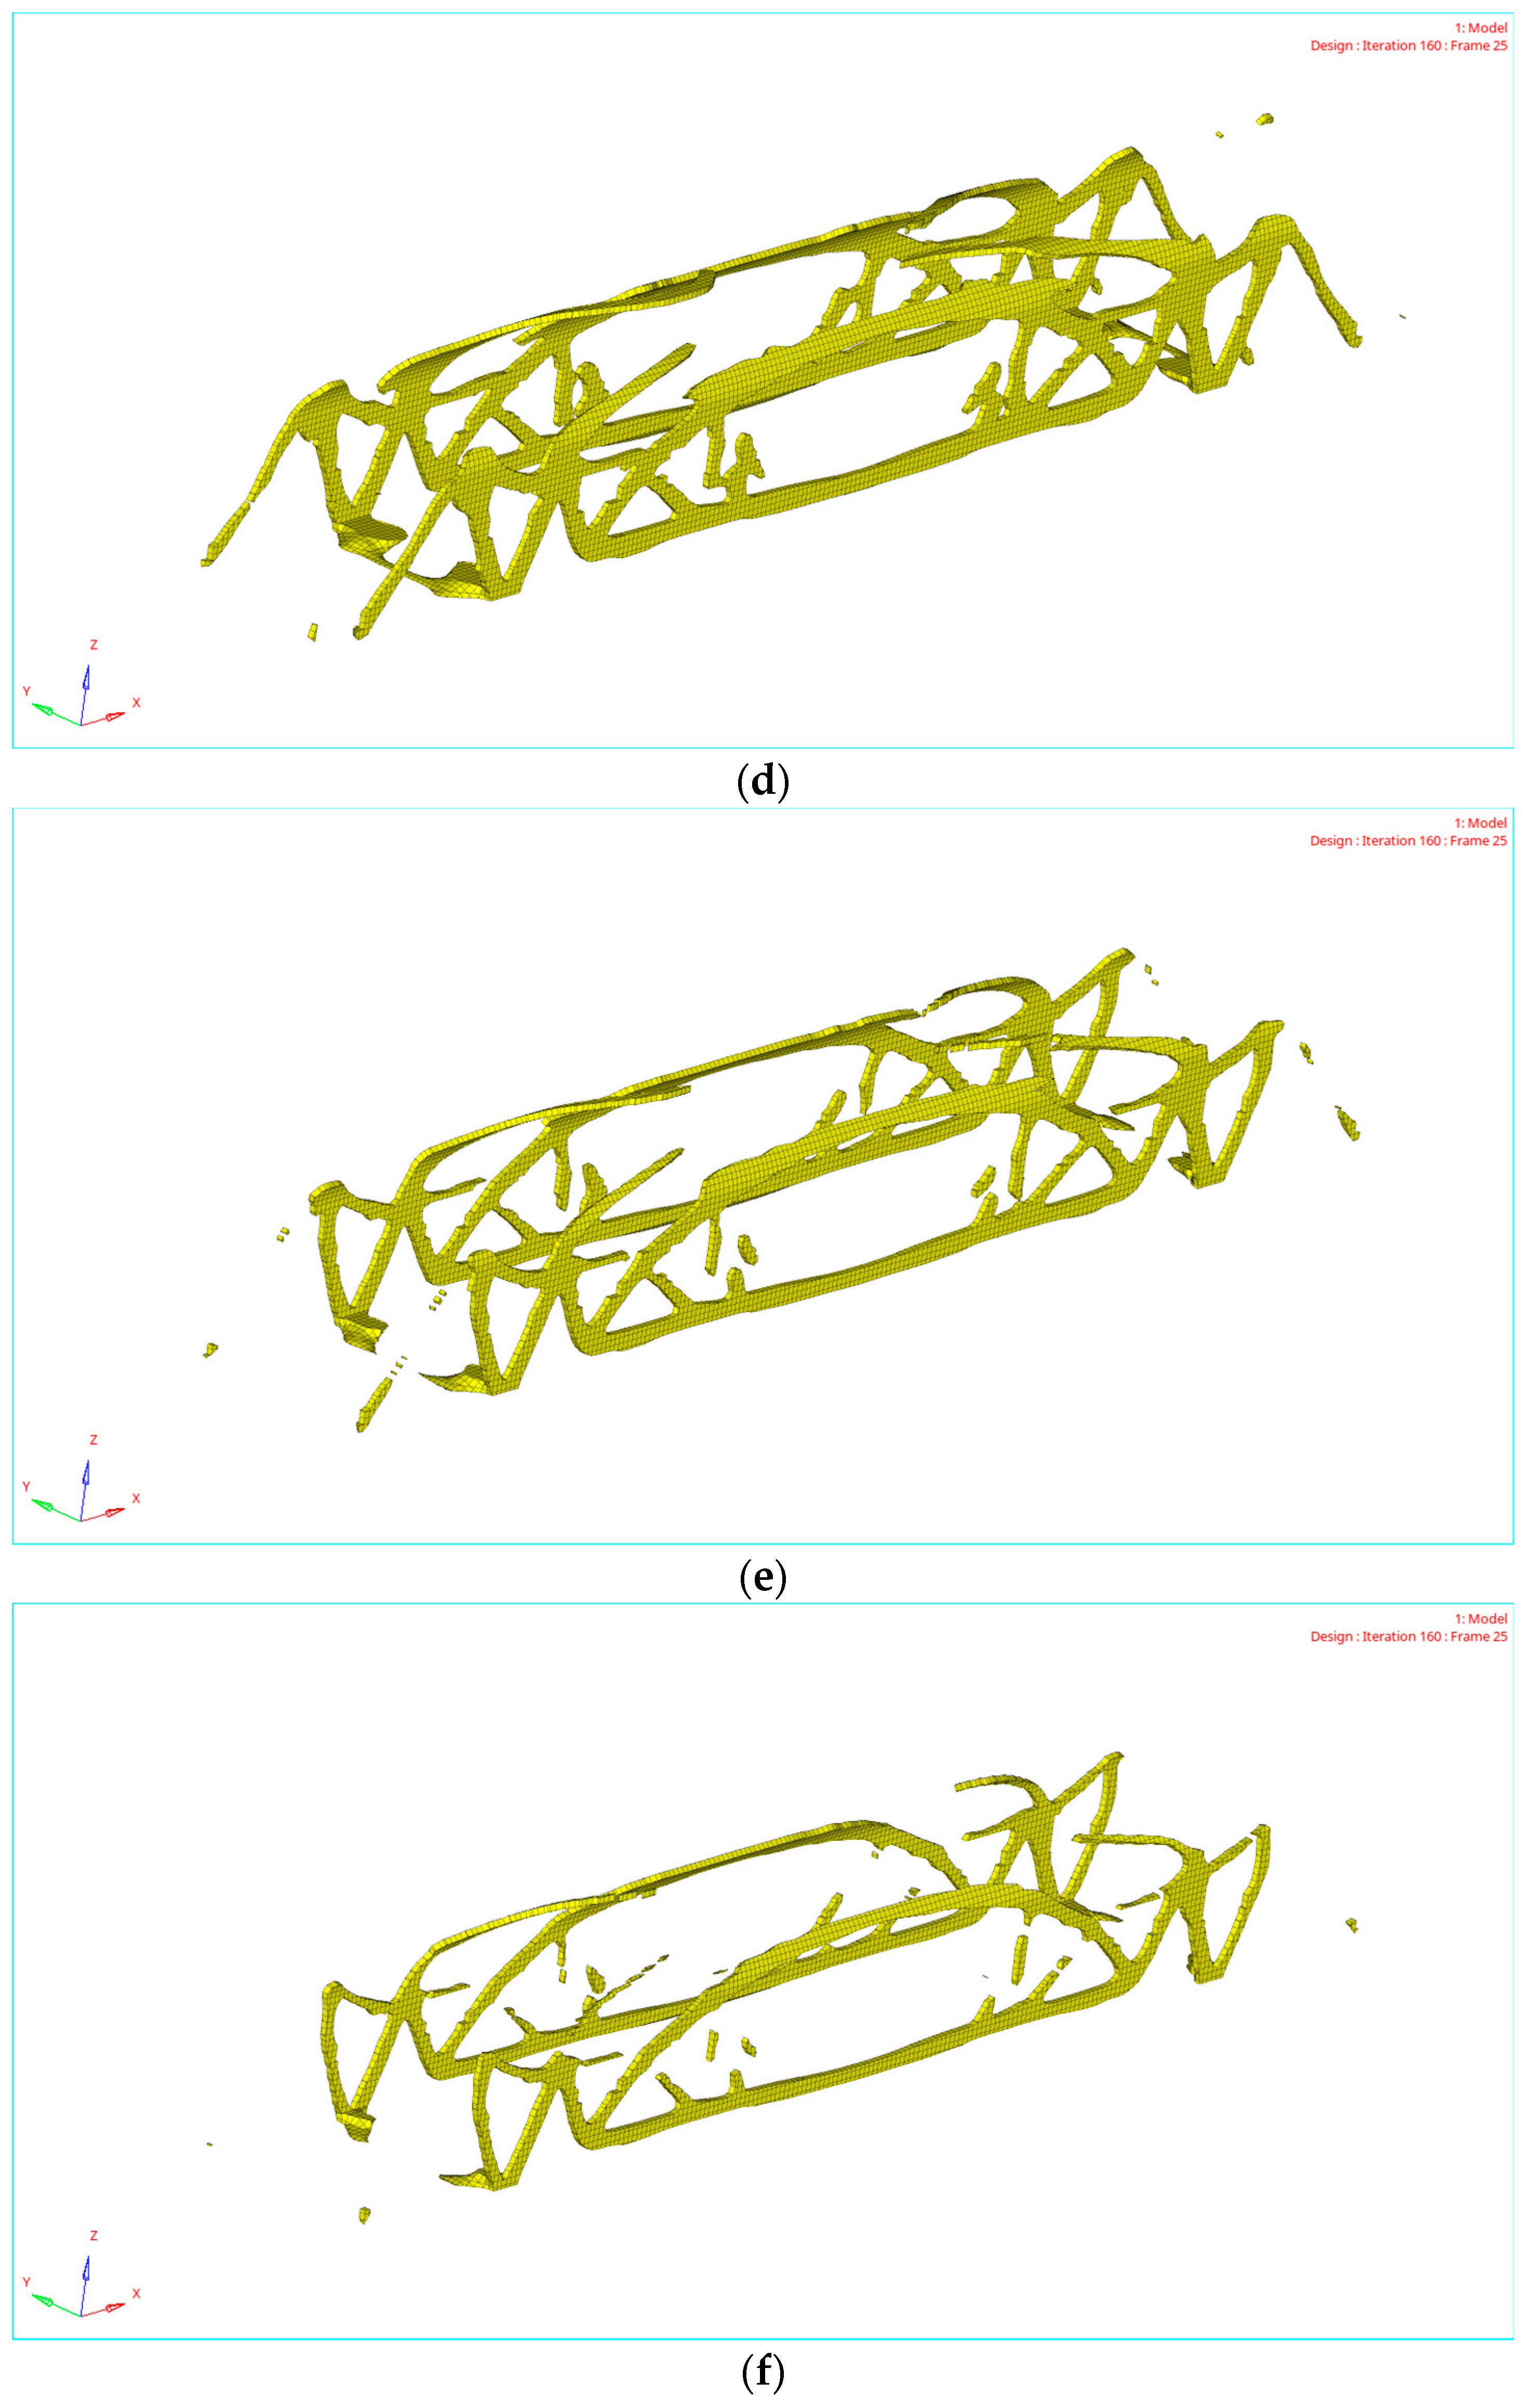
In the multiple working condition topology optimization of the structure, the optimal topology optimization structure corresponding to different conditions may also differ. A material element deleted in one working condition may be retained in another. In other words, there may be conflicts between the deletion and retaining of material elements under different working conditions. To obtain the comprehensive optimal solution under various working conditions, the linear weighted relationship between the topology optimization results of each single load working condition is considered. By assigning different weight coefficients to each working condition, the complex multi-working condition optimization problem can be simplified to a single working condition optimization problem. The mathematical model is as follows.
F ( X ) = j = 1 m ω j f j ( X ) = ω 1 f 1 ( X ) + ω 2 f 2 ( X ) + + ω m f m ( X ) i = 1 P ω i = 1   ( i = 1 , 2 , , p )
where F ( X ) represents the equivalent objective function under multiple working conditions, m represents the number of optimized working conditions, ω corresponds to the weight coefficient of each working condition, and f ( X ) represents the input load under the single load condition.
When creating the response in the simulation software, it is necessary to set the corresponding proportion of each working condition. However, due to the different frequencies of each working condition during the operation of the vehicle body, the proportion of each working condition in the topology optimization is different, so two groups of weight coefficients are selected for comparative analysis.
(1) Topology optimization scheme with the same weight coefficients
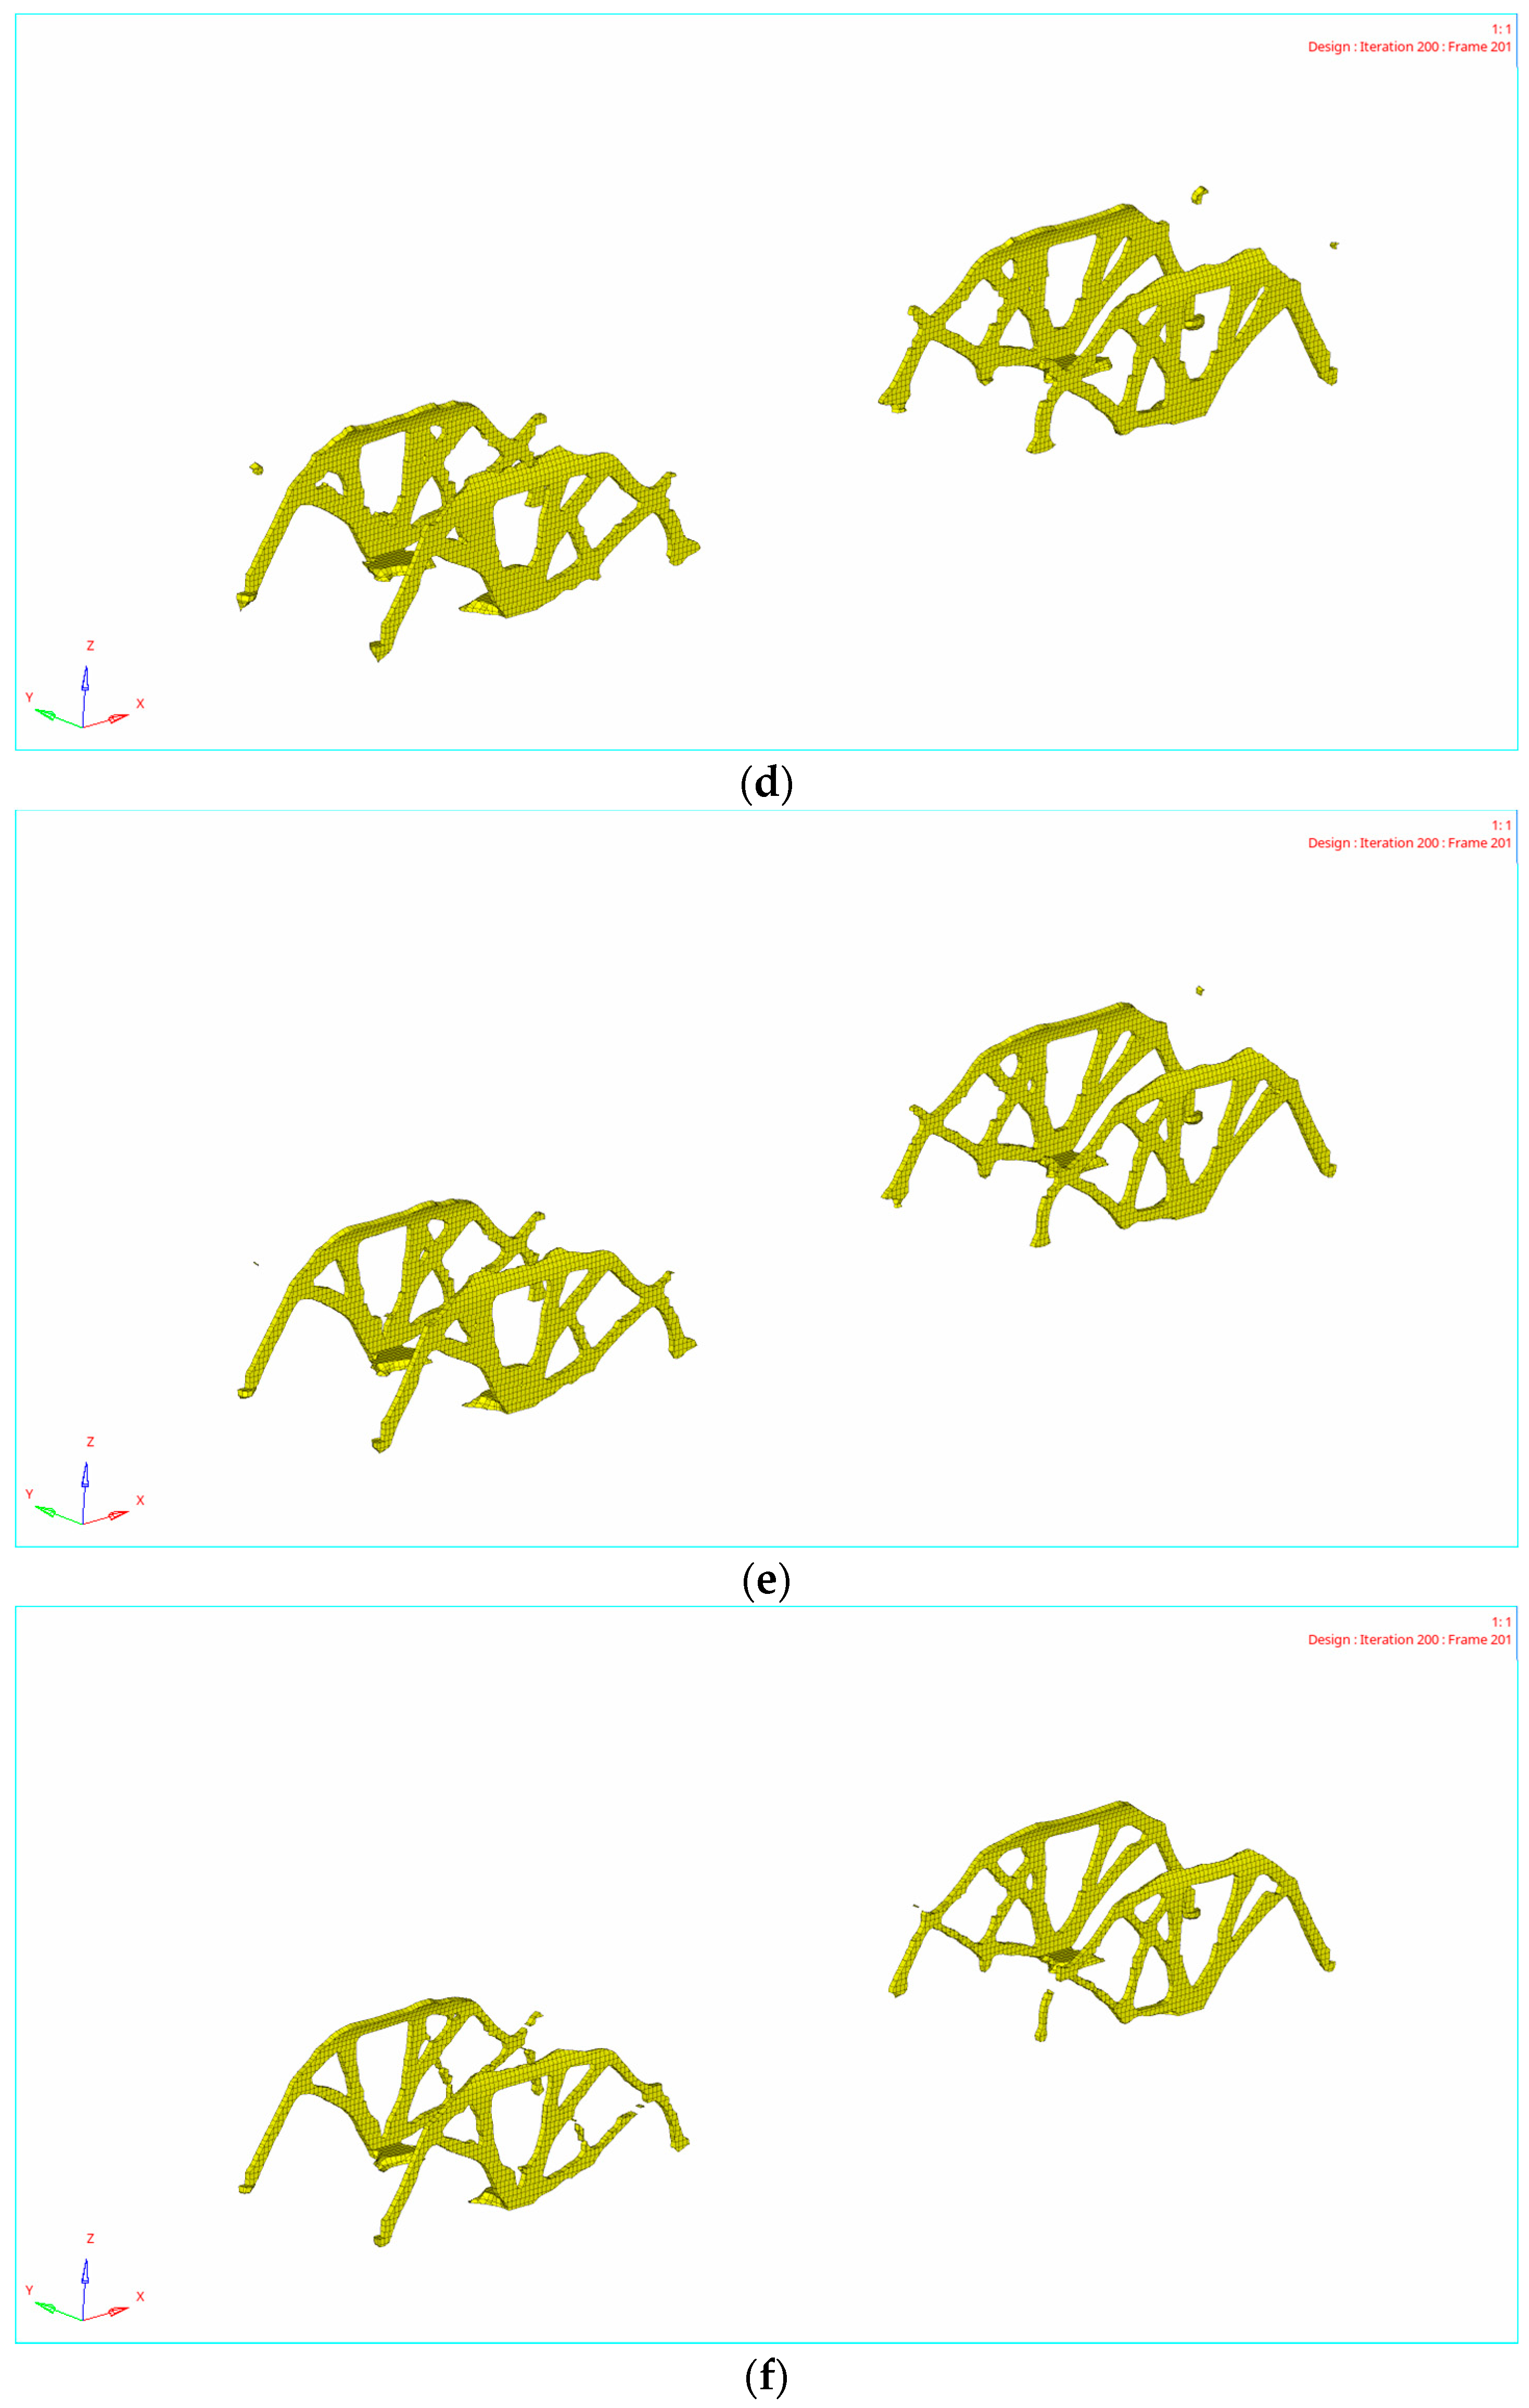
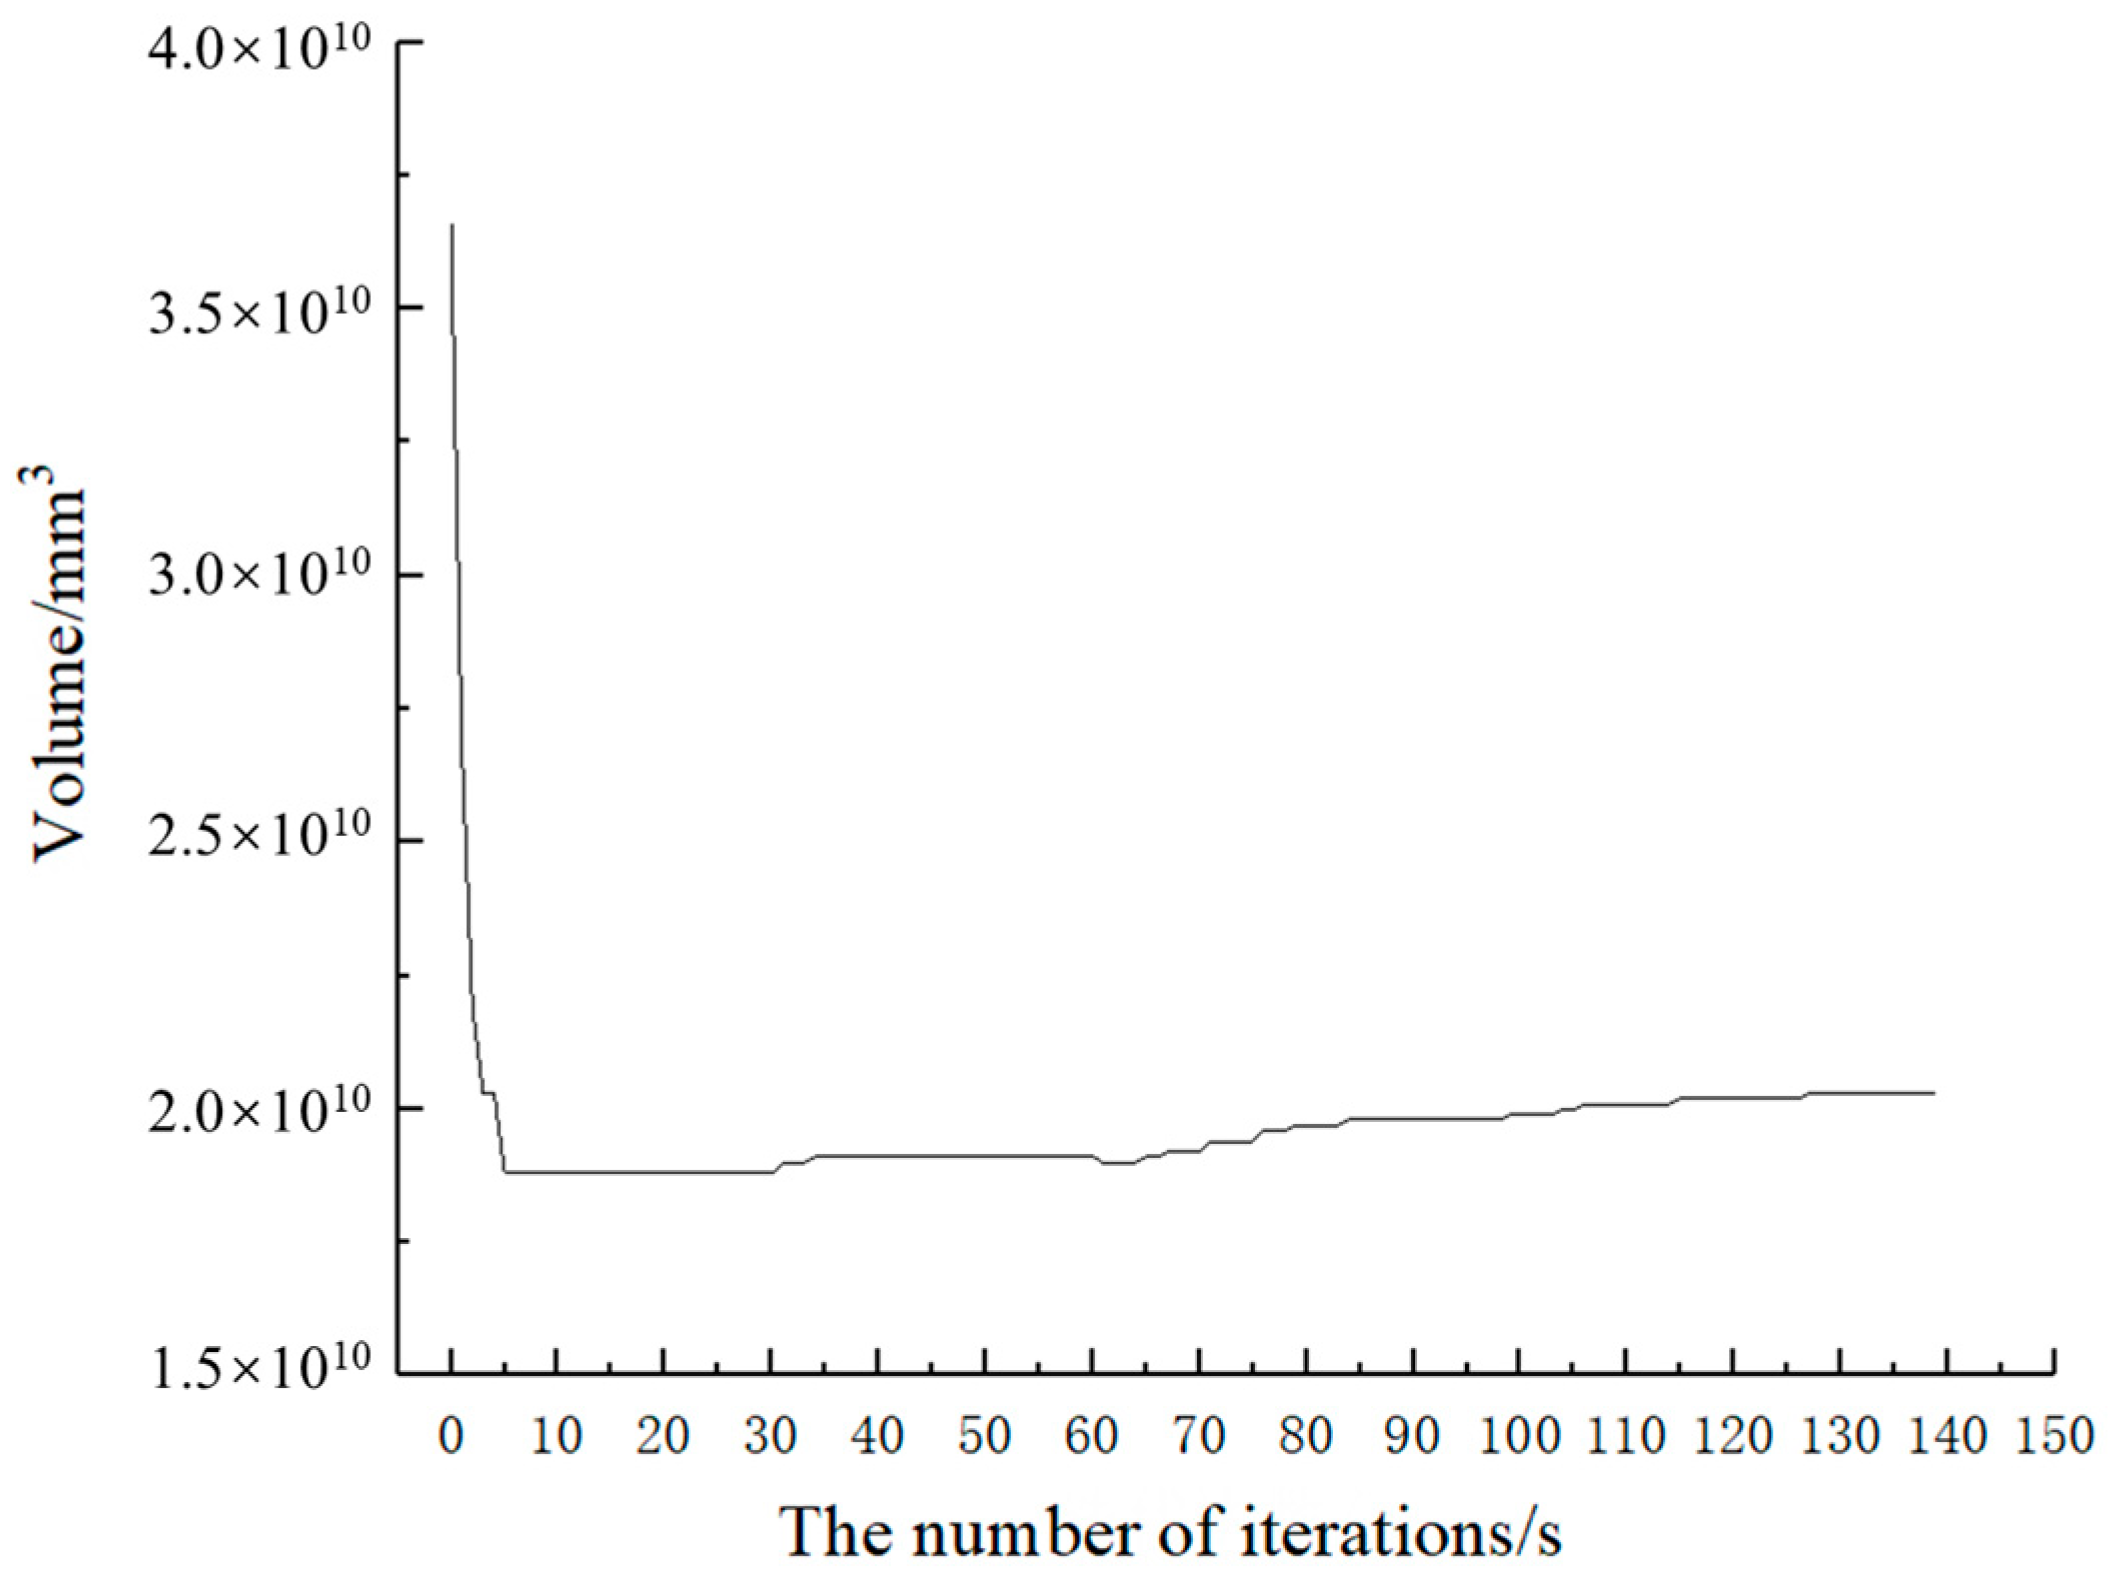
In this group, the specific gravity of the five working conditions is set as 0.2 for topology optimization and submitted for calculation. Figure 11 and Figure 12 show the changing trend of the objective function under topology optimization with the same weight coefficient after 139 iterations.
The optimization results of multiple working conditions with the same weight coefficient show that the residual material distribution of the car-body structure after the topology optimization of multiple working conditions is relatively straightforward. With the increase in the number of iterations, the truss structure in the middle of the car body is apparent. However, there are still more materials on both sides of the car body, and no apparent truss structure is generated.
(2) Topology optimization scheme with different weight coefficients
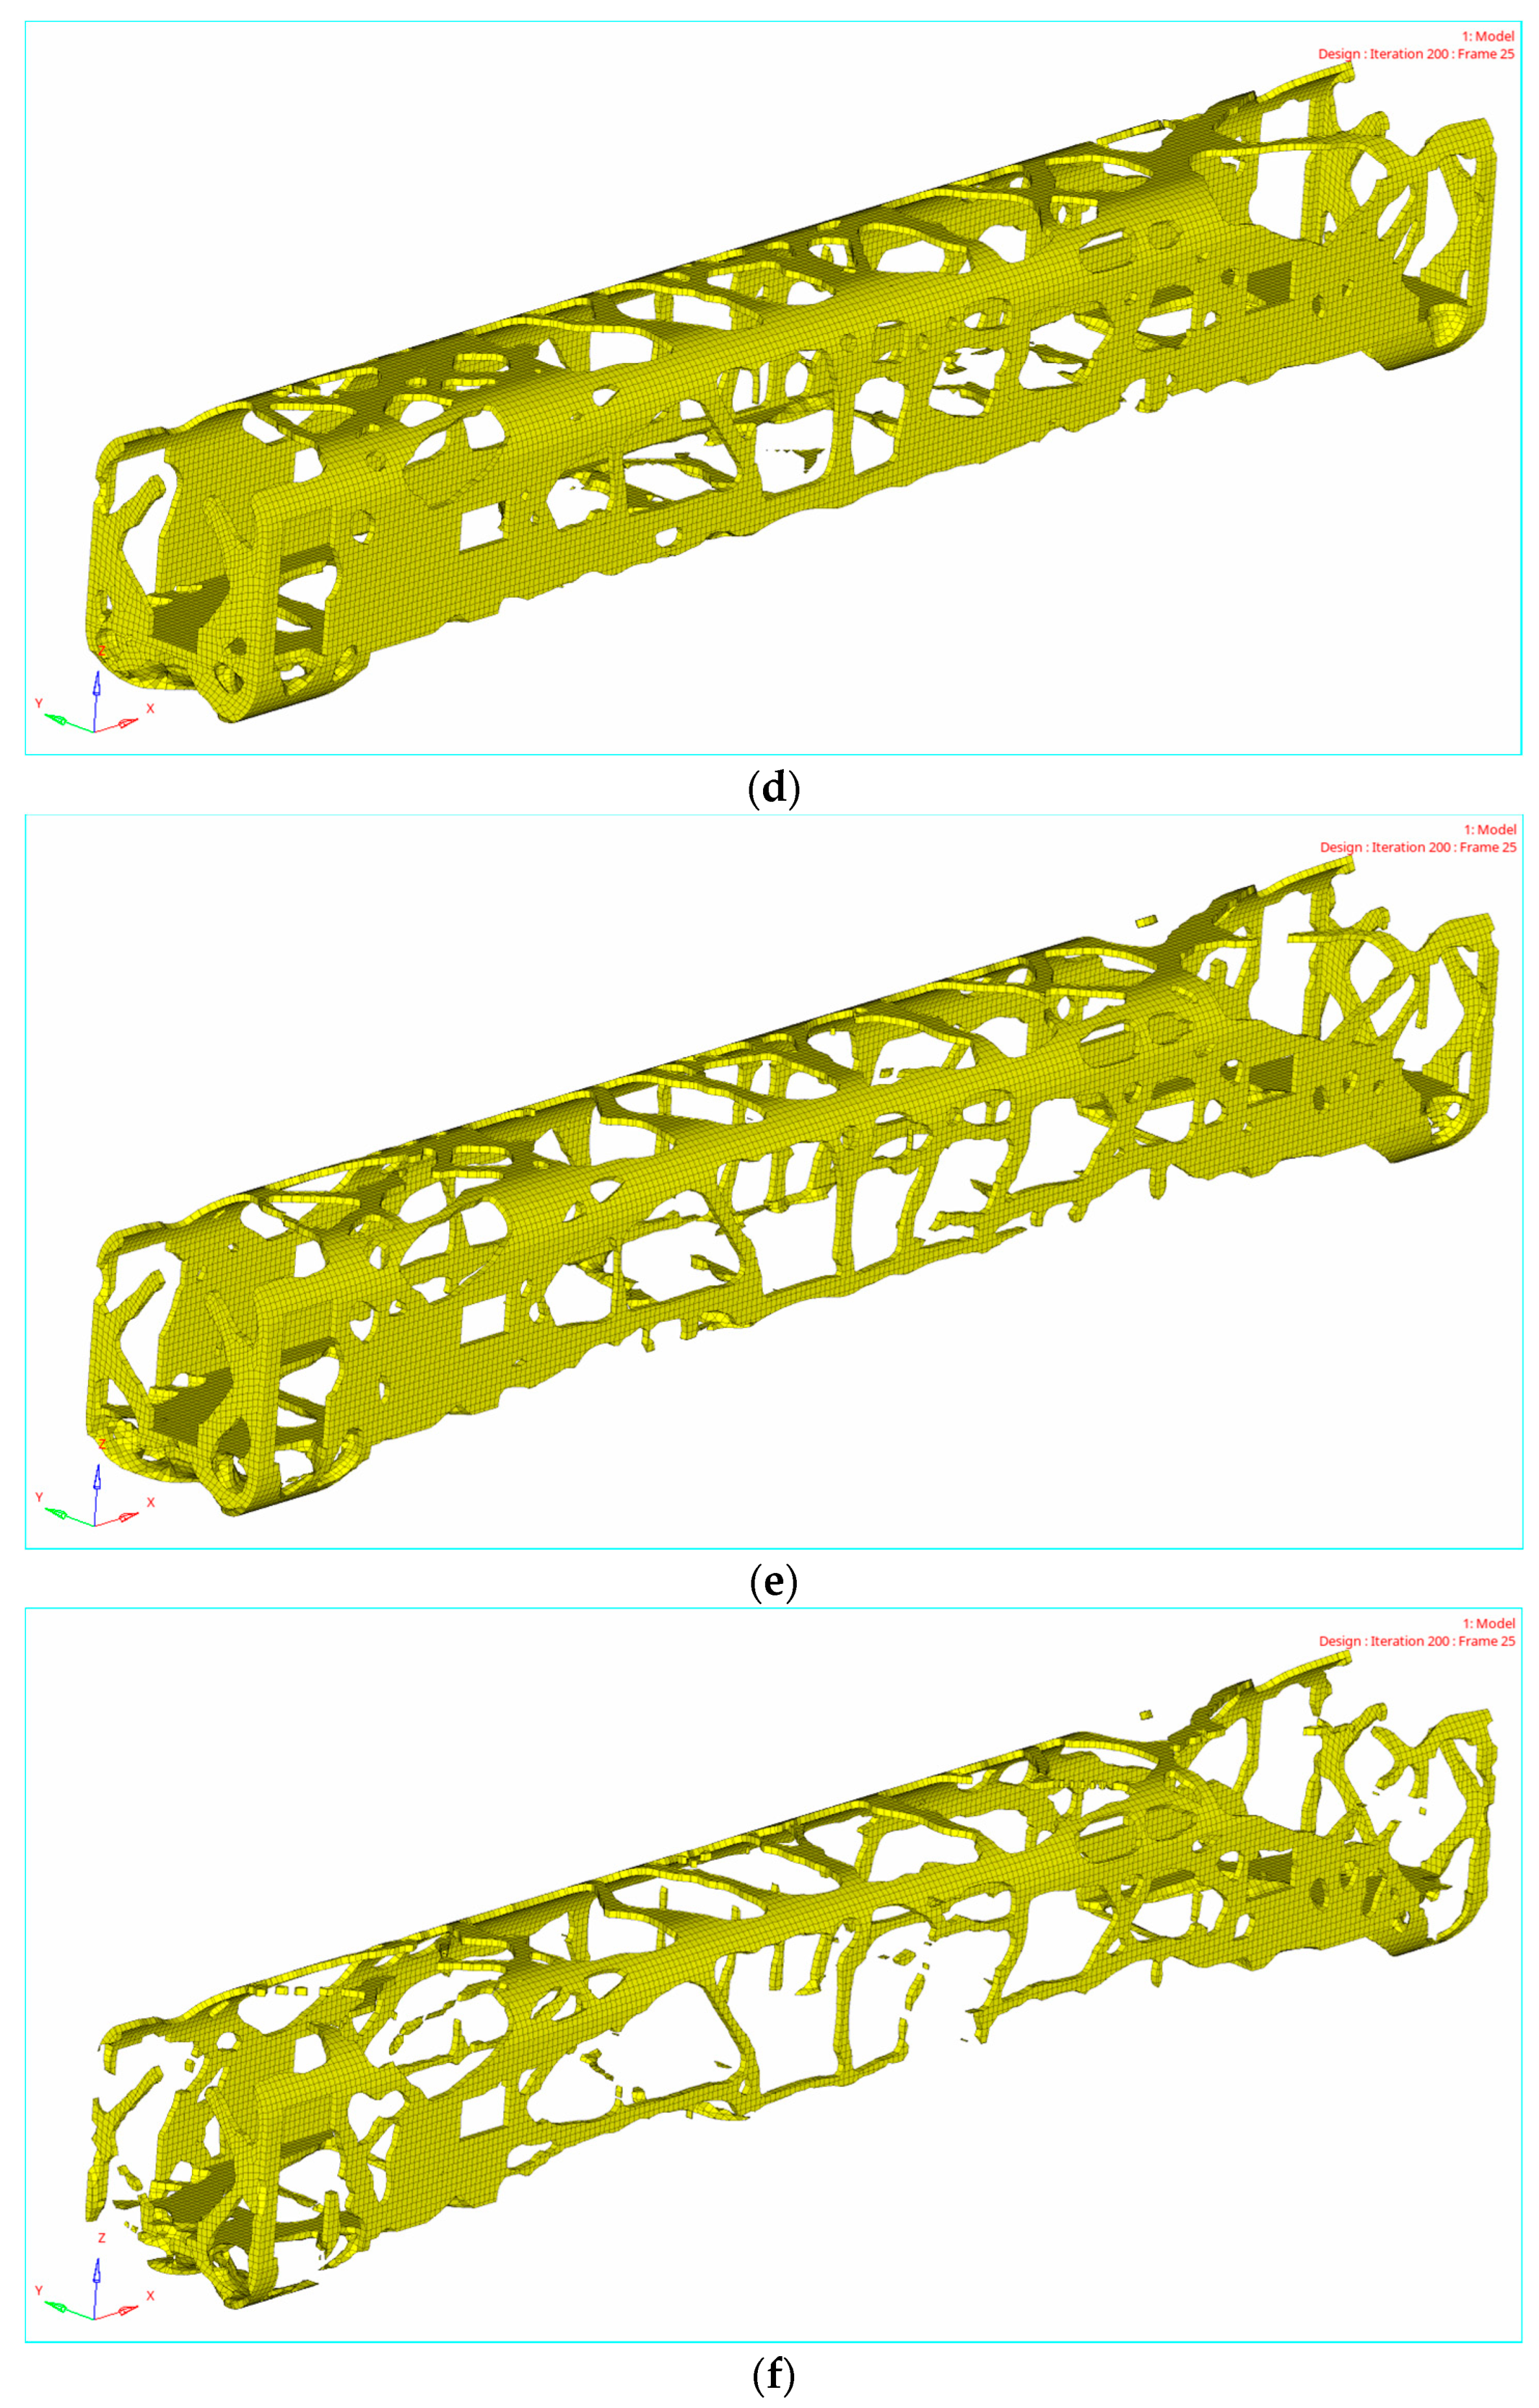
A vertical load is always present in the daily operation of high-speed EMUs. The torsional load and transverse wind load are the most frequent loads of trains entering and exiting curves, intersections, and tunnels, while the longitudinal load and three-point support load are less frequent. According to the frequency of the five working conditions, the specific gravity of the five topology optimizations in this group is set as 0.4, 0.2, 0.2, 0.1, 0.1, including the vertical load of 0.4, the torsional load and the transverse wind load of 0.2, and the longitudinal load and the three-point support load of 0.1, and the calculation is performed based on the above optimization settings. Figure 13 and Figure 14 show the changing trend of the objective function under topology optimization with different weight coefficients after 75 iterations.
The multi-condition optimization results with different weight coefficients show that the distribution of residual structural materials of the car body is clear after the multi-condition topology optimization. With the increase in the number of iterations, the material of the end walls on both sides is removed from the early stage of calculation, the structure of the bottom beam of the frame gradually becomes clear, and the cross-type grid structure of the side wall and the roof also gradually becomes prominent.
The multiple condition optimization with different weight coefficients is adopted by comprehensively comparing the above two schemes. This scheme can better integrate the characteristics of the topology optimization results of each single condition, and the optimization results are reasonable. The truss structure is evident, which can provide critical guiding suggestions for the establishment of the truss vehicle body structure in the later stage.

5. Reconstruction of Car-Body Bearing Structure

Although topology optimization can reflect the load transfer path by optimizing the resulting material distribution, this result cannot be directly applied to machining and manufacturing, and it can only provide ideas for subsequent design. In this section, the reconstruction scheme of the car-body bearing structure is determined, and the dynamic performance is checked.

5.1. Design Method of Truss Car-Body Structure Reconstruction

The bearing structure of high-speed EMUs mainly comprises the roof, side wall, bottom frame, end wall, end part, etc. By extracting the topology optimization results of each part of the car body, the basic shape of the new car-body structure of high-speed EMUs is obtained. The basic design principles of each car-body part are as follows. The end wall mainly adopts the triangular bearing structure; the end part is the coupler–seat rear inclined beam structure; the bottom frame mainly considers the longitudinal beam structure in the middle and both sides of the bottom frame; the side wall and the roof adopt the cross-beam structure; and the structure near the supporting point of the car body needs to be strengthened locally. In order to ensure that the vibration mode frequency meets the design requirements, the side wall and upper beam structure are strengthened.
The topology optimization results contain the residual distribution range of materials under different working conditions. However, this result is limited by the conceptual design stage of topology optimization, which does not consider various complex situations in vehicle body operation, such as the counterweight of cables, ventilation ducts, toilets, etc. Therefore, the topology optimization results are more suitable to guide the subsequent detailed design stage.
This process includes measuring various working conditions in the finite element software, examining the surplus material in the topology optimization results, determining each part’s hole position and its sizes and conditions, evaluating multiple conditions considering the multiple and single topological optimization results, and incorporating the welding manufacture process, including the simplification of irregular holes and the identification of each part of the body after obtaining the neat hole position and its size.

5.2. Establishment of Car-Body Geometry Model and Finite Element Model

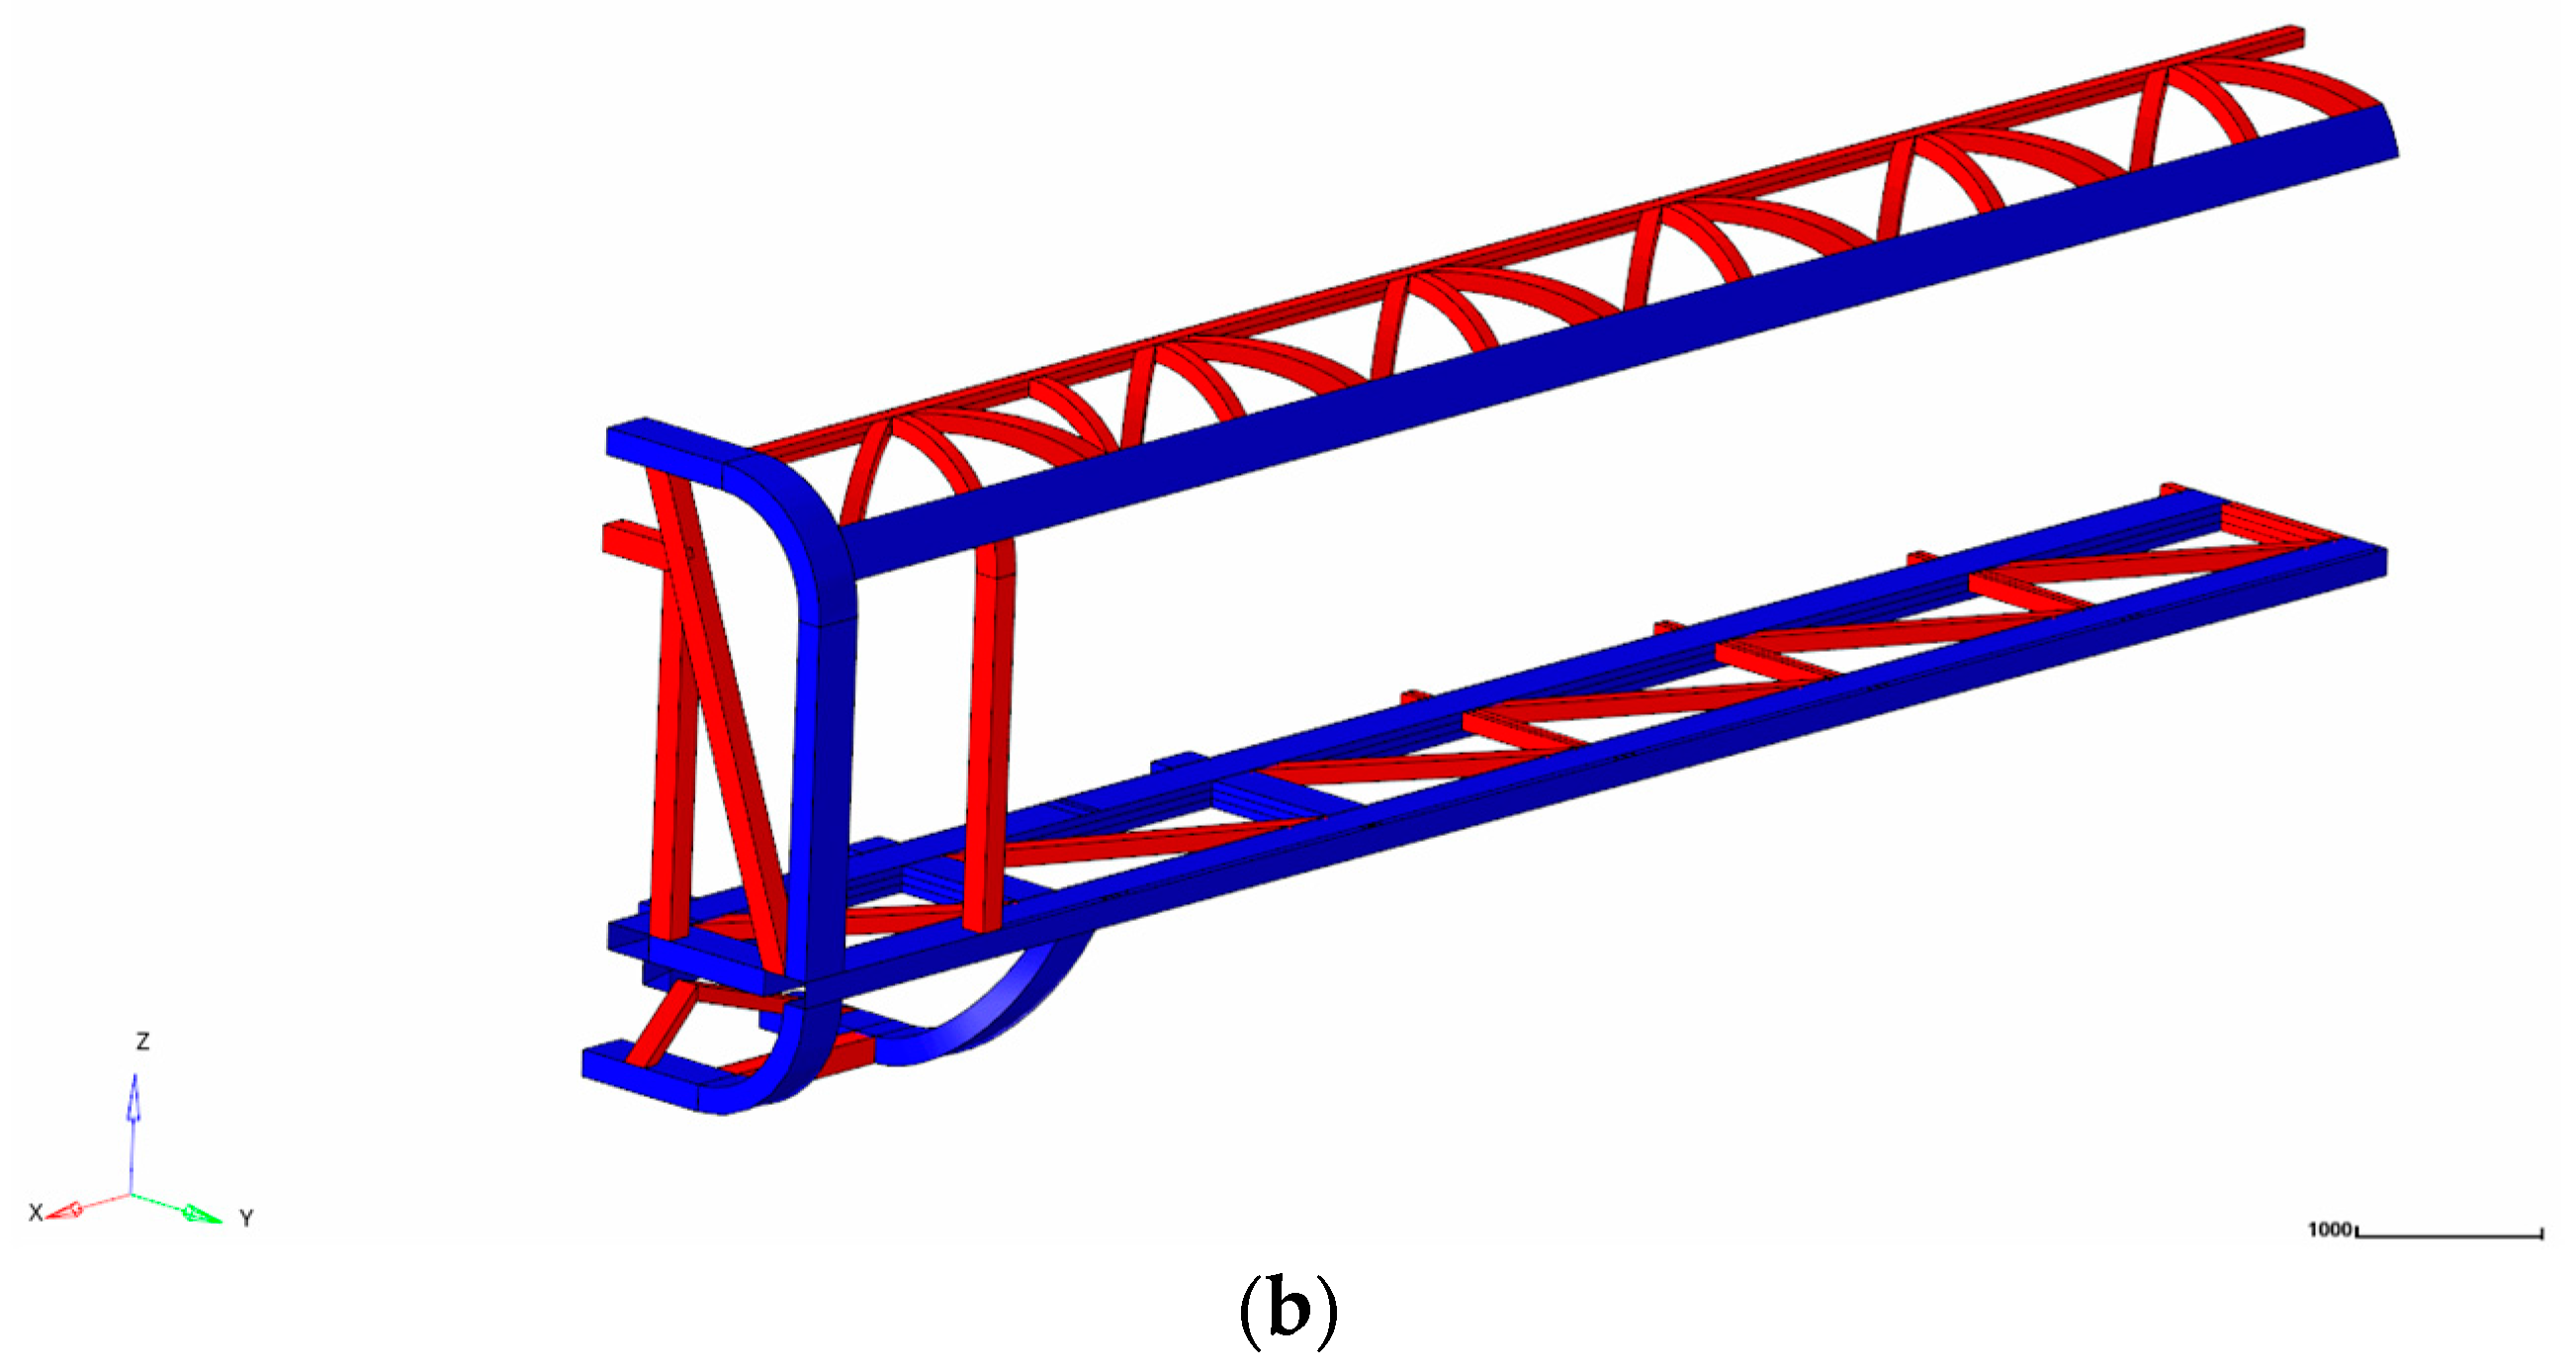
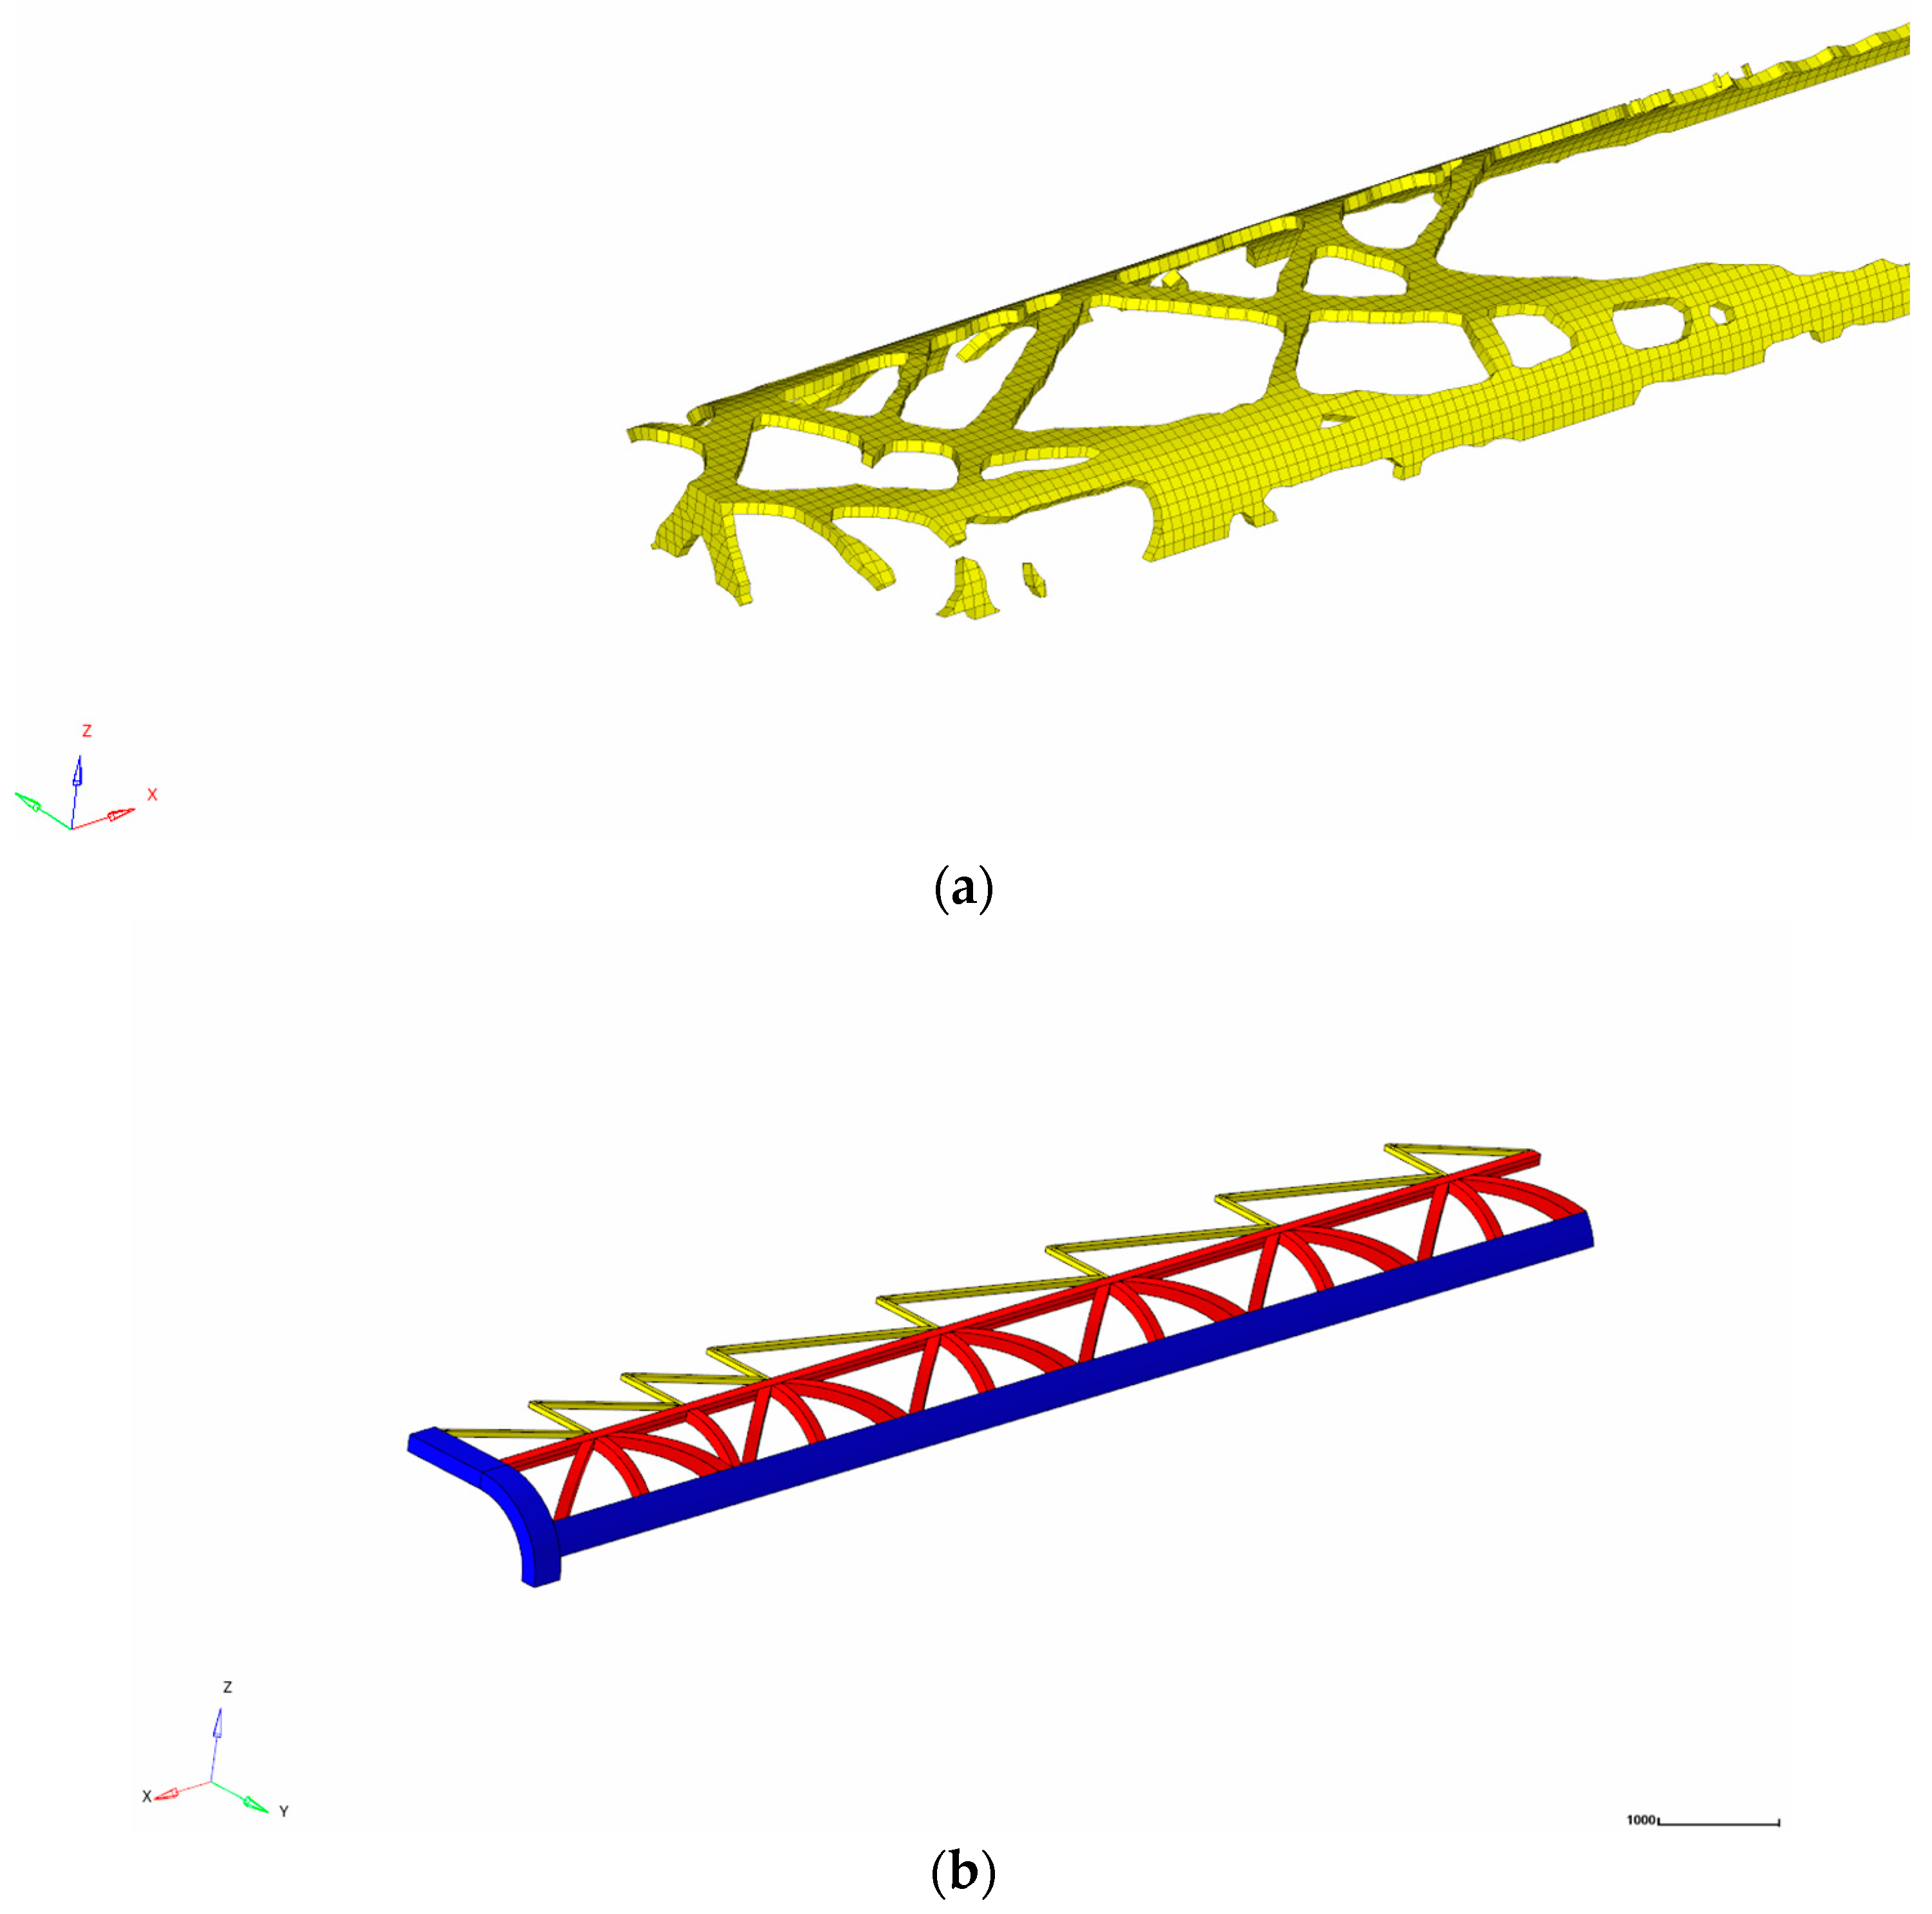
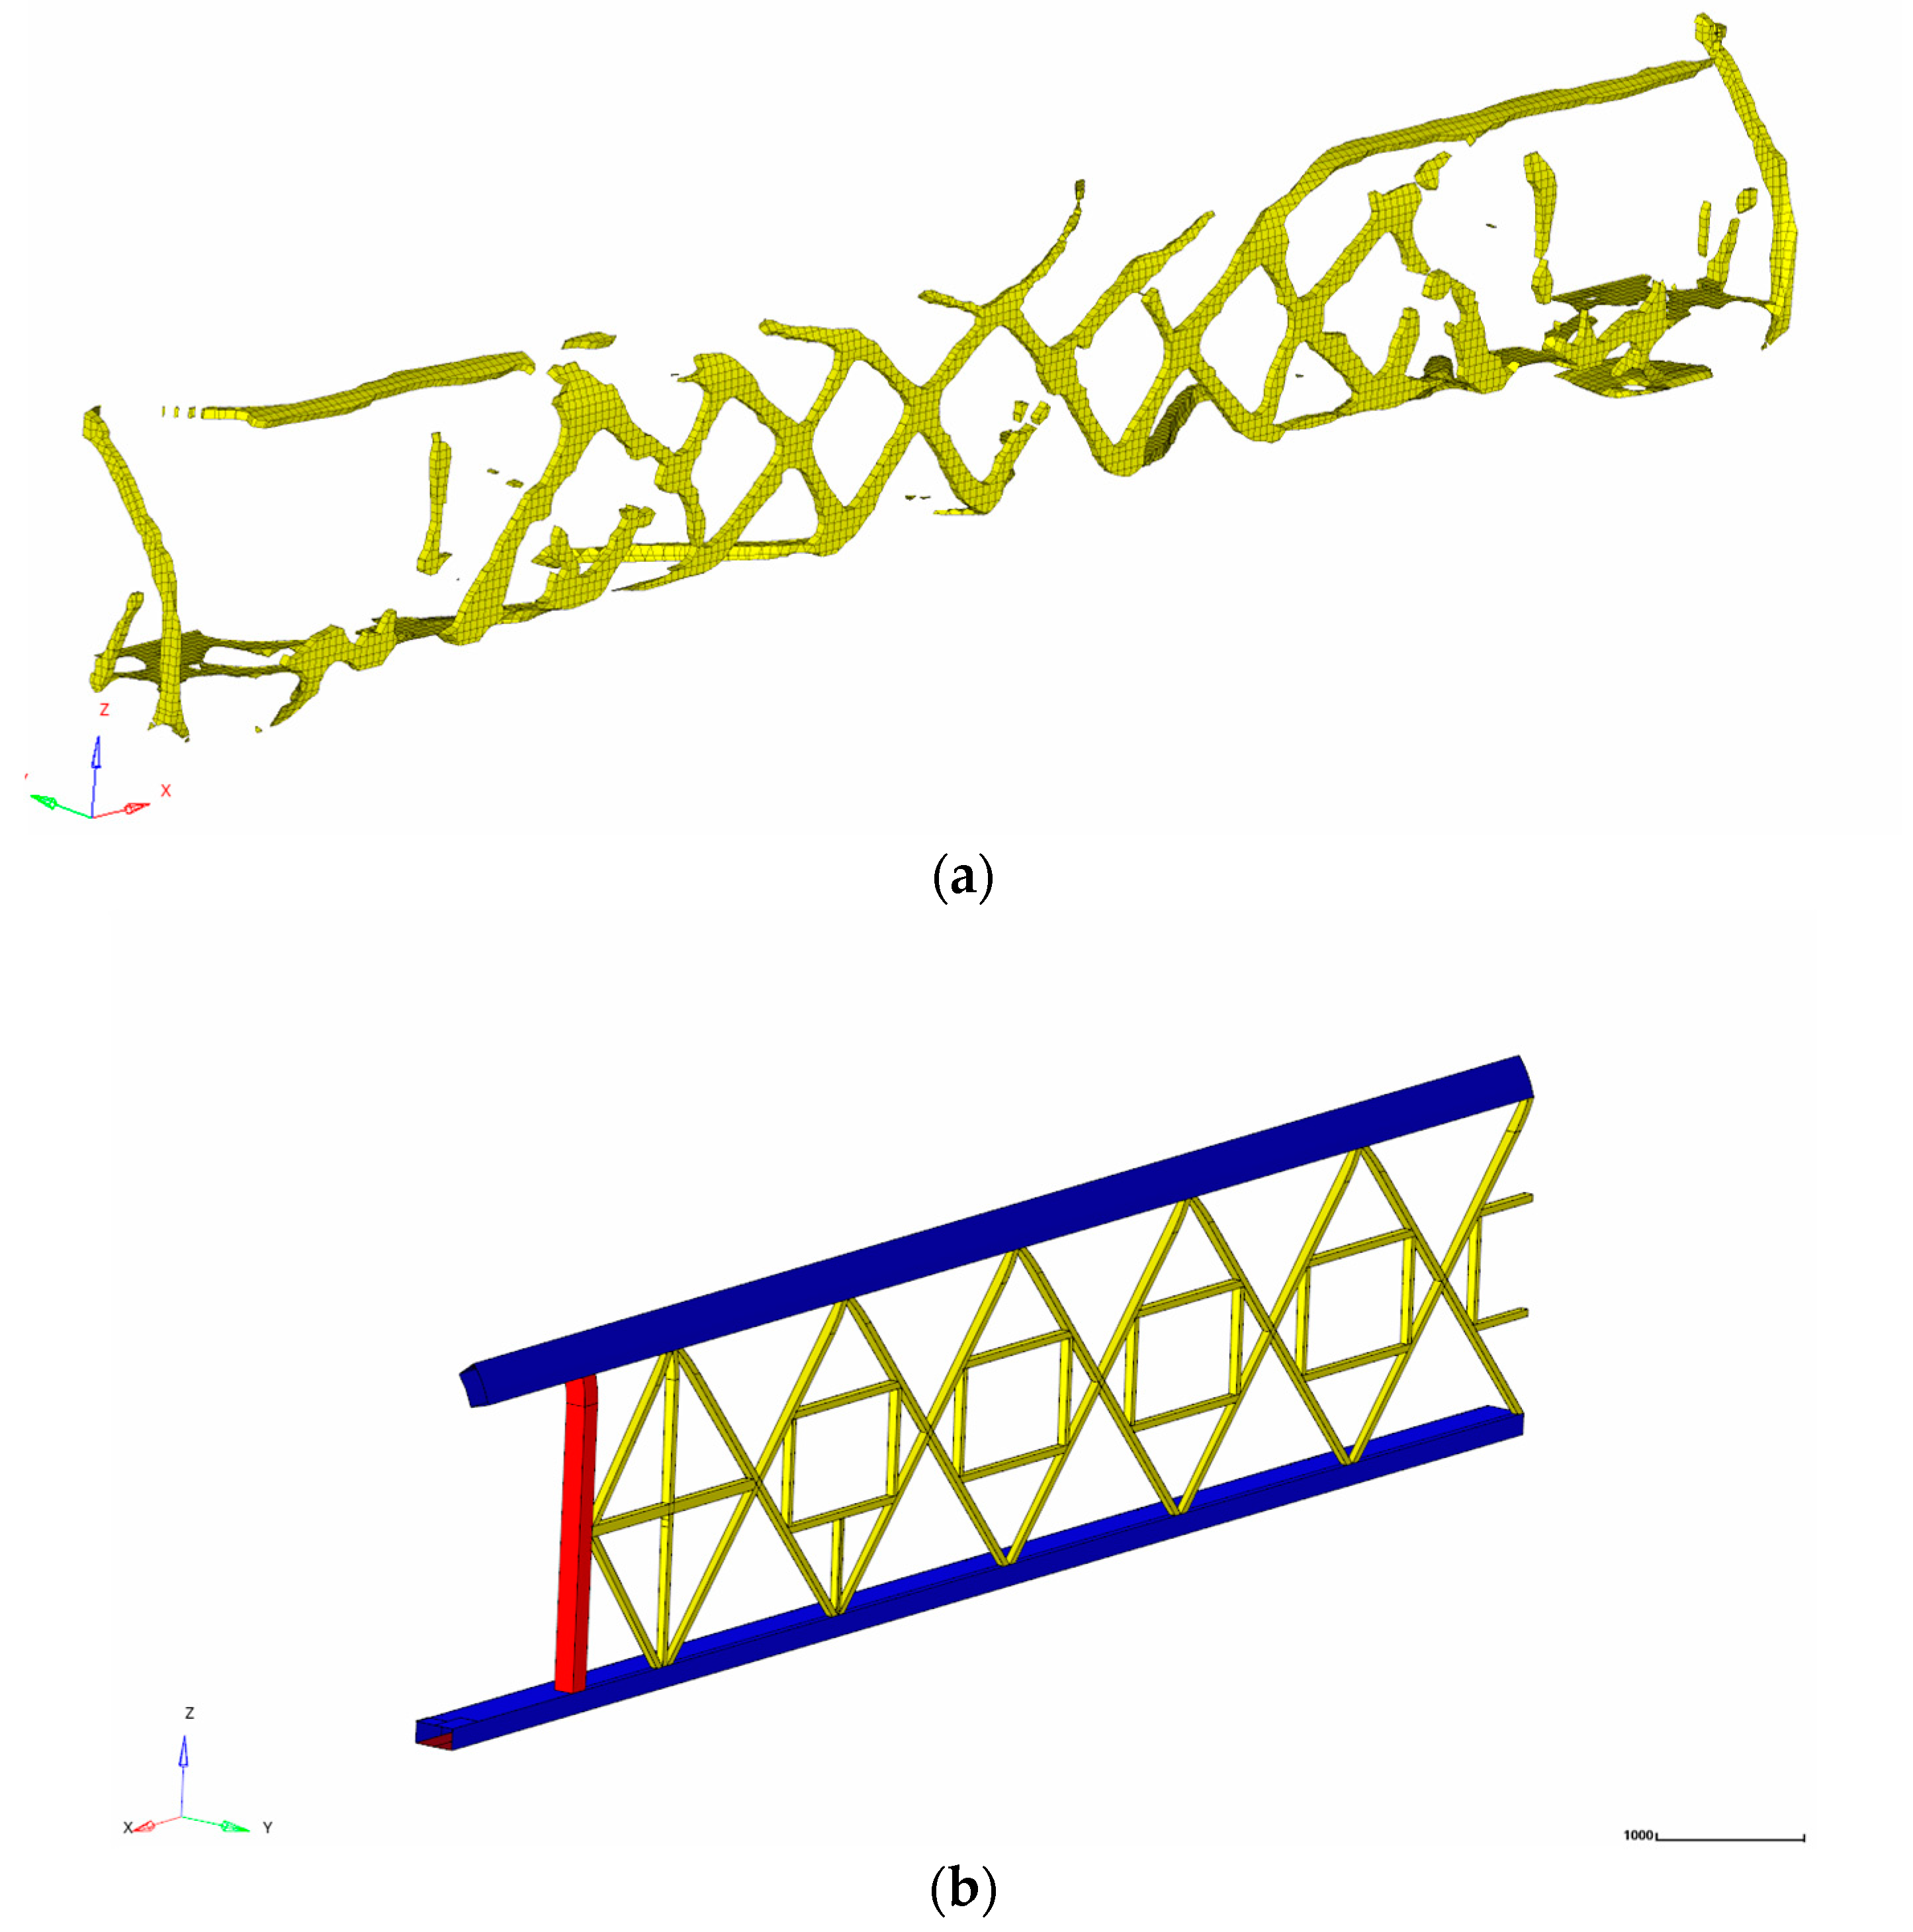
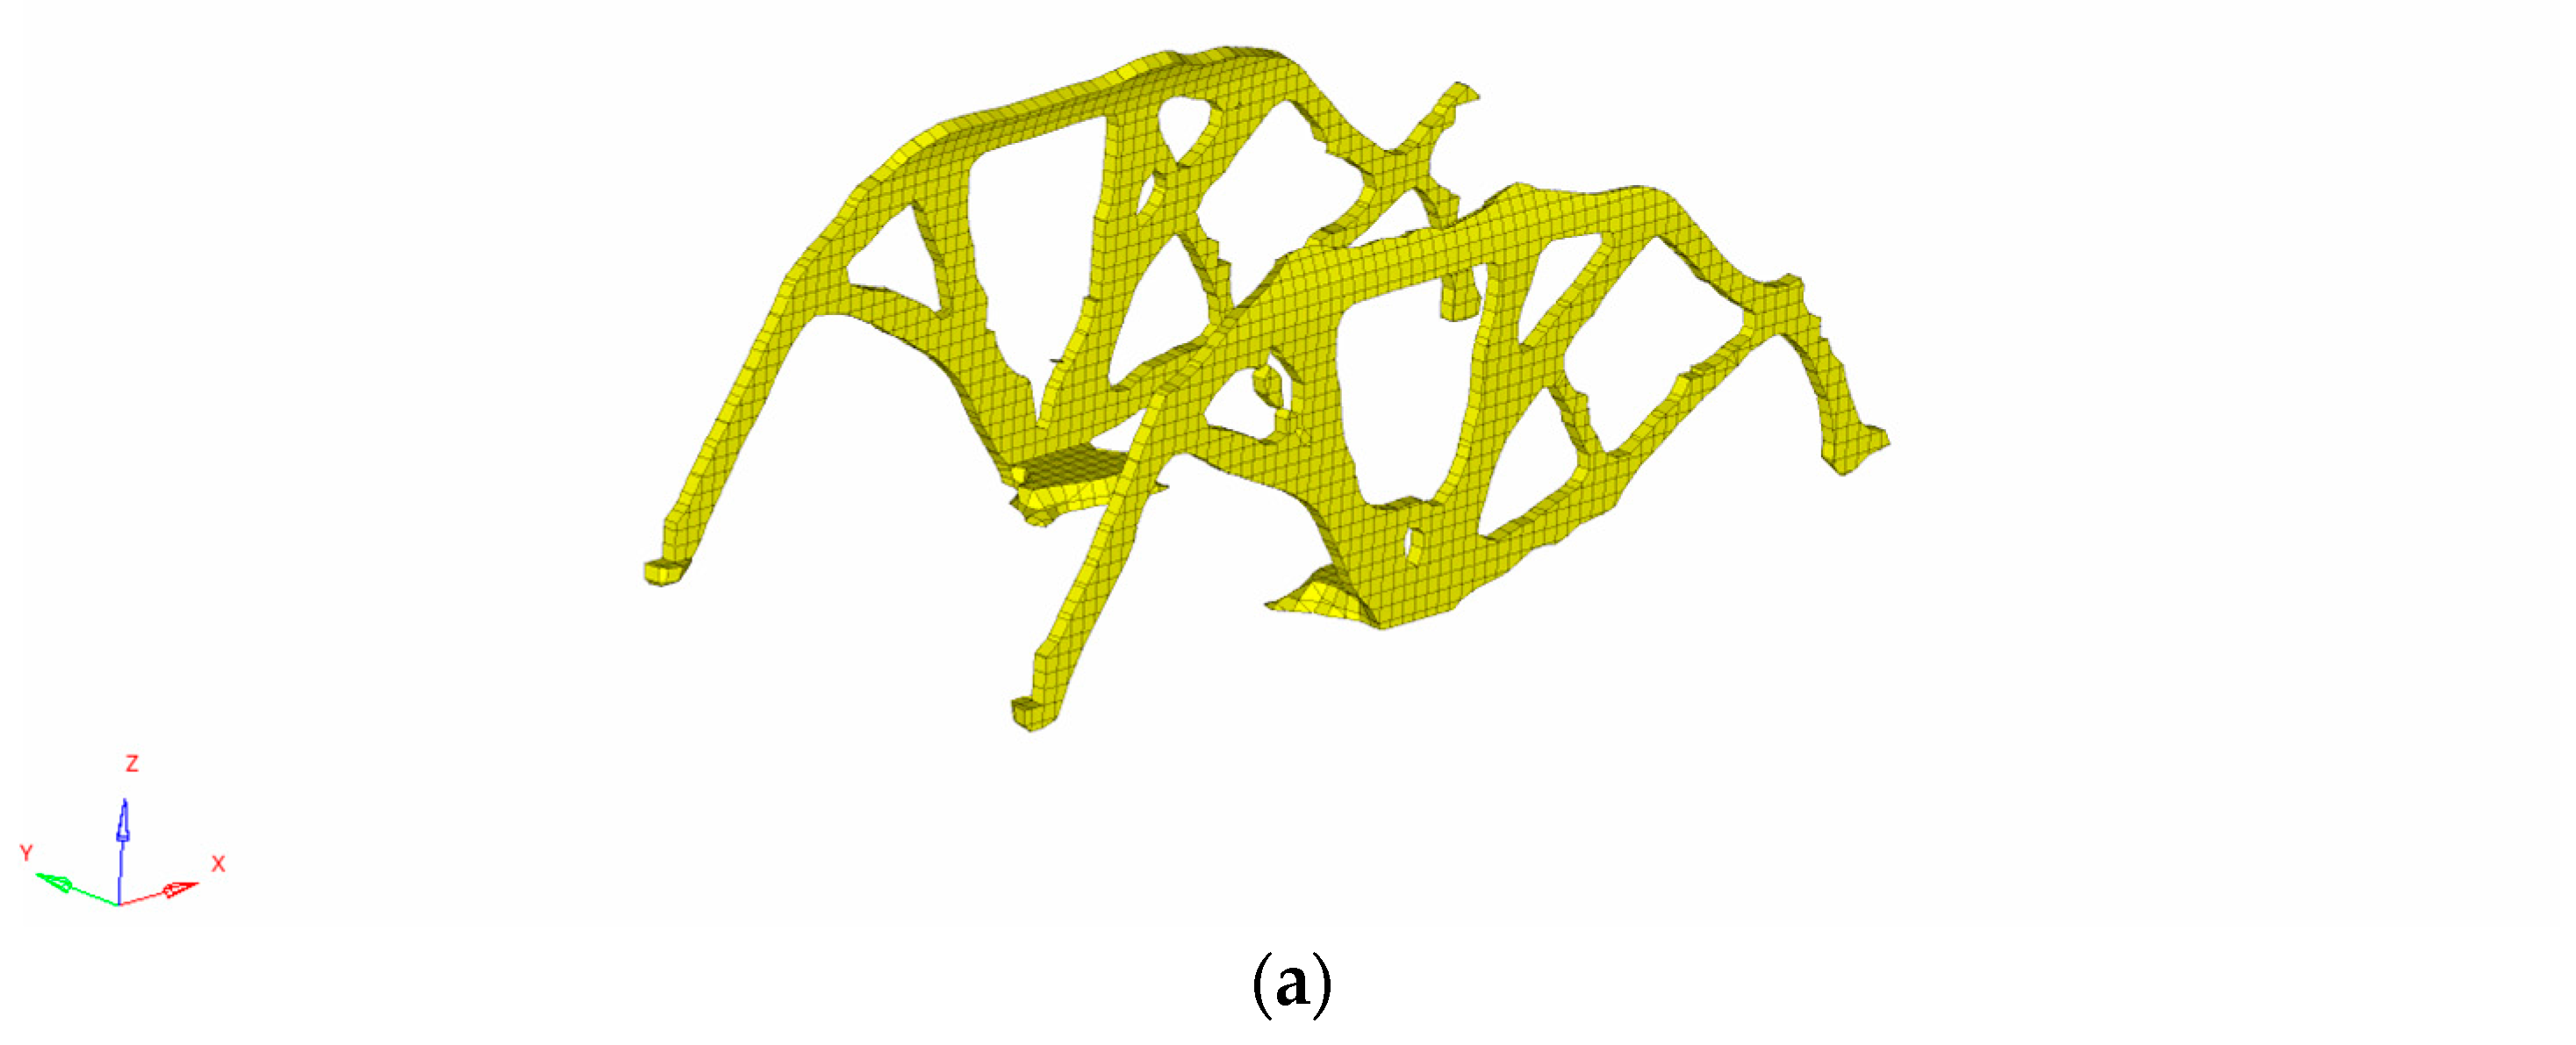
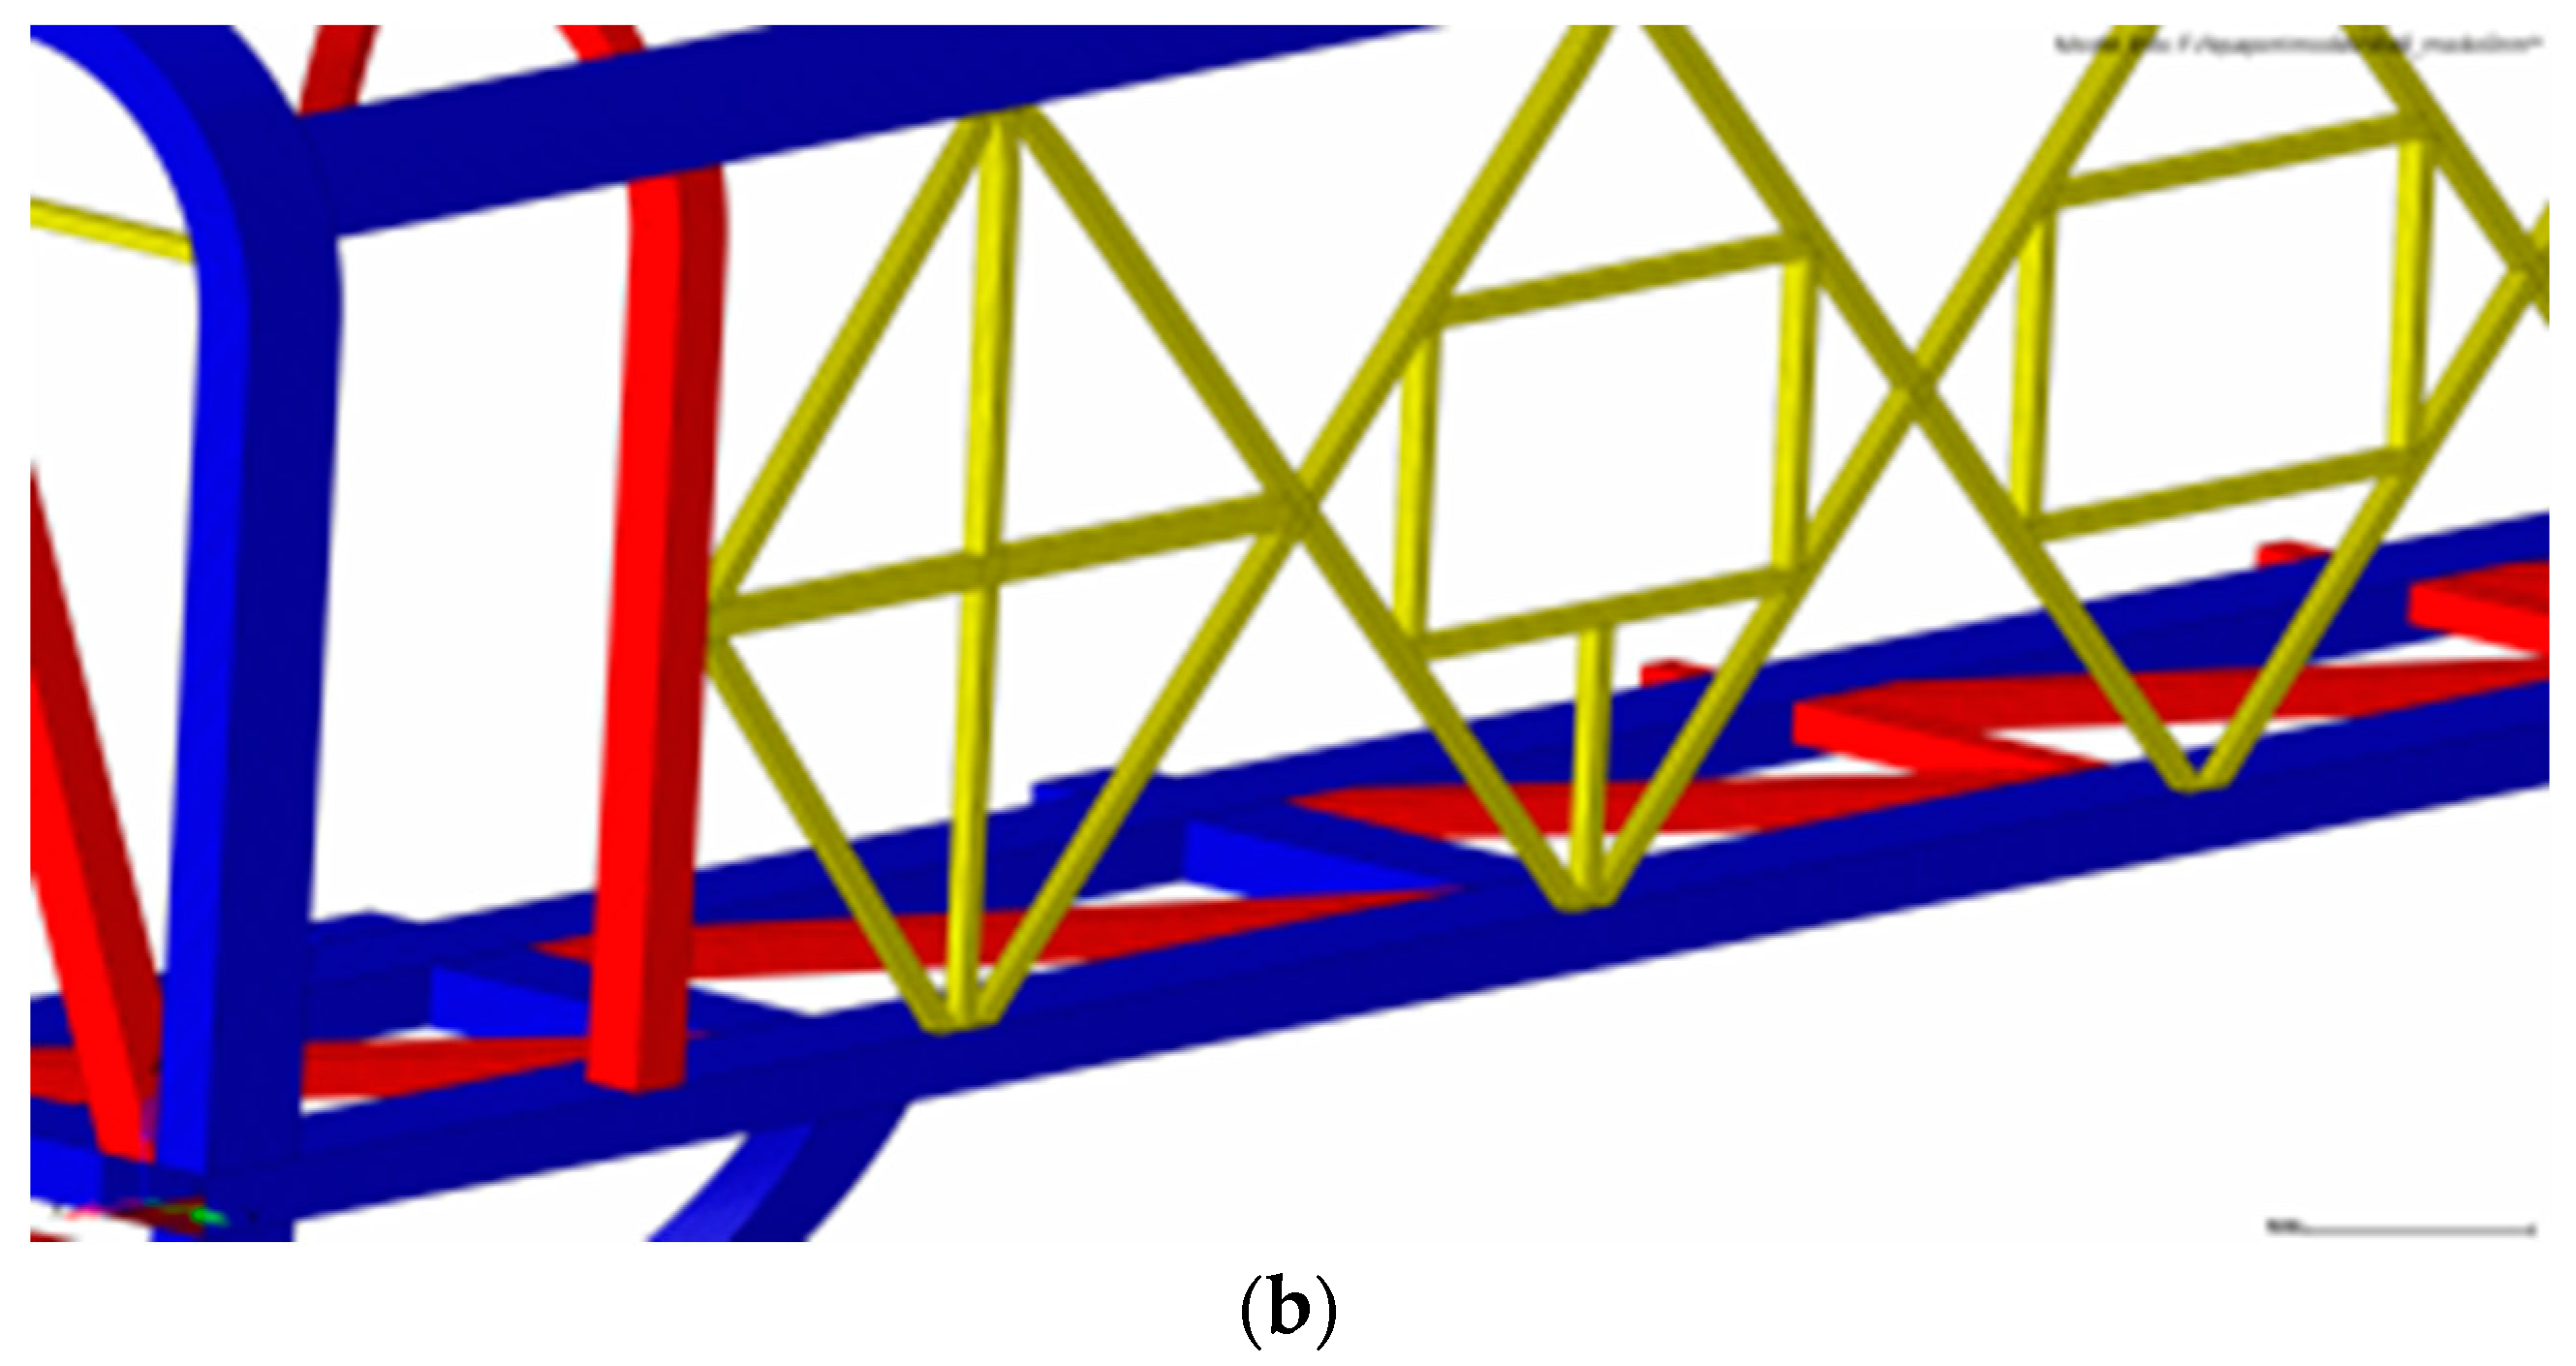
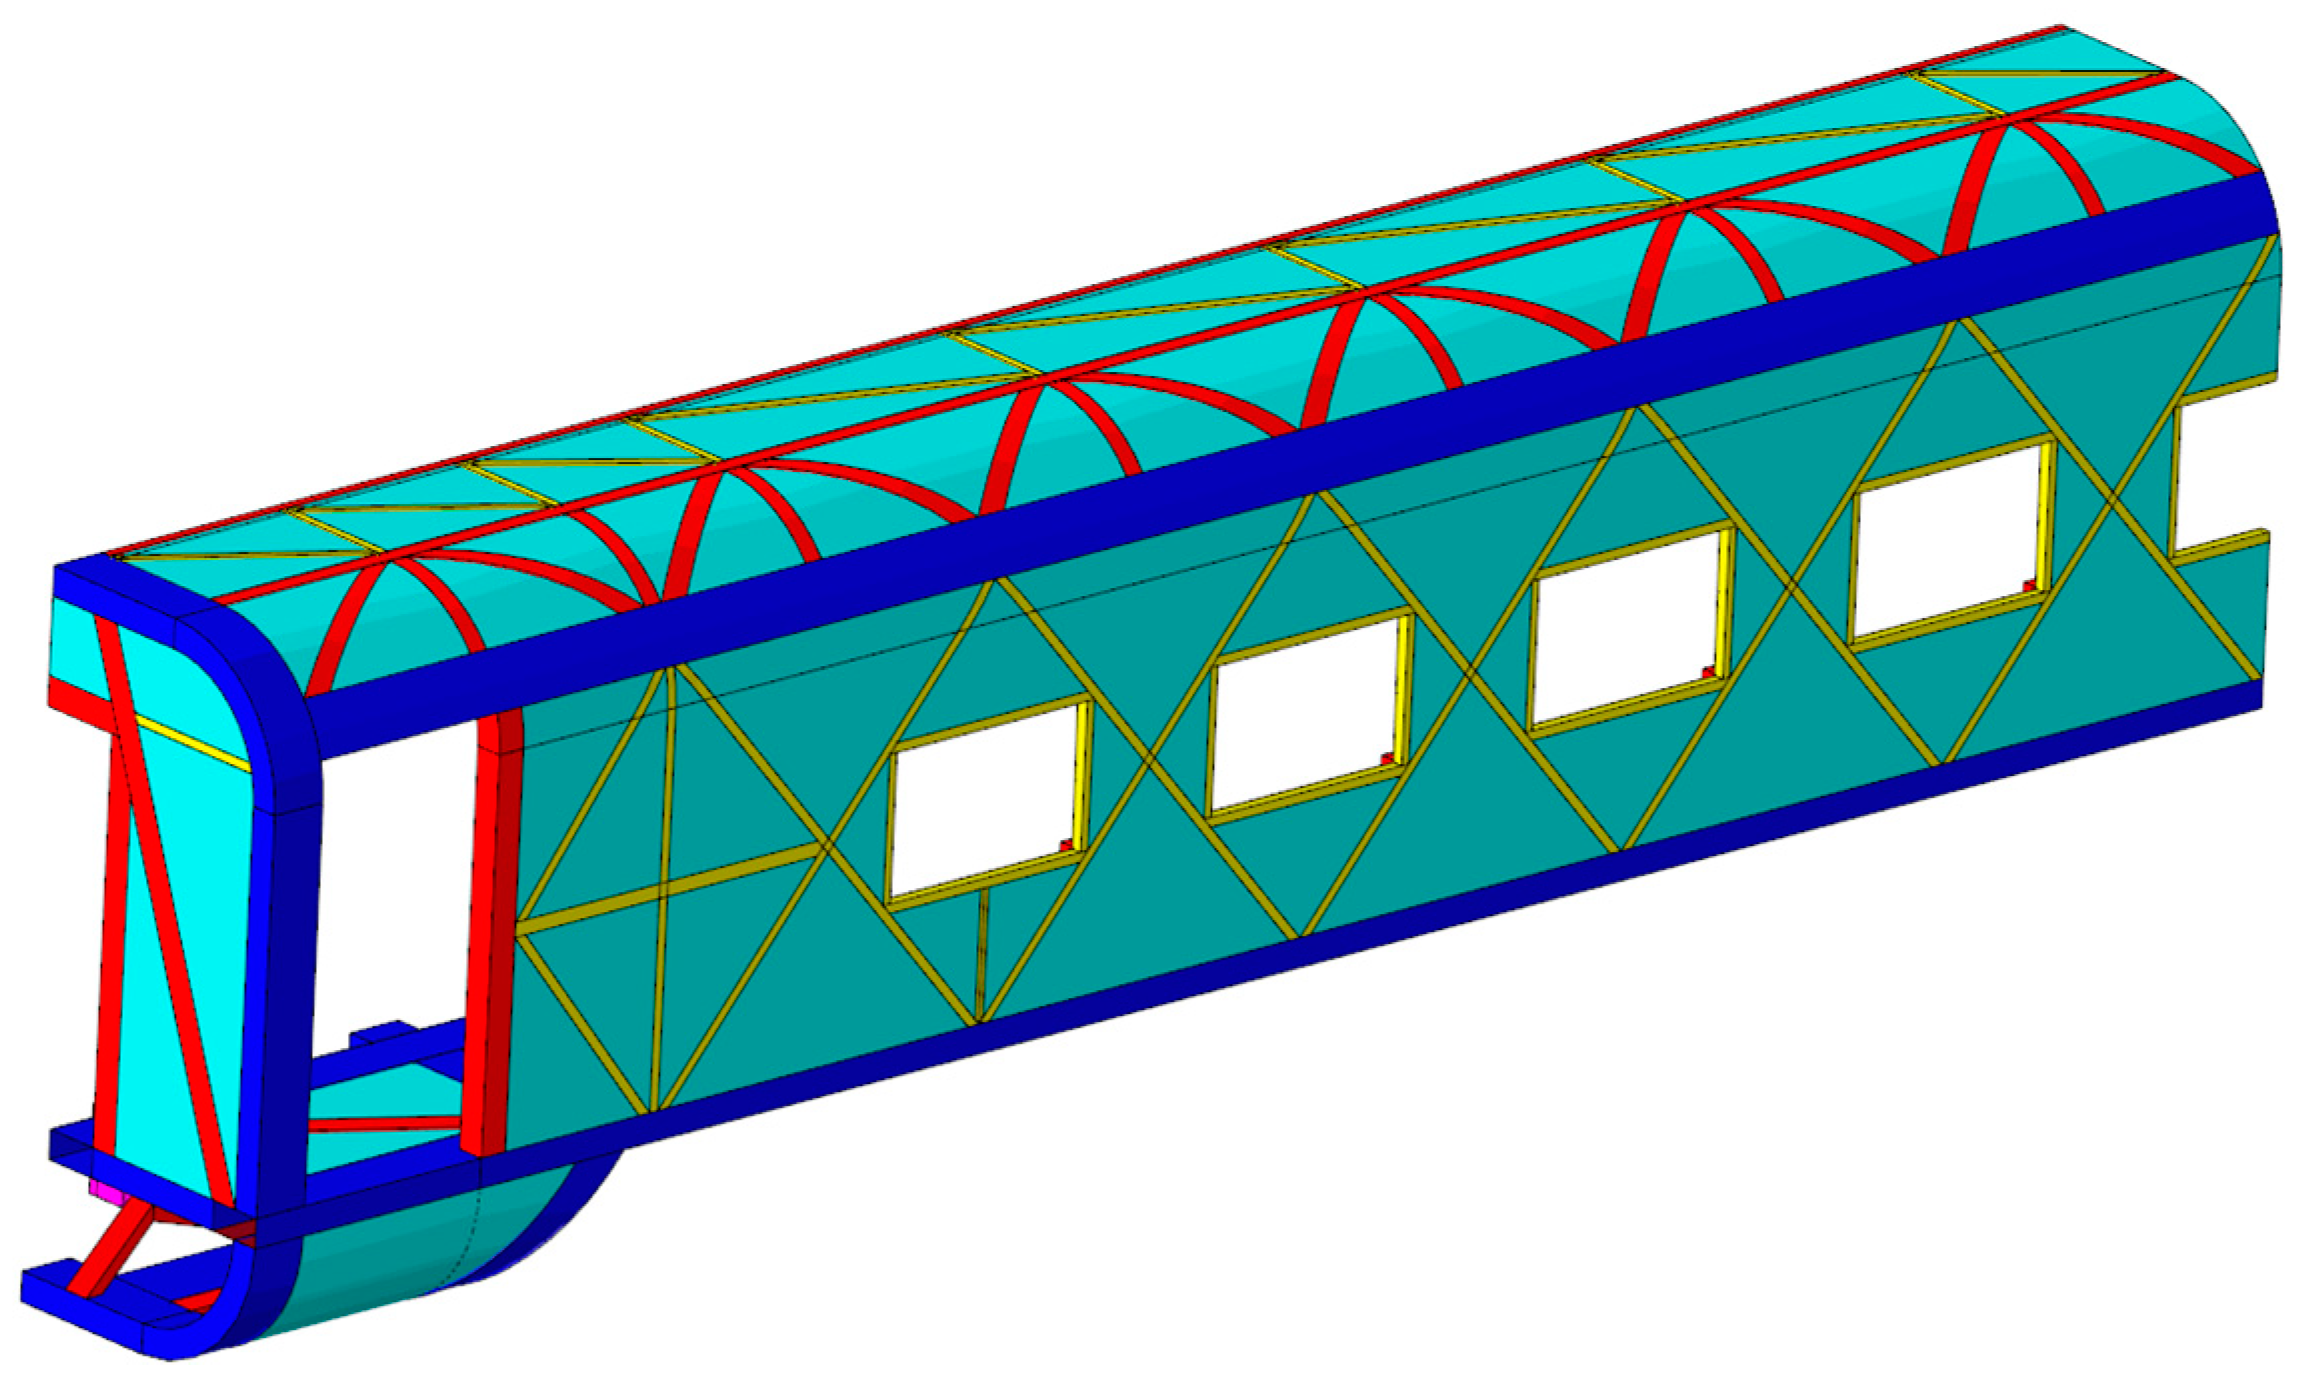
Many factors should be considered in the reconstruction of the truss car-body model. This paper establishes the main bearing structure model of the truss car body based on the basic data of the CRH vehicle contour and topology optimization results. In order to facilitate the subsequent simulation calculation, only a quarter of the car-body model is established, and the comparative modeling of each part of the car body is shown in Figure 15, Figure 16, Figure 17, Figure 18, Figure 19, Figure 20 and Figure 21; different colors are used to distinguish the components.
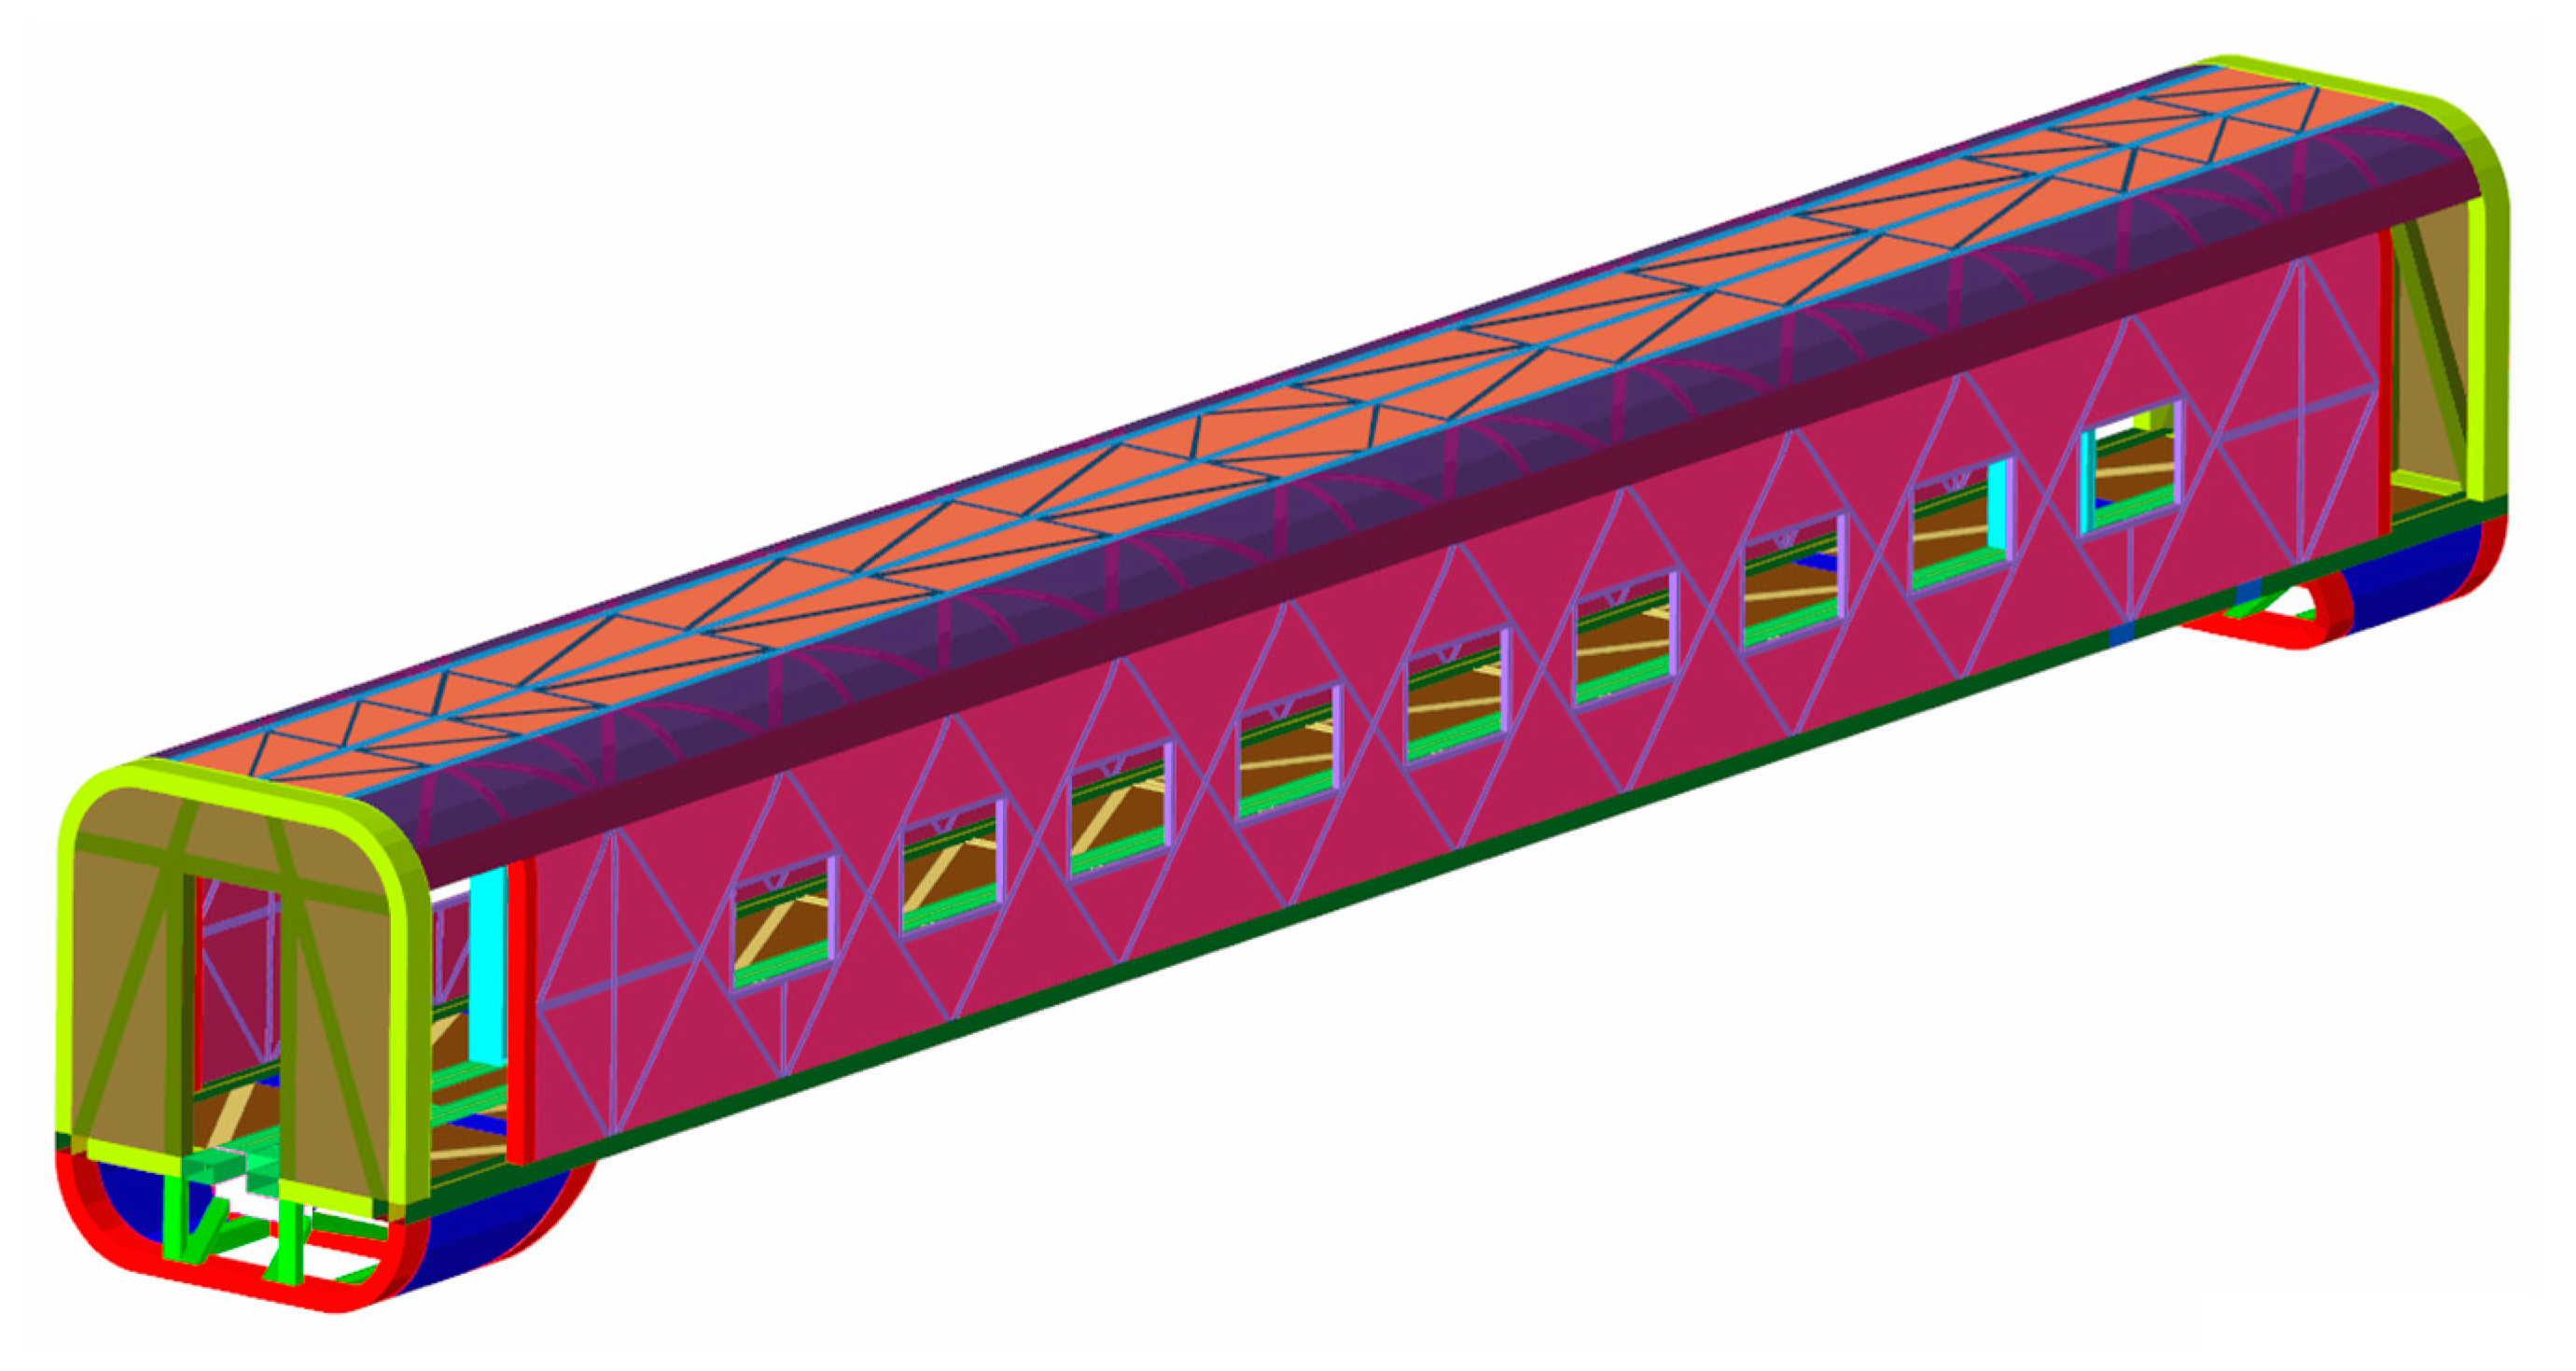
Each part’s topology optimization modeling results are combined to obtain the truss body structure of high-speed EMUs after topology optimization. Figure 22 shows the model diagram of the quarter-truss vehicle. At the same time, to further improve the strength and stiffness of the car body and consider the tightness of the car-body structure, a layer of aluminum alloy skin with a thickness of 2 mm is added to the inner and outer surfaces of the car body. The quarter-body model with the skin added is shown in Figure 23. Different colors are used to distinguish the components.
The 3D model of the vehicle is imported into the finite element modeling software, and the car-body structure model is meshed. The mesh size is 20 mm × 20 mm, and the mesh shape is dominated by four-node thin-shell elements, totaling 1,865,412 elements and 1,772,788 nodes. The vehicle body model after finite element dispersion is shown in Figure 24. According to the measurement, the weight of the car body after topology optimization is 8.62 t. According to the relevant information, the weight of a CRH EMU’s body is about 10.5 t. Compared with the CRH EMU’s body, the weight of the reconstructed car body is reduced by 1.88 t from the original 10.5 t, which is about 18%.

5.3. Finite Element Analysis of the Reconstructed Model

In the above simulation calculation, the weight lifted by the off-board equipment and the weight of the passengers are not considered, and the traction transformer, auxiliary converter, sewage box, compressor, exhaust air cylinder, brake module, and other suspension equipment are not set separately. In this simulation analysis, it is necessary to consider the counterweights of cables, lighting equipment, ventilation ducts, toilets, inner end walls, tea rooms, seats, and other car components. However, the car-body structure design is only in the conceptual design stage, and the suspension position of the mass equipment has yet to be determined, so the mass equipment and the cable and other equipment are set by uniformly distributing the mass points. The reference design quality of the car-body structure is shown in Table 6.
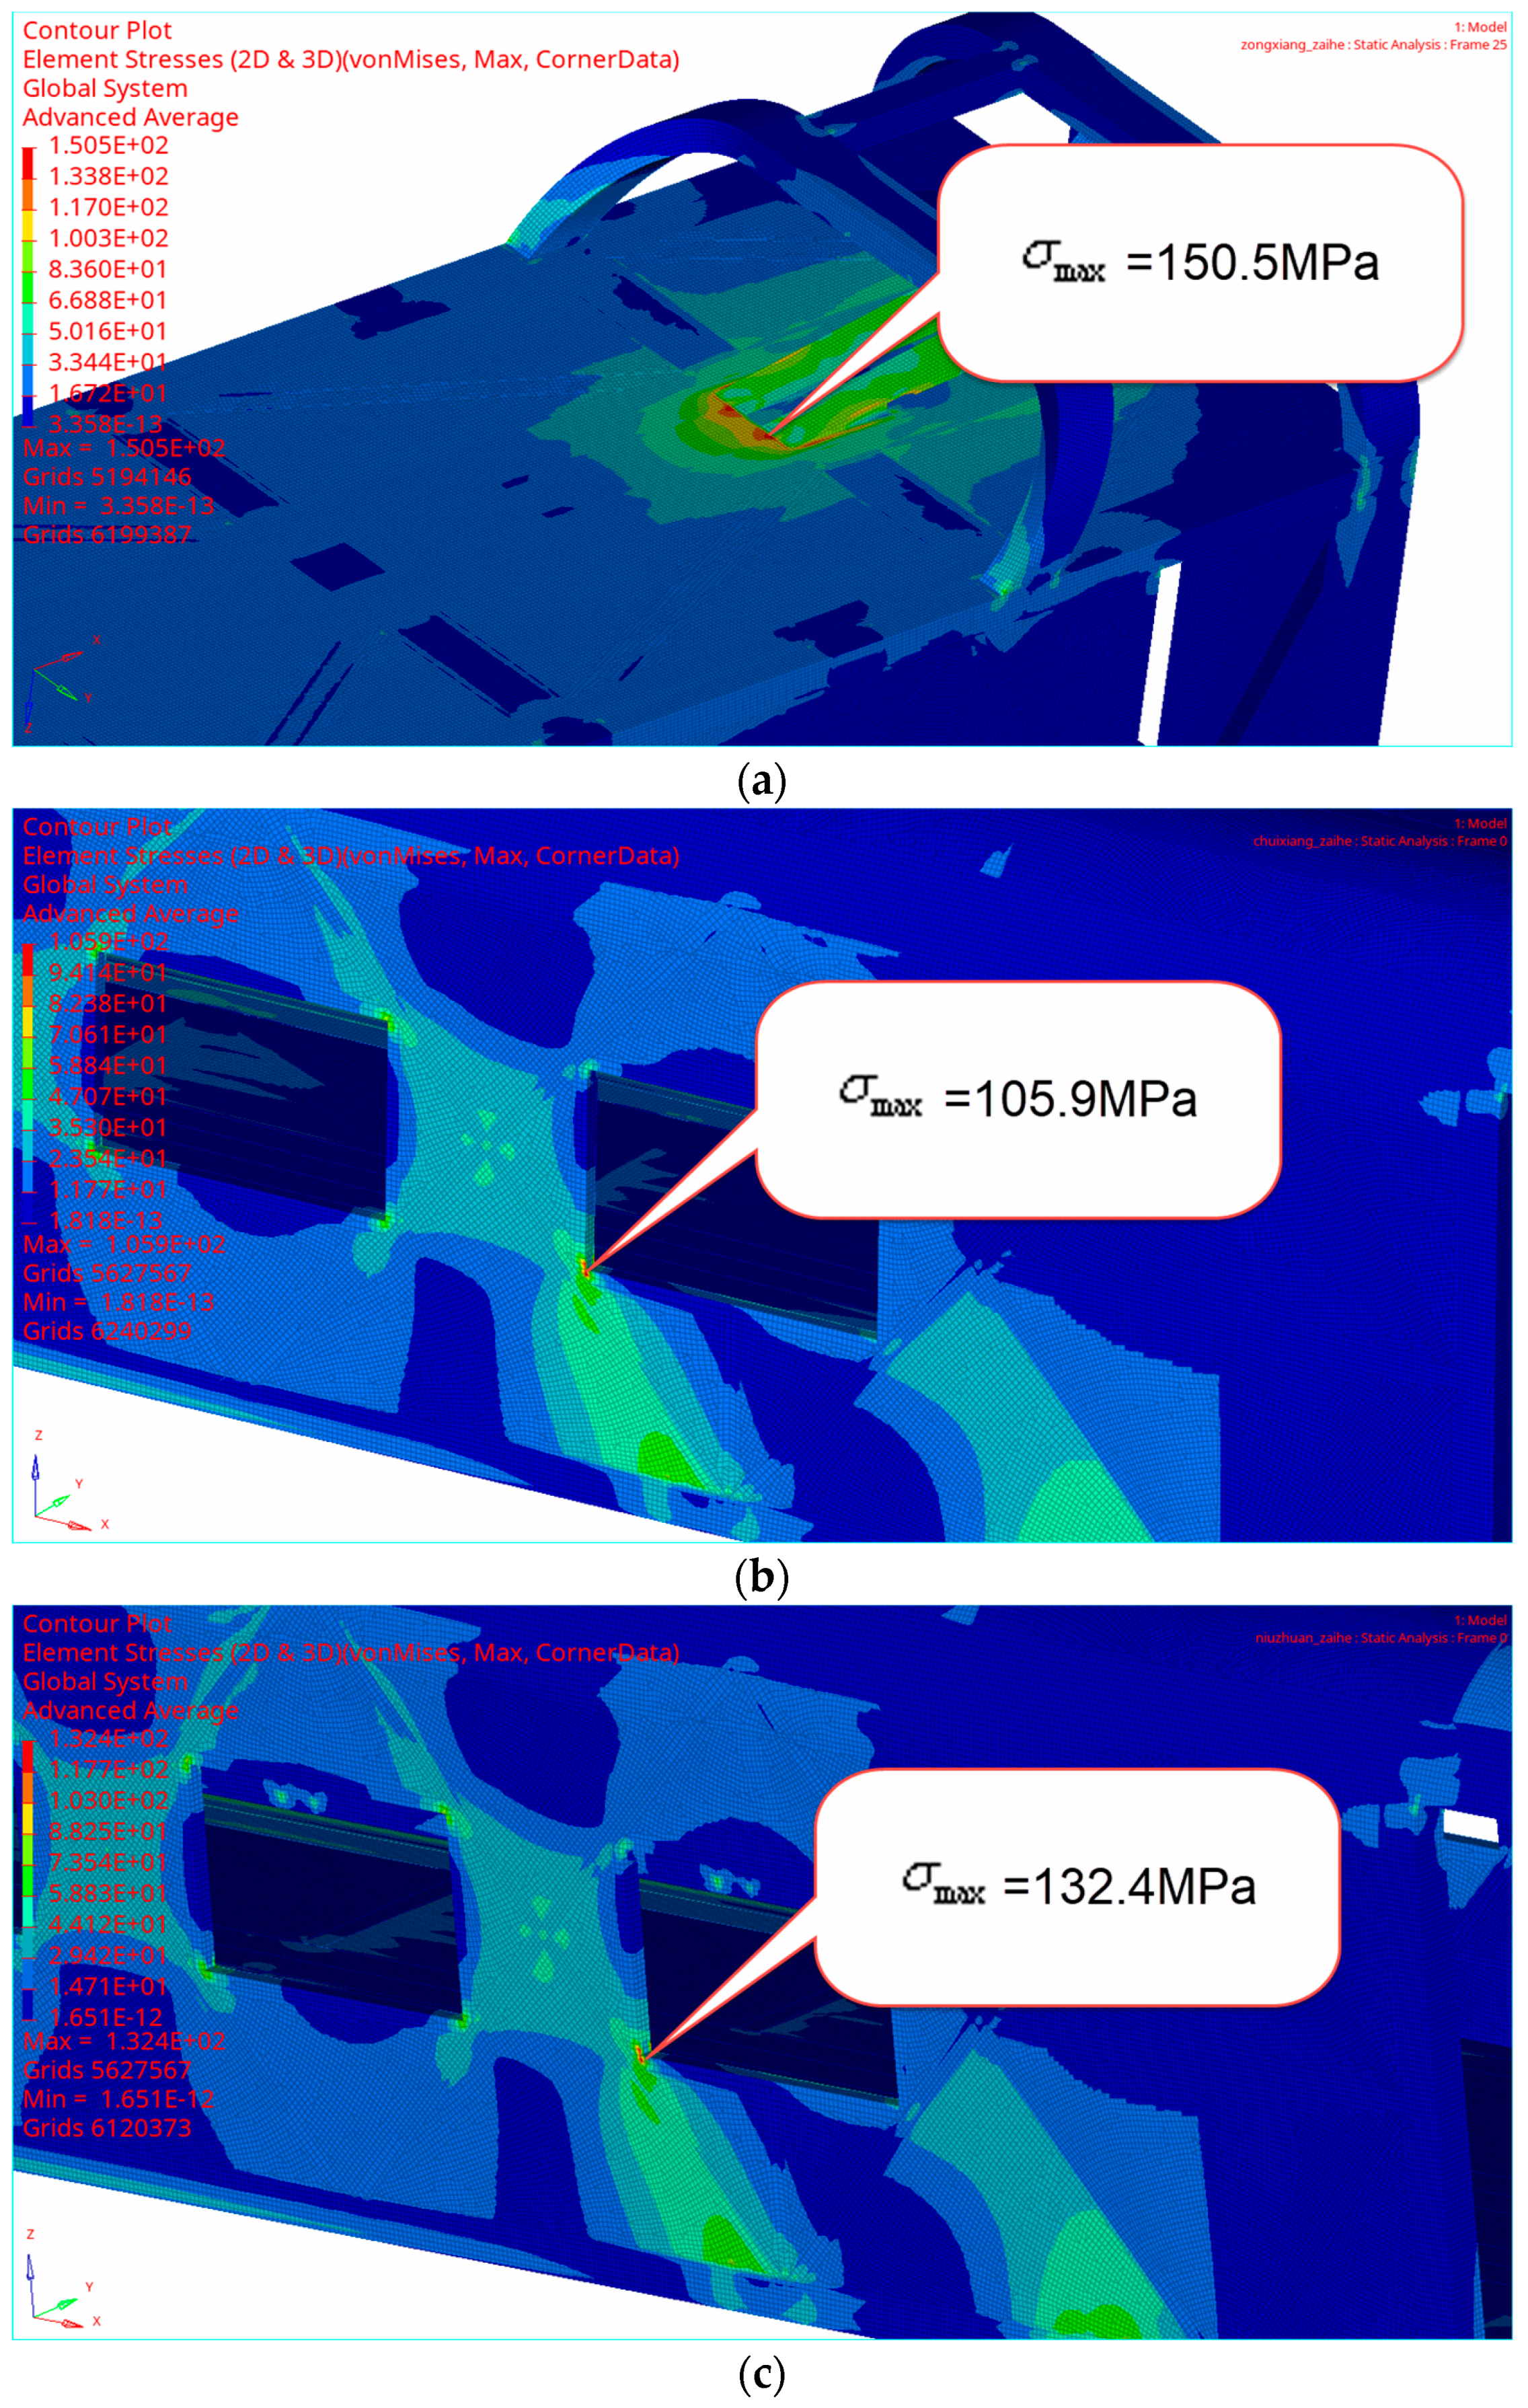
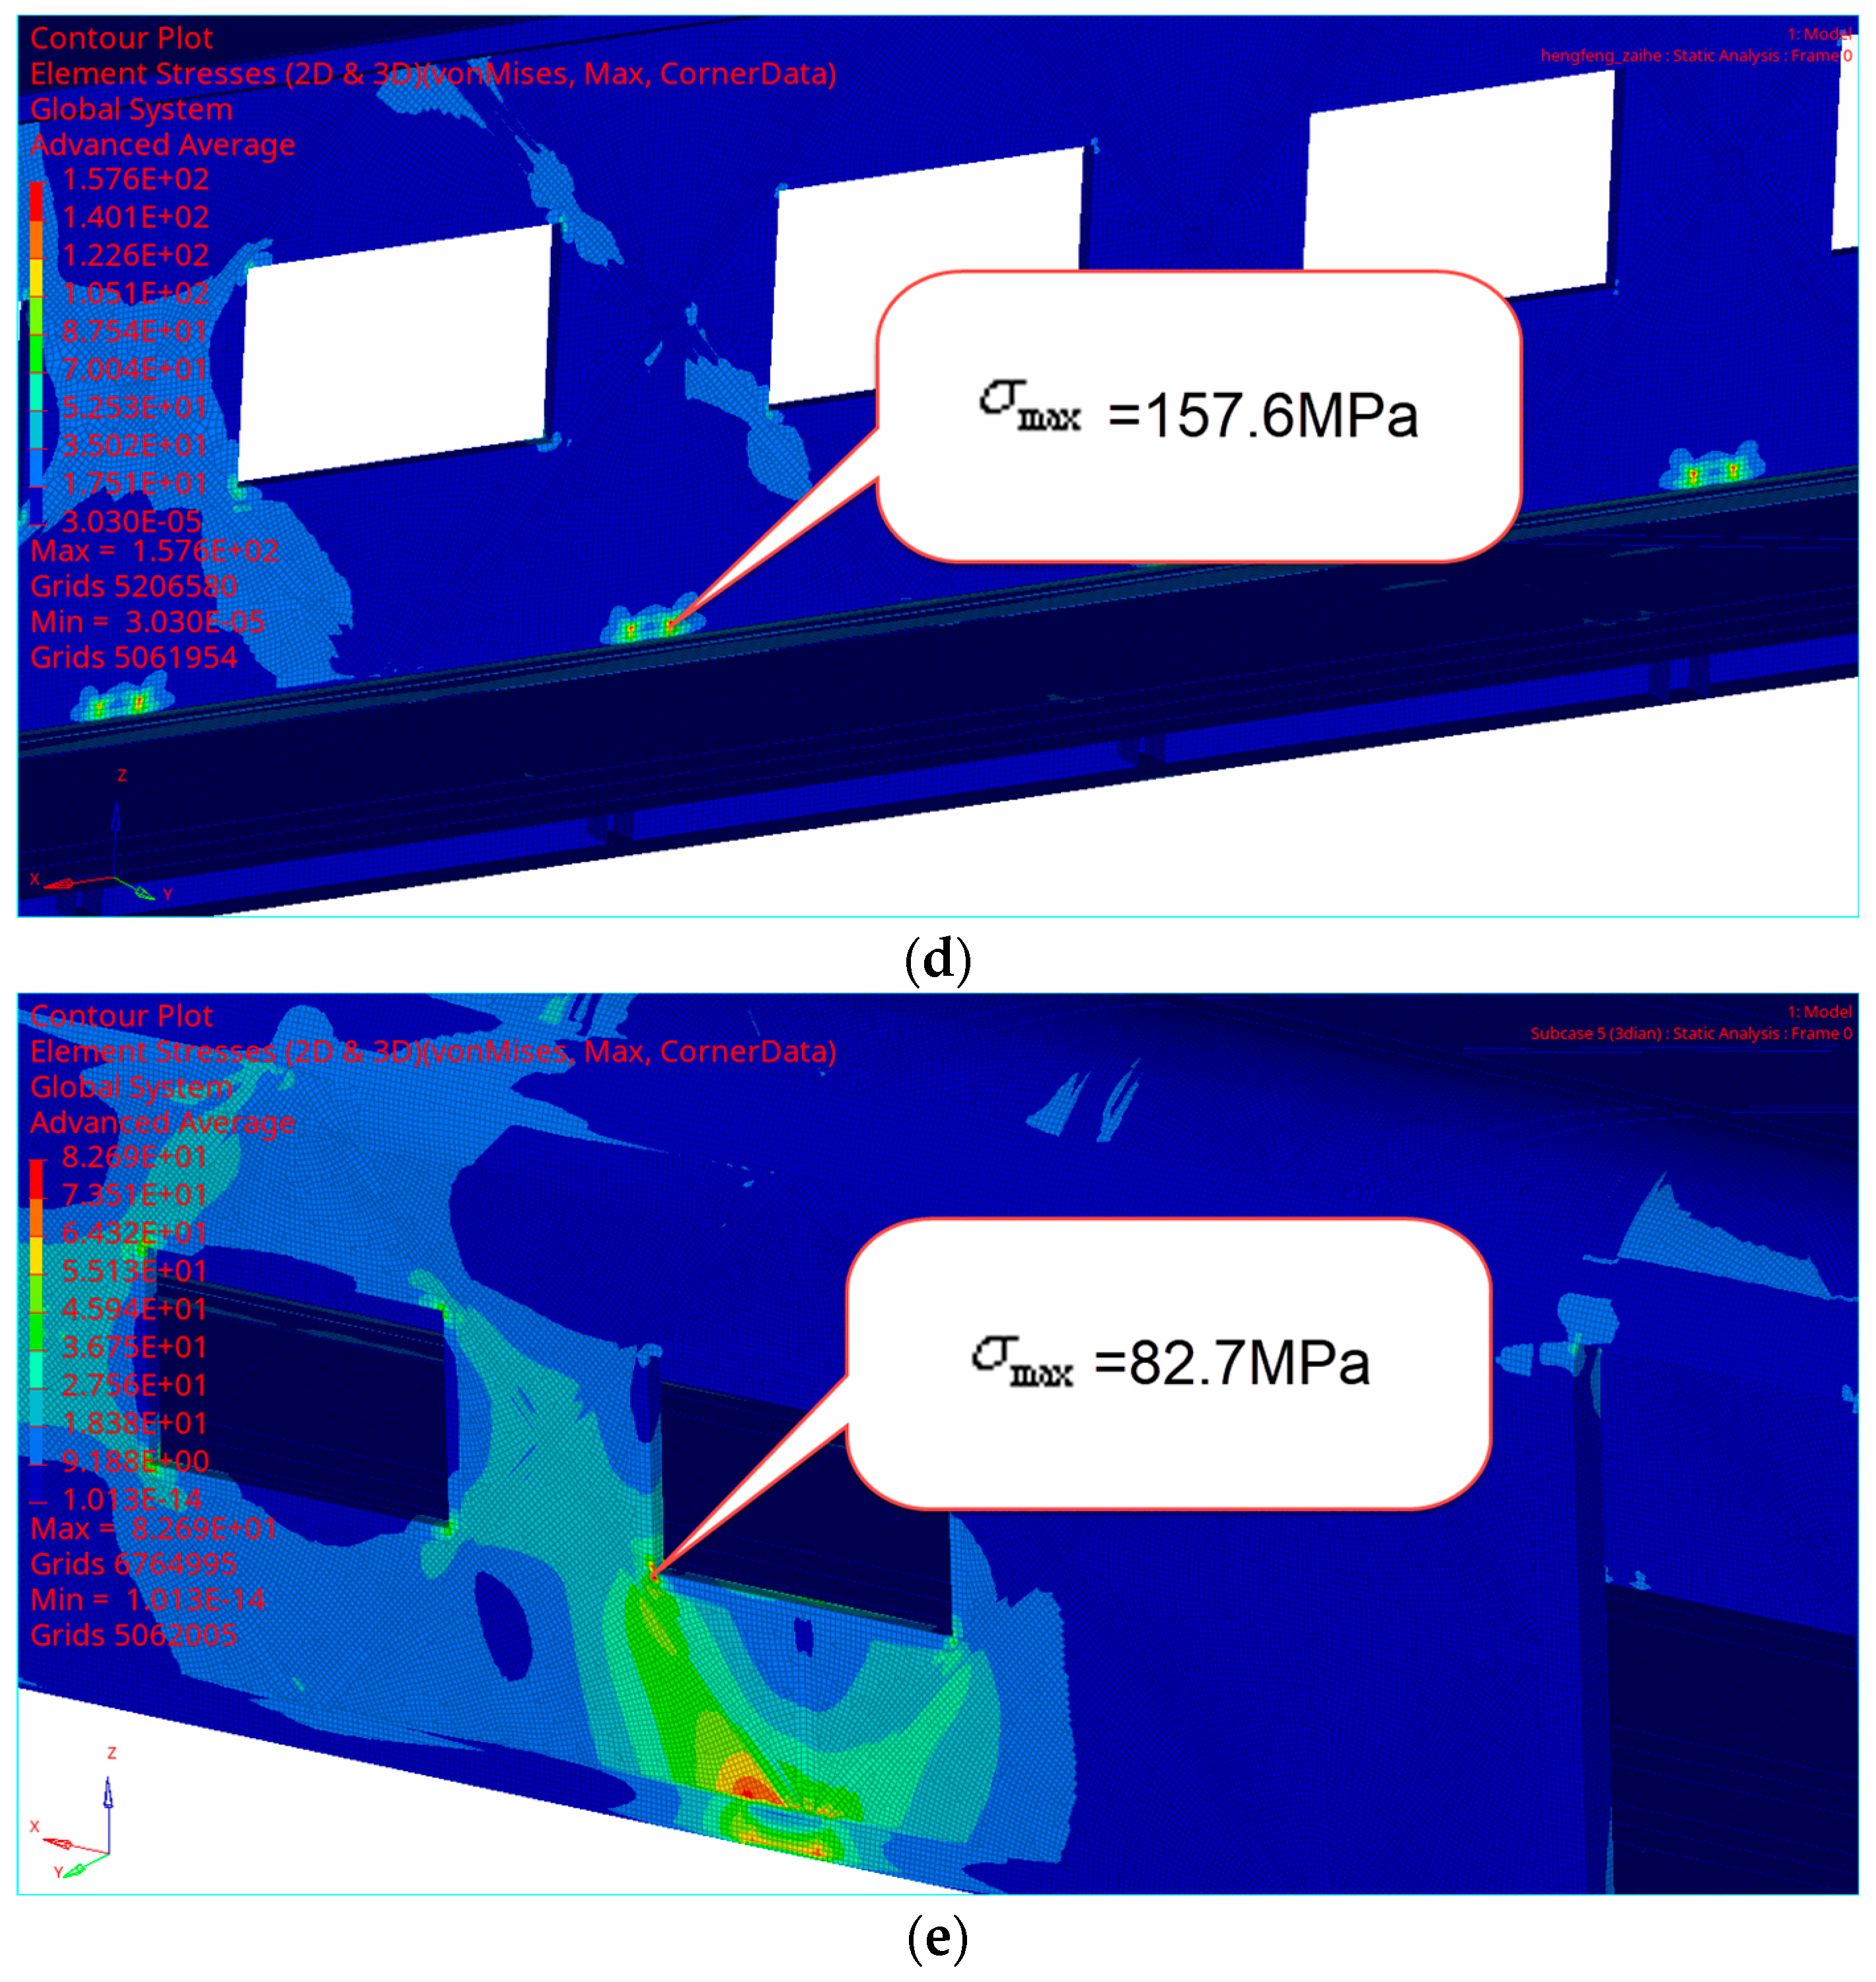
A load and constraint are applied to the reconstructed finite element model of the car-body structure, and the simulation solution is carried out. The stress cloud diagram of the truss vehicle structure under different working conditions is obtained. The calculation results are shown in Figure 25.
According to the calculation results, the maximum Von Mises stress of the car-body structure under these five working conditions is 157.6 MPa, less than the allowable stress of the material of 215 MPa. The maximum stress points are mainly concentrated at the window corner, the joint between the rear seat of the couplers and the bottom frame, and the corner of the side wall.

6. Conclusions

This paper uses topology optimization design for the car-body structure design domain based on CRH profile data. The following conclusions are drawn from the research analysis.
(1) The geometry model is established based on the contour size of the car-body structure. The design space of the topology optimization design domain is determined, and the finite element model of the vehicle body is established. The finite element analysis of the initial design domain is completed, and the correctness of the design space is checked, which provides a comparative reference for the subsequent topology optimization calculation results.
(2) The input parameter values of the design variables, constraints, and objective functions of topology optimization are determined, and the mathematical model of topology optimization is established. In the topology optimization design domain of the car-body structure, the topology configuration of the car-body structure is obtained by performing the topology optimization of the single and multiple operating conditions, respectively.
(3) The truss-body bearing structure is reconstructed based on the topology optimization results. The weight of the reconstructed structure is 8.6 t, which is about 18% lower than that of the current EMU structure in operation. The finite element analysis of the reconstructed truss car-body structure shows that the strength of the structure meets the requirements of the corresponding standards.

Author Contributions

C.L. and T.Z. were responsible for the whole experiment; K.M. wrote the manuscript; H.D., M.S. and P.W. carried out the topology optimization method and the numerical simulations. All authors have read and agreed to the published version of the manuscript.

Funding

This study was supported by the Science and Technology Research and Development Plan Project of China National Railway Group Co., Ltd. (P2020J024), the Sichuan Outstanding Youth Fund (2022JDJQ0025), and the Science and Technology Research and Development Plan Project of China National Railway Group Co., Ltd. (2022CDA001).

Institutional Review Board Statement

Not applicable.

Informed Consent Statement

Not applicable.

Data Availability Statement

Data available on request due to restrictions.

Conflicts of Interest

Authors C.L. and K.M. are employed by the company CRRC Changchun Railway Vehicles Co., Ltd. The remaining authors declare that the research was conducted in the absence of any commercial or financial relationships that could be construed as a potential conflict of interest.

References

  1. Ding, S.S. Research on Key Technology of High-Speed Train Body Design. Ph.D. Thesis, Beijing Jiaotong University, Beijing, China, 2016. [Google Scholar]
  2. Zhang, Q.G.; Qiao, K.; Cao, Y. The development of foreign high-speed double decker EMU and its inspiration to China. China Railw. 2018, 7, 103–107. [Google Scholar] [CrossRef]
  3. Liu, C.Q.; Wang, L. 400 km/h cross-country interconnection high-speed EMUs. Electr. Drive Locomot. 2020, 2, 1–6. [Google Scholar] [CrossRef]
  4. Deng, H.; Zhang, G.Q.; Zhang, Y.; Wang, S.B.; Wang, C. Development Concept of Next Generation High-speed Intelligent EMU. Urban Mass Transit 2022, 25, 11–15. [Google Scholar]
  5. Harte, A.M.; McNamara, J.F.; Roddy, I.D. A multilevel approach to the optimisation of a composite light rail vehicle bodyshell. Compos. Struct. 2003, 63, 447–453. [Google Scholar] [CrossRef]
  6. Chiandussi, G.; Gaviglio, I.; Ibba, A. Topology optimisation of an automotive component without final volume constraint specification. Adv. Eng. Softw. 2014, 35, 609–617. [Google Scholar] [CrossRef]
  7. Chen, B.Z.; Zhang, X.Q.; Qiu, G.Y. Topology Optimization of Underframe for 400km/h High-Speed Train. Mach. Des. Manuf. 2021, 7, 272–275. [Google Scholar] [CrossRef]
  8. Zhang, Q.; Sun, Q.Z.; Liu, G.F. Finite Element Analysis and Topological Optimization of a Tracked Vehicle Body Based on Hypermesh. J. Jiamusi Univ. (Nat. Sci. Ed.) 2020, 38, 123–126. [Google Scholar]
  9. Ji, B.K. Research on Topology Optimization Design of High-Speed Train Body Structure Based on CRH EMU. Master’s Thesis, Sichuan University of Science & Engneering, Zigong, China, 2019. [Google Scholar]
  10. Zhang, L.; Zhang, J.Y.; Li, T.; Zhang, Y.D. Multi-objective aerodynamic optimization design of high-speed train head shape. J. Zhejiang Univ.-Sci. A 2017, 18, 841–854. [Google Scholar] [CrossRef]
  11. Zhang, L.; Dai, Z.Y.; Li, T.; Zhang, J.Y. Multi-objective aerodynamic shape optimization of a streamlined high-speed train using Kriging model. J. Zhejiang Univ.-Sci. A 2022, 23, 225–245. [Google Scholar] [CrossRef]
  12. Deb, A.; Chou, C.; Dutta, U.; Gunti, S. Practical Versus RSM-Based MDO in Vehicle Body Design. SAE Int. J. Passeng. Cars-Mech. Syst. 2012, 5, 110–119. [Google Scholar] [CrossRef]
  13. Chen, X.; Wang, Y.Q.; Sun, K.; Feng, Z.Y.; Zhao, W.H.; Lu, B.H. Multi-Objective Optimization for Section of Sandwich Plate Applied to High-Speed Train Compartments. J. Xi’an Jiaotong Univ. Nat. Sci. Ed. 2013, 47, 62–67. [Google Scholar]
  14. Sahib, M.M.; Kovács, G. Elaboration of a Multi-Objective Optimization Method for High-Speed Train Floors Using Composite Sandwich Structures. Appl. Sci. 2023, 13, 3876. [Google Scholar] [CrossRef]
  15. Miao, B.R.; Zhang, L.M.; Zhang, W.H.; Yin, H.T.; Jin, D.C. High-speed Train Carbody Structure Fatigue Simulation Based on Dynamic Characteristics of the Overall Vehilce. J. China Railw. Soc. 2010, 32, 101–108. [Google Scholar] [CrossRef]
  16. Tang, Q.C.; Ma, L.; Zhao, D.; Lei, J.Y.; Wang, Y.H. A multi-objective cross-entropy optimization algorithm and its application in high-speed train lateral control. Appl. Soft Comput. 2022, 115, 108151. [Google Scholar] [CrossRef]
  17. Wang, Q.S.; Zeng, J.; Shi, H.L.; Jiang, X.S. Parameter optimization of multi-suspended equipment to suppress carbody vibration of high-speed railway vehicles: A comparative study. Int. J. Rail Transp. 2023, 2023, 2291202. [Google Scholar] [CrossRef]
  18. Wang, S.M.; Peng, Y.; Wang, T.T.; Che, Q.W.; Xu, P. Collision performance and multi-objective robust optimization of a combined multi-cell thin-walled structure for high speed train. Thin-Walled Struct. 2019, 135, 341–355. [Google Scholar] [CrossRef]
  19. Peng, Y.; Hou, L.; Che, Q.W.; Xu, P.; Li, F. Multi-objective robust optimization design of a front-end underframe structure for a high-speed train. Eng. Optim. 2019, 51, 753–774. [Google Scholar] [CrossRef]
  20. Lu, S.S.; Xu, P.; Yan, K.P.; Yao, S.G.; Li, B.H. A force/stiffness equivalence method for the scaled modelling of a highspeed train head car. Thin-Walled Struct. 2019, 137, 129–142. [Google Scholar] [CrossRef]
  21. Wang, R.; Gao, S.M.; Wu, H.Y. Progress in Hexahedral Mesh Generation and Optimization. J. Comput.-Aided Des. Comput. Graph. 2020, 32, 693–708. [Google Scholar]
  22. Papanicolau, G.; Bensoussan, A.; Lions, J.L. Asymptotic Analysis for Periodic Structures; Elsevier: New York, NY, USA, 1978; ISBN 978-0-444-85172-7. [Google Scholar]
  23. Wang, J. Application and Analysis of Asymptotic Homogenization Method in Masonry. Master’s Thesis, Xiangtan University, Xiangtan, China, 2013. [Google Scholar]
  24. Guedes, J.; Kikuchi, N. Preprocessing and postprocessing for materials based on the homogenization method with adaptive finite element methods. Comput. Method. Appl. M 1990, 83, 143–198. [Google Scholar] [CrossRef]
  25. Zhang, G.F.; Xu, L.; Li, D.S.; Yu, F.C. Research on Sensitivity Filtering of Continuum Topology Optimization. Modul. Mach. Tool Autom. Manuf. Tech. 2021, 06, 29–32. [Google Scholar] [CrossRef]
  26. Xie, Y.M.; Steven, G.P. Evolutionary Structural Optimization; Berlin Springer-Verlag: London, UK, 1997; ISBN 978-3-540-76153-2. [Google Scholar]
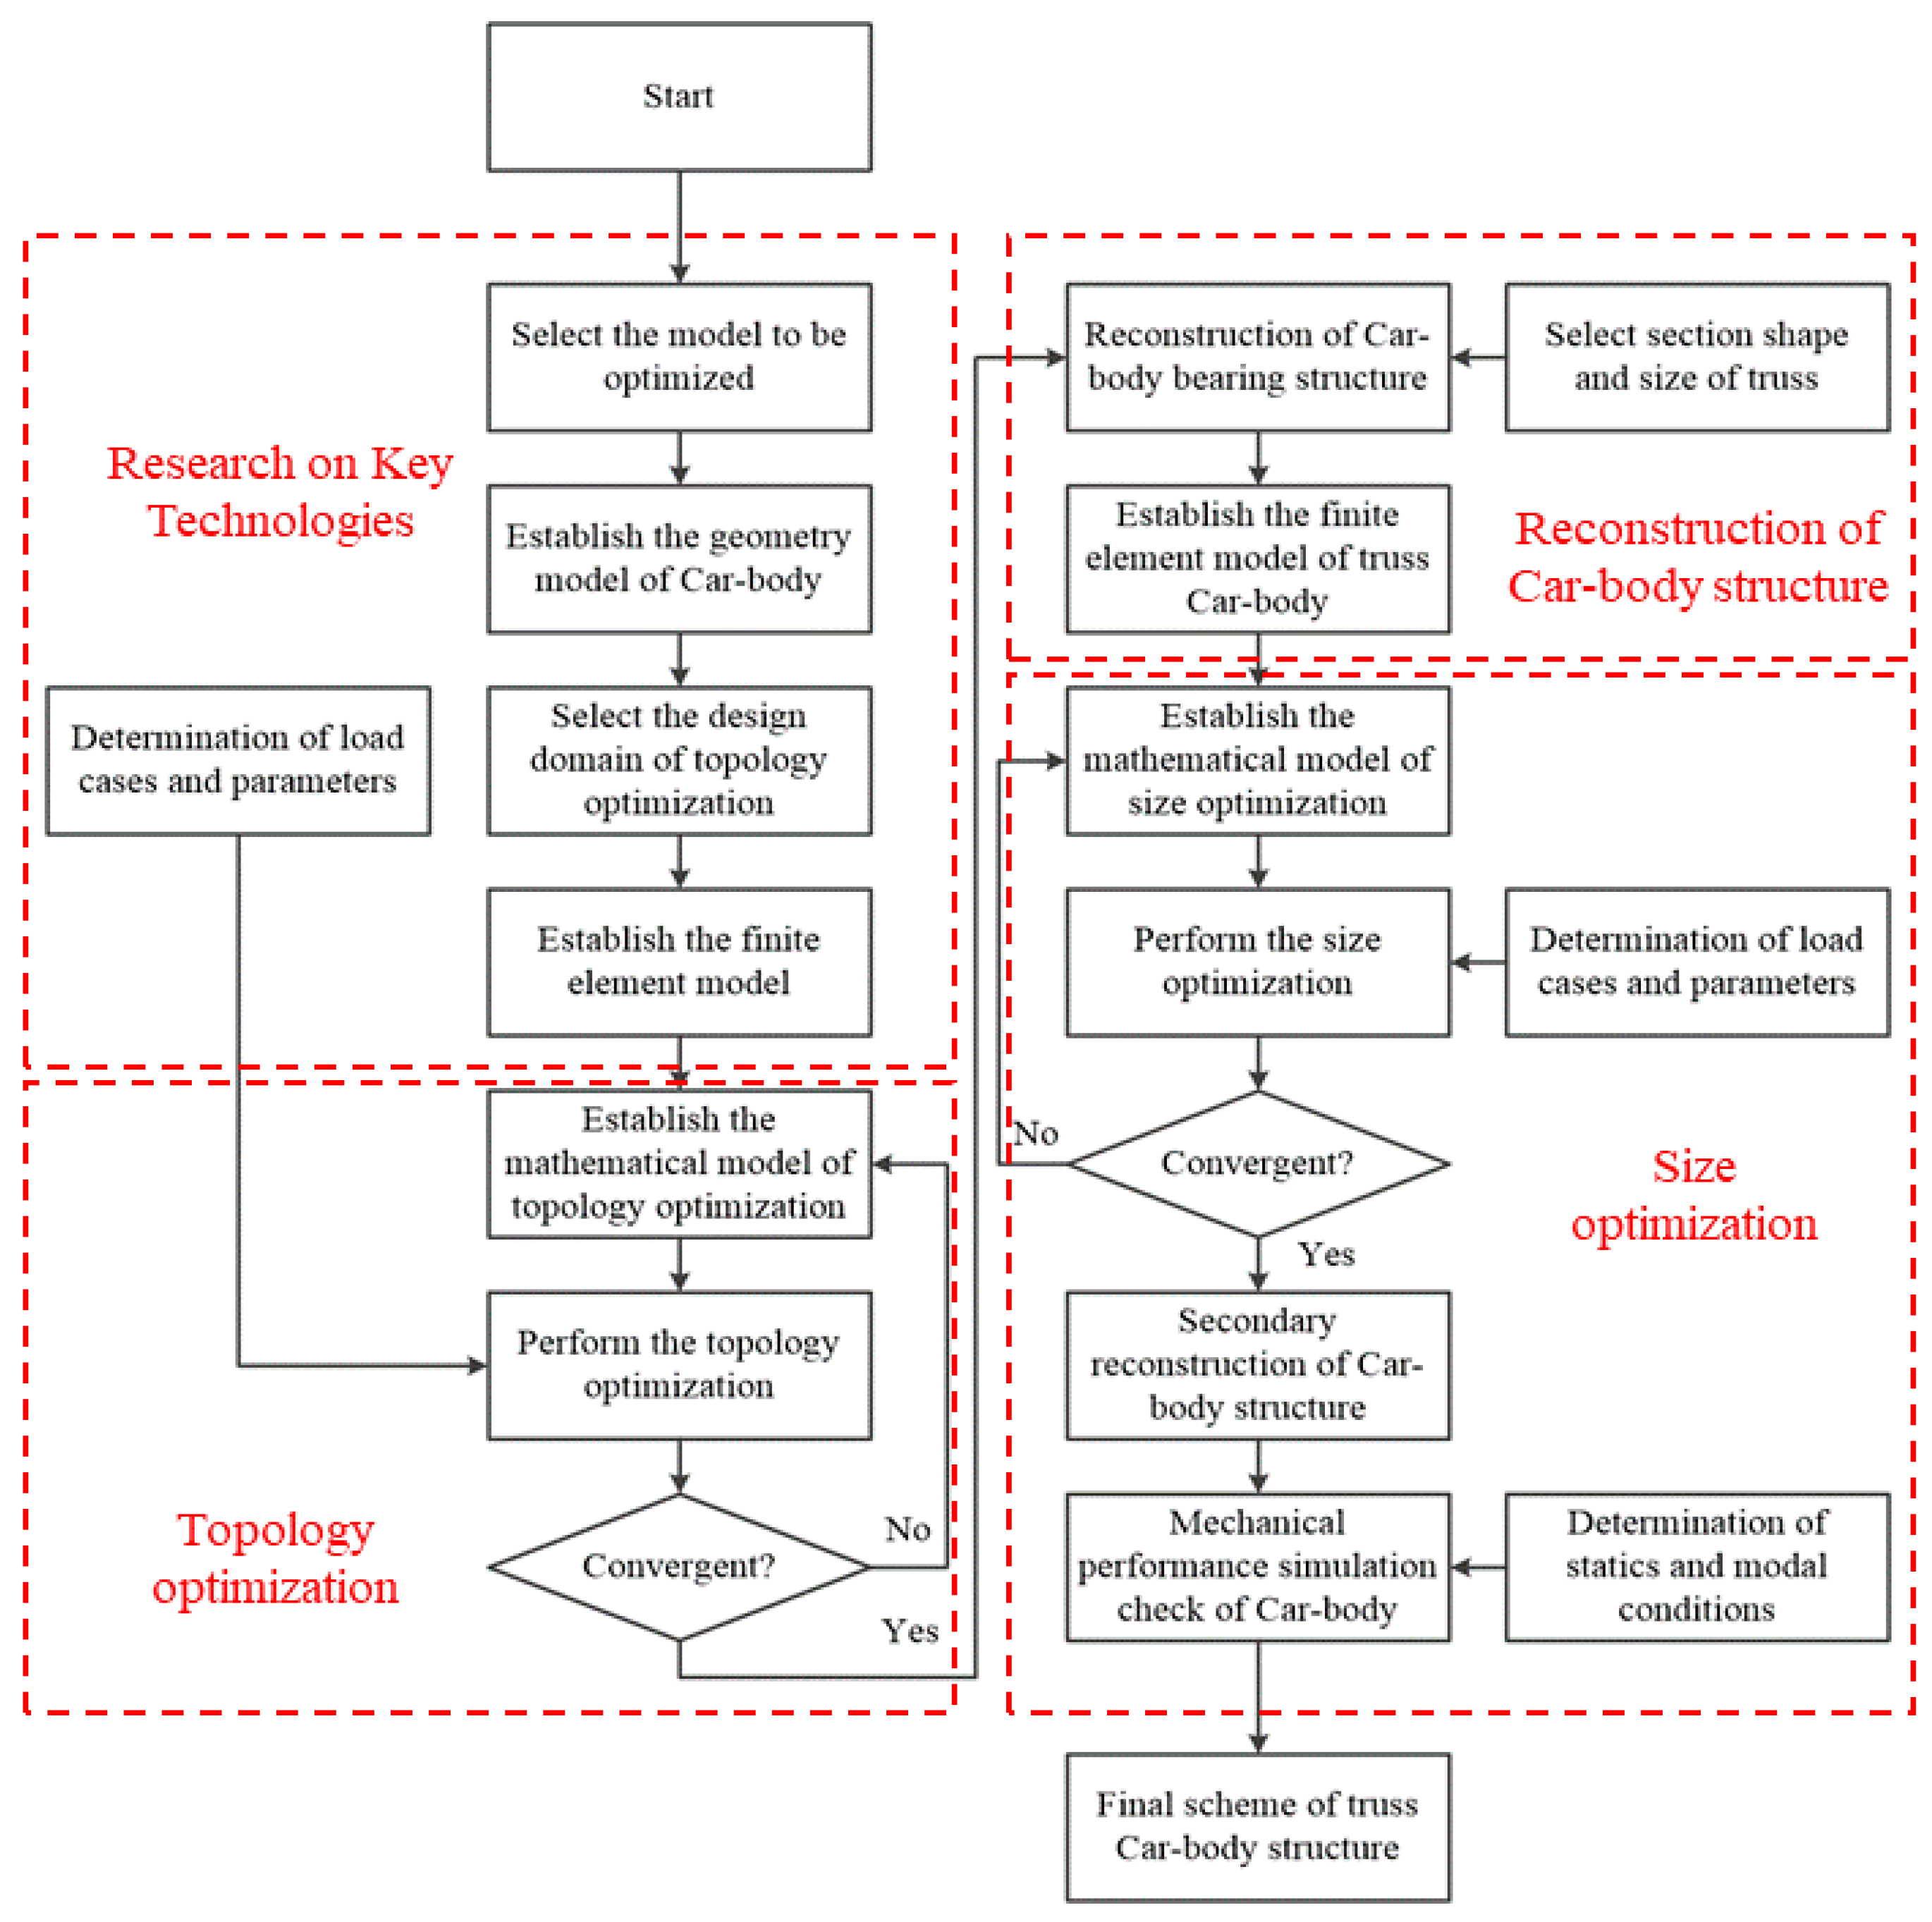
Figure 1. Vehicle body structure topology optimization process.
Applsci 14 01074 g001
Figure 2. Geometric model of car-body structure: (a) axonometric drawing of car body; (b) cross-section of the car body; (c) the view of the car-body frame.
Applsci 14 01074 g002
Figure 3. Finite element model of car-body structure.
Applsci 14 01074 g003
Figure 4. Finite element analysis of stress nephogram in design domain: (a) longitudinal load; (b) vertical load; (c) torsional load; (d) crosswind load; (e) three-point support load.
Applsci 14 01074 g004aApplsci 14 01074 g004b
Figure 5. Mode shapes of each order in the state of the steel structure of the car body: (a) first vertical bending deformation; (b) first diamond deformation; (c) first transverse bending deformation; (d) breathing deformation.
Applsci 14 01074 g005aApplsci 14 01074 g005b
Figure 6. The optimization results of 75 iterations with different thresholds were obtained: (a) threshold 0.05; (b) threshold 0.1; (c) threshold 0.2; (d) threshold 0.3; (e) threshold 0.4; (f) threshold 0.5.
Applsci 14 01074 g006aApplsci 14 01074 g006b
Figure 7. The optimization results of 106 iterations with different thresholds were obtained: (a) threshold 0.05; (b) threshold 0.1; (c) threshold 0.2; (d) threshold 0.3; (e) threshold 0.4; (f) threshold 0.5.
Applsci 14 01074 g007aApplsci 14 01074 g007b
Figure 8. The optimization results of 139 iterations with different thresholds were obtained: (a) threshold 0.05; (b) threshold 0.1; (c) threshold 0.2; (d) threshold 0.3; (e) threshold 0.4; (f) threshold 0.5.
Applsci 14 01074 g008aApplsci 14 01074 g008b
Figure 9. The optimization results of 155 iterations with different thresholds were obtained: (a) threshold 0.05; (b) threshold 0.1; (c) threshold 0.2; (d) threshold 0.3; (e) threshold 0.4; (f) threshold 0.5.
Applsci 14 01074 g009aApplsci 14 01074 g009b
Figure 10. The optimization results of 200 iterations with different thresholds were obtained: (a) threshold 0.05; (b) threshold 0.1; (c) threshold 0.2; (d) threshold 0.3; (e) threshold 0.4; (f) threshold 0.5.
Applsci 14 01074 g010aApplsci 14 01074 g010b
Figure 11. Volume change trend under topology optimization of the same weight coefficient.
Applsci 14 01074 g011
Figure 12. Optimization results with different thresholds in 139 iterations: (a) threshold 0.05; (b) threshold 0.1; (c) threshold 0.2; (d) threshold 0.3; (e) threshold 0.4; (f) threshold 0.5.
Applsci 14 01074 g012aApplsci 14 01074 g012b
Figure 13. Volume change trend under topology optimization with different weight coefficients.
Applsci 14 01074 g013
Figure 14. The optimization results of 75 iterations with different thresholds were obtained: (a) threshold 0.05; (b) threshold 0.1; (c) threshold 0.2; (d) threshold 0.3; (e) threshold 0.4; (f) threshold 0.5.
Applsci 14 01074 g014aApplsci 14 01074 g014bApplsci 14 01074 g014c
Figure 15. Contrast modeling of underframe structure: (a) results of topology optimization of underframe structure; (b) geometric modeling of underframe structure.
Applsci 14 01074 g015aApplsci 14 01074 g015b
Figure 16. Contrast modeling of end-wall structure: (a) results of topology optimization of end-wall structure; (b) geometric modeling of end-wall structure.
Applsci 14 01074 g016
Figure 17. Contrast modeling of results of end structure: (a) results of topology optimization of results of end structure; (b) geometric modeling of results of end structure.
Applsci 14 01074 g017
Figure 18. Contrast modeling of side beam structure (a) results of topology optimization of side beam structure; (b) geometric modeling of side beam structure.
Applsci 14 01074 g018aApplsci 14 01074 g018b
Figure 19. Contrast modeling of roof structure: (a) results of topology optimization of side wall structure; (b) geometric modeling of roof structure.
Applsci 14 01074 g019
Figure 20. Contrast modeling of side wall structure: (a) results of topology optimization of side wall structure; (b) geometric modeling of side wall structure.
Applsci 14 01074 g020
Figure 21. Contrast modeling of supporting structure: (a) results of topology optimization of supporting structure; (b) geometric modeling of supporting structure.
Applsci 14 01074 g021aApplsci 14 01074 g021b
Figure 22. A quarter-truss model of the vehicle.
Applsci 14 01074 g022
Figure 23. A quarter-truss model of the vehicle (skin).
Applsci 14 01074 g023
Figure 24. Finite element model of vehicle body after topology optimization.
Applsci 14 01074 g024
Figure 25. The stress nephogram of car-body model is reconstructed by finite element method: (a) stress cloud diagram (longitudinal load); (b) stress cloud diagram (vertical load); (c) stress cloud diagram (torsional load); (d) stress cloud diagram (crosswind load); (e) stress cloud diagram (three-point support load).
Applsci 14 01074 g025aApplsci 14 01074 g025b
Table 1. CRH car body’s basic dimensions.
Structure SizeL/mm
Car-body length25,000
Fixed distance17,800
Car-body width3360
Car-body height4050
Height from coupler centerline to rail surface950
Table 2. Working conditions and boundary conditions.
Working ConditionLoadRestraintCondition Design Diagram
Longitudinal loadCompression force of 1500 kN for front-end coupler seat
Compression forces of 300, 300, and 400 kN to the front-end wall near the roof, side wall, and chassis, respectively
Longitudinal constraint at the rear end wallApplsci 14 01074 i001
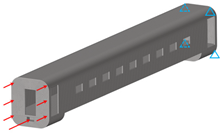
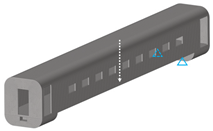
Vertical load1.3 times the weight of the car bodyVertical restraint at the secondary suspensionApplsci 14 01074 i002
Torsional loadUnit torsional load 1 kN·mFull restraint at the secondary suspensionApplsci 14 01074 i003
Crosswind loadUnit wind pressure 450 PaFull restraint at the secondary suspensionApplsci 14 01074 i004
Three-point support load-Apply vertical displacement to constrained support pointsApplsci 14 01074 i005
Table 3. Results of finite element analysis in design domain.
Working ConditionMaximum Von Mises Stress/MPa
Longitudinal load86.8
Vertical load63.3
Torsional load67.9
Crosswind load45.0
Three-point support load36.0
Table 4. Description of the natural frequency and mode shape of the car-body mode.
Modal Order NumberMode Shape of the Car-Body Mode
Frequency/HzVibration Mode
121.25First vertical bending deformation
222.69First diamond deformation
323.51First transverse bending deformation
430.64Breathing deformation
Table 5. Topology optimization parameter settings.
ParameterDescriptionValue
MINDIMMinimum member size150
MAXDIMMaximum member size400
OBJTOLTolerance of target function0.005
CHECKERCheckerboard parameter1
DISCRETEDiscrete parameter1
Table 6. Body reference design quality.
SequenceDescriptionNumber/t
1Weight of vehicle maintenance equipment
(excluding bogie and car-body structure)
25.46
2Weight of bogie8.0
3Passengers (80 kg/per person)Capacity: 856.8
Overcrowding: 1209.6
4Servicing equipment0.4
5Weight of vehicle with capacity passengers
(excluding bogie and car-body structure)
32.26
6Weight of vehicle with overcrowding passengers
(excluding bogie and car-body structure)
35.06
Disclaimer/Publisher’s Note: The statements, opinions and data contained in all publications are solely those of the individual author(s) and contributor(s) and not of MDPI and/or the editor(s). MDPI and/or the editor(s) disclaim responsibility for any injury to people or property resulting from any ideas, methods, instructions or products referred to in the content.