Abstract
Emulsions have garnered significant attention within a variety of industries, including pharmaceuticals, food production, and cosmetics. The importance of emulsions across these sectors is attributed to their versatility and unique properties, such as increased interfacial area and the ability to deliver compounds insoluble in water or to mask the flavor of unpalatable ingredients. A comprehensive and precise assessment of the physicochemical properties, structural features, and stability of emulsions is an indispensable phase in the pursuit of new formulations and the improvement of manufacturing protocols. The characterization of emulsions encompasses an array of methodologies designed to determine their attributes, such as droplet size, distribution, concentration, surface charge, and others. In this review, we explore the techniques most frequently used to characterize emulsions and critically assess the significance each method holds in understanding the behavior and predicting the stability of emulsions. We elucidate the basic principles of these methods while emphasizing what information can be gathered from them, and how to effectively interpret this information to optimize the properties of emulsions, crucial from the standpoints of food and other industries, such as long-term stability and easy processing.
1. Introduction
Emulsions are systems composed of two immiscible phases: an oil and an aqueous phase, stabilized by an emulsifying agent [1,2,3]. Owing to their unique characteristics, such as the capability to improve the solubility of poorly water-soluble ingredients, increase the absorption of active agents, and prolong their release, emulsions have become inseparable elements in multiple formulations used in the pharmaceutical, food, and cosmetic industries [4,5,6]. Accurate characterization of their physicochemical properties, structure, and stability is a crucial step in understanding their behavior, developing new formulations, and optimizing manufacturing processes.
To fully harness the capabilities of emulsions, their properties have to be carefully scrutinized using a wide range of techniques. A pivotal characteristic of emulsions that determines their stability and physicochemical properties is droplet size [7]. Dynamic light scattering, small-angle X-ray scattering, ultrasonic spectrometry, electrical pulse counting, field-flow fractionation, and capillary hydrodynamic fractionation [8] are key tools used for droplet size analysis. The understanding of emulsion behaviors can be further enhanced by microscopic analysis, which provides fundamental information about the morphology of the droplets, their concentration, and distribution [9,10,11]. Various techniques, such as optical microscopy, atomic force microscopy, transmission, or scanning electron microscopy, enable researchers to assess the structural properties of emulsions [12].
Analysis of rheological properties is another indispensable step in the evaluation of emulsions in terms of their manufacturing efficiency and product performance [13,14]. Determining the optical properties of emulsions, including transparency and turbidity, is crucial for applications requiring optical clarity [15]. Further details of emulsion properties can be revealed by zeta potential analysis, which offers insight into the electrostatic forces governing droplet behavior [16], which are key factors affecting the stability of emulsions [17].
Another crucial aspect of emulsion dynamics is heat exchange during phase transitions and crystalline transformations [18]. These features can be examined by differential scanning calorimetry (DSC). DSC is particularly useful in tracking crystallization and melting processes in emulsions, which are closely linked to their viscosity, droplet size, and density [19].
One of the primary focuses in analyzing the properties of emulsions is their chemical composition. Emulsion composition can be qualitatively and semi-quantitatively assessed by Fourier Transform Infrared (FTIR) spectroscopy [20]. This technique allows the identification of functional and structural groups responsible for both chemical and physical aging, all while preserving the internal equilibrium of the emulsion. FTIR has proven instrumental in examining thermal degradation processes within oils, providing insights into the structural alterations occurring as the emulsion matures [21].
Evaluation of emulsions using in vitro digestion models has become another valuable tool for emulsion characterization, especially in the food and pharmaceutical sectors, where there is a growing interest in understanding and controlling the digestion of emulsified lipids [22]. In vitro models enable the assessment of emulsions as delivery systems for non-polar lipids, vitamins, nutraceuticals, and other therapeutic compounds within specific gastrointestinal tract regions [23,24].
Despite the widespread use of emulsions across different industries, the manufacturing and storage of emulsion-based formulations still face challenges related to lipid oxidation. The susceptibility to oxidation is intensified within emulsions due to their complex composition, increased interfacial area, and potential exposure to oxidative stress during emulsification. Various techniques, including spectrophotometric measurement and wet-chemical methods, are employed to detect both primary and secondary oxidation products in emulsions.
This review offers insight into the emulsion characterization techniques mentioned above and discusses their effectiveness in providing accurate and comprehensive information on emulsion properties. The article elucidates the basic concepts of emulsion characterization methods with particular emphasis on the information that can be obtained using different analytical methods, and how to interpret this data to understand emulsion behavior and stability. By doing so, it equips researchers and formulators with the practical knowledge required to tailor emulsion characteristics to a specific application and maximize their potential across food and other industry sectors.
2. Emulsion Formation and Stability
Emulsions are colloidal dispersions created by mixing two immiscible phases, an oil phase, and an aqueous phase, in the presence of an emulsifying agent. Emulsions consist of liquid droplets (dispersed phase) dispersed in a continuous phase and can be classified into several categories based on their composition: oil-in-water (O/W), water-in-oil (W/O), and oil-in-oil (O/O). An example of the last category is an emulsion comprising a polar oil, such as propylene glycol, that is dispersed in a nonpolar oil, like paraffinic oil, or vice versa [25]. Emulsions can also be categorized based on droplet size, falling into macroemulsions, microemulsions, and nanoemulsions (also known as miniemulsions) [26]. Macroemulsions contain droplets larger than 0.1 µm, microemulsions have droplets ranging from 10 to 100 nm, while nanoemulsion droplets range in size from 20 to 500 nm. The majority of emulsions fall into the macroemulsion category.
Microemulsions are thermodynamically stable due to their low interfacial energy and can spontaneously form, however, they exhibit high sensitivity to changes in temperature and composition [27]. Macroemulsions and nanoemulsions are inherently thermodynamically unstable and exist in a state of non-equilibrium [28]. In these types of emulsions, breaking the dispersed phase into droplets enlarges the interface between the phases, resulting in a significant increase in interfacial area and energy. Hence, forming macro- and nanoemulsions does not occur spontaneously but requires an input of energy [29]. However, due to the very small size of droplets, nanoemulsions can remain kinetically stable over extended periods. It is important to note that this metastability does not result from the equilibrium state, but rather from greatly reduced rates of gravity-related sedimentation-based separation processes [30].
Unstable systems can be stabilized using surface active agents—surfactants (called also emulsifiers). Surfactants can be categorized into: (1) small molecular surfactants, such as sodium lauryl sulfate (SLS), diacetyl tartaric acid ester of mono- and diglycerides (DATEM), citric acid esters of mono and diglycerides (CITREM), Tweens 20 and 80, Spans 20, 40, 60 and 80, and Brij-97 [31]; (2) macromolecular emulsifiers, such as proteins, polysaccharides, phospholipids, and surface-active polymers; and (4) solid particles (known as Pickering particles), such as silica, clay, hydroxyapatite, starch, or chitosan particles [32]. The function of the emulsifier is to decrease the interfacial tension between immiscible phases and the resistance of the droplets to deformation, thereby reducing the shear force needed for breaking up droplets [33]. The resistance of the droplets to deformation is determined by the Laplace pressure, which refers to the difference in pressure inside and outside the droplet. Concurrently, emulsifier molecules adsorb to newly formed droplet surfaces, creating a physical barrier between them, which both stabilizes them and inhibits coalescence [29]. Emulsifiers with low molecular weight adsorb more rapidly to the droplet surface than high molecular weight surfactants and have a tendency to create a single-molecule layer at the interface of oil and water. The adsorption of a single emulsifier molecule at the interface can be described using Gibbs or Langmuir adsorption theorems [34]. In contrast, macromolecular surfactants form thicker layers with more complex morphologies, such as cross-linked multilayers or supramolecular structures [35].
The capacity of emulsifiers to stabilize the droplets arises from their amphiphilic nature [36]. Emulsifier molecules consist of a hydrophilic part (the head) and a hydrophobic segment (the tail). When introduced into an oil-in-water (O/W) emulsion, where oil droplets are dispersed in an aqueous phase, emulsifier molecules spontaneously envelop the oil droplets, with their non-polar tails reaching into the droplet [33]. Meanwhile, their heads point outward toward the continuous phase, forming a protective layer around the droplets. In water-in-oil (W/O) emulsions, where water droplets are dispersed in the oil phase, the orientation of emulsifier molecules is reversed: non-polar tails are oriented outward toward the oil phase, while polar heads are directed inward toward the center of the water droplets. Oil-in-water emulsions are known as standard emulsions [2], while water-in-oil emulsions are termed reverse or inverted emulsions. When an emulsion is additionally dispersed into another continuous phase, it is referred to as a multiple emulsion or an emulsified emulsion. An instance of a multiple emulsion is oil-water-oil (O/W/O), which includes small oil droplets scattered in larger water droplets suspended in the continuous oil phase.
The stability of emulsions refers to their capability to withstand alterations in physicochemical properties and droplet size over time [37]. Emulsion stability is a crucial factor in various applications, including in the food, cosmetic, and pharmaceutical industries, as it ensures the desired physicochemical properties and shelf-life of the product. There are several destabilization mechanisms responsible for the separation of emulsions (Figure 1), including flocculation, coalescence, Ostwald ripening [29], sedimentation, and creaming, which may occur simultaneously or separately [38].
One of the key emulsion destabilization mechanisms is coalescence, which occurs when the droplets of the dispersed phase come into contact and merge to form larger droplets. The fusion of droplets can happen due to Brownian motion, collisions, and attractive forces between the droplets. Coalescence causes the thin liquid layer separating individual droplets to break. As two droplets approach, the layer becomes thinner until it reaches a stable thickness determined by surface forces. The resulting force, known as disjoining pressure, involves different interactions, such as repulsive electrostatic forces, van der Waals interactions, and repulsive steric forces, depending on the properties of the surfaces involved. It is worth noting that, in stable emulsions, as droplets draw closer together, disjoining pressure increases; however, beyond a critical distance and disjoining pressure, the interfacial layer is compromised, and coalescence begins [39]. The interfacial tension between the dispersed and continuous phases and the viscosity of both phases are crucial parameters determining emulsion resistance to coalescence. In emulsions where the dispersed phase is partially crystallized, the droplets can undergo partial coalescence (called also arrested coalescence). During partial coalescence, droplets begin to merge, but before coalescence is completed, a smaller daughter droplet is formed. Partial coalescence may occur again in daughter droplets creating the next generations of daughter droplets.
Another important mechanism in emulsion destabilization is flocculation, where the droplets group together to form larger clusters or flocs due to attractive forces between them, including van der Waals forces [40]. The rate of flocculation is related to the strength of the van der Waals attraction, which depends on the droplet radius and effective Hamaker constant (dictated by the interactive van der Waals energy and the distance of separation between two droplets), as well as the electrostatic or steric repulsion between the droplets. The rate of flocculation can be predicted from a frequency factor that determines how often drops encounter each other, and a probability factor indicating how long they stay together. Usually, flocculation leads to enhanced creaming (i.e., the movement of the dispersed phase to the upper layer of the emulsion), because flocs rise faster than individual drops due to their larger effective radius. However, exceptions occur in concentrated emulsions, where gel-like network structures can have a stabilizing influence. Polydispersity enhances flocculation, as differences in creaming rates between small and large droplets cause them to come into proximity more often compared with monodisperse systems. The cream layer formed towards the end of this process actually constitutes a concentrated floc.
The third process leading to emulsion separation is Ostwald ripening. During Ostwald ripening, smaller droplets are incorporated into larger ones because of pressure differences between the droplets and the continuous phase, as well as differences in the solubility of unevenly sized droplets. In polydisperse emulsions, smaller droplets exhibit higher Laplace pressure compared to larger drops. Small droplets also have higher solubility in the continuous phase and therefore tend to be included in the larger droplets. Ostwald ripening occurs due to the diffusion of the dispersed phase through the continuous phase, involving a continual exchange of matter. As a result, there is a continuous transfer of the dispersed phase from small to large droplets, leading to a gradual growth of larger droplets and the diminishment of smaller ones. This disproportionation leads to a reduction in the total number of droplets within the population. The rate of Ostwald ripening is influenced by the solubility of the dispersed phase in the continuous phase. Higher solubility results in faster Ostwald ripening [41]. Therefore, this separation process can be minimized by selecting a dispersed phase that exhibits low solubility in the continuous phase [42].

Figure 1.
Emulsion destabilization mechanisms. Orange and blue areas represent the oil and water phases, respectively. Reprinted from [43], published under CC license CC BY-NC 3.0. Copyright © 2023 Royal Society of Chemistry.
Figure 1.
Emulsion destabilization mechanisms. Orange and blue areas represent the oil and water phases, respectively. Reprinted from [43], published under CC license CC BY-NC 3.0. Copyright © 2023 Royal Society of Chemistry.

As mentioned above, creaming involves the movement of the dispersed phase to the upper layer of the emulsion. It results from density differences between oil and water phases, leading to droplets rising to the surface. The separation process that occurs through a similar mechanism is sedimentation. Sedimentation is commonly observed in water-in-oil emulsions, where heavier water droplets gather at the bottom. Creaming or sedimentation can be prevented by employing a high-viscosity continuous phase or regulating both particle size distribution and dispersed phase density.
The temporal evolution of emulsion separation is subject to multi-factorial influences, encompassing parameters such as emulsifier type and concentration, water-to-oil volume ratio, the incorporation of additives, like co-surfactants, polydispersity index, and the physicochemical attributes of the mixture constituents (including viscosity, density, and interfacial tension) [44]. Other determinants include polarity, ionic strength, and temperature. Emulsion stability characteristics can vary greatly, with certain emulsions designed for transient stability, while others demonstrate enduring stability, persisting for weeks, months, or even years [45].
The choice of emulsifier can greatly influence the stability and physicochemical properties of emulsions. Emulsifiers can be either ionic (positively or negatively charged), zwitterionic (carrying both positive and negative charges at neutral pH) [46], or nonionic. Ionic emulsifiers form a charged shell around droplets, causing electrostatic repulsion between them. The extent of repulsion depends on the emulsifier surface charge and ionization degree, which are strongly affected by emulsion pH and the presence of other charged species, like electrolytes [44]. This renders them sensitive to composition and pH, limiting their use to specific emulsion types. For instance, cationic emulsifiers perform well in low pH and neutral solutions but not in alkaline solutions, whereas anionic emulsifiers are better suited for alkaline emulsions. Nonionic emulsifiers, which contain large bulky non-charged polar groups in their molecules, are considered more universal as they can effectively stabilize different kinds of emulsions [44]. This is due to steric hindrance, which prevents droplet coalescence without being sensitive to changes in medium pH and composition. Therefore, most emulsions are stabilized by this kind of emulsifier (e.g., Pluronics 70, Tween-80, Span-80, Brij-30) [47]. Surfactant mixtures, including combinations of ionic/nonionic or nonionic/nonionic emulsifiers, can also be employed to enhance emulsification and improve the stability of the formulation.
When selecting the most suitable emulsifier, a key factor to consider is its hydrophilic-lipophilic balance (HLB), which describes the emulsifier affinity for oil and water phases. It is utilized to predict the emulsifier capability to form a specific type of emulsion. HLB is linked to the emulsifier solubility in water and oil, as well as the size and strength of its hydrophilic and lipophilic moieties [48]. HBL is calculated based on the weight percentage of the hydrophilic groups compared to the hydrophobic groups in a molecule and spans from 0 to 20, with an HLB of 10 indicating an equal attraction to both phases. Emulsifiers with a higher HLB value are more inclined towards being hydrophilic and typically form oil-in-water emulsions, while those with lower values tend to be more hydrophobic and favor the formation of water-in-oil emulsions. To achieve maximum stability of emulsions, it is essential to align the HLB value with that of the non-polar oil phase being utilized [49]. For instance, emulsifiers with an HLB ranging from 7 to 8 are generally required for emulsifying vegetable oils, whereas surfactants with a higher HLB of around 14 are better suited for creating castor oil emulsions.
Nevertheless, the hydrophilic-lipophilic balance concept is not without its constraints. Notably, it may fail to accurately predict the resultant emulsion type formed by specific emulsifiers, owing to variables, such as temperature or emulsifier concentration, during the emulsification process [50]. These factors can lead to the same emulsifier giving rise to both water-in-oil (W/O) and oil-in-water (O/W) emulsions. Furthermore, O/W emulsions can be generated using emulsifiers exhibiting HLB values across the entire spectrum, and theoretical HLB calculations prove inadequate for blends comprising diverse emulsifying agents.
In response to these challenges, the hydrophilic-lipophilic difference (HLD) concept has been introduced. HLD offers a more precise characterization of emulsifiers [51] as it takes into account various parameters shaping the emulsion, encompassing surfactant concentration and type, hydrophobicity of the oil phase, salinity, temperature, and the characteristic curvature (Cc) of the emulsifier [52]. The Cc value indicates whether the emulsifier tends to form a curvature around an oil droplet in water (negative Cc) or a water droplet in oil (positive Cc). Typically, hydrophilic emulsifiers exhibit negative Cc values; for example, sodium lauryl sulfate (SLS) possesses a Cc value of −2.3. Conversely, hydrophobic emulsifiers demonstrate positive Cc values; dioctyl sodium sulfosuccinate, for instance, has a Cc value of 2.6.
As previously mentioned, emulsions can also be stabilized with solid particles, known as Pickering particles. Pickering particles accumulate at the water-oil interface and create a steric barrier preventing droplet coalescence. These particles include inorganic particles (e.g., silica, clay, hydroxyapatite particles), organic particles (e.g., starch, ovotransferrin, chitosan particles) [53], and Janus particles (particles whose surfaces have two or more distinct physical properties, e.g., hydrophilic and hydrophobic). They provide stability to emulsions by being partially wetted by both the oil and water phases [54]. The formation of oil-in-water (O/W) Pickering emulsion or water-in-oil (W/O) Pickering emulsion depends on the wettability of solid particles at the interface between oil and water. If one liquid has better wetting properties with solid particles compared to the other, it will become the continuous phase, while the other becomes dispersed. O/W emulsions are created when the phase contact angle θ is less than 90° (e.g., emulsions stabilized with silica or clay particles), whereas W/O emulsions form when θ > 90° (e.g., emulsions stabilized with carbon black). However, for a particle to effectively act as a stabilizer in either case, θ needs to be relatively close to 90°. It is worth noting that Pickering particles attach to the interface irreversibly and thus provide more efficient emulsion stabilization than conventional surfactants that adsorb to the water-oil interface [55].
The stability of emulsions is also significantly affected by emulsifier concentration [56]. While higher emulsifier concentrations generally result in more stable emulsions [57], there are instances where this may not be the case due to different inter-droplet interactions in various emulsion systems. Additionally, there is an emulsifier concentration limit, beyond which the stability of the emulsion may decrease. This is often referred to as “over-emulsification”. Over-emulsification is a phenomenon that occurs when an excessive amount of emulsifier is added to an emulsion, leading to its destabilization. The mechanism of over-emulsification involves an imbalance in the concentration of emulsifier at the interface [58]. When the emulsifier concentration surpasses a certain threshold, there is an excess of emulsifier molecules at the interface, resulting in repulsion between these molecules. This repulsion disrupts the formation of a stable interfacial film, leading to a reduction in the emulsifier’s ability to lower interfacial tension.
The rate of emulsion destabilization is also influenced by factors such as pH, ionic strength, temperature, and the viscosity of the continuous phase [43,59]. These variables significantly impact electrostatic interactions and the repulsive barrier between droplets [59]. They have a particularly profound effect on emulsions that are stabilized with ionic emulsifiers. In the context of emulsion stability, pH and ionic strength play a critical role in influencing droplet surface charge density, molecular flexibility, and electrostatic and steric interactions [58]. Emulsion droplets acquire their electrical charge primarily through the adsorption of ionized species, such as ionic emulsifiers, polyelectrolytes, or ions, from the surrounding solution onto their surface. The sign and magnitude of droplet surface charge are influenced by the kind and concentration of molecules adsorbed to the surface.
The ionic strength of the solution influences the extent and strength of intra- and intermolecular electrostatic interactions, impacting the interfacial layer structure and thickness, and repulsion between the droplets [2]. An increase in the ionic strength of the continuous phase reduces the electrostatic repulsion between droplets due to the accumulation of counter-ions around their surfaces, consequently increasing the likelihood of the droplets flocculating or coalescing. The magnitude of this phenomenon is influenced by the concentration and valency of the counter-ions present in the solution. Multivalent counter-ions, such as Ca2+, Fe2+, and Fe3+, exert a more significant effect on the electrostatic forces between droplets than monovalent ions, like Na+, Cl−, and K+. To modify droplet surface charge, polyelectrolytes containing weakly acidic or basic ionizable groups can also be added to the emulsions. Negatively charged groups, such as sulfate, phosphate, or carbonate groups with pKa values around 1–2 and 4–5, respectively, can be provided by incorporating anionic polyelectrolytes (e.g., pectin, carrageenan, alginate) in the formulations, whereas positively charged groups, such as amino or imino groups (with pKa values around 7–11), by adding cationic polyelectrolytes. (e.g., chitosan).
Emulsion pH level governs the ionization of surface groups, which impacts the density of droplet surface charge [60]. By adjusting the solution pH, it is possible to tailor the thickness and integrity of the interfacial layer [61] and control how much ionizable molecules adsorb to droplet surfaces. For instance, anionic pectin will not attach to anionic β-lactoglobulin-stabilized droplets at neutral pH (pH = 7) due to electrostatic repulsion between polysaccharide molecules and droplet surfaces but will do so at lower pH levels of around 3 when polysaccharide molecules and droplets are oppositely charged [62] At the same time, pH-driven changes in the thickness of the interfacial layer can strongly impact emulsion stability by altering the strength of steric repulsion and van der Waals attraction between droplets. Protein emulsifiers are particularly effective in manipulating droplet charge by adjusting the pH of the emulsion. Protein molecules have a positive charge below their isoelectric point (pI) and a negative charge above it. By adjusting the solution pH, it becomes possible to tune the electrostatic interactions between droplets. Moreover, since different proteins have varying isoelectric points, selecting proteins with the necessary electrical properties at the desired solution pH allows for altering the magnitude of electrical repulsion between the droplets [58].
The change in temperature impacts various factors, including the viscosity of the phases, interfacial tension, surfactant adsorption to droplets, solubility, and diffusivity of the droplets in the continuous phase [63]. These changes indirectly affect emulsion stability. A rise in temperature decreases interfacial tension and viscosity, facilitating emulsion formation. However, high temperatures can reduce emulsion stability due to increased dispersed phase solubility in the continuous phase and accelerated Ostwald ripening [43]. Sudden temperature variations are particularly detrimental to emulsion stability [63]. Conversely, increasing the viscosity of the continuous phase can enhance emulsion resistance against separation by slowing down gravitational separation processes, like sedimentation, while decreasing droplet collisions and coalescence frequency [59,64].
Emulsion stability can also be enhanced by reducing droplet size and the polydispersity index (PDI). In general, emulsions exhibit greater stability when the droplets and PDI are small, due to diminished attraction between droplets and increased viscosity, resulting in reduced coalescence [37]. In polydisperse systems, smaller droplets show greater solubility in the continuous phase compared to larger ones. With an increase in emulsion polydispersity, differences in solubility and chemical potential between droplets intensify, accelerating Ostwald ripening.
Another crucial factor for emulsion stability is the concentration of droplets. In O/W emulsions, an increase in droplet concentration has been shown to improve their stability and reduce creaming rate, which can be attributed to droplet crowding effects, higher packing density, and stronger inter-droplet interactions [65]. However, the strength of these interactions largely depends on the surface charge of the droplets, since electrically charged droplets cannot get as close to each other as uncharged ones.
Efforts have been made to enhance control over emulsion stability through the use of emulsifiers that respond to specific stimuli, such as light (e.g., azobenzene-modified emulsifiers), pH (e.g., poly(methacrylic acid-co-methyl methacrylate-co-7-(4-vinylbenzyloxyl)-4-methylcoumarin emulsifier), or salts (e.g., zwitterionic emulsifiers) [64]. These stimuli-responsive emulsifiers enable reversible stabilization and destabilization of emulsions in response to physical or chemical changes, offering potential benefits for on-demand site-specific drug delivery.
3. Techniques for Emulsion Characterization
3.1. Microscopic Analysis
One of the most straightforward and widespread methods for emulsion characterization is microscopic analysis. Microscopic analysis is performed to assess the morphology of the droplets (shape and size), droplet concentration, and distribution throughout the sample [66]. Observing changes in the morphology of the droplets over time can give us valuable information on emulsion stability and the mechanism of phase separation. The image typical for stable emulsion shows small, non-flocculated, homogenously distributed droplets that are relatively uniform in size (Figure 2a). Unstable emulsion separating through flocculation can be recognized by the presence of equally sized droplets that group but maintain their integrity. In the emulsions undergoing separation through coalescence or Ostwald ripening (Figure 2b and Figure 3), small and large droplets are present at the same time [37].
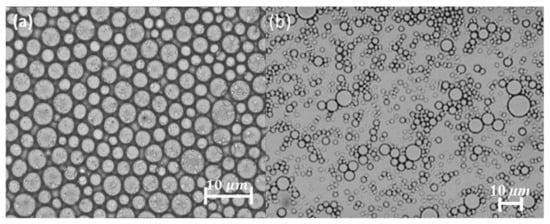
Figure 2.
Optical microscopy images of (a) a stable emulsion, and (b) an unstable emulsion separating through coalescence. Adapted with permission from [66]. Copyright © 2023 Springer Nature.
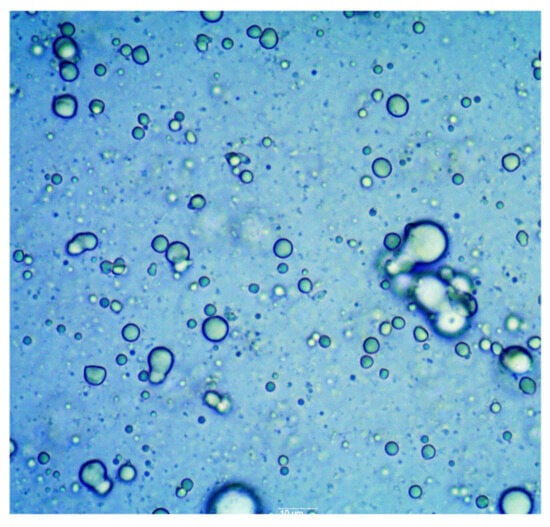
Figure 3.
Optical microscopy image of coalescing emulsion droplets. Two droplets merge and form a larger one.
Microscopic evaluation of emulsions can be performed via several techniques. The most common methods include optical microscopy, fluorescent microscopy, and electron microscopy [67,68]. Optical microscopy is commonly used for the initial assessment of emulsions due to its simplicity, availability, and capability to quickly provide qualitative information about the emulsion. However, with the level of resolution it provides (down to 1–2 μm [69], it is often insufficient for a detailed analysis of the emulsion structure. Optical microscope images of emulsions often suffer from relatively low contrast between the phases, caused by their similar refractive indexes, which makes it difficult to distinguish one phase from the other [70].
To improve the contrast and visibility of the droplets against the background of the continuous phase, water- or oil-soluble dyes absorbing light in the visible region can be added to the sample [66,71] or emulsion droplets may be stabilized with pigment particles (e.g., Irgalite Red D 3707, Cromophtal Violet D 5700, Paliotol Yellow K 0961) serving simultaneously as a contrast-enhancing agent and a surfactant (Figure 4) [72]. However, the color compounds added to the emulsions have to be carefully selected, as they may induce substantial changes in emulsion structure or interact with some of its components. Enhanced contrast can also be achieved using phase contrast or differential interference contrast microscopy, in which special lenses amplify the small differences in the refractive index into more significant differences in light intensity.
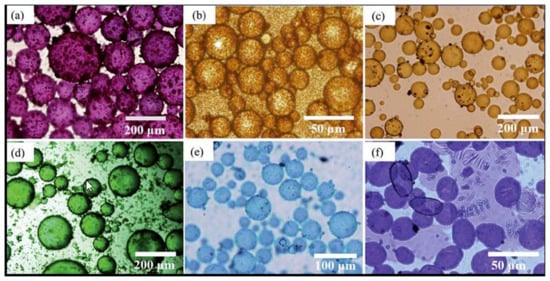
Figure 4.
Optical microscope images of Pickering emulsions stabilized with pigment particles: (a) Irgalite Red D 3707, (b) Cromophtal K 2960, (c) Paliotol Yellow K 0961, (d) Heliogen Grun K 8730, (e) Heliogen Blau K 6907, (f) Cromophtal Violet D 5700. Emulsions depicted in images (a,c–f) are W/O. The emulsion shown in (b) is O/W. Adapted from [73], published under a Creative Commons Attribution 3.0 License. Copyright © 2017 Royal Society of Chemistry.
Another limitation of conventional bright field light microscopy is limited imaging capabilities in the case of 3D objects, such as crystals of fat or ice (in frozen emulsions), or air bubbles. Polarization light microscopy is a valuable tool for three-dimensional imaging of such objects. As can be seen in Figure 5 [74], there is a striking difference between images of fat crystals in emulsions observed using a transmitted light microscope and a polarized light microscope. Although conventional transmitted light microscopy allows for the visualization of emulsion droplets, it fails to clearly recognize transparent fat crystals against a bright background. The visibility of fat crystals under polarized light is greatly improved; however, this method fails to show the structure of the emulsion in the background. For this reason, it is advisable to combine several different microscopic techniques to obtain reliable information about emulsion structure.
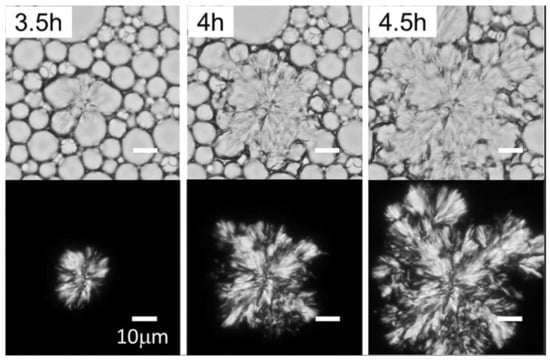
Figure 5.
Fat crystals formed during the destabilization of canola oil-in-water (O/W) emulsion by freeze-thawing as a result of partial coalescence of canola oil droplets. Adapted with permission from [72]. Copyright © 2016 Elsevier Ltd.
The techniques widely used to complement the information about emulsion structure gathered from white light microscopy are fluorescent microscopy and confocal laser scanning microscopy (CLSM) [75]. These approaches can be applied to assess emulsions containing compounds that display inherent fluorescence when exposed to light (autofluorescence), which is typical for many oils (e.g., aromatic hydrocarbons), vitamins (e.g., A, B2, E, and D), proteins, toxins (e.g., aflatoxin), metabolites, plant pigments (e.g., chlorophyll), and flavoring compounds [76]. Auto-fluorescent compounds can easily be differentiated from other emulsion components, as well as particles and air bubbles that may be present in the sample. The fluorescence of the oil phase can also be enhanced by adding fluorescent oleophilic dyes such as 3-alkoxyflavone or Nile Red [77]. Non-fluorescent compounds present in the emulsions, such as proteins, surfactants, contaminants, etc., can be visualized using fluorescent probes that selectively bind to target molecules. In addition, the fluorescence emitted by these molecules can be utilized for quantitative analysis of their content in the emulsion by fluorescence spectroscopy.
Fluorescent dyes can be used to analyze the structure and stabilization mechanisms of emulsions. High-contrast images of emulsions comprising non-fluorescent oil and water phases can be obtained by labeling the oil-water interface using fluorescent stabilizers, such as carbon nitride quantum dots, combined with solid supports, e.g., laponite nanoparticles (Figure 6) [78] or fluorescent dyes, e.g., NBD [79]. Using fluorescent surfactants to stabilize emulsions can provide information on the localization and behavior of emulsifier molecules at the oil-water interface. Thijssen et al. [78] have demonstrated that NBD, a common fluorescent dye, can effectively act as a surfactant. However, they have also revealed that the dye substantially affected the behavior of other particles adsorbed to the liquid-liquid interface, which altered the interfacial tension and the particle contact angle. This should be taken into account in studies utilizing fluorescent probes for labeling and in situ imaging of emulsion components.
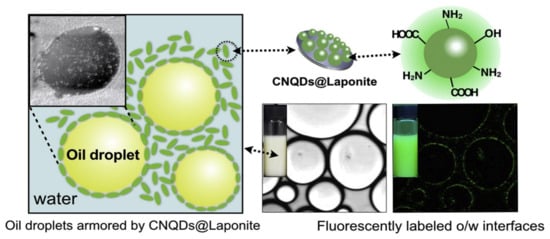
Figure 6.
A Pickering O/W emulsion (paraffin in water) stabilized with highly fluorescent carbon nitride quantum dots combined with solid laponite nanoparticles Adapted with permission from [78]. Copyright © 2018 Elsevier B.V.
Fluorescent microscopy and CLSM are typically employed for the visualization of emulsions containing droplets with sizes down to ~300 nm [69]. Since, over the last few decades, the size of emulsion droplets has reached the lower end of the nanometer scale, visualization by optical microscopy has become insufficient to provide reliable data on nanoemulsion structure. Therefore, optical microscopy has been largely replaced by electron microscopy, which offers much higher resolution and allows imaging structures with sizes down to 0.1 nm [69]. The excellent resolution of electron microscopy allows visualization of multi-lamellar structures, vesicles, micelles, crystals, and liposomes, which remain undetected by both optical microscopy and particle size analyzers [80].
Electron microscopy techniques can be divided into transmission electron microscopy (TEM) and scanning electron microscopy (SEM). The SEM analysis offers the advantage of obtaining topographical information at a significant depth of focus on a 2D image [80]. SEM generates images of a sample by scanning the surface with a focused beam of electrons accelerated under high voltage. The electrons penetrate the specimen and are deflected by elastic scattering. As a result of the interactions between electrons and the specimen, electron signals (backscattered and secondary electrons), and X-rays are generated. Backscattered electrons are high-energy electrons scattered out of the sample that originate from deeper regions of the specimen. They provide valuable information about the composition of the sample. Secondary electrons are low-energy electrons, which have penetrated the surface regions of the sample a few nanometers below its surface. They reveal topographic information about the structure of the specimen surface. X-rays produced when electrons reach the sample give information about its elemental composition. These signals are collected by electron detectors to form a gray-scale image.
The advantages of SEM that have made it one of the most popular tools for the ultrastructural analysis of emulsions include detailed topographical information of the sample surface, which cannot be obtained in two-dimensional projections produced by TEM, and a high depth of focus. The depth of focus at low magnifications can reach a few millimeters. However, preserving the shape and size of emulsion droplets during SEM analysis is challenging, and requires specific SEM fixation protocols [81]. Other limitations include a lack of information on the internal structure of the sample, limited resolution, and the risk of damaging the specimen structure, especially after prolonged exposure to the electron beam [80].
TEM is one of the most powerful methods for the analysis of emulsion structure. The high resolution of TEM has rendered this technique an indispensable tool for imaging emulsions comprising droplets in the nanometer and sub-nanometer size range (down to 0.1 nm) [82,83]. Before TEM analysis, a 2–5 µL sample of emulsion is deposited onto a carbon- or polymer-coated grid and dried for up to several hours. Alternatively, the sample may be cooled to cryogenic temperatures, which allows preservation of its native state. During imaging, a beam of electrons passes through an ultra-thin (<200 nm) sample of emulsion at high (60–200 kV) accelerating voltage. The electrons transmitted through the specimen are cast onto a fluorescent screen producing a high-resolution image. Typically, a bright field TEM imaging combined with diffraction mode is used for the characterization of the size and shape of emulsion droplets [84].
The main limitation of both SEM and TEM techniques is that they require relatively complex preparation of the sample before observation, which often involves dilution, spreading, drying, or freezing and may alter the original emulsion structure [71]. As a result, obtained images are often not representative of the sample in a liquid state [85]. The degree to which the original structure of the emulsion is maintained is highly dependent on the technique applied to fix the sample [80]. For example, chemical fixation with glutaraldehyde is known to distort native emulsion structure by causing the shrinking of oil droplets and is therefore considered unsuitable for emulsions [86]. Among other methods, fixation by cryogenic freezing, in which sample characterization is carried out in a vitreous frozen-hydrated state, has been shown as the most reliable [87]. In this approach, the water contained in the sample is transformed from a liquid to an amorphous solid state by vitrification without the formation of ice crystals. Avoiding the formation of ice crystals within the water phase allows the prevention of structural damage to emulsion droplets [88]. Cryogenic freezing can be used to fix emulsions before observation with both SEM and TEM [87]. However, to account for any changes that may have occurred in the structure of the emulsion during microscopic evaluation, it is necessary to verify the obtained data with other analytical methods such as droplet size analysis.
One of the most promising techniques for emulsion imaging that may open new perspectives in understanding the behavior of these complex systems is atomic force microscopy (AFM). This technique allows direct visualization of emulsion interfacial films (Figure 7) and analysis of their tightness, integrity, morphology, and structure. This can provide crucial insights into emulsion stability and separation phenomena, as well as the behavior of molecules at the droplet interfaces [89]. For example, AFM can be utilized to examine the competitive adsorption of various emulsifier molecules at the oil-water interface [90]. Morris et. al. used AFM to visualize the gradual displacement of milk protein β-lactoglobulin from an air-water interface by the water-soluble surfactant Tween 20 [90]. AFM has also been used to study the formation and arrangement of multi-layer films at the oil-water interface, providing a deeper understanding of the stabilization mechanisms in more complex interfacial layers. Recent technological advancements in AFM have allowed the visualization and quantification of interfacial interactions at a nanoscale level [91]. By utilizing nano-structured probes for scanning material surfaces at sub-nanometric and atomic resolution, AFM can provide information on the surface interaction forces as well as micro/nano-structured surface topography [92].
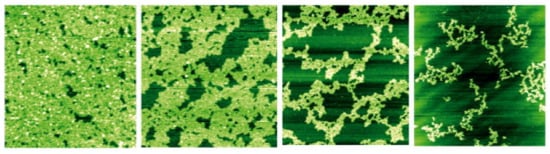
Figure 7.
An interfacial film in emulsion stabilized with β-lactoglobulin visualized by atomic force microscopy (AMF). The images show the gradual displacement of β-lactoglobulin molecules from the interfacial film at an air-water interface by the progressive addition of the water-soluble surfactant Tween 20. The images were obtained by spreading the protein at the interface and then adding the surfactant to the bulk phase. Adapted with permission from [92]. Copyright © 2004 Elsevier Ltd.
One of the significant limitations of AFM analysis of emulsion droplets is that it can be time-consuming and labor-intensive. Since, in most studies on emulsions via AFM, the imaging is performed under dry conditions (in the air mode), the droplets need to be deposited on a solid matrix by the Langmuir–Blodgett technique [93] and dehydrated before observation [88]. The process of depositing air-water or oil-water interfacial films onto a solid matrix is not only highly intricate and difficult but may also alter the native emulsion structure. However, the transfer process of air-water interfacial films is more convenient and operable compared to oil-water interfacial films. This has led to a greater focus on visualization studies of air-water interfacial films, while the oil-water interfaces are less often explored. Therefore, there is an urgent need for new techniques that allow for the direct in situ visualization of nanodroplet interfaces in liquid nanoemulsions. The use of surface force apparatus in conjunction with atomic force microscopy can provide novel insights into the complexities of emulsion stabilization mechanisms [94]. Another downside of AFM lies in the fact that it does not provide information on the internal structure or composition of emulsion droplets, as it primarily focuses on surface topography. AFM measurements on nanodroplets present certain limitations due to their deformable soft surfaces. Such surfaces may present challenges in accurately measuring their mechanical properties and surface roughness and can be easily damaged during the probing process.
3.2. Droplet Size Analysis
Droplet size is one of the most vital characteristics of emulsions, determining their stability and physicochemical properties. Emulsion droplet size and size distribution are typically analyzed by dynamic light scattering [95], small-angle X-ray scattering, ultrasonic spectrometry, or electrical pulse counting techniques [29,37] (Figure 8).
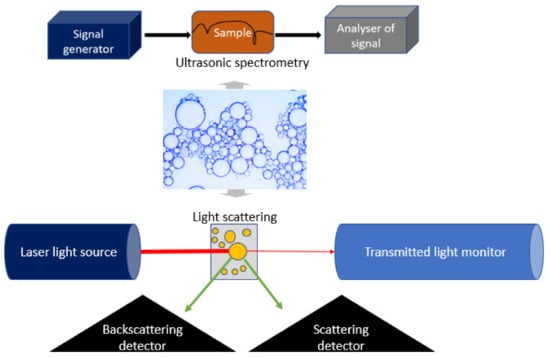
Figure 8.
Evaluation of emulsion droplet size, size distribution, and stability using ultrasonic spectrometry (upper panel) and light scattering (bottom panel).
The analysis is typically performed using fully automated particle size analyzers, which allow measurements of large numbers of droplets within several minutes or less. There are two main categories of commercially available light scattering instruments for particle size analysis: dynamic and static light scattering devices [96]. Dynamic light scattering (DLS) devices measure the intensity fluctuation of light scattered by the emulsion droplets by assuming that smaller particles move faster than larger ones and create a higher rate of intensity fluctuation. When a monochromatic light beam passes through an emulsion, the light is scattered by the droplets undergoing the Brownian motion at a certain angle [83]. The random movement of emulsion droplets causes rapid fluctuations in the intensity of scattered light, which are dependent on droplet size. The percentage and angle of backscattered light are recorded by a detector [97] and converted into the photocount (intensity)–time correlation, which is further used to calculate droplet size, size distribution, concentration, and polydispersity index (PDI). The polydispersity index describes the uniformity of droplet size and can take values between 0 and 1 with 0 corresponding to completely monodisperse systems [83].
Dynamic light scattering devices generally operate using a specific, fixed, or variable scattering angle and mathematically convert the fluctuation intensity into particle size distribution (PSD). This approach is utilized for particles ranging from 3 nm to 5 μm in size. The static light scattering instruments operate based on Mie’s light scattering theory and utilize parameters, such as particle refractive index and shape, to determine the size of particles measuring from 100 nm to 1000 μm. Small-angle X-ray scattering (SAXS) techniques are based on a similar principle as the DLS method, but instead of a light beam, they use a monochromatic beam of X-rays that are scattered by emulsion droplets in a size-dependent manner.
The results from droplet size analysis are typically depicted on histograms (Figure 9). In the case of stable emulsions (Figure 9A), the histogram shows one peak, which represents a population of small droplets that are relatively uniform in size. Droplet sizes remain within a relatively narrow range (1–10 μm). In contrast, in unstable emulsion separating through coalescence (Figure 9B), two populations of droplets, small and large (represented by two peaks on the histogram) are present at the same time. In addition, the uniformity of the droplet size decreases, which is clearly visible on the histogram as the widening of both peaks, corresponding to the range of droplet sizes becoming wider.
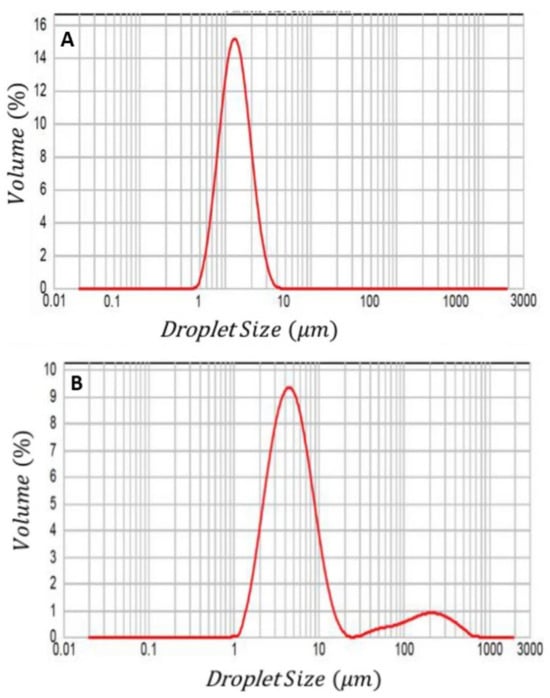
Figure 9.
Histograms showing droplet size distribution in stable emulsion (A) and unstable emulsion separating through coalescence (B). Adapted with permission from [66]. Copyright © 2023 Springer Nature.
The polydispersity index serves as a crucial indicator of emulsion stability, as it directly correlates with the uniformity of droplet sizes. A lower PDI value indicates a more uniform distribution of droplet sizes and higher emulsion stability, whereas an increase in PDI reflects destabilization of the emulsion leading to high variation in droplet size. In emulsions where coalescence and flocculation occur, the droplet size varies widely, leading to a higher PDI. Tracking changes in emulsion PDI over time can provide valuable insights into the emulsion’s performance and stability under different manufacturing, processing, and storage conditions.
Although DLS is capable of measuring droplets with sizes down to 3 nm, its reliability in assessing polydisperse samples may be significantly compromised [98,99,100]. This results from the fact that the light scattering intensity fluctuation detected by DLS is theoretically linked to the sixth power of the droplet size According to manufacturers of DLS instruments, a sample is considered monodisperse if its polydispersity index (PDI) is below 0.1, moderately polydisperse within the range of 0.1–0.4, and polydisperse if the PDI exceeds 0.4. When the polydispersity index (PDI) in DLS is elevated, and the direct method indicates a non-normal particle size distribution, the reliability of particle size measurements is significantly diminished. Under such circumstances, it becomes feasible to conduct high-resolution liquid sample measurements using a combination of Multi-Angle Light Scattering (MALS) and DLS with size-exclusion chromatography (SEC) or field flow fractionation (FFF) [101,102]. However, these measurements rely on the assumption that the separation process does not impact the particles of interest. As will be discussed later, FFF necessitates intricate measurement conditions, and particles may potentially interact with the membrane or channel walls.
Some particle size analyzers have the capability of performing automatic analysis of emulsion stability over time [97]. An example of such an instrument is the Turbiscan®, which operates based on the principles of multiple light scattering and permits the assessment of phase separation phenomena, such as creaming or sedimentation [103,104]. The operation of this device relies on vertical scanning of the emulsion, enabling the real-time detection of changes in backscattering (BS) and transmission (T) intensities over time. During static multiple light scattering, a light source with a wavelength of 850 nm is directed onto the emulsion sample, and both backscattering and transmission signals are collected [105]. The acquired signals are associated with droplet concentration and size, as described by the Mie theory [106]. By repeatedly performing these measurements with a suitable frequency, the instrument allows for the continuous monitoring of physical stability, which provides insight into the development of emulsion instabilities.
Despite being some of the most fundamental tools for emulsion characterization and stability assessment, particle size analyzers relying on dynamic light scattering have significant shortcomings. The first is reduced accuracy of measurement at high droplet concentrations, resulting from the occurrence of multiple scattering effects. Multiple scattering is a common problem that causes overestimation of droplet size. As a result, emulsion samples with high droplet concentrations need to be diluted before measurement [21]. However, dilution of emulsions may induce destabilization processes, including flocculation and coalescence, which in turn makes the results unreflective of the original sample.
Furthermore, the calculation of droplet size in these devices is most often based on the assumption that the shape of the droplets is spherical, which in real-life samples may not often be the case. For emulsions containing droplets deviating in shape from the sphere, this assumption may lead to significant under- or overestimation of droplet size. Numerous studies have shown that there are significant discrepancies between data obtained from DLS and microscopic analysis. For instance, Preetz et al. [107] demonstrated that, despite DLS data collected over months of emulsion monitoring indicating excellent emulsion stability, a microscopic analysis of the same sample showed substantial changes in its internal structure. The authors observed that, while the average size of the droplets determined by DLS was 150 nm, droplet size established based on freeze-fracture TEM and confirmed by AFM varied between 50 and 500 nm, with the majority of the droplets measuring around 100 nm. These and similar findings from other studies indicate that DLS data needs to be confirmed by additional analytical methods, including microscopic analysis, field-flow fractionation [108], nuclear magnetic resonance spectroscopy [109], or Fourier transform infrared spectroscopy [110].
Another group of particle size analyzers frequently used for emulsion characterization are devices that utilize electrical pulse counting. The electrical pulse counting is performed in setups comprising a glass tube with two electrodes and a small hole, through which the emulsion sample is drawn. Electrical pulse counting methods rely on the measurement of variations in the electrical conductivity of the sample caused by the passing of the emulsion droplets between two electrodes [111]. Since oils have much lower electrical conductivity than water, droplets passing between the electrodes affect the electrical current flowing through the emulsion, creating electrical pulses. Droplet size is determined based on the assumption that larger particles move more slowly and create larger electrical pulses.
This technique is appropriate for measuring droplets ranging in diameter from 0.4 μm to 1200 μm [28]. The measurement is constrained by the size of the hole in the glass tube, which requires adjustments to accommodate a wide range of droplet sizes. Additionally, similarly to the methods using light scattering, emulsion samples need to be diluted before measurement. High concentrations of droplets in the sample hinder the smooth passage of single droplets into the glass tube. Therefore, while suitable for droplet size analysis, this method is not ideal for studying the flocculation process, as dilution can disrupt the gathered droplets and result in misinterpretation of data on emulsion stability.
A method enabling the determination of droplet size in emulsions with high droplet concentrations (up to 50%) without dilution is ultrasonic spectrometry [112]. This technique estimates emulsion droplet size and concentration based on the scattering of the ultrasound waves transmitted through the emulsion. Scattering of the ultrasound waves by the droplets leads to a decrease in velocity and an increase in attenuation of the frequency of ultrasonic waves. Ultrasonic spectroscopy can be used to determine droplet sizes ranging from 10 nm to 1000 μm. Its major advantage over other particle size analyzers lies in its ability to characterize not only concentrated but also optically opaque emulsions.
3.3. Determination of Emulsion Optical Properties
Since many applications require that emulsions are optically clear (e.g., eye drop formulations), transparency is an important parameter considered at the product development stage. Optical properties of emulsions, such as transparency, opacity, turbidity, and color, depend on the degree of absorption and scattering of light passing through the sample [41]. The changes in optical properties can be visually observed or quantitatively measured using colorimeters, refractometers, and UV–vis spectrophotometers.
Colorimeters quantify parameters, such as brightness, hue, and saturation, to measure the color and appearance of emulsions, while spectrophotometers measure the absorption and reflection of light by emulsions across a wide range of wavelengths. Spectrophotometers record the emulsion absorbance spectra by detecting the amount of light absorbed while passing through a sample. Refractometers are used to measure the refractive index of emulsions. During measurement, a drop of emulsion is placed onto a slide and introduced into a refractometer. The refractive index describes how fast light travels through the analyzed sample and is expressed as the ratio of the speed of light in a vacuum and the phase velocity of light in the assessed medium. The calculated value is compared to the refractive index of the reference medium, e.g., distilled water, which is considered the most transmittable liquid. If the refractive index of the emulsion is equal to or close to that of water (1.333), the emulsion is considered transparent [67,113].
Analysis of optical properties is non-destructive and can provide real-time monitoring of emulsion stability, making it a valuable tool in quality control and product development. As the appearance of emulsions is strongly influenced by droplet concentration, size, and distribution, measuring the optical properties of emulsions over time can provide valuable information on destabilization processes that may occur in the system [114]. For example, as the emulsion undergoes coalescence, the droplet size distribution changes, leading to alterations in the overall appearance of the emulsion. As larger droplets form due to coalescence, the emulsion becomes less transparent, more opaque, and turbid. Additionally, the color intensity may increase due to the merging of the droplets [77]. When flocculation occurs [115], the formation of flocs or droplet aggregates leads to increased light scattering and reduced transparency of the emulsion. This increase in light scattering contributes to the higher turbidity of the emulsion, making it appear cloudy or hazy. The color intensity of the emulsion may also change due to a different optical density or color of the flocs compared to the individual droplets. Similar changes can be observed when emulsion separates through Ostwald ripening. As Ostwald ripening progresses, the average droplet size in the emulsion increases, leading to changes in light scattering and absorption and a decrease in transparency.
3.4. Rheological Analysis of Emulsions
Investigating the rheological properties of emulsions provides insight into their behavior and stability. The complex interplay between stability and time-dependent changes in the rheological properties of emulsions influences their quality and functionality in various applications [116]. Understanding the thixotropic behavior, viscoelastic properties, and shear thinning behavior of emulsions is essential for product formulation and development, achieving the desired functional attributes, and optimizing emulsion performance at different stages of manufacturing, processing, packing, and storage. Characterization of the rheological properties of emulsions plays a fundamental role in predicting their response to external conditions, such as pressure, temperature, centrifugal force, applied to emulsions during technological operations, such as mixing, pumping, pouring, leveling, etc. [117]. Furthermore, the rheological properties of emulsions allow for monitoring their stability over time, which directly translates to their shelf-life. Quantitative analysis of emulsion rheological properties provides also important information about their visual and sensory properties, such as appearance, texture, creaminess, consistency, and mouthfeel [118], which strongly influence the acceptance of commercial formulations by consumers and their preferences when choosing products.
Rheological analysis of emulsions aims to determine the deformation and flow properties of emulsions under different conditions. The key parameters that determine the rheology of emulsions are the chemical composition and rheological properties of the continuous and dispersed phases, phase volume ratio, the structure of the emulsion including droplet size, concentration and distribution, droplet characteristics, such as deformability, internal viscosity, and inter-droplet interactions (e.g., steric interactions, electrostatic repulsion, and van der Waals attraction) [44], elasticity and composition of the interfacial layer (including concentration and type of the emulsifier), as well other colloidal interactions within the emulsion system.
Emulsions vary greatly in terms of their rheological properties, from low-viscosity Newtonian liquids such as milk, through non-Newtonian, shear-thinning liquids that become less viscous under shear stress [119], to shear-thickening formulations, whose viscosity increases under shear stress, such as salad dressings, mayonnaise or creams. Flow curves offer important insights into the rheological behavior of emulsions. They depict the correlation between shear stress and shear rate, aiding in comprehending the flow characteristics of emulsions and defining their viscosity and shear thinning behavior. Therefore, flow curves can indicate whether the emulsion displays Newtonian or non-Newtonian behavior, Additionally, flow curves help define emulsion resistance to flow, showcasing its capability to maintain structure under varying shear conditions, which is essential for establishing suitable processing conditions [119].
The rheological properties of emulsions are largely dependent on the nature and characteristics of the continuous phase, including its chemical composition, pH, and viscosity [120]. The viscosity of the continuous phase has a major impact on the gravitational separation of the emulsion [121]. For example, a more viscous continuous phase can hinder droplet movement, thereby inhibiting the creaming or sedimentation processes [88]. At the same time, lower mobility of the droplets may promote flocculation or coalescence, leading to increased instability of the emulsion.
The rheological properties of emulsions can be altered by adding polymers or hydrocolloids, such as thickeners and texture modifiers (e.g., pectin, modified cellulose, gum arabic, corn fiber gum, modified starch, polysaccharide-protein complexes, etc.) [122]. Due to their high molecular weight, they exhibit a thickening effect and create a network that enhances emulsion stability by increasing its viscosity and the thickness of interfacial film [123]. As a result, hydrocolloid-stabilized emulsions display improved long-term stability compared to emulsions stabilized with proteins and small molecule surfactants [124]. Texture modifiers also improve the textural and functional attributes of the emulsion, such as gelation mechanism, gel strength, and fracture properties.
Other parameters that significantly impact the rheological behavior of emulsions include the concentration of the dispersed phase, the size, and distribution of the dispersed droplets, as well as the presence of solid particles [125]. At higher volume ratios, emulsions typically exhibit non-Newtonian behavior. Smaller droplets tend to decrease the viscosity of emulsions due to reduced interfacial area and improved packing efficiency. The reduction in viscosity is attributed to the decreased resistance to flow exhibited by the smaller droplets. Conversely, larger droplets lead to increased viscosity due to enhanced droplet interactions and a higher dispersed phase volume. The interactions between larger droplets result in higher resistance to flow, thus increasing the viscosity of the emulsion [126]. Furthermore, the presence of solid particles in particle-stabilized emulsions, also known as Pickering emulsions, such as colloidal particles or nanoparticles, can significantly alter the rheology of the emulsion, influencing its flow behavior and overall texture. These particles can act as fillers or thickeners, contributing to increased emulsion viscosity and improved stability.
The rheology of emulsions is also strongly related to the structure, thickness, and elasticity of the adsorption layer at the interface between the dispersed and the continuous phase. The properties of the interface influence droplet size distribution, coalescence, and flocculation [37]. The interface layer shields the internal liquid from velocity gradients across the continuous phase. A thick and elastic interfacial layer creates strong steric hindrance, which is key for the stability of the emulsion [88]. Studies comparing the thickness of the interfacial films in emulsions stabilized by different types of surfactants revealed that the thickest interfacial layers are formed by hydrocolloids and solid particles (10 nm to several mm and 5–10 nm, respectively) followed by proteins (1–5 nm), while the thinnest layers are generated by low molecular weight surfactants (0.5–1 nm) [123]. Moreover, emulsions stabilized by multilayer adsorption films exhibit greater stability due to higher thickness compared to single-layer films [127]. The interfacial layer thickness is linked also to the concentration of the emulsifying agent. In general, at higher emulsifier concentrations, the adsorption layer at the interface becomes thicker and more rigid, leading to increased viscosity and elastic behavior of the emulsion.
Another crucial aspect affecting emulsion rheological behavior and stability is the elasticity of the interfacial layer. More elastic interfacial films prevent the aggregation and coalescence of the droplets, resulting in improved long-term stability of the emulsion [128]. On the other hand, a less elastic interfacial layer may intensify droplet coalescence and flocculation, thus reducing stability and increasing the viscosity of the emulsion. Higher elasticity of the adsorption layer contributes also to the viscoelastic behavior of emulsions. A more elastic adsorption layer can give the emulsion viscoelastic properties, such as shear-thinning. Conversely, if the relative rigidity of the interface is high, the rheological behavior of the emulsion may mimic a dispersion of solid particles [129].
The flow properties of emulsions can be divided into linear and non-linear [119]. The linear viscoelastic properties are measured within the range of stress, strain, and shear rates, in which the measured properties depend only on frequency and time (as well as temperature and pressure). These properties include the frequency-dependent storage and loss moduli, G’ and G”, the various combinations of these such as complex modulus G*, the phase lag, and the time-dependent creep compliance. The storage modulus G’ serves as an indicator of the elastic component within the viscoelastic behavior, effectively capturing the solid-state characteristics of the sample. In contrast, the loss modulus as G”, delineates the viscous component of the viscoelastic behavior, reflective of the liquid-state properties of the sample. G’ symbolizes the stored deformation energy, while G” characterizes the deformation energy lost (dissipated) through internal friction when flowing. Viscoelastic solids with G’ > G” have a higher storage modulus than loss modulus, whereas viscoelastic liquids with G” > G’ have a higher loss modulus than storage modulus. While, typically, these properties may not apply to high-stress technical applications, they are valuable for evaluating the microstructure and stability of emulsions [119].
The non-linear characteristics of emulsions include properties that are influenced by the applied stress, strain, or shear rate. These properties include the non-linear variations of the moduli and compliances, mentioned above, and viscosity. Viscosity is one of the most basic parameters describing the rheological properties of emulsions, which enables distinction between whether the analyzed sample is a classic (O/W) emulsion or reverse (W/O) emulsion. In general, low viscosity indicates O/W emulsion, while high viscosity indicates W/O emulsion [113].
The viscosity of emulsions can be measured with various types of viscometers, such as capillary, rotational, falling-ball, oscillatory, torque, and interfacial viscometers [33]. Based on the geometry of the measurement cell, rheometers can be divided into several categories including spindle, concentric cylinder, parallel plate (plate-plate), cone–cone, cone–plate, and vane spindle apparatuses, depicted in Figure 10 [129]. Dynamic shear rheometers, such as the Brookfield rotational rheometer, are the most frequently used devices for simple single-speed viscosity measurements of emulsions. This type of viscometer applies shearing deformation force and measures viscosity based on the torque required to rotate a spindle immersed in the fluid, which increases proportionally to the viscosity of the analyzed sample.
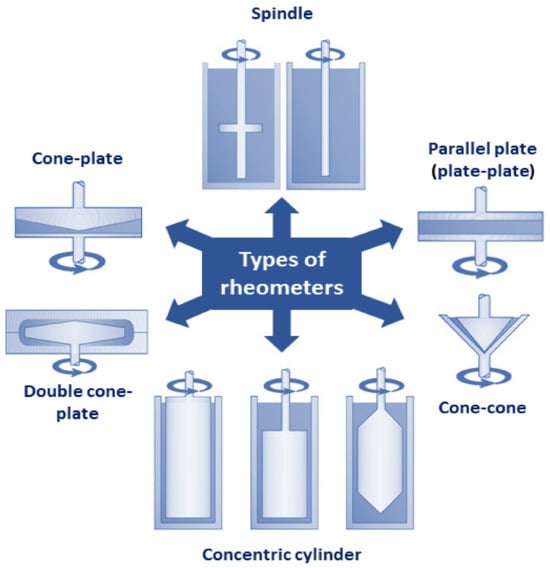
Figure 10.
Classification of rheometers based on geometry of measurement cell: spindle, concentric cylinder, parallel plate (plate–plate), cone–cone, cone–plate, double cone–plate.
However, single-speed viscosity measurements are not sufficient to characterize the rheology of emulsions, the majority of which are complex non-Newtonian liquids, whose viscosity decreases as the applied shear rate increases or vice versa. As a result, emulsions require a much more thorough rheological analysis, including a comprehensive assessment of their oscillatory shear behavior. Oscillatory shear tests involve subjecting emulsions to alternating shear stresses to study their responses under dynamic conditions [130]. This type of analysis provides valuable insights into the viscoelastic behavior of emulsions, including their ability to deform and flow under various stress conditions.
Dynamic oscillatory shear tests involve subjecting a material to sinusoidal deformation and measuring the resulting mechanical response over time. Most emulsions, when subjected to shear stress, display rheological properties characteristic of both fluids and solids [118]. As a result, during oscillatory shear tests, emulsions typically exhibit a range of dynamic responses, such as elastic (storage) and viscous (loss) moduli, phase shifts, and shear thinning behavior [131]. The elastic modulus represents the stored energy in the emulsion, reflecting its ability to recover after deformation, while the viscous modulus characterizes the energy dissipation and flow resistance. These moduli are crucial in understanding the stability and texture of emulsions, especially in applications where elastic or viscous properties are essential. The phase shift between stress and strain in oscillatory shear tests provides information about the nature of the interactions within the emulsions, such as droplet collisions, interfacial interactions, and structural rearrangements. Understanding these phase shifts helps predict the stability and structural changes of emulsions under different processing and storage conditions. Oscillatory shear behavior can reveal shear-thinning properties in emulsions, where the viscosity decreases under increasing stress amplitudes. This shear sensitivity is vital in industrial applications, such as food and pharmaceutical processing, as it affects the pourability, spreadability, and mouthfeel of emulsion-based products.
Across measurements of oscillatory shear behavior, we could underline the amplitude, frequency, or temperature sweep test. The amplitude sweep test can be performed by varying the oscillatory stress (e.g., in the range of 0.01–100 Pa) at a fixed frequency (e.g., 1 Hz). This measurement can show a linear viscoelastic region (LVR), in which G′ (storage modulus) and G” (viscous modulus) are almost constant and, later, a nonlinear region, in which G′ and G” start to change [132]. The oscillatory stress value, where G′ sharply decreases, is defined as the critical oscillatory stress, also known as the limiting value of oscillatory stress (OSL). Obtaining the OSL value is crucial, as it indicates the maximum deformation that a system can withstand without structural breakdown [133]. Here, we can investigate how the composition or processing of emulsions can impact their strength and rigidity during storage at a defined time, temperature, or other conditions of our choice.
During the frequency sweep test, the viscous and elastic behavior of emulsions can be monitored [133]. During storage, we can test the emulsions within a defined experimental frequency range (e.g., 0.01–10 Hz) and observe if the samples display gel-like behavior, resembling a solid rather than a liquid, or the other way around. Deformation can be interpreted as elastic and recoverable. In order to determine the frequency dependence of the G’ parameter (n’), we can apply a power-law relation. Parameter n’ close to 1 indicates that the system behaves as a viscous gel, whereas a low n’ parameter shows characteristics of elastic gels. To determine the sensitivity of the sample structure to thermal changes, a temperature sweep test can be conducted. In this test, we can observe the changes in the elastic behavior of the emulsion with a temperature increase, such as melting or transformation of the liquid state into a gel state (sol-gel transition), which can be related to the composition of the emulsifier [134,135].
To accurately reflect the rheological behavior of emulsions, their rheological properties should be measured under conditions mimicking real-life environments in terms of temperature, pressure, mechanical stress, shear rate, etc. For example, the assessment of emulsion long-term stability should be performed under creeping flow conditions that simulate storage environments. Creeping flow (also known as Stokes flow) is defined as a non-turbulent flow, in which fluid flow velocity is very low and the Reynolds number is below 1 [136]. Under such conditions, inertial effects are negligible, while the dominant role is played by the viscous forces and viscous resistance.
The viscosity of emulsions stored under creeping flow conditions, at some point, reaches a plateau known as zero-shear viscosity. Zero-shear viscosity describes the mobility of the droplets or droplet flocs/aggregates within the emulsion. An emulsion with a high zero-shear viscosity exhibits low droplet movement, which translates to a limited incidence of interactions between droplets that may lead to coalescence and reduced separation processes. Therefore, a formulation based on such emulsion would be expected to display a prolonged shelf-life.
Zero-shear viscosity of emulsions may be approximated based on Stokes’ Law by calculating the terminal velocity of a droplet (v) moving through the viscous continuous phase. The terminal droplet velocity v is related to the drag force (Fd) acting on the droplet on the interface between the continuous and the dispersed phase (also known as frictional force or Stokes’ drag), continuous phase viscosity (μ), and droplet radius (R), as given in Equation (1):
According to Stoke’s law, the resistance of the emulsion to instabilities caused by droplet flocculation becomes higher as its viscosity increases [37]. Nevertheless, the application of the Stokes equation to real-life emulsions is limited, as it assumes no interactions between droplets moving through the fluid.
Fd = 6πµRv
The more accurate method to establish emulsion zero-shear viscosity is based on the experimental determination of changes in emulsion viscosity under different levels of shear stress. In this approach, the range of zero-shear stress viscosity is identified based on the curve depicting the correlation between viscosity and shear stress obtained by fitting a set of experimental data. For instance, Figure 11 shows the effect of shear stress on the viscosity of five cosmetic emulsions. Body Lotion A demonstrates a zero-shear viscosity plateau of around 103 Pa·s (1 million centiPoise), whereas Day Cream A exhibits zero-shear viscosity at approximately 7 × 10⁴ Pa·s (70 million centiPoise). This implies that lotion A has around 70 times higher droplet mobility than cream A, which may contribute to its substantially shorter shelf-life.
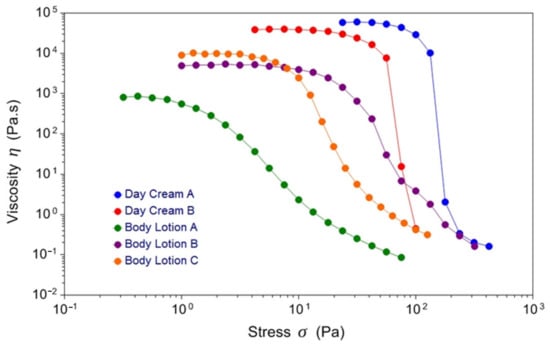
Figure 11.
Rheological behavior of five cosmetic emulsions. Reprinted with permission from [137]. Copyright © 1999–2023 John Wiley and Sons, Inc.
The rheological properties of emulsions are strongly related to their stability. Depending on the nature and mechanism of destabilization processes occurring in the system, emulsion rheology can be affected in numerous ways. Separation of the emulsion through flocculation tends to increase its relative viscosity due to the entrapment of liquid within droplet flocs, and an increase in floc volume fraction compared to single droplets. On the other hand, coalescence and Ostwald ripening may reduce the relative viscosity, especially in high-volume fraction emulsions. Phase inversion leads to a substantial decrease in emulsion viscosity due to the drastically reduced volume of the dispersed phase after inversion. The reduction results from the fact that the volume of the continuous phase (which becomes the dispersed phase after the inversion) is typically lower than the volume of the dispersed phase. However, correlating rheological parameters to emulsion breakdown phenomena has been challenging due to the complexity and overlapping timing of multiple separation processes. Therefore, changes in the rheological behavior of emulsions may not directly relate to stability. As a result, rheological analysis alone cannot provide a reliable prediction of long-term emulsion stability.
Another limitation of the rheological analysis of emulsions is related to anomalies exhibited by emulsions during measurements with rheometers and viscometers due to inertia and slip. To avoid false measurements, it is important to ensure that data is collected under conditions of constant shear rate. This requirement is typically met by small (<4 inches) cone-and-plate apparatuses or concentric cylinder geometries with a gap-to-radius ratio ≥ 0.95. When using geometries that do not meet this criterion, intermediate calculations must be performed before establishing an accurate viscosity–shear rate relationship [138]. Due to the complexity of factors affecting the rheological properties of emulsions, they usually need to be evaluated using several different techniques before drawing conclusions from measurements.
3.5. Determination of Zeta Potential
The droplets of most emulsions are electrically charged due to the adsorption of charged or ionizable emulsifier molecules to their surface [28]. The charge of a droplet is determined by the type and concentration of adsorbed molecules, as well as the pH and composition of the continuous phase, particularly the presence of other charged species, such as ions or macromolecules. The most commonly analyzed parameter describing droplet surface charge is the ζ potential (zeta potential), defined as the potential difference between the charged droplet surface and the continuous phase. Zeta potential is a quantitative measure that allows the prediction and tracking of emulsion stability [139]. An increase in the zeta potential increases emulsion stability due to higher repulsive electrostatic forces between the droplets, preventing droplet coalescence and flocculation, which ultimately enhances the stability of the emulsion [120]. In general, a high negative or positive zeta potential (±30 mV) indicates a stable emulsion [140], whereas zeta potential values approaching 0 indicate non-stable systems [141].
Emulsion zeta potential can be measured with micro-electrophoretic analyzers, such as Zeta PALS [142] or Malvern Zetasizer [143]. These analyzers estimate zeta potential based on the electrophoretic mobility of emulsion droplets under an electric field. The direction of droplet movement is used to determine the sign of the electrical charge, while the velocity of the movement gives information on the magnitude of the electrical charge at the droplet surface. Emulsion droplet or particle surface charge influences ion distribution, creating an electrical double layer around the particle. Charged solid surfaces attract counter-ions from the solution, forming a surface potential that decreases with increasing distance from the particle surface. In liquid emulsions, the droplets are surrounded by two layers: one with strongly bound ions (inner layer) and another with loosely associated ions (outer diffuse layer), forming the electric double layer [16]. As the emulsion droplet moves, ions within the boundary move with it, while those beyond the boundary remain in the bulk dispersion. The interface between stationary and diffuse layers of counter-ions is called the “shear plane”, and its potential is the zeta potential (Figure 12).
Figure 12.
Schematic diagram of an electrical double layer formed around an emulsion droplet. The emulsion droplet (represented by the orange circle) is surrounded by two layers of ions. Strongly bound ions form the inner layer (indicated with a blue ring), while loosely bound ions—the outer diffuse layer (indicated with a red ring). The correlation between the zeta potential and the distance from the droplet surface is schematically depicted in the graph.
As mentioned above, the zeta potential value depends on the type and concentration of charges on the droplet surface and ions present in the continuous phase, as well as the pH of the system [144]. The interaction between droplets and surrounding ions plays a crucial role in determining the stability and behavior of emulsions over time [88]. A higher zeta potential value signifies stronger repulsion between droplets, which ultimately enhances the stability of the emulsion [145]. These repulsive forces prevent the coalescence and flocculation of droplets and thereby ensure their uniform dispersion within the emulsion [146].
When the zeta potential of the emulsion approaches zero, it becomes extremely unstable [147]. Stabilization of such systems can be achieved by the addition of charged molecules. For example, it has been demonstrated that unstable emulsions of rice bran protein-stabilized emulsions could be effectively stabilized by incorporating (+)-catechin in the formulation [148]. At the same time, the presence of the electrolytes with an opposite charge to the droplet surface charge in the continuous phase can neutralize the droplet surface potential, leading to the flocculation of the droplets and destabilization of the emulsion [149]. It is worth noting that zeta potential can also impact the molecular mass distributions of nanoemulsions—those with higher zeta potentials are electrically stabilized and display better physical stability by resisting coagulation or flocculation.
3.6. Determination of pH Value
The pH of emulsions can significantly affect their interfacial composition, stability, and aging [150]. The impact of pH on emulsion stability is ascribed to the ionization of polar groups in charged molecules present in the emulsion, such as surfactant molecules, ions, and electrolytes, which can generate electrostatic forces able to disrupt the interfacial layer [151]. Changes in pH also directly affect the zeta potential of the emulsion by altering surface droplet charge, which has a fundamental effect on electrostatic repulsion between the droplets. Optimizing pH conditions (e.g., by fabricating emulsions at different pH values, such as 2, 4, 6, 8, and 10 [152]) allows improvement in emulsion stability by preventing droplet coalescence and flocculation. It is worth noting that even slight changes in pH may significantly alter the stability of the emulsion. For example, it has been shown that, when milk is heated to temperatures above 70 °C at a pH of 6.5, a large fraction of denatured whey proteins is linked to casein micelles [153]. This interaction occurs through the creation of disulfide-linked complexes with κ-casein located on the micelle surface. However, at a higher pH value of 6.7, the extent of this association decreases and only about 30% of denatured whey proteins are connected to the surface of the casein micelles.
pH has a particularly pronounced effect on the stability of protein-stabilized emulsions. pH values impact the ionization degree and solubility of protein emulsifiers. When the pH of a protein-stabilized emulsion is far from the isoelectric point of the emulsifier, the protein molecules on the droplet surface exhibit a higher potential value. This results in higher zeta potential and increases repulsive force between the droplets, effectively preventing their flocculation and coalescence. Conversely, under pH conditions near the isoelectric point of the protein, the droplet surface potential becomes close to zero, leading to the destabilization of the emulsion [147].
3.7. Determination of Electrical Conductivity
Electrical conductivity plays a crucial role in characterizing emulsions, providing essential information about their stability, composition, and flow properties. The measurement of electrical conductivity serves as a valuable tool for researchers to gain insights into the nature of emulsions and efficiently control their stability over time [154]. Typically, higher concentrations and increased charge density of surfactants lead to higher electrical conductivity in the emulsion.
Several methods have been reported to measure the electrical conductivity of emulsions [71,155]. Electrical conductivity can be measured with a conductivity meter or probe, which is inserted into the emulsion sample to determine its ability to conduct an electric current. Conductivity measurements can be used to investigate the interactions between surfactants, predict emulsion long-term stability, and comprehend the mechanism of emulsion separation [155]. Numerous studies show that emulsions exhibiting elevated electrical conductivity display enhanced stability and minimized droplet coalescence [119]. The heightened electrical conductivity contributes to the development of electric double layers surrounding the droplets, acting as a barrier against droplet aggregation and flocculation. These double layers generate repulsive forces between the droplets, effectively impeding coalescence. Consequently, augmenting the concentration of surfactants with higher charges serves to bolster emulsion stability. Additionally, the introduction of conductive materials, such as carbon nanotubes, to emulsions can augment both their electrical conductivity and stability [156]. Tracing changes in the conductivity of emulsions containing different types and concentrations of emulsifiers, salts, or other conductive materials allows rapid prediction of emulsion stability.
3.8. Thermal Properties Analysis
Thermal characteristics of emulsions play a pivotal role in delineating their stability and functionality. These properties encompass heat capacity, thermal conductivity, and heat transfer coefficient. Various factors influence the thermal properties of emulsions, including the thermal attributes and composition of both the continuous and dispersed phases (e.g., surfactant concentration, presence of ions and additives), as well as droplet size and size distribution [157]. Smaller droplets, characterized by a higher surface area-to-volume ratio, facilitate improved heat transfer within the emulsion [158], while larger droplets impede heat transfer, resulting in diminished thermal conductivity. Nonetheless, the overall thermal properties of the emulsion hinge significantly on the relative thermal conductivity of the dispersed phase in comparison to the continuous phase [157]. The effective medium theory offers a means to estimate the thermal conductivity of emulsions. In the case of spherical dispersed particles, such as droplets in water-in-oil emulsions, this theory simplifies to the Maxwell–Garnett equation (Equation (2)):
where k0 represents the continuous phase thermal conductivity, kD is the thermal conductivity of the emulsified water, ϕ is the water volume fraction, k is the effective thermal conductivity of the emulsion, and α is the interfacial resistance and droplet size [159]. The highest thermal conductivity is exhibited by nanoemulsions and nanofluids containing droplets/particles smaller than 100 nm with substantially higher bulk thermal conductivity than the continuous phase [158].
Modifying the concentration of surfactant in the emulsion can be used to modulate its melting point, heat capacity, and thermal conductivity by altering interfacial interactions. In general, higher surfactant concentrations enhance the thermal conductivity of emulsions by preventing the formation of larger droplets and increasing heat transfer [158].
There are several methods to measure the thermal properties of emulsions. One of the simplest methods is the hot plate technique, where a sample of the emulsion is placed on a heated surface and the temperature gradient across the sample is measured over time [119]. The hot plate method is relatively simple to perform, requires minimal equipment, and is suitable for both liquid and solid emulsion samples. However, it may not accurately reflect the thermal properties of emulsions since it does not consider factors such as heat transfer through convection or the presence of other components in the emulsion [119].
Another method for analysis of emulsion thermal properties, known as the transient hot wire technique [160], involves inserting a thin wire probe into the emulsion sample and passing an electrical current through it. The wire serves both as an electrical heating element and a resistance thermometer. The thermal conductivity of the sample is measured based on the changes in the wire temperature and heat generation. The alteration in hot wire temperature is detected using a Wheatstone bridge. The voltage imbalance across the bridge is recorded by a data acquisition system over time. The transient hot wire technique, although accurate in measuring thermal conductivity, may not be suitable for highly viscous emulsions due to the risk of damage to the emulsion structure during probe insertion.
A method that can provide more detailed information about phase transitions and the heat capacity of emulsions is differential scanning calorimetry (DSC). DSC measures the heat exchange and temperature changes associated with the phase transitions in the emulsion, or polymorphic transition of crystals, over a range of temperature and time [5,161]. The peak area in the resulting thermogram signifies the enthalpic change, while the direction of the peak indicates whether the thermal event is exothermic or endothermic [162]. DSC proves particularly useful in monitoring the solidification (crystallization) and melting processes of emulsion components [18]. A notable advantage of DSC analysis is its ability to distinguish the thermal characteristics of different constituents (such as oils, proteins, etc.) within a single thermal cycle, obviating the need for their extraction. DSC is considered a standard method for determining phase diagrams, which reveal information about transition temperatures and the melting enthalpy. It allows evaluation of the thermal behavior of oils, water, and emulsifiers within emulsions, and tracing of the mass transfer within these complex mixtures [163]. However, it can be time-consuming, and expensive, and requires careful sample preparation before measurement.
3.9. Accelerated Stability Testing
Accelerated stability testing is often employed for rapid analysis of emulsion stability to predict the shelf-life of emulsion-based products and ensure that they maintain their desired properties over time [164]. Acceleration tests can reveal any potential changes in the emulsion properties and stability including the occurrence of separation processes such as creaming, sedimentation, and coalescence within a shorter time frame. This enables researchers and manufacturers to quickly evaluate the effectiveness of the applied formulation and processing parameters and allows more efficient product development [165].
To accelerate an emulsion instability, it is subjected to mechanical or thermal stress such as heating, centrifugation, shaking, or stirring. These processes provide stimuli, which aim to simulate environmental stresses that may affect emulsion properties during manufacturing, processing, packing, transport, or long-term storage. The most widely used mechanical stress test involves subjecting emulsion samples to centrifugation [166]. The centrifugation test is applicable to fluid emulsions and can be used to separate emulsions under a wide range of forces. It is advisable to run samples at various rates of centrifugation in order to determine rate constants for the process and extrapolate these forces to gravity [167]. In a study by Estanqueiro et al. [168], the emulsions were subjected to three 30-min cycles of centrifugation at 3000 rpm. The samples were then examined for signs of coalescence or phase separation. In a recent study, Kasprzak et al. [120] conducted the centrifugal test on oil-in-water emulsions stabilized by whey protein at a speed of 10,000 rpm for 30 min. This study showed that the barrier formed at the droplet interface was able to effectively resist coalescence, even under intense centrifugal forces. Nevertheless, this observation did not provide information regarding the duration over which stability can be maintained. Therefore, this method should be accompanied by other analytical methods for the assessment of emulsion stability over time.
Thermal stress has a far greater influence on the stability of emulsions than mechanical stress. This is due to a simple relationship between the temperature and a rate constant for the chemical reaction described by the Arrhenius equation [169]. The temperature might induce the changes in viscosity of the dispersed and continuous phases, droplet solubility, partitioning of molecules at the interface, hydration of polymers or colloids, etc. A common thermal stress accelerated stability test relies on subjecting emulsion samples to cooling–heating cycles, where temperature changes between 4 °C and 40 °C every 24 h for 7 days [168]. A different approach, known as the freeze-thaw cycle test, involves four cycles of temperature changes between −5 °C and 40 °C every 24 h [170]. In addition to thermal fluctuation, in the freezing stage water is transformed into ice crystals. Therefore, when performing the test, we should consider several factors such as (i) concentration and solidification of free liquid water, (ii) content and precipitation of dissolved substances, and (iii) disruption of the emulsifier layer by ice crystals [167].
3.10. Fourier–Transform Infrared Spectroscopy (FTIR) Analysis
Fourier–transform infrared (FTIR) spectroscopy is a powerful technique used to investigate the molecular structure and composition of emulsions [171]. It allows researchers to study the vibrational modes of emulsion components, such as water, oil, and surfactants, in great detail, providing valuable insights into their structural organization at the molecular level. This sophisticated technique can be employed for analyzing functional groups and chemical bonds present in emulsions that provide information about their stability, interfacial properties, and potential interactions with other ingredients [171].
FTIR analysis has substantial utility in studying the phase behavior of emulsions; it can elucidate phenomena such as the formation and disruption of droplets, while also casting light on how different processing conditions impact the overall structure and stability of an emulsion [171]. The spectra obtained via FTIR are especially instructive regarding molecular interactions within an emulsion system by revealing details like hydrogen bonding patterns or significant intermolecular forces [172]. Furthermore, FTIR enables precise identification and quantification of specific components or contaminants within emulsions, such as oxidation products [173] or trace impurities.
Attenuated total reflection FTIR spectroscopy (FTIR-ATR) has emerged as an indispensable tool for the precise identification of characteristic absorption bands within the diverse components of emulsions. This analytical technique has unveiled intriguing insights into emulsion behavior. For example, the phenomenon of inducing subtle alterations in the secondary structures of proteins in water-in-oil (W/O) emulsions was discerned through this method [174]. FTIR-ATR has further been employed to investigate the distinct states of water in emulsions [175], pinpoint signals emanating from bulk water and the water residing within the interfacial layer of reverse micelles [176], and scrutinize the water structure near the surface of nanoparticles in W/O emulsions [20]. Notably, FTIR-ATR studies have shed light on the interaction between emulsifiers and water molecules within the interfacial layer of W/O emulsions, disrupting the hydrogen bonding network and thus impeding the coalescence of water droplets [177]. Additionally, the impact of the concentration of emulsifiers on emulsion stability has been thoroughly examined, with the -OH stretching vibration band serving as a sensitive indicator of the molecular interactions critical for stabilizing W/O emulsions [178]. FTIR-ATR spectroscopy has also proven useful for direct measurements of chemical changes occurring during lipid oxidation in complex food matrices without the need for the extraction of the fat phase [179].
3.11. Raman Spectroscopy
Raman spectroscopy offers an innovative approach to the analysis and characterization of emulsions and food structures. Falling under the umbrella of vibration spectroscopy, Raman spectroscopy exposes a sample to an intense light beam, typically generated by a laser. The resulting spectrum, capturing the Raman-active vibration modes induced in the sample’s molecules, is obtained through the analysis of inelastically scattered photons [94]. The intricacies of the process involve an inelastic collision between incident photons and the molecules within the sample. Consequently, the vibrational or rotational energy of the molecules changes, causing a shift in the scattered radiation to a different wavelength, known as a Raman shift [180]. It is well established that specific chemical bonds (such as C=C, C–H, C=O, and others) produce distinctive Raman shifts, making Raman spectroscopy an effective technique for investigating molecular structures [181]. This technique stands out for its high precision, rapidity, and noninvasiveness.
Emulsions, which are often water-based systems, might generate a broad water background signal when infrared spectroscopy is used. As the Raman signal of water is low (at least at low wavenumbers), the unsaturated C=C bonds, found in oils, have a strong and sharp Raman response, making Raman spectroscopy a perfect method for the analysis of emulsion systems [182]. Due to the excellent functionality of Raman spectroscopy, it can be applied in (i) monitoring or mapping the components, droplets, or structure of emulsions, (ii) measuring the formation and destabilization of emulsions, and (iii) monitoring the emulsion polymerization reactions or other types of reactions involving emulsions. In conjunction with other methods, this technique allows tracking of the changes occurring in the emulsion structure during fabrication, processing, and storage.
A study by Wei et al. [183] investigated the food-grade Pickering emulsions stabilized by ovotransferrin (OVT) fibrils using Raman imaging microscopy. They used the Raman intensity mapping of the emulsion droplets and confirmed the presence of OVT fibrils located at the interface of the droplet. Another study showed the effect of L-arginine addition on the increase of solubility and emulsification of myofibrillar protein, indicating a partial unfolding of emulsifier structure by Raman spectroscopy [184]. In general, the Raman method is used to compare the molecular structure differences between tested stabilizers at varied conditions. Identification of functional groups involved in maintaining emulsion stability can help to design emulsions with tailored functionalities.
Raman spectroscopy can also serve as a valuable tool for monitoring the effects of emulsion processing conditions on its stability. A study by Wu et al. [185] investigated oil-rich emulsions that were subjected to 1, 2, or 3 h of enzymatic hydrolysis. Raman data showed that, as the hydrolysis time increased, a decrease in emulsion stability was observed due to the protein aggregation via SS bonds or lipid-protein interactions (Figure 13). Another study [186] reported the monitoring of emulsion polymerization reactions by Raman spectroscopy. Results showed that the instantaneous conversion and free monomer concentrations were better estimated by Raman spectroscopy than by the calorimetry method.
Figure 13.
(A) Confocal Raman images of oil-rich emulsions (yellow and blue areas represent protein and oil, respectively) hydrolyzed for (a) 1 h, (b) 2 h, and (c) 3 h. (B) Hypothesized status of oil-rich emulsions hydrolyzed for (a) 1 h, (b) 2 h, and (c) 3 h. Reprinted with permission from [185]. Copyright © 2017 Elsevier Ltd.
Emulsion polymerization is a primary reaction in the polymer industry; therefore, the online control of the process is critical in providing closed-loop monitoring strategies that would allow the fabrication of polymers with defined microstructures. In the study by Dropsit et al. [187], the styrene emulsion polymerization was controlled online using the 1000 cm−1 reference band to assess the monomer conversion rate, the integrated intensity, wavenumber, position, and half-width at half maximum of the peak during the polymerization process. Sometimes, the methods of chemometric data analysis are used to analyze the Raman spectra in order to calculate the performance of the reaction, including polymer conversion rate, or the ratio of polymers to remaining monomers [182].
3.12. Photon Density Wave (PDW) Spectroscopy
Photon density wave (PDW) spectroscopy is a laser-based fiber optic in-line process analytic technique. It can measure light scattering, and absorption by emulsion droplets, or droplet/particle size. The primary requirement for effective measurement is that the sample should exhibit ample light scattering (with a reduced scattering coefficient µs’ > 0.05 mm−1) and that the absorption of the sample should be markedly lower than the scattering (the absorption coefficient µa << µs’) [188]. As UV–Vis or IR spectroscopy measures the absorbance, the important feature of PDW spectroscopy is that it allows the measurement of absorption and scattering properties of turbid materials independently, without calibration [189]. This enables the simultaneous monitoring of varied optical parameters and the observation of several processes within the system (such as bacterial growth and changes in nutrient concentration) [190].
By employing Mie theory and dependent light scattering theory, the size of particles or droplets can be ascertained through the reduced scattering coefficient µs’. PDW spectroscopy facilitates real-time particle size determination within a diameter range spanning from approximately 50 nm to 500 µm [191]. Thus, this method can be used to monitor the droplet size of nanoemulsions or Pickering particles’ behavior during formulation and storage. A study by Bressel et a. [192] showed the capability of PDW spectroscopy in measuring the droplet size over a wide range from nanometer to micrometer scale during the phase inversion temperature emulsification.
In the monitoring of the instability of emulsions, PDW spectroscopy can be used to measure the depletion-induced flocculation. A study by Bressel et [193] investigated vegetable oil-in-water emulsions containing Polysorbate 80 used as an emulsifier and induced xanthan as a semi-flexible linear nonadsorbing polymer. The non-xanthan emulsion with a volume fraction of ϕ = 0.1 was continuously observed, without stirring, over 60 h by PDW spectroscopy. The absorption coefficient μa and the reduced scattering coefficient μs′ remained constant, illustrating the emulsion stability as the density of the oil mixture matched with the continuous phase. However, when xanthan was included in the emulsion, a decrease in μs′ was observed, which was associated with a rapid structural change due to flocculation processes. To sum up, PDW spectroscopy can be applied to monitor different stages of emulsion fabrication in real-time. This may contribute to a better understanding of emulsion formation and separation processes and allow the development of strategies for online optimization of process conditions that can be incorporated into production lines.
3.13. Texture Analysis
Texture profile analysis has been widely utilized within the food industry to determine and enhance the sensory and textural attributes of emulsion-based products [194]. Texture analysis allows the quantification of attributes, such as resilience, chewiness, gumminess, springiness, and cohesiveness across a spectrum of food products [195,196].
To modify the texture of emulsion-based products, texture-modifying ingredients can be incorporated into the water or oil phase. Based on molecular origin and functionality, texture-modifying ingredients can be categorized as thickening agents and gelling agents. The thickening agents derive their functionality from extended molecular conformation while gelling agents’ action relies on intermolecular cross-linking. However, practical usage often blurs the distinction, as thickening agents can form gels at high concentrations, and gelling agents can increase viscosity without gel formation at low concentrations. Additionally, some biopolymers added into the water phase might act as thickening agents under defined temperature, pH, or ionic strength conditions. Texture modifiers added to food emulsions enhance the product’s desired textural qualities and mouthfeel. They also improve emulsion stability by slowing down the movement of droplets [197].
The devices commonly used for measurements of emulsion textural properties are texture analyzers. Texture analyzers are equipped with a load arm, connected to an appropriate probe. By setting up an appropriate probe type and speed, as well as deformation depth, time, and cycle duration, texture analyzers can generate graphs of the signal of force vs. length work, based on which the textural parameters of the emulsion can be calculated [198]. For instance, firmness is determined as the initial slope of the penetration profile [199]. The penetration test or double compression tests are usually used to characterize the strength of emulsions [95], which can be utilized to measure the emulsion texture profiles during storage. A lack of changes in the texture profile of emulsions confirms their stability in terms of compression parameters. The key limitation of this method is that it provides only in vitro measurements of emulsion sensory properties that need to be further evaluated in human sensory studies.
3.14. Oxidation
Emulsions play a pivotal role in the manufacturing of a diverse array of food products. Nonetheless, the widespread utilization of emulsions across different food industry sectors is constrained by the susceptibility of lipids to oxidation during various stages of emulsion manufacturing, processing, packaging, or storage [166,200,201].
The initial lipid oxidation processes are the same in emulsions and neat oils. However, oxidation tends to progress more rapidly within emulsions than in bulk oils. This heightened susceptibility to oxidation can be attributed to the conditions under which emulsification occurs or the larger interfacial area of emulsions. During the emulsification process, the oil may be exposed to oxygen or elevated temperatures, thereby intensifying the oxidation process. In cases where sonication is used as the emulsification method, acoustic cavitation can lead to the direct generation of free radicals, increasing the oxidative stress [202].
As lipid oxidation is inherently an interfacial phenomenon, it is primarily initiated at the interface between the oil and water phases [203]. The interface serves as a site where unsaturated fatty acids within the oil phase can interact with pro-oxidants, including trace metal ions found in the aqueous phase (Figure 14). Consequently, the enlargement of the interfacial area between the oil and the aqueous phase, which occurs during the process of emulsification, results in an amplified frequency of interactions between these reactive species. This, in turn, is likely to accelerate the rate of lipid oxidation [204]. It is worth noting that pro-oxidant metals, oxygen, and water-soluble antioxidants must traverse through the aqueous phase in order to access the oil droplets or the oil-water interface. Therefore, the extent of oxidation is markedly influenced by the solubility, mobility, and mass transfer rates of transition metals and antioxidants as they move across different phases [205].
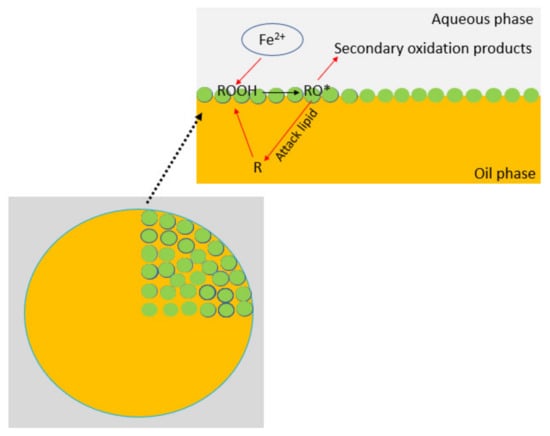
Figure 14.
Mechanism of lipid oxidation in Pickering oil-in-water emulsion (R—unsaturated fatty acid, ROOH—fatty acid peroxide, RO*—alkoxy radical).
Oxidation products in emulsions can be quantified using several techniques. The primary oxidation products can be detected either spectrophotometrically by measuring conjugated diene hydroperoxides at a wavelength of 234 nm or by determining the peroxide value (PV). To perform these measurements, lipids need to be extracted from the emulsions. The underlying principle of wet-chemical methods for PV determination revolves around the capacity of lipid hydroperoxides to oxidize either ferro or iodide ions. Subsequently, these oxidized ions react with another reagent, leading to the formation of a colored complex. This complex is typically quantified through spectrophotometry [206].
Secondary oxidation products can also be quantified via spectrophotometric methods. For example, the anisidine test operates on the principle that carbonyl compounds react with p-anisidine, forming a chromatic complex that absorbs light at a wavelength of 350 nm. Its primary focus is on 2-alkenals, although other carbonyl compounds can also bind to p-anisidine. Different 2-alkenals yield varying intensities of color within the resulting anisidine complex, thus contributing differently to the ultimate anisidine value (AV). The concentrations of secondary oxidation products are also commonly determined through the TBARS (Thiobarbituric Acid Reactive Substances) method. This test assesses the amount of color product generated by the interaction between thiobarbituric acid (TBA) and oxidation byproducts originating from polyunsaturated fatty acids (PUFA) [207]. Both the TBA and anisidine methods lack sensitivity and specificity. Nonetheless, this limitation can be mitigated through the application of gas chromatographic (GC) techniques to evaluate secondary volatile oxidation products, including aldehydes, hydrocarbons, ketones, and alcohols. The integration of mass spectrometry (MS) with GC enhances the precision and accuracy of volatile oxidation product identification and quantification [208]. The NMR method can also be used to measure the secondary products of lipid oxidation [209].
3.15. In Vitro Digestion
One of the pivotal approaches to the characterization of emulsions involves analyzing their behavior in gastrointestinal digestion in vitro models [210]. In recent years, growing attention has been given to comprehending and regulating the digestion of emulsified lipids, particularly within the food and pharmaceutical sectors. Emulsions are being actively developed as delivery systems for non-polar lipids, vitamins, nutraceuticals, and pharmaceutical compounds. The primary objective is to encapsulate these components to ensure their effective release at specific target sites within the gastrointestinal tract.
To date, a variety of in vitro digestion models have been developed [211]. Recently, the INFOGEST model has been successfully validated when compared to human and animal models. This in vitro model has proven useful for the characterization of the food matrices within a simulated digestion environment [212] and contributed to advancing our understanding of emulsion behavior during digestion [213].
In vitro digestion models can be categorized into single- and multiple-step models (Figure 15). The single-step models simulate a specific region of the gastrointestinal (GI) tract, such as the mouth, stomach, small intestine, or colon [120]. An example of this kind of model is the pH-stat method, which exclusively emulates the digestive processes occurring in the small intestine [214]. The multiple-step models aim to simulate two or more regions of the GI tract [215,216], or the entirety of the human GI tract. Irrespective of the chosen approach, the procedure typically involves the preparation of a food sample. Subsequently, this sample is subjected to one or more treatments intended to mimic specific regions within the human digestive tract. These treatments often entail the blending of the food sample with simulated digestive fluids characterized by specific compositions, including pH, mineral constituents, enzyme activity, and other relevant factors, all carried out under controlled mixing and temperature conditions [217,218,219].
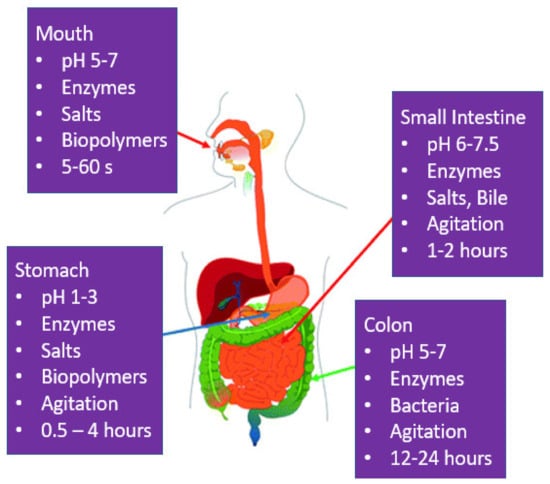
Figure 15.
Physicochemical conditions at various regions of the human gastrointestinal tract. Picture of the human body was obtained from http://en.wikipedia.org/wiki/Digestive_tract accessed on 2 October 2023.
4. Emulsion Fractionation and Characterization Methods
All the methods described above allow for detailed emulsion characterization. However, they are unable to separate emulsions into fractions of droplets differing in size or other physicochemical properties, such as charge, density, mass, surface properties, etc. Fractionating emulsions is extremely useful from both industrial and scientific standpoints as it allows for a more detailed downstream analysis of each droplet fraction. It can be applied in quality control to improve monodispersity and ensure consistent product quality, as well as during formulation development, or optimization of emulsion manufacturing, processing, and storage conditions [220]. The key methods that enable both separation and characterization of emulsions are field-flow fractionation (FFF) [221,222] and capillary hydrodynamic fractionation (CHDF) [223].
4.1. Field-Flow Fractionation (FFF)
Field-flow fractionation (FFF) techniques allow separation of emulsions into multiple (typically 10 to 15) different fractions. However, the true potential of these platforms lies in their ability to perform multiple downstream analyses by incorporating detectors that can provide multiparametric information on separated fractions. The detectors most commonly incorporated into those systems include UV-Vis spectrophotometers, differential refractive index (dRI) detectors, fluorescence detectors (FLD), fluorescence correlation spectroscopy (FCS) detectors, ICP inductively coupled plasma mass spectrometers (ICP-MS), ICP optical emission spectrometers, DLS detectors, and multi-angle light scattering (MALS) detectors [224]. For example, Venkatesh et al. [225] used FFF to investigate the size and compositional heterogeneity of droplets in a polydisperse commercial lipid emulsion (Intralipid) used intravenously as a source of calories and essential fatty acids in patients requiring parenteral nutrition. The emulsion was fractionated into 13 monodisperse droplet fractions, which were then thoroughly investigated in terms of droplet size, content of triglycerides, phosphatidylcholine, and penclomedine and aqueous-entrapped volume (defined as volume of water or aqueous phase entrapped between droplets).
Field-flow fractionation (FFF) utilizes the laminar flow of a carrier liquid through a separation channel and an external physical field to fractionate emulsions [226]. The FFF devices typically consist of a carrier liquid reservoir, an injector, a separation channel, a pump, and a detector. To some degree, FFF devices resemble HPLC (high-performance liquid chromatography) instruments, as they operate based on the elution of different sample components at different rates. However, in contrast to HPLC, FFF is a non-chromatographic method, as the separation channel does not contain a stationary phase [227].
During the FFF, the analyzed emulsion sample is introduced into a separation channel. The pump is used to generate a laminar flow of the liquid through the channel, which is then subjected to an external field applied perpendicularly to the channel symmetry axis. The external field is directed toward the channel wall, referred to as the “accumulation wall”, and allows the separation of droplets and/or other components present in the emulsion according to their size, density, mass, charge, shape, surface properties, or other physicochemical properties. The flow profile in the separation channel is parabolic (Poiseuille flow) [228], with the highest velocity at the center of the channel and decreasing gradually towards the walls, where it reaches zero (Figure 16). When subjected to an external field, emulsion droplets flowing through the separation channel are pushed toward the accumulation wall, while simultaneously being moved back toward the channel center by the diffusion counterforce. This establishes an equilibrium position, leading to the separation of droplets along the carrier flow streamline [8]. Small droplets with a higher diffusion rate tend to migrate further away from the accumulation wall toward the faster-flowing central region of the parabolic flow, while larger droplets move towards slower-flowing streamlines near the channel wall. As a result, smaller droplets exhibit lower retention times, which implies that they are eluted earlier from the separation channel than larger droplets.
The retention behavior of droplets can be described using the retention ratio (R), which is calculated as void time (t0) divided by analyte retention time (tr). The relationship between the retention ratio and the equilibrium position achieved within the channel is indicated by a retention parameter λ, defined as the ratio of mean layer thickness (l) to channel thickness (w). In normal separation mode, the retention ratio is typically around six times greater than the retention parameter [8]:
The mean layer thickness (l) can be determined by dividing the thermal energy (kT) by the force (F) applied to droplets, with k representing Boltzmann’s constant and T absolute temperature:
The droplets can be separated under any type of external field that interacts with their physicochemical properties. Based on the nature of the field applied to separate droplets, FFF techniques can be divided into several categories, including flow FFF, sedimentation FFF, and electrical FFF [229].
Flow field-flow fractionation (FlFFF) represents the most widely used technique in the field of FFF and can be utilized for droplets ranging in size from 1 nm to 50 μm [230]. In this technique, emulsion flowing through the separation channel is subjected to a perpendicular flow, known as cross-flow, which moves transversely across the channel, forcing the droplets toward the accumulation wall (Figure 16).

Figure 16.
The principle of emulsion droplet separation in symmetrical flow field-flow fractionation (SFlFFF). Emulsion flowing through the separation channel (represented by the light blue area) is subjected to a perpendicular cross-flow across the channel, forcing the droplets toward the accumulation wall. In SFlFFF, the separation channel has two permeable walls equipped with porous ceramic frits. The cross-flow passes through both walls. Purple and red circles represent large and small emulsion droplets, respectively. The green and bold black arrows indicate the direction of the cross-flow and diffusion counterforce, respectively. Reprinted with permission from [230]. Copyright © 2020 Elsevier.

There are three main configurations of FlFFF channels: symmetrical, asymmetrical, and hollow fiber. The first category, symmetrical FlFFF (SFlFFF or SF4), features a symmetric configuration [231], with two permeable walls equipped with porous ceramic frits and a cross-flow passing through both walls (Figure 16 and Figure 17, top panel). The second type, known as asymmetric FlFFF (AsFlFFF or AF4) [221], has an asymmetric configuration with only one permeable wall and one solid, impermeable wall, as depicted in Figure 17 (bottom panel). The flow in the separation channel is divided into a longitudinal flow carrying the droplets along the channel, and a transverse flow that traverses the accumulation wall, creating the fractionation field [232].

Figure 17.
The configuration of symmetrical flow field-flow fractionation (SFlFFF) channel (top) and asymmetrical flow field-flow fractionation (AsFlFFF) channel (bottom). The SFlFFF channel comprises two plastic blocks containing porous ceramic frits, while the AsFlFFF channel features one porous ceramic frit and one solid, impermeable wall. A channel spacer and an ultrafiltration membrane are placed on the bottom wall between the two blocks. Two blocks are then clamped together. Reprinted with permission from [230]. Copyright © 2020 Elsevier.

The conventional FlFFF separation channel typically has a trapezoidal shape and uniform thickness, achieved by placing spacers between the accumulation wall and the upper wall of the channel. Alternatively, the thickness of the channel can decrease along the channel axis such that the flow rate increases down the channel [233]. The thickness-tapered channels have been shown to generate increased hydrodynamic lift forces, which contributed to improved separation speed, recovery, and resolving power. Such channels can be beneficial for eluting long-retained particles without reducing the entire channel thickness or for applications involving additional field programming [233].
The third FlFFF category is hollow fiber FlFFF (HfFlFFF or HF5) [232], which employs a porous cylindrical tube consisting of either a hollow fiber ultrafiltration membrane or a ceramic hollow fiber [234]. The underlying force driving the separation is a cross-flow applied in the hollow fiber. The sample is introduced into the inlet of the hollow fiber. The flow of the sample through the fiber is referred to as the “channel flow” or “axial flow”. “Focusing flow” is introduced in the opposite direction to the channel flow from the fiber outlet (Figure 18). The difference in flow rates establishes a focusing point, compelling the droplets to settle into their equilibrium positions. After relaxation, the focusing flow ceases and the channel continues to convey carrier liquid into the fiber. The split flow from the fiber inlet comprises both axial and radial components: axial flow transports droplets along the fiber and exits through an outlet, while radial flow passes through membrane/fiber pores [224].
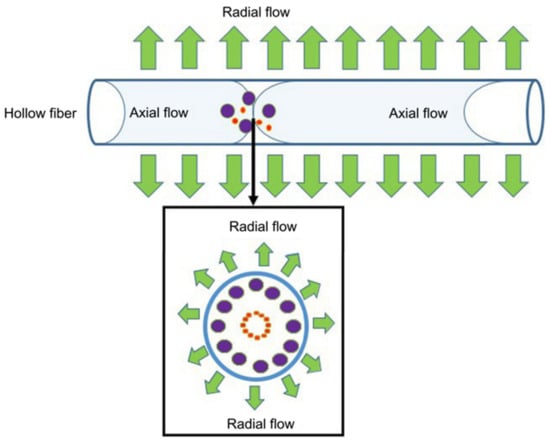
Figure 18.
The separation principle in hollow fiber-flow field-flow fractionation (HfFlFFF). Red and purple circles represent small and large emulsion droplets, respectively. The blue ring represents the hollow fiber wall. Green arrows indicate the direction of radial flow. Reprinted with permission from [230]. Copyright © 2020 Elsevier.
Compared to asymmetric FlFFF, the HfFlFFF method generally shows higher or similar effectiveness and enhanced detectability with minimal sample dilution during separation [235]. Additionally, the separation channel is cost-efficient and can be used in a disposable manner to avoid cross-contamination. These qualities are crucial for further analysis of collected fractions in studies involving cells or drugs that need to be performed under sterile conditions (e.g., in pharmaceutical quality control) [236]. However, the HfFlFFF technique is not designed for high-throughput analyses or large sample volumes. Throughput can be improved by using multiple parallel HF5 modules, like in the MxHF5 system [237].
The equilibrium position and retention time of the droplets in FlFFF are correlated to their diffusivity and hydrodynamic radius. Droplet retention in SFlFFF can be predicted based on the force acting on the droplets, which corresponds to the transverse velocity (U) and friction coefficient (f):
The transverse velocity (U) can be described by an equation involving the volumetric cross-flow rate (VC) divided by the cross-sectional area:
where V0 is the void volume or volume of the channel. The friction coefficient f is defined by Stokes’ Law:
where η is the viscosity and dh is the hydrodynamic diameter of the droplet. The retention parameter in SFlFFF can be expressed as:
The hydrodynamic diameter of the droplet is described as:
Since predicting droplet retention parameters in AsFlFFF and HfFlFFF configurations is more complex, it exceeds the scope of this review. A more detailed discussion on this matter can be found in the following excellent papers [238,239].
FlFFF techniques come with a set of constraints. Interactions between droplets and membranes can result in droplet loss, emulsion dilution, and diminished recovery. Further analysis may necessitate preconcentration of the collected droplet fractions.
Another subtype of FFF is sedimentation field-flow fractionation (SedFFF), known also as centrifugal FFF (CFFF). SedFFF is a high-resolution technique that utilizes a centrifugal field to separate emulsion droplets according to their density and sedimentation rate [222]. The analyzed emulsion is introduced into a circular separation channel, which is subjected to rotation at a high rate (up to 2500 rpm) around its axis [8]. Rotation generates a centrifugal force acting radially to the rotation axis and perpendicularly to the flow in the separation channel [224]. As the emulsion passes through the rotating channel, droplets of different sizes migrate at various rates, as shown in Figure 19. Droplets flowing through the separation channel are distributed across various axial flow vectors based on the equilibrium between the applied centrifugal field and diffusion. The centrifugal force leads to the sedimentation of the droplets (without affecting their shape or causing aggregation [8]) at a rate dependent on their effective volume, inertial mass, and the difference in density between dispersed and continuous phases [220]. As a result, larger and denser droplets migrate towards slower spinning streamlines near the outer channel wall and are collected later from the channel, while smaller droplets travel towards faster rotating inner streamlines closer to the inner channel wall and are eluted earlier [225]. To increase separation resolution, spinning gradients, and various emulsion flow rates can be applied [8].
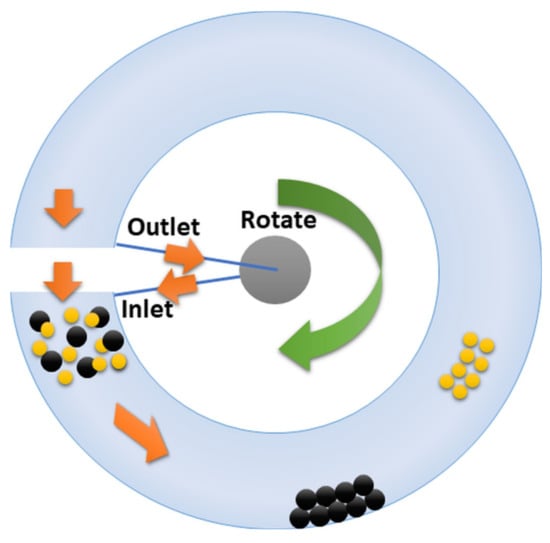
Figure 19.
Schematic presentation of droplet separation by sedimentation field-flow fractionation (SedFFF). The emulsion is introduced into a circular separation channel, which is subjected to rotation at a high rate. As the emulsion passes through the rotating channel, droplets of different sizes migrate at various rates. Larger and denser droplets (represented by black circles) migrate towards slower spinning streamlines near the outer channel wall, while smaller droplets (represented by yellow circles) move towards faster rotating inner streamlines closer to the inner channel wall. Orange arrows indicate the direction of sample flow through the channel. The green arrow indicates the direction of channel rotation.
The retention parameter (λ) in this subtype of FFF can be determined based on the droplet diameter (d), the difference in density between dispersed (ρp) and the continuous phase (ρ), the radius of the centrifuge rotor (r), angular rotation frequency (ω), the channel thickness (w), and the thermal energy (kT):
In SedFFF, small droplets with a density closely aligned with that of the continuous phase may encounter challenges in effective separation, requiring specific operational conditions, such as a high centrifugal field and low flow rate. However, employing a high centrifugation force may extend elution times and diminish detectability for larger droplets, leading to their accumulation on the channel wall. Distortions in the shapes of peaks representing individual droplet fractions are also common at low sample flow rates.
The third category of FFF methods used for emulsion separation and characterization is electrical FFF (ElFFF) [240]. In ElFFF, an electrical field is generated across the separation channel by two charged blocks with high electrical conductivity, which serve both as electrodes and channel walls [241]. The force driving droplet separation depends on the electrical voltage applied and the electrophoretic mobility of the droplets, which is directly related to their charge. The retention behavior of the droplets is determined by their diameter (d), electrophoretic mobility (μ), the strength of the effective field (Eeff), and the viscosity of the continuous phase (η), according to Equation (13):
ElFFF systems offer several benefits compared to other FFF techniques. They provide a gentle perpendicular separation field that decreases the reliance on field strength for achieving resolution. In addition, the ability to separate delicate particles without causing damage makes it an attractive choice for industries dealing with sensitive compounds such as the pharmaceutical sector.
Nonetheless, when employing ElFFF, it is imperative to acknowledge the constraints associated with the generation of electrical double layers around emulsion droplets. The presence of ionic constituents within emulsions induces the formation of an electrical double layer, diminishing the applied electrical field and potentially leading to constrained droplet separation and poor resolution [224]. This phenomenon is exacerbated by increasing the ionic strength of the continuous phase. Consequently, the separation efficiency in ElFFF is markedly influenced by the composition of the emulsion. ElFFF is most effective in the case of emulsions with low ionic strength continuous phases, such as emulsions based on deionized water, but is unsuitable for emulsions containing high concentrations of ions or charged molecules. Enhancement of the effective field across the separation channel can be achieved by elevating the applied voltage. Higher voltages prolong particle retention in the channel, thereby augmenting separation efficiency. However, meticulous control of the applied voltage is imperative, as excessive voltage may induce electrophoresis of the continuous phase and electrolysis. Electrolysis may generate gaseous products [242], which can ultimately lead to the formation of bubbles that interfere with the sample’s parabolic flow profile, detrimentally affecting the separation process. To mitigate this effect in oil-in-water (O/W) emulsions, utilizing water as the continuous phase, a voltage below 2.0 V should be employed. Additionally, to minimize the formation of an electrical double layer, a cyclical ElFFF method involving the application of an alternating current electrical field across the channel may be applied.
Another issue during ElFFF is related to changes in the conductivity of emulsion samples resulting from atmospheric carbon dioxide dissolution in the aqueous phase, which can contribute to irreproducible separations. Some researchers have proposed using buffer solutions at very low concentrations (micro-molar levels) to prevent this problem. One of the primary factors in achieving greater precision with ElFFF separation lies also in the manufacturing approach. While older systems were typically fabricated by macro-machining, the development of a new generation of high-precision miniaturized electrical field-flow fractionation (μ-EFFF) systems has been made possible through the utilization of micro-machining technologies [240]. The reduced separation channel height has been shown to improve resolution, leading micro-ElFFFs to be favorably compared with macro-ElFFF systems, particularly in terms of separation time and required sample volumes.
Overall, field-flow fractionation offers several advantages over other separation methods, including the ability to operate at low pressure, reducing shear stress on the samples, and no need for sample preparation before separation. Additionally, FFF can be coupled with various detectors, such as UV–Vis spectrophotometers, ICP mass spectrometers, ICP optical emission spectrometers, and multi-angle light scattering detectors, making it a versatile technique for analytical applications. FFF also provides more accurate and consistent measurements of emulsion droplet size than methods based on light scattering, such as DLS, as it takes into account the density and shape of the particles, whereas DLS only measures the hydrodynamic size of the particles. As a result, it can be used to analyze and separate droplets ranging in size from 10 nm up to several µm and thus is better suited to study highly polydisperse emulsions [243]. The undeniable advantage of this method lies also in the very small sample volume required for analysis, usually between 1 and 20 μL) [8].
The limitations of conventional FFF systems have driven the research towards the development of hybrid platforms combining two or more external fields for improved separation, such as electrical asymmetrical flow field-flow fractionation (ElAsFlFFF or EAF4) [244]. ElAsFlFFF is a separative platform that combines electrical field-flow fractionation and asymmetrical flow field-flow fractionation, allowing for separation based on both diffusion coefficient and the surface charge of droplets (or analytes). As a result, this approach enables the separation of droplets based on their charge, even if they have similar sizes. This feature has the potential to improve separation resolution compared to traditional FFF methods. Other advantages of ElAsFlFFF include improved control of the electric field and sample velocity, the ability to separate both cationic and anionic species in one run, lower voltage requirements compared to ElFFF, and reduced interference from electrode effects. Furthermore, ElAsFlFFF is not limited to low ionic strength samples and thus provides more versatility in emulsion characterization. However, a downside of ElAsFlFFF is that it introduces additional process parameters influencing the outcome, due to the combination of the two external fields driving the separation.
4.2. Capillary Hydrodynamic Fractionation (CHDF)
Another interesting method for emulsion fractionation and characterization is capillary hydrodynamic fractionation (CHDF) [245,246]. CHDF is a method based on the differential migration of particles in capillaries under hydrodynamic conditions used for estimating emulsion droplet size and size distribution. It allows characterization and high-resolution separation of dispersed particles or droplets of varying sizes as they are carried by a carrier liquid through an open capillary with an inner diameter of 10–15 μm [223]. Similarly as in the FFF methods, the separation process relies on Poiseuille flow and occurs due to the migration of unevenly sized droplets to different streamlines within the parabolic velocity profile. The fluid velocity profile in the capillary can be described by the Hagan–Poiseuille equation:
where d is the capillary inner diameter, η is the viscosity of the fluid, L is the capillary length, v is the average velocity of the fluid, and ΔP is the difference in the pressure between the capillary inlet and outlet.
In CHDF, the droplet separation is also driven by the size exclusion of the droplets at the capillary wall, and colloidal forces resulting from droplet/capillary electric double layer repulsion. Larger droplets can only approach the capillary wall within a distance corresponding to their radius (rL), while smaller droplets within distances rS rL [247]. In consequence, smaller droplets are affected by a thinner exclusion layer (layer adjacent to the capillary wall) and are dragged by slower-moving regions of the flow, while larger droplets are affected by a wider exclusion layer and move more quickly along higher velocity streamlines closer to the capillary center. The droplets emerge from the capillary in order of decreasing diameter, which allows for effective fractionation of droplets based on their size. UV detectors or turbidity sensors are typically used for the detection of droplets emerging from the capillary and estimating the number of droplets in each fraction [248]. The droplet size is determined by measuring their elution time. Capillary hydrodynamic fractionation is commonly used to measure the size of particles ranging from 5 nm–3 μm.
The rate of transport of droplets through the capillary can be calculated from the ratio of capillary length to average droplet residence time. The rate of droplet transport relative to the eluant can be expressed using the separation factor (Rf), which is defined as:
The eluant transport rate through the capillary is established by measuring the mean elution time of a marker with a known molecular size, such as sodium dichromate. In both capillary hydrodynamic fractionation and hydrodynamic chromatography, the separation factor exceeds one, indicating that particles generally travel faster through the capillary tube than the eluant does. This is a notable departure from classical chromatography, where particles are typically hindered during movement through the column with Rf < 1. In flow-based separations, although a maximum value for Rf is theoretically 2 when particles move precisely at the center, practical values tend to be lower due to retarding effects exerted by capillary walls on particle velocity.
Droplet elution times in CHDF are also influenced by factors such as capillary diameter and length, eluant composition and ionic strength, and mobile phase velocity [246]. The separation factor increases with decreasing internal diameter of the capillary and its increasing length. A longer capillary provides a greater path for particle migration, facilitating better size-based separation and resulting in higher resolution. Increased interaction with the capillary walls improves peak resolution in CHDF by minimizing band-broadening effects such as diffusion and dispersion. Additionally, longer capillaries slow down droplet migration and increase their elution time.
The eluant ionic strength is another parameter that impacts the separation resolution significantly. A decrease in eluant ionic strength leads to reduced droplet elution times and increased separation factor. This influence is linked to the increase in thickness of the ionic double layer around the droplets as the eluant ionic strength decreases. Thicker double layers contribute to a greater repulsive force between the droplets and the capillary wall, causing droplets to migrate towards the center of the capillary, where velocity is higher, and move faster [246].
The velocity of the mobile phase also affects the separation efficiency in CHDF. As the velocity of the eluant increases above the critical velocity dependent on the capillary internal diameter, the separation factor and resolution increase. Increasing eluant velocity contributes to higher radial lift force exerted by the fluid on the droplets, contributing to more rapid radial migration. Understanding the impact of the above parameters is crucial for optimizing the performance of CHDF and achieving desired separation outcomes. By tailoring capillary diameter and length, as well as eluant ionic strength and velocity, the desired level of separation efficiency and resolution can be achieved.
CHDF offers several advantages compared to other commonly used separation techniques. Firstly, it is a relatively fast, simple, and gentle separation technique that does not require harsh conditions or complex sample preparation [248]. This makes it suitable for analyzing samples prone to denaturation or degradation. Secondly, CHDF has the flexibility to separate analytes in their native conditions, preserving their original structures. Thirdly, CHDF allows droplet size determination even in emulsions with high droplet concentrations, which can resolve one of the key limitations of DLS. CHDF has been successfully applied to establish droplet size distribution and to monitor droplet size changes over time as a measure of emulsion stability [223,245].
Nevertheless, CHDF has several significant limitations. Firstly, it is a relative technique that requires the establishment of a diameter calibration curve based on elution times of standards of known diameters. In addition, the particle refractive index needs to be known. Another key issue arises from instrumental broadening (IB) [249], which stems from factors such as finite injection volume, detection cell volume, non-uniform parabolic velocity profile in the capillary, and Brownian motion affecting droplet axial displacements. Due to IB distortion, a single species with diameter D will exhibit a range of elution times instead of one specific time. Errors in instrumental broadening correction can lead to inaccuracies in estimating droplet size distribution, thereby impacting resolution accuracy.
To sum up, the applicability of emulsion characterization methods described in this review for different types of emulsion samples along with their key advantages and limitations have been summarized in Table S1.
5. Conclusions
A thorough examination of emulsion properties is essential for comprehending their behavior, optimizing processing conditions, ensuring product stability, and attaining the desired functional and sensory attributes. Presently, researchers and analysts have a diverse array of analytical tools at their disposal, allowing for a detailed exploration of emulsions in terms of composition, structure, rheology, electric conductivity, thermal, mechanical, optical properties, and more. Each method highlighted in this review offers distinct information and varying levels of depth in analyzing emulsion characteristics. When choosing an analytical technique, careful consideration of the specific properties of the emulsion under investigation, the type of information needed, and the strengths and limitations of each analytical method is crucial. This review furnishes a comprehensive account of these aspects, placing particular emphasis on interpreting the data derived from each described method. In doing so, it provides researchers and formulators with the practical knowledge necessary to grasp emulsion behaviors and tailor their properties for food and other specific applications.
Supplementary Materials
The following supporting information can be downloaded at: https://www.mdpi.com/article/10.3390/app14031069/s1, Table S1: Key advantages and limitations of emulsion characterization methods.
Author Contributions
Conceptualization, B.K.-S., J.D. and M.M.K.; resources, J.D. and M.M.K.; writing—original draft preparation, B.K.-S., J.D. and M.M.K.; writing—review and editing, funding acquisition, M.M.K. All authors have read and agreed to the published version of the manuscript.
Funding
This work has been supported by Polish National Agency for Academic Exchange, the Ulam Programme—Seal of Excellence (BPN/SEL/2021/1/00002) for project completion of the Marie Skłodowska-Curie Actions Individual Fellowships programme. The research was funded by the National Science Centre, Poland under the OPUS call in the Weave program (UMO-2022/47/I/NZ9/02893).
Data Availability Statement
Not applicable.
Conflicts of Interest
The authors declare no conflicts of interest.
References
- Kupikowska-Stobba, B.; Grzeczkowicz, M.; Lewińska, D. A one-step in vitro continuous flow assessment of protein release from core-shell polymer microcapsules designed for therapeutic protein delivery. Biocybern. Biomed. Eng. 2021, 41, 1347–1364. [Google Scholar] [CrossRef]
- McClements, D.J. Food Emulsions: Principles, Practices, and Techniques, 3rd ed.; CRC Press: Boca Raton, FL, USA, 2015; pp. 1–676. [Google Scholar] [CrossRef]
- Kasprzak, M.M.; Macnaughtan, W.; Harding, S.; Wilde, P.; Wolf, B. Stabilisation of oil-in-water emulsions with non-chemical modified gelatinised starch. Food Hydrocoll. 2018, 81, 409–418. [Google Scholar] [CrossRef]
- Hu, X.; McClements, D.J. Construction of plant-based adipose tissue using high internal phase emulsions and emulsion gels. Innov. Food Sci. Emerg. Technol. 2022, 78, 103016. [Google Scholar] [CrossRef]
- Ataeian, P.; Aroyan, L.; Parwez, W.; Tam, K.C. Emulsions undergoing phase transition: Effect of emulsifier type and concentration. J. Colloid Interface Sci. 2022, 617, 214–223. [Google Scholar] [CrossRef] [PubMed]
- Tan, Y.; Lee, P.W.; Martens, T.D.; McClements, D.J. Comparison of Emulsifying Properties of Plant and Animal Proteins in Oil-in-Water Emulsions: Whey, Soy, and RuBisCo Proteins. Food Biophys. 2022, 17, 409–421. [Google Scholar] [CrossRef]
- Lee, J.; Wi, G.; Choi, M.J. The rheological properties and stability of gelled emulsions applying to κ-carrageenan and methyl cellulose as an animal fat replacement. Food Hydrocoll. 2023, 136, 108243. [Google Scholar] [CrossRef]
- Yang, F.S.; Caldwell, K.D.; Myers, M.N.; Giddings, J.C. Colloid characterization by sedimentation field-flow fractionation. III. Emulsions. J. Colloid Interface Sci. 1983, 93, 115–125. [Google Scholar] [CrossRef]
- Sanka, I.; Bartkova, S.; Pata, P.; Smolander, O.P.; Scheler, O. Investigation of Different Free Image Analysis Software for High-Throughput Droplet Detection. ACS Omega 2021, 6, 22625–22634. [Google Scholar] [CrossRef] [PubMed]
- Kasprzak, M.M.; Sady, M.; Kruk, J.; Bartkova, S.; Sanka, I.; Scheler, O.; Jamróz, E.; Berski, W.; Onacik-Gür, S.; Szram, R.; et al. Replacement of milk fat by rapeseed oil stabilised emulsion in commercial yogurt. PeerJ 2023, 11, e16441. [Google Scholar] [CrossRef]
- Sanka, I.; Bartkova, S.; Pata, P.; Ernits, M.; Meinberg, M.M.; Agu, N.; Aruoja, V.; Smolander, O.-P.; Scheler, O. User-friendly analysis of droplet array images. Anal. Chim. Acta 2023, 1272, 341397. [Google Scholar] [CrossRef]
- Qiu, L.; Zhang, Y.; Long, X.; Ye, Z.; Qu, Z.; Yang, X.; Wang, C. Scanning Electron Microscopy Investigation for Monitoring the Emulsion Deteriorative Process and Its Applications in Site-Directed Reaction with Paper Fabric. Molecules 2021, 26, 6471. [Google Scholar] [CrossRef] [PubMed]
- Fischer, P.; Windhab, E.J. Rheology of food materials. Curr. Opin. Colloid Interface Sci. 2011, 16, 36–40. [Google Scholar] [CrossRef]
- Zhou, B.; Drusch, S.; Hogan, S.A. Confined flow behavior under high shear rates and stability of oil/water high internal phase emulsions (HIPEs) stabilized by whey protein isolate: Role of protein concentration and pH. Food Res. Int. 2022, 160, 111674. [Google Scholar] [CrossRef] [PubMed]
- Alade, O.S.; Mahmoud, M.; Al Shehri, D.A.; Sultan, A.S. Rapid Determination of Emulsion Stability Using Turbidity Measurement Incorporating Artificial Neural Network (ANN): Experimental Validation Using Video/Optical Microscopy and Kinetic Modeling. ACS Omega 2021, 6, 5910–5920. [Google Scholar] [CrossRef] [PubMed]
- Ravindran, S.; Williams, M.A.K.; Ward, R.L.; Gillies, G. Understanding how the properties of whey protein stabilized emulsions depend on pH, ionic strength and calcium concentration, by mapping environmental conditions to zeta potential. Food Hydrocoll. 2018, 79, 572–578. [Google Scholar] [CrossRef]
- Gerzhova, A.; Mondor, M.; Benali, M.; Aider, M. Study of total dry matter and protein extraction from canola meal as affected by the pH, salt addition and use of zeta-potential/turbidimetry analysis to optimize the extraction conditions. Food Chem. 2016, 201, 243–252. [Google Scholar] [CrossRef] [PubMed]
- Dalmazzone, C.; Noïk, C.; Clausse, D. Application of DSC for Emulsified System Characterization. Oil Gas Sci. Technol.—Rev. D’ifp Energ. Nouv. 2009, 64, 543–555. [Google Scholar] [CrossRef]
- Reiner, J.; Ly, T.T.; Liu, L.; Karbstein, H.P. Melt Emulsions: Influence of the Cooling Procedure on Crystallization and Recrystallization of Emulsion Droplets and their Influence on Dispersion Viscosity upon Storage. Chem. Ing. Tech. 2022, 94, 356–364. [Google Scholar] [CrossRef]
- Nickolov, Z.S.; Paruchuri, V.; Shah, D.O.; Miller, J.D. FTIR–ATR studies of water structure in reverse micelles during the synthesis of oxalate precursor nanoparticles. Colloids Surf. A Physicochem. Eng. Asp. 2004, 232, 93–99. [Google Scholar] [CrossRef]
- Hou, F.; Yang, S.; Ma, X.; Gong, Z.; Wang, Y.; Wang, W. Characterization of Physicochemical Properties of Oil-in-Water Emulsions Stabilized by Tremella fuciformis Polysaccharides. Foods 2022, 11, 3020. [Google Scholar] [CrossRef]
- Zhou, H.; Tan, Y.; McClements, D.J. Applications of the INFOGEST In Vitro Digestion Model to Foods: A Review. Annu. Rev. Food Sci. Technol. 2023, 14, 135–156. [Google Scholar] [CrossRef]
- Chuesiang, P.; Kim, J.T.; Shin, G.H. Observation of curcumin-encapsulated Pickering emulsion stabilized by cellulose nanocrystals-whey protein isolate (CNCs-WPI) complex under in vitro lipid digestion through INFOGEST model. Int. J. Biol. Macromol. 2023, 234, 123679. [Google Scholar] [CrossRef] [PubMed]
- Menard, O.; Lesmes, U.; Shani-Levi, C.S.; Calahorra, A.A.; Lavoisier, A.; Morzel, M.; Rieder, A.; Feron, G.; Nebbia, S.; Mashiah, L.; et al. Static in vitro digestion model adapted to the general older adult population: An INFOGEST international consensus. Food Funct. 2023, 14, 4569–4582. [Google Scholar] [CrossRef]
- Tadros, T.F. Emulsion Formation, Stability, and Rheology. In Emulsion Formation and Stability; Wiley: Hoboken, NJ, USA, 2013; pp. 1–75. [Google Scholar] [CrossRef]
- Janssen, P.H.; Noik, C.; Dalmazzone, C. Emulsion Formation in a Model Choke-Valve. In Proceedings of the SPE Annual Technical Conference and Exhibition, New Orleans, LA, USA, 30 September–3 October 2001. [Google Scholar] [CrossRef]
- Anton, N.; Vandamme, T.F. Nano-emulsions and micro-emulsions: Clarifications of the critical differences. Pharm. Res. 2011, 28, 978–985. [Google Scholar] [CrossRef] [PubMed]
- McClements, D.J. Food Emulsions: Principles, Practices, and Techniques, 2nd ed.; CRC Press: Boca Raton, FL, USA, 2004. [Google Scholar] [CrossRef]
- Tadros, T.; Izquierdo, P.; Esquena, J.; Solans, C. Formation and stability of nano-emulsions. Adv. Colloid Interface Sci. 2004, 108–109, 303–318. [Google Scholar] [CrossRef] [PubMed]
- Delmas, T.; Piraux, H.; Couffin, A.-C.; Texier, I.; Vinet, F.; Poulin, P.; Cates, M.E.; Bibette, J. How to prepare and stabilize very small nanoemulsions. Langmuir 2011, 27, 1683–1692. [Google Scholar] [CrossRef] [PubMed]
- Salem, M.A.; Ezzat, S.M.; Salem, M.A.; Ezzat, S.M. Nanoemulsions in Food Industry. In Some New Aspects of Colloidal Systems in Foods; BoD–Books: Norderstedt, Germany, 2018. [Google Scholar] [CrossRef]
- Posocco, P.; Perazzo, A.; Preziosi, V.; Laurini, E.; Pricl, S.; Guido, S. Interfacial tension of oil/water emulsions with mixed non-ionic surfactants: Comparison between experiments and molecular simulations. RSC Adv. 2016, 6, 4723–4729. [Google Scholar] [CrossRef]
- Tadros, T.F. An Introduction to Surfactants; Walter de Gruyter: Berlin, Germany, 2014. [Google Scholar] [CrossRef]
- Wollenweber, C.; Makievski, A.V.; Miller, R.; Daniels, R. Adsorption of hydroxypropyl methylcellulose at the liquid/liquid interface and the effect on emulsion stability. Colloids Surf. A Physicochem. Eng. Asp. 2000, 172, 91–101. [Google Scholar] [CrossRef]
- Jian, C.; Poopari, M.R.; Liu, Q.; Zerpa, N.; Zeng, H.; Tang, T. Reduction of Water/Oil Interfacial Tension by Model Asphaltenes: The Governing Role of Surface Concentration. J. Phys. Chem. B 2016, 120, 5646–5654. [Google Scholar] [CrossRef]
- Kupikowska-Stobba, B.; Kasprzak, M. Fabrication of nanoparticles for bone regeneration: New insight into applications of nanoemulsion technology. J. Mater. Chem. B 2021, 9, 5221–5244. [Google Scholar] [CrossRef]
- Hu, Y.T.; Ting, Y.; Hu, J.Y.; Hsieh, S.C. Techniques and methods to study functional characteristics of emulsion systems. J. Food Drug Anal. 2017, 25, 16–26. [Google Scholar] [CrossRef]
- Kilpatrick, P.K. Water-in-Crude Oil Emulsion Stabilization: Review and Unanswered Questions. Energy Fuels 2012, 26, 4017–4026. [Google Scholar] [CrossRef]
- Marrucci, G. A theory of coalescence. Chem. Eng. Sci. 1969, 24, 975–985. [Google Scholar] [CrossRef]
- Dickinson, E. Flocculation of protein-stabilized oil-in-water emulsions. Colloids Surf. B Biointerfaces 2010, 81, 130–140. [Google Scholar] [CrossRef] [PubMed]
- Rahn-Chique, K.; Puertas, A.M.; Romero-Cano, M.S.; Rojas, C.; Urbina-Villalba, G. Nanoemulsion stability: Experimental evaluation of the flocculation rate from turbidity measurements. Adv. Colloid Interface Sci. 2012, 178, 1–20. [Google Scholar] [CrossRef] [PubMed]
- Tayeb, H.H.; Sainsbury, F. Nanoemulsions in drug delivery: Formulation to medical application. Nanomedicine 2018, 13, 2507–2525. [Google Scholar] [CrossRef]
- Gupta, A.; Eral, H.B.; Hatton, T.A.; Doyle, P.S. Nanoemulsions: Formation, properties and applications. Soft Matter 2016, 12, 2826–2841. [Google Scholar] [CrossRef] [PubMed]
- Tadros, T.F. Emulsion Formation and Stability; Wiley-VCH Verlag GmbH & Co. KGaA: Weinheim, Germany, 2013. [Google Scholar] [CrossRef]
- Chanamai, R.; McClements, D.J. Dependence of creaming and rheology of monodisperse oil-in-water emulsions on droplet size and concentration. Colloids Surf. A Physicochem. Eng. Asp. 2000, 172, 79–86. [Google Scholar] [CrossRef]
- Liu, J.; Liu, Z.; Yuan, T.; Wang, C.; Gao, R.; Hu, G.; Xu, J.; Zhao, J. Synthesis and properties of zwitterionic gemini surfactants for enhancing oil recovery. J. Mol. Liq. 2020, 311, 113179. [Google Scholar] [CrossRef]
- Koroleva, M.; Nagovitsina, T.; Yurtov, E. Nanoemulsions stabilized by non-ionic surfactants: Stability and degradation mechanisms. Phys. Chem. Chem. Phys. 2018, 20, 10369–10377. [Google Scholar] [CrossRef]
- Kralova, I.; Sjöblom, J. Surfactants Used in Food Industry: A Review. J. Dispers. Sci. Technol. 2009, 30, 1363–1383. [Google Scholar] [CrossRef]
- Ng, N.; Rogers, M.A. Surfactants. In Encyclopedia of Food Chemistry; Elsevier: Amsterdam, The Netherlands, 2019; pp. 276–282. [Google Scholar] [CrossRef]
- Witthayapanyanon, A.; Harwell, J.H.; Sabatini, D.A. Hydrophilic–lipophilic deviation (HLD) method for characterizing conventional and extended surfactants. J. Colloid Interface Sci. 2008, 325, 259–266. [Google Scholar] [CrossRef]
- Salager, J.-L.; Marquez, R.; Bullon, J.; Forgiarini, A. Formulation in Surfactant Systems: From-Winsor-to-HLDN. Encyclopedia 2022, 2, 778–842. [Google Scholar] [CrossRef]
- Acosta, E.J.; Yuan, J.S.; Bhakta, A.S. The characteristic curvature of ionic surfactants. J. Surfactants Deterg. 2008, 11, 145–158. [Google Scholar] [CrossRef]
- Tan, C.; McClements, D.J. Application of Advanced Emulsion Technology in the Food Industry: A Review and Critical Evaluation. Foods 2021, 10, 812. [Google Scholar] [CrossRef]
- de Carvalho-Guimarães, F.B.; Correa, K.L.; de Souza, T.P.; Rodríguez Amado, J.R.; Ribeiro-Costa, R.M.; Silva-Júnior, J.O.C. A Review of Pickering Emulsions: Perspectives and Applications. Pharmaceuticals 2022, 15, 1413. [Google Scholar] [CrossRef]
- Yang, Y.; Fang, Z.; Chen, X.; Zhang, W.; Xie, Y.; Chen, Y.; Liu, Z.; Yuan, W. An overview of pickering emulsions: Solid-particle materials, classification, morphology, and applications. Front. Pharmacol. 2017, 8, 235054. [Google Scholar] [CrossRef] [PubMed]
- Muhamad, I.I.; Quin, C.H.; Selvakumaran, S. Preparation and evaluation of water-in-soybean oil–in-water emulsions by repeated premix membrane emulsification method using cellulose acetate membrane. J. Food Sci. Technol. 2016, 53, 1845–1855. [Google Scholar] [CrossRef] [PubMed]
- Izquierdo, P.; Esquena, J.; Tadros, T.F.; Dederen, C.; Garcia, M.J.; Azemar, N.; Solans, C. Formation and Stability of Nano-Emulsions Prepared Using the Phase Inversion Temperature Method. Langmuir 2001, 18, 26–30. [Google Scholar] [CrossRef]
- Guzey, D.; McClements, D.J. Formation, stability and properties of multilayer emulsions for application in the food industry. Adv. Colloid Interface Sci. 2006, 128–130, 227–248. [Google Scholar] [CrossRef]
- Salvia-Trujillo, L.; Soliva-Fortuny, R.; Rojas-Graü, M.A.; McClements, D.J.; Martín-Belloso, O. Edible Nanoemulsions as Carriers of Active Ingredients: A Review. Annu. Rev. Food Sci. Technol. 2017, 8, 439–466. [Google Scholar] [CrossRef]
- Israelachvili, J.N. Surface Forces. In The Handbook of Surface Imaging and Visualization; CRC Press: Boca Raton, FL, USA, 2022; pp. 793–816. [Google Scholar] [CrossRef]
- pH-Controlled Macromolecule Encapsulation in and Release from Polyelectrolyte Multilayer Nanocapsules—Sukhorukov—2001—Macromolecular Rapid Communications—Wiley Online Library n.d. Available online: https://onlinelibrary.wiley.com/doi/10.1002/1521-3927(20010101)22:1%3C44::AID-MARC44%3E3.0.CO;2-U (accessed on 10 January 2024).
- Guzey, D.; Kim, H.J.; McClements, D.J. Factors influencing the production of O/W emulsions stabilized by β-lactoglobulin–pectin membranes. Food Hydrocoll. 2004, 18, 967–975. [Google Scholar] [CrossRef]
- Chen, G.; Tao, D. An experimental study of stability of oil–water emulsion. Fuel Process. Technol. 2005, 86, 499–508. [Google Scholar] [CrossRef]
- Foundations of Colloid Science—Robert, J. Hunter—Oxford University Press n.d. Available online: https://global.oup.com/academic/product/foundations-of-colloid-science-9780198505020?cc=pl&lang=en& (accessed on 10 December 2023).
- Dapčević Hadnadev, T.; Dokić, P.; Krstonošić, V.; Hadnadev, M. Influence of oil phase concentration on droplet size distribution and stability of oil-in-water emulsions. Eur. J. Lipid Sci. Technol. 2013, 115, 313–321. [Google Scholar] [CrossRef]
- Ghasemi, H.; Darjani, S.; Mazloomi, H.; Mozaffari, S. Preparation of stable multiple emulsions using food-grade emulsifiers: Evaluating the effects of emulsifier concentration, W/O phase ratio, and emulsification process. SN Appl. Sci. 2020, 2, 1–9. [Google Scholar] [CrossRef]
- Akhter, S.; Jain, G.K.; Ahmad, F.J.; Khar, R.K.; Jain, N.; Khan, Z.I.; Talegaonkar, S. Investigation of Nanoemulsion System for Transdermal Delivery of Domperidone: Ex-vivo and in vivo Studies. Curr. Nanosci. 2008, 4, 381–390. [Google Scholar] [CrossRef]
- Medina, S.C.; Anjum, D.H.; Behzad, A.R.; Vilagines, R.D.; Tabatabai, A.; Leiknes, T.O. Microscopy techniques applied to submicron characterization of oilfield produced water. J. Pet. Sci. Eng. 2021, 206, 108930. [Google Scholar] [CrossRef]
- Bellalta, P.; Troncoso, E.; Zúñiga, R.N.; Aguilera, J.M. Rheological and microstructural characterization of WPI-stabilized O/W emulsions exhibiting time-dependent flow behavior. LWT-Food Sci. Technol. 2012, 46, 375–381. [Google Scholar] [CrossRef]
- Bartkova, S.; Vendelin, M.; Sanka, I.; Pata, P.; Scheler, O. Droplet image analysis with user-friendly freeware CellProfiler. Anal. Methods 2020, 12, 2287–2294. [Google Scholar] [CrossRef]
- Binks, B.P.; Dong, J. Emulsions and equilibrium phase behaviour in silicone oil + water + nonionic surfactant mixtures. Colloids Surf. A Physicochem. Eng. Asp. 1998, 132, 289–301. [Google Scholar] [CrossRef]
- Ishibashi, C.; Hondoh, H.; Ueno, S. Influence of morphology and polymorphic transformation of fat crystals on the freeze-thaw stability of mayonnaise-type oil-in-water emulsions. Food Res. Int. 2016, 89, 604–613. [Google Scholar] [CrossRef] [PubMed]
- Binks, B.P.; Olusanya, S.O. Pickering emulsions stabilized by coloured organic pigment particles. Chem. Sci. 2016, 8, 708–723. [Google Scholar] [CrossRef]
- Saffarionpour, S.; Diosady, L.L. Delivery of Ferric Sodium EDTA by Water-in-Oil-in-Water (W1/O/W2) Double Emulsions: Influence of Carrier Oil on its In Vitro Bioaccessibility. Food Bioprocess Technol. 2022, 15, 421–439. [Google Scholar] [CrossRef]
- Sikorska, E.; Khmelinskii, I.; Sikorski, M. Fluorescence spectroscopy and imaging instruments for food quality evaluation. In Evaluation Technologies for Food Quality; Woodhead Publishing: Cambridge, UK, 2019; pp. 491–533. [Google Scholar] [CrossRef]
- Klymchenko, A.S.; Roger, E.; Anton, N.; Anton, H.; Shulov, I.; Vermot, J.; Mely, Y.; Vandamme, T.F. Highly lipophilic fluorescent dyes in nano-emulsions: Towards bright non-leaking nano-droplets. RSC Adv. 2012, 2, 11876–11886. [Google Scholar] [CrossRef]
- Thijssen, J.H.J.; Schofield, A.B.; Clegg, P.S. How do (fluorescent) surfactants affect particle-stabilized emulsions? Soft Matter 2011, 7, 7965–7968. [Google Scholar] [CrossRef]
- Yu, D.; Li, G.; Liu, W.; Li, Y.; Song, Z.; Wang, H.; Guan, F.; Chen, X. A fluorescent pickering-emulsion stabilizer prepared using carbon nitride quantum dots and laponite nanoparticles. Colloids Surf. A Physicochem. Eng. Asp. 2019, 563, 310–317. [Google Scholar] [CrossRef]
- Klang, V.; Matsko, N.B.; Valenta, C.; Hofer, F. Electron microscopy of nanoemulsions: An essential tool for characterisation and stability assessment. Micron 2012, 43, 85–103. [Google Scholar] [CrossRef]
- Saupe, A.; Gordon, K.C.; Rades, T. Structural investigations on nanoemulsions, solid lipid nanoparticles and nanostructured lipid carriers by cryo-field emission scanning electron microscopy and Raman spectroscopy. Int. J. Pharm. 2006, 314, 56–62. [Google Scholar] [CrossRef]
- Dudkiewicz, A.; Tiede, K.; Loeschner, K.; Jensen, L.H.S.; Jensen, E.; Wierzbicki, R.; Boxall, A.B.; Molhave, K. Characterization of nanomaterials in food by electron microscopy. TrAC Trends Anal. Chem. 2011, 30, 28–43. [Google Scholar] [CrossRef]
- Rosso, A.; Lollo, G.; Chevalier, Y.; Troung, N.; Bordes, C.; Bourgeois, S.; Maniti, O.; Granjon, T.; Dugas, P.-Y.; Urbaniak, S.; et al. Development and structural characterization of a novel nanoemulsion for oral drug delivery. Colloids Surfaces A Physicochem. Eng. Asp. 2020, 593, 124614. [Google Scholar] [CrossRef]
- Review of Nanoemulsion Formulation and Characterization Techniques: EBSCOhost n.d. Available online: https://web.s.ebscohost.com/ehost/detail/detail?vid=0&sid=e1eaf248-dc1e-4691-9a8b-06cc757ccad8%40redis&bdata=Jmxhbmc9cGwmc2l0ZT1laG9zdC1saXZl#AN=136112967&db=asn (accessed on 10 December 2023).
- Franken, L.E.; Boekema, E.J.; Stuart, M.C.A. Transmission Electron Microscopy as a Tool for the Characterization of Soft Materials: Application and Interpretation. Adv. Sci. 2017, 4, 1600476. [Google Scholar] [CrossRef]
- Helene Søgaard, L. General Rights Ultrastructure of Emulsions—A Comparative Electron Microscopy Study; Technical University of Denmark: Lyngby, Denmark, 2013. [Google Scholar]
- Hurbain, I.; Sachse, M. The future is cold: Cryo-preparation methods for transmission electron microscopy of cells. Biol. Cell 2011, 103, 405–420. [Google Scholar] [CrossRef]
- Kanno, H.; Speedy, R.J.; Angell, C.A. Brief Introduction to High-Pressure Freezing. Science 2013, 189, 880–881. [Google Scholar] [CrossRef]
- Niu, H.; Wang, W.; Dou, Z.; Chen, X.; Chen, X.; Chen, H.; Fu, X. Multiscale combined techniques for evaluating emulsion stability: A critical review. Adv. Colloid Interface Sci. 2023, 311, 102813. [Google Scholar] [CrossRef] [PubMed]
- Mackie, A.R.; Gunning, A.P.; Wilde, P.J.; Morris, V.J. Orogenic Displacement of Protein from the Oil/Water Interface. Langmuir 1999, 16, 2242–2247. [Google Scholar] [CrossRef]
- Zhang, L.Y.; Breen, P.; Xu, Z.; Masliyah, J.H. Asphaltene Films at a Toluene/Water Interface. Energy Fuels 2006, 21, 274–285. [Google Scholar] [CrossRef]
- Ho, T.M.; Abik, F.; Mikkonen, K.S. An overview of nanoemulsion characterization via atomic force microscopy. Crit. Rev. Food Sci. Nutr. 2022, 62, 4908–4928. [Google Scholar] [CrossRef]
- Morris, V.J. Probing molecular interactions in foods. Trends Food Sci. Technol. 2004, 15, 291–297. [Google Scholar] [CrossRef]
- Li, G.; Xu, X.; Zuo, Y.Y. Langmuir-Blodgett transfer from the oil-water interface. J. Colloid Interface Sci. 2023, 630, 21–27. [Google Scholar] [CrossRef]
- Jin, H.; Lu, Q.; Chen, X.; Ding, H.; Gao, H.; Jin, S. The use of Raman spectroscopy in food processes: A review. Appl. Spectrosc. Rev. 2016, 51, 12–22. [Google Scholar] [CrossRef]
- Zhang, Y.; Yang, H.; Zheng, H.; Yuan, D.; Mao, L. Physical properties and salt release of potato starch-based emulsion gels with OSA starch-stabilized oil droplets. LWT 2021, 141, 110929. [Google Scholar] [CrossRef]
- Zhang, S.; Zhang, Q.; Shang, J.; Mao, Z.S.; Yang, C. Measurement methods of particle size distribution in emulsion polymerization. Chin. J. Chem. Eng. 2021, 39, 1–5. [Google Scholar] [CrossRef]
- Carvalho, P.M.; Felício, M.R.; Santos, N.C.; Gonçalves, S.; Domingues, M.M. Application of light scattering techniques to nanoparticle characterization and development. Front. Chem. 2018, 6, 386753. [Google Scholar] [CrossRef]
- Fischer, K.; Schmidt, M. Pitfalls and novel applications of particle sizing by dynamic light scattering. Biomaterials 2016, 98, 79–91. [Google Scholar] [CrossRef] [PubMed]
- Bhattacharjee, S. DLS and zeta potential—What they are and what they are not? J. Control. Release 2016, 235, 337–351. [Google Scholar] [CrossRef] [PubMed]
- Anderson, W.; Kozak, D.; Coleman, V.A.; Jämting, Å.K.; Trau, M. A comparative study of submicron particle sizing platforms: Accuracy, precision and resolution analysis of polydisperse particle size distributions. J. Colloid Interface Sci. 2013, 405, 322–330. [Google Scholar] [CrossRef] [PubMed]
- Klein, M.; Menta, M.; Dacoba, T.G.; Crecente-Campo, J.; Alonso, M.J.; Dupin, D.; Loinaz, I.; Grassl, B.; Séby, F. Advanced nanomedicine characterization by DLS and AF4-UV-MALS: Application to a HIV nanovaccine. J. Pharm. Biomed. Anal. 2020, 179, 113017. [Google Scholar] [CrossRef] [PubMed]
- Hansen, M.; Smith, M.C.; Crist, R.M.; Clogston, J.D.; McNeil, S.E. Analyzing the influence of PEG molecular weight on the separation of PEGylated gold nanoparticles by asymmetric-flow field-flow fractionation. Anal. Bioanal. Chem. 2015, 407, 8661–8672. [Google Scholar] [CrossRef] [PubMed]
- Wang, K.; Li, G.; Zhang, B. Opposite results of emulsion stability evaluated by the TSI and the phase separation proportion. Colloids Surf. A Physicochem. Eng. Asp. 2018, 558, 402–409. [Google Scholar] [CrossRef]
- Kim, Y.J.; Kim, B.K.; Lee, M.H. Effect of small molecular surfactants on physical, turbidimetric, and rheological properties of Pickering nanoemulsions stabilized with whey protein isolate. Food Biosci. 2023, 51, 102214. [Google Scholar] [CrossRef]
- Perrin, L.; Desobry-Banon, S.; Gillet, G.; Desobry, S. Study and optimization of oil-in-water emulsions formulated by low- and high-frequency ultrasounds. Int. J. Cosmet. Sci. 2023, 45, 198–213. [Google Scholar] [CrossRef]
- Mengual, O.; Meunier, G.; Cayré, I.; Puech, K.; Snabre, P. TURBISCAN MA 2000: Multiple light scattering measurement for concentrated emulsion and suspension instability analysis. Talanta 1999, 50, 445–456. [Google Scholar] [CrossRef]
- Preetz, C.; Hauser, A.; Hause, G.; Kramer, A.; Mäder, K. Application of atomic force microscopy and ultrasonic resonator technology on nanoscale: Distinction of nanoemulsions from nanocapsules. Eur. J. Pharm. Sci. 2010, 39, 141–151. [Google Scholar] [CrossRef]
- Benita, S.; Levy, M.Y. Submicron Emulsions as Colloidal Drug Carriers for Intravenous Administration: Comprehensive Physicochemical Characterization. J. Pharm. Sci. 1993, 82, 1069–1079. [Google Scholar] [CrossRef]
- Nordén, T.P.; Siekmann, B.; Lundquist, S.; Malmsten, M. Physicochemical characterisation of a drug-containing phospholipid-stabilised o/w emulsion for intravenous administration. Eur. J. Pharm. Sci. 2001, 13, 393–401. [Google Scholar] [CrossRef]
- Whittinghill, J.M.; Norton, J.; Proctor, A. A fourier transform infrared spectroscopy study of the effect of temperature on soy lecithin-stabilized emulsions. J. Am. Oil Chem. Soc. 1999, 76, 1393–1398. [Google Scholar] [CrossRef]
- Chantrapornchai, W.; Clydesdale, F.; McClements, D.J. Influence of Droplet Size and Concentration on the Color of Oil-in-Water Emulsions. J. Agric. Food Chem. 1998, 46, 2914–2920. [Google Scholar] [CrossRef]
- Silva, C.A.; Saraiva, S.V.; Bonetti, D.; Higuti, R.T.; Cunha, R.L.; Pereira, L.O.; Silva, F.V.; Fileti, A.M. Measurements of bimodal droplet size distribution of emulsions using ultrasonic spectroscopy in the long and intermediate wavelength regimes. Chem. Eng. Sci. 2022, 252, 117274. [Google Scholar] [CrossRef]
- Baboota, S.; Shakeel, F.; Ahuja, A.; Ali, J.; Shafiq, S. Design, development and evaluation of novel nanoemulsion formulations for transdermal potential of celecoxib. Acta Pharm. 2007, 57, 315–332. [Google Scholar] [CrossRef]
- Mirhosseini, H.; Tan, C.P. Discrimination of orange beverage emulsions with different formulations using multivariate analysis. J. Sci. Food Agric. 2010, 90, 1308–1316. [Google Scholar] [CrossRef] [PubMed]
- Liu, Y.; Wei, Z.-C.; Deng, Y.-Y.; Dong, H.; Zhang, Y.; Tang, X.-J.; Li, P.; Liu, G.; Zhang, M.-W. Comparison of the Effects of Different Food-Grade Emulsifiers on the Properties and Stability of a Casein-Maltodextrin-Soybean Oil Compound Emulsion. Molecules 2020, 25, 458. [Google Scholar] [CrossRef] [PubMed]
- Velandia, S.F.; Marchal, P.; Lemaitre, C.; Sadtler, V.; Roques-Carmes, T. Evaluation of the repartition of the particles in Pickering emulsions in relation with their rheological properties. J. Colloid Interface Sci. 2021, 589, 286–297. [Google Scholar] [CrossRef]
- Li, G.; Zhao, Y.; Zhang, J.; Hao, J.; Xu, D.; Cao, Y. CaCO3 loaded lipid microspheres prepared by the solid-in-oil-in-water emulsions technique with propylene glycol alginate and xanthan gum. Front. Nutr. 2022, 9, 961326. [Google Scholar] [CrossRef]
- Zhu, Y.; Gao, H.; Liu, W.; Zou, L.; McClements, D.J. A review of the rheological properties of dilute and concentrated food emulsions. J. Texture Stud. 2020, 51, 45–55. [Google Scholar] [CrossRef]
- Barnes, H.A. Rheology of emulsions—A review. Colloids Surf. A Physicochem. Eng. Asp. 1994, 91, 89–95. [Google Scholar] [CrossRef]
- Kasprzak, M.M.; Berski, W.; Krystyjan, M.; Jamróz, E.; Florczuk, A.; Tkaczewska, J.; Zając, M.; Domagała, J.; Lett, A.M.; Ptasznik, S. Effects of fibre addition and processing on the stability, rheology and in vitro gastric digestion of whey protein-xanthan gum stabilised emulsions with high oil phase. LWT 2023, 178, 114465. [Google Scholar] [CrossRef]
- Ozturk, B.; McClements, D.J. Progress in natural emulsifiers for utilization in food emulsions. Curr. Opin. Food Sci. 2016, 7, 1–6. [Google Scholar] [CrossRef]
- Evans, M.; Ratcliffe, I.; Williams, P.A. Emulsion stabilisation using polysaccharide–protein complexes. Curr. Opin. Colloid Interface Sci. 2013, 18, 272–282. [Google Scholar] [CrossRef]
- Dickinson, E. Hydrocolloids as emulsifiers and emulsion stabilizers. Food Hydrocoll. 2009, 23, 1473–1482. [Google Scholar] [CrossRef]
- Geremias-Andrade, I.M.; Souki, N.P.D.B.G.; Moraes, I.C.F.; Pinho, S.C. Rheological and mechanical characterization of curcumin-loaded emulsion-filled gels produced with whey protein isolate and xanthan gum. LWT 2017, 86, 166–173. [Google Scholar] [CrossRef]
- Howarth, R.W. A bridge to nowhere: Methane emissions and the greenhouse gas footprint of natural gas. Energy Sci. Eng. 2014, 2, 47–60. [Google Scholar] [CrossRef]
- Samavati, V.; Emam-Djomeh, Z.; Mohammadifar, M.A.; Omid, M.; Mehdinia, A.L.I. Stability and Rheology of Dispersions Containing Polysaccharide, Oleic Acid and Whey Protein Isolate. J. Texture Stud. 2012, 43, 63–76. [Google Scholar] [CrossRef]
- Sivapratha, S.; Sarkar, P. Multiple layers and conjugate materials for food emulsion stabilization. Crit. Rev. Food Sci. Nutr. 2018, 58, 877–892. [Google Scholar] [CrossRef]
- Yang, S.; Qin, W.; Zhao, X.; He, F.; Gong, H.; Liu, Y.; Feng, Y.; Zhou, Y.; Yu, G.; Li, J. Interfacial self-assembled behavior of pH/light-responsive host-guest alginate-based supra-amphiphiles for controlling emulsifying property. Carbohydr. Polym. 2021, 266, 118121. [Google Scholar] [CrossRef]
- Liao, W.; Gharsallaoui, A.; Dumas, E.; Elaissari, A. Understanding of the key factors influencing the properties of emulsions stabilized by sodium caseinate. Compr. Rev. Food Sci. Food Saf. 2022, 21, 5291–5317. [Google Scholar] [CrossRef] [PubMed]
- Hyun, K.; Wilhelm, M.; Klein, C.O.; Cho, K.S.; Nam, J.G.; Ahn, K.H.; Lee, S.J.; Ewoldt, R.H.; McKinley, G.H. A review of nonlinear oscillatory shear tests: Analysis and application of large amplitude oscillatory shear (LAOS). Prog. Polym. Sci. 2011, 36, 1697–1753. [Google Scholar] [CrossRef]
- Yin, H.; Pu, J.; Wan, Y.; Xiang, B.; Bechtel, P.J.; Sathivel, S. Rheological and Functional Properties of Catfish Skin Protein Hydrolysates. J. Food Sci. 2010, 75, E11–E17. [Google Scholar] [CrossRef]
- Hesarinejad, M.A.; Koocheki, A.; Razavi, S.M.A. Dynamic rheological properties of Lepidium perfoliatum seed gum: Effect of concentration, temperature and heating/cooling rate. Food Hydrocoll. 2014, 35, 583–589. [Google Scholar] [CrossRef]
- Karatay, G.G.B.; Galvão, A.M.M.T.; Hubinger, M.D. Storage Stability of Conventional and High Internal Phase Emulsions Stabilized Solely by Chickpea Aquafaba. Foods 2022, 11, 1588. [Google Scholar] [CrossRef]
- Sridharan, S.; Meinders, M.B.J.; Sagis, L.M.C.; Bitter, J.H.; Nikiforidis, C.V. Starch controls brittleness in emulsion-gels stabilized by pea flour. Food Hydrocoll. 2022, 131, 107708. [Google Scholar] [CrossRef]
- Domian, E.; Mańko-Jurkowska, D. The effect of homogenization and heat treatment on gelation of whey proteins in emulsions. J. Food Eng. 2022, 319, 110915. [Google Scholar] [CrossRef]
- Kundu, P.K.; Cohen, I.M.; Dowling, D.R. Boundary Layers and Related Topics. Fluid. Mech. 2016, 469–532. [Google Scholar] [CrossRef]
- Castilla, R.; Peña, M. Jupyter Notebooks for the study of advanced topics in Fluid Mechanics. Comput. Appl. Eng. Educ. 2023, 31, 1001–1013. [Google Scholar] [CrossRef]
- Malkin, A.Y.; Masalova, I. Shear and normal stresses in flow of highly concentrated emulsions. J. Nonnewton Fluid. Mech. 2007, 147, 65–68. [Google Scholar] [CrossRef]
- Avranas, A.; Stalidis, G.; Ritzoulis, G. Demulsification rate and zeta potential of O/W emulsions. Colloid Polym. Sci. 1988, 266, 937–940. [Google Scholar] [CrossRef]
- Gurpret, K.; Singh, S.K. Review of Nanoemulsion Formulation and Characterization Techniques. Indian J. Pharm. Sci. 2018, 80, 781–789. [Google Scholar] [CrossRef]
- Pinto, I.; Buss, A. ζ Potential as a Measure of Asphalt Emulsion Stability. Energy Fuels 2020, 34, 2143–2151. [Google Scholar] [CrossRef]
- Yilmaz, E.; Borchert, H.H. Design of a phytosphingosine-containing, positively-charged nanoemulsion as a colloidal carrier system for dermal application of ceramides. Eur. J. Pharm. Biopharm. 2005, 60, 91–98. [Google Scholar] [CrossRef] [PubMed]
- Đorđević, S.M.; Cekić, N.D.; Savić, M.M.; Isailović, T.M.; Ranđelović, D.V.; Marković, B.D.; Savić, S.R.; Stamenić, T.T.; Daniels, R.; Savić, S.D. Parenteral nanoemulsions as promising carriers for brain delivery of risperidone: Design, characterization and in vivo pharmacokinetic evaluation. Int. J. Pharm. 2015, 493, 40–54. [Google Scholar] [CrossRef] [PubMed]
- Schmelz, T.; Lesmes, U.; Weiss, J.; McClements, D.J. Modulation of physicochemical properties of lipid droplets using β-lactoglobulin and/or lactoferrin interfacial coatings. Food Hydrocoll. 2011, 25, 1181–1189. [Google Scholar] [CrossRef]
- Madivoli, E.S.; Kareru, P.G.; Gachanja, A.N.; Mugo, S.M.; Makhanu, D.S. Phytofabrication of iron nanoparticles and their catalytic activity. SN Appl. Sci. 2019, 1, 879. [Google Scholar] [CrossRef]
- Moreira, J.B.; Goularte, P.G.; de Morais, M.G.; Costa, J.A.V. Preparation of beta-carotene nanoemulsion and evaluation of stability at a long storage period. Food Sci. Technol. 2019, 39, 599–604. [Google Scholar] [CrossRef]
- Dickinson, E. Structure formation in casein-based gels, foams, and emulsions. Colloids Surf. A Physicochem. Eng. Asp. 2006, 288, 3–11. [Google Scholar] [CrossRef]
- Li, D.; Zhao, Y.; Wang, X.; Tang, H.; Wu, N.; Wu, F.; Yu, D.; Elfalleh, W. Effects of (+)-catechin on a rice bran protein oil-in-water emulsion: Droplet size, zeta-potential, emulsifying properties, and rheological behavior. Food Hydrocoll. 2020, 98, 105306. [Google Scholar] [CrossRef]
- Kulmyrzaev, A.A.; Schubert, H. Influence of KCl on the physicochemical properties of whey protein stabilized emulsions. Food Hydrocoll. 2004, 18, 13–19. [Google Scholar] [CrossRef]
- Zhang, Z.; Dalgleish, D.G.; Goff, H.D. Effect of pH and ionic strength on competitive protein adsorption to air/water interfaces in aqueous foams made with mixed milk proteins. Colloids Surf. B Biointerfaces 2004, 34, 113–121. [Google Scholar] [CrossRef] [PubMed]
- McLean, J.D.; Kilpatrick, P.K. Effects of Asphaltene Aggregation in Model Heptane–Toluene Mixtures on Stability of Water-in-Oil Emulsions. J. Colloid Interface Sci. 1997, 196, 23–34. [Google Scholar] [CrossRef]
- McClements, D.J.; Lu, J.; Grossmann, L. Proposed Methods for Testing and Comparing the Emulsifying Properties of Proteins from Animal, Plant, and Alternative Sources. Colloids Interfaces 2022, 6, 19. [Google Scholar] [CrossRef]
- Anema, S.G.; Lowe, E.K.; Li, Y. Effect of pH on the viscosity of heated reconstituted skim milk. Int. Dairy J. 2004, 14, 541–548. [Google Scholar] [CrossRef]
- Siau, C.L.; Karim, A.A.; Norziah, M.H.; Wan Rosli, W.D. Effects of cationization on DSC thermal profiles, pasting and emulsifying properties of sago starch. J. Sci. Food Agric. 2004, 84, 1722–1730. [Google Scholar] [CrossRef]
- Eicke, H.F.; Borkovec, M.; Das-Gupta, B. Conductivity of water-in-oil microemulsions: A quantitative charge fluctuation model. J. Phys. Chem. 1989, 93, 314–317. [Google Scholar] [CrossRef]
- Briggs, N.; Raman, A.K.Y.; Barrett, L.; Brown, C.; Li, B.; Leavitt, D.; Aichele, C.P.; Crossley, S. Stable pickering emulsions using multi-walled carbon nanotubes of varying wettability. Colloids Surf. A Physicochem. Eng. Asp. 2018, 537, 227–235. [Google Scholar] [CrossRef]
- Kawanami, T.; Togashi, K.; Fumoto, K.; Hirano, S.; Zhang, P.; Shirai, K.; Hirasawa, S. Thermophysical properties and thermal characteristics of phase change emulsion for thermal energy storage media. Energy 2016, 117, 562–568. [Google Scholar] [CrossRef]
- Chiesa, M.; Garg, J.; Kang, Y.T.; Chen, G. Thermal conductivity and viscosity of water-in-oil nanoemulsions. Colloids Surf. A Physicochem. Eng. Asp. 2008, 326, 67–72. [Google Scholar] [CrossRef]
- Wilson, O.M.; Hu, X.; Cahill, D.G.; Braun, P.V. Colloidal metal particles as probes of nanoscale thermal transport in fluids. Phys. Rev. B 2002, 66, 224301. [Google Scholar] [CrossRef]
- D’alessandro, G.; Potenza, M.; Corasaniti, S.; Sfarra, S.; Coppa, P.; Bovesecchi, G.; de Monte, F. Modeling and Measuring Thermodynamic and Transport Thermophysical Properties: A Review. Energies 2022, 15, 8807. [Google Scholar] [CrossRef]
- Zhang, W.P.; Li, L.Y.; Jia, B.; Ou, W.H.; Song, L.L.; Zhang, Q.J. Preparation and characteristics of multiple emulsions containing liquid crystals. Liq. Cryst. 2018, 45, 1186–1195. [Google Scholar] [CrossRef]
- Gill, P.; Moghadam, T.T.; Ranjbar, B. Differential Scanning Calorimetry Techniques: Applications in Biology and Nanoscience. J. Biomol. Tech. 2010, 21, 167. [Google Scholar]
- Garti, N.; Aserin, A.; Tiunova, I.; Fanun, M. A DSC study of water behavior in water-in-oil microemulsions stabilized by sucrose esters and butanol. Colloids Surf. A Physicochem. Eng. Asp. 2000, 170, 1–18. [Google Scholar] [CrossRef]
- Niizawa, I.; Sihufe, G.A.; Zorrilla, S.E. Design of whey protein aggregates towards microgel-stabilized emulsion generation. LWT 2021, 152, 112324. [Google Scholar] [CrossRef]
- Abdolmaleki, K.; Alizadeh, L.; Hosseini, S.M.; Nayebzadeh, K. Concentrated O/W emulsions formulated by binary and ternary mixtures of sodium caseinate, xanthan and guar gums: Rheological properties, microstructure, and stability. Food Sci. Biotechnol. 2020, 29, 1685–1693. [Google Scholar] [CrossRef]
- Kasprzak, M.; Jamróz, E.; Nowak, N.; Grzebieniarz, W.; Tkaczewska, J. Design of triple-layer films with blackseed protein as dispersion or emulsion. Food Chem. 2024, 435, 137533. [Google Scholar] [CrossRef]
- Zografi, G. Physical stability assessment of emulsions and related disperse systems: A critical review. J. Soc. Cosmet. Chem. 1982, 33, 345–358. [Google Scholar]
- Estanqueiro, M.; Conceição, J.; Amaral, M.H.; Santos, D.; Silva, J.B.; Lobo, J.M.S. Characterization and stability studies of emulsion systems containing pumice. Braz. J. Pharm. Sci. 2014, 50, 361–369. [Google Scholar] [CrossRef]
- Cannell, J.S. Fundamentals of stability testing. Int. J. Cosmet. Sci. 1985, 7, 291–303. [Google Scholar] [CrossRef]
- Navarro-Pérez, Y.M.; Cedeño-Linares, E.; Norman-Montenegro, O.; Ruz-Sanjuan, V.; Mondeja-Rivera, Y.; Hernández-Monzón, A.M.; González-Bedia, M.M. Prediction of the physical stability and quality of O/W cosmetic emulsions using full factorial design [Predicción de la estabilidad física y calidad de emulsiones cosméticas O/W mediante diseño factorial completo]. J. Pharm. Pharmacogn. Res. 2021, 9, 98–112. [Google Scholar] [CrossRef]
- Dinache, A.; Tozar, T.; Smarandache, A.; Andrei, I.R.; Nistorescu, S.; Nastasa, V.; Staicu, A.; Pascu, M.L.; Romanitan, M.O. Spectroscopic Characterization of Emulsions Generated with a New Laser-Assisted Device. Molecules 2020, 25, 1729. [Google Scholar] [CrossRef]
- Schestkowa, H.; Drusch, S.; Wagemans, A.M. FTIR analysis of β-lactoglobulin at the oil/water-interface. Food Chem. 2020, 302, 125349. [Google Scholar] [CrossRef]
- Hayati, I.N.; Man, Y.B.C.; Tan, C.P.; Aini, I.N. Monitoring peroxide value in oxidized emulsions by Fourier transform infrared spectroscopy. Eur. J. Lipid Sci. Technol. 2005, 107, 886–895. [Google Scholar] [CrossRef]
- Jorgensen, L.; Van De Weert, M.; Vermehren, C.; Bjerregaard, S.; Frokjaer, S. Probing structural changes of proteins incorporated into water-in-oil emulsions. J. Pharm. Sci. 2004, 93, 1847–1859. [Google Scholar] [CrossRef]
- Zhou, G.W.; Li, G.Z.; Chen, W.J. Fourier Transform Infrared Investigation on Water States and the Conformations of Aerosol-OT in Reverse Microemulsions. Langmuir 2002, 18, 4566–4571. [Google Scholar] [CrossRef]
- Sechler, T.D.; DelSole, E.M.; Deák, J.C. Measuring properties of interfacial and bulk water regions in a reverse micelle with IR spectroscopy: A volumetric analysis of the inhomogeneously broadened OH band. J. Colloid Interface Sci. 2010, 346, 391–397. [Google Scholar] [CrossRef] [PubMed]
- Kiefer, J.; Frank, K.; Schuchmann, H.P. Attenuated total reflection infrared (ATR-IR) spectroscopy of a water-in-oil emulsion. Appl. Spectrosc. 2011, 65, 1024–1028. [Google Scholar] [CrossRef] [PubMed]
- Kiefer, J.; Frank, K.; Zehentbauer, F.M.; Schuchmann, H.P. Infrared Spectroscopy of Bilberry Extract Water-in-Oil Emulsions: Sensing the Water-Oil Interface. Biosensors 2016, 6, 13. [Google Scholar] [CrossRef] [PubMed]
- Daoud, S.; Bou-maroun, E.; Dujourdy, L.; Waschatko, G.; Billecke, N.; Cayot, P. Fast and direct analysis of oxidation levels of oil-in-water emulsions using ATR-FTIR. Food Chem. 2019, 293, 307–314. [Google Scholar] [CrossRef] [PubMed]
- Yang, D.; Ying, Y. Applications of Raman Spectroscopy in Agricultural Products and Food Analysis: A Review. Appl. Spectrosc. Rev. 2011, 46, 539–560. [Google Scholar] [CrossRef]
- Huang, W.E.; Li, M.; Jarvis, R.M.; Goodacre, R.; Banwart, S.A. Shining light on the microbial world the application of Raman microspectroscopy. Adv. Appl. Microbiol. 2010, 70, 153–186. [Google Scholar] [CrossRef]
- Jin, H.; Ma, Q.; Dou, T.; Jin, S.; Jiang, L. Raman Spectroscopy of Emulsions and Emulsion Chemistry. Crit. Rev. Anal. Chem. 2023. [Google Scholar] [CrossRef]
- Wei, Z.; Cheng, J.; Huang, Q. Food-grade Pickering emulsions stabilized by ovotransferrin fibrils. Food Hydrocoll. 2019, 94, 592–602. [Google Scholar] [CrossRef]
- Guo, X.; Zhang, Y.; Jamali, M.A.; Peng, Z. Manipulating interfacial behaviour and emulsifying properties of myofibrillar proteins by L-Arginine at low and high salt concentration. Int. J. Food Sci. Technol. 2021, 56, 999–1012. [Google Scholar] [CrossRef]
- Wu, L.; Wang, L.; Qi, B.; Zhang, X.; Chen, F.; Li, Y.; Sui, X.; Jiang, L. 3D confocal Raman imaging of oil-rich emulsion from enzyme-assisted aqueous extraction of extruded soybean powder. Food Chem. 2018, 249, 16–21. [Google Scholar] [CrossRef]
- Elizalde, O.; Azpeitia, M.; Reis, M.M.; Asua, J.M.; Leiza, J.R. Monitoring Emulsion Polymerization Reactors: Calorimetry Versus Raman Spectroscopy. Ind. Eng. Chem. Res. 2005, 44, 7200–7207. [Google Scholar] [CrossRef]
- Dropsit, E.; Hoppe, S.; Chapron, D.; Durand, A.; Bourson, P. In situ conversion monitoring of styrene emulsion polymerization by deconvolution of a single reference band near 1000 cm−1. J. Raman Spectrosc. 2019, 50, 1938–1948. [Google Scholar] [CrossRef]
- Schlappa, S.; Bressel, L.; Reich, O.; Münzberg, M. Advanced Particle Size Analysis in High-Solid-Content Polymer Dispersions Using Photon Density Wave Spectroscopy. Polymers 2023, 15, 3181. [Google Scholar] [CrossRef] [PubMed]
- Zimmermann, S.; Reich, O.; Bressel, L. Exploitation of inline photon density wave spectroscopy for titania particle syntheses. J. Am. Ceram. Soc. 2023, 106, 671–680. [Google Scholar] [CrossRef]
- Sandmann, M.; Münzberg, M.; Bressel, L.; Reich, O.; Hass, R. Inline monitoring of high cell density cultivation of Scenedesmus rubescens in a mesh ultra-thin layer photobioreactor by photon density wave spectroscopy. BMC Res. Notes 2022, 15, 54. [Google Scholar] [CrossRef]
- Hass, R.; Mnzberg, M.; Bressel, L.; Reich, O. Industrial applications of Photon Density Wave spectroscopy for in-line particle sizing [Invited]. Appl. Opt. 2013, 52, 1423–1431. [Google Scholar] [CrossRef]
- Bressel, L.; Münzberg, M.; Hass, R.; Reich, O. Fiber-optical particle sizing by photon density wave spectroscopy. 23rd Int. Conf. Opt. Fibre Sens. 2014, 915756, 733–736. [Google Scholar] [CrossRef]
- Bressel, K.; Müller, W.; Leser, M.E.; Reich, O.; Hass, R.; Wooster, T.J. Depletion-Induced Flocculation of Concentrated Emulsions Probed by Photon Density Wave Spectroscopy. Langmuir 2020, 36, 3504–3513. [Google Scholar] [CrossRef] [PubMed]
- Kazemeini, S.M.; Campos, D.P.; Rosenthal, A.J. Muscle activity during oral processing of sticky-cohesive foods. Physiol. Behav. 2021, 242, 113580. [Google Scholar] [CrossRef]
- Rosenthal, A.J.; Thompson, P. What is cohesiveness?—A linguistic exploration of the food texture testing literature. J. Texture Stud. 2021, 52, 294–302. [Google Scholar] [CrossRef]
- Rosenthal, A.J. Instrumental characterisation of textural properties of solid and semi-solid food. In Modifying Food Texture: Volume 2: Sensory Analysis, Consumer Requirements and Preferences; Woodhead Publishing: Sawston, UK, 2015; pp. 89–105. [Google Scholar] [CrossRef]
- McMullen, R.L.; Gorcea, M.; Chen, S. Emulsions and their Characterization by Texture Profile Analysis. In Handbook of Formulating Dermal Applications; John Wiley & Sons, Inc.: Hoboken, NJ, USA; Scrivener Publishing LLC: Beverly, MA, USA, 2016; pp. 129–153. [Google Scholar] [CrossRef]
- Yang, X.; Gong, T.; Li, D.; Li, A.; Sun, L.; Guo, Y. Preparation of high viscoelastic emulsion gels based on the synergistic gelation mechanism of xanthan and konjac glucomannan. Carbohydr. Polym. 2019, 226, 115278. [Google Scholar] [CrossRef] [PubMed]
- Ingrassia, R.; Busti, P.A.; Boeris, V. Physicochemical and mechanical properties of a new cold-set emulsion gel system and the effect of quinoa protein fortification. LWT 2022, 156, 113048. [Google Scholar] [CrossRef]
- Ahn, N.; Park, J.H.; Chai, C.; Imm, J.Y. The interaction of milk sphingomyelin and proteins on stability and microstructure of dairy emulsions. J. Dairy Sci. 2022, 105, 3832–3845. [Google Scholar] [CrossRef] [PubMed]
- Tkaczewska, J.; Jamróz, E.; Guzik, P.; Kopeć, M. Attempt to Extend the Shelf-Life of Fish Products by Means of Innovative Double-Layer Active Biodegradable Films. Polymers 2022, 14, 1717. [Google Scholar] [CrossRef] [PubMed]
- Riesz, P.; Kondo, T. Free radical formation induced by ultrasound and its biological implications. Free Radic. Biol. Med. 1992, 13, 247–270. [Google Scholar] [CrossRef]
- Fereidoon, S.; Ying, Z. Lipid oxidation and improving the oxidative stability. Chem. Soc. Rev. 2010, 39, 4067–4079. [Google Scholar] [CrossRef]
- Ghelichi, S.; Hajfathalian, M.; Yesiltas, B.; Sørensen, A.-D.M.; García-Moreno, P.J.; Jacobsen, C. Oxidation and oxidative stability in emulsions. Compr. Rev. Food Sci. Food Saf. 2023, 22, 1864–1901. [Google Scholar] [CrossRef] [PubMed]
- Laguerre, M.; Bily, A.; Roller, M.; Birti’c, S.B. Mass Transport Phenomena in Lipid Oxidation and Antioxidation. Annu. Rev. Food Sci. Technol. 2017, 8, 391–411. [Google Scholar] [CrossRef]
- Nielsen, N.S.; Timm-Heinrich, M.; Jacobsen, C. Comparison of Wet-Chemical Methods for Determination of Lipid Hydroperoxides. J. Food Lipids 2003, 10, 35–50. [Google Scholar] [CrossRef]
- Guillén-Sans, R.; Guzmán-Chozas, M. The thiobarbituric acid (TBA) reaction in foods: A review. Crit. Rev. Food Sci. Nutr. 1998, 38, 315–350. [Google Scholar] [CrossRef]
- Thomsen, B.R.; Yesiltas, B.; Sørensen, A.D.M.; Hermund, D.B.; Glastrup, J.; Jacobsen, C. Comparison of Three Methods for Extraction of Volatile Lipid Oxidation Products from Food Matrices for GC–MS Analysis. JAOCS J. Am. Oil Chem. Soc. 2016, 93, 929–942. [Google Scholar] [CrossRef]
- Merkx, D.W.H.; Hong, G.T.S.; Ermacora, A.; Van Duynhoven, J.P.M. Rapid Quantitative Profiling of Lipid Oxidation Products in a Food Emulsion by 1H NMR. Anal. Chem. 2018, 90, 4863–4870. [Google Scholar] [CrossRef] [PubMed]
- Beysseriat, M.; Decker, E.A.; McClements, D.J. Preliminary study of the influence of dietary fiber on the properties of oil-in-water emulsions passing through an in vitro human digestion model. Food Hydrocoll. 2006, 20, 800–809. [Google Scholar] [CrossRef]
- McClements, D.J.; Li, Y. Review of in vitro digestion models for rapid screening of emulsion-based systems. Food Funct. 2010, 1, 32–59. [Google Scholar] [CrossRef]
- Scheuble, N.; Schaffner, J.; Schumacher, M.; Windhab, E.J.; Liu, D.; Parker, H.; Steingoetter, A.; Fischer, P. Tailoring Emulsions for Controlled Lipid Release: Establishing in vitro-in Vivo Correlation for Digestion of Lipids. ACS Appl. Mater. Interfaces 2018, 10, 17571–17581. [Google Scholar] [CrossRef]
- Bai, L.; Lv, S.; Xiang, W.; Huan, S.; McClements, D.J.; Rojas, O.J. Oil-in-water Pickering emulsions via microfluidization with cellulose nanocrystals: 2. In vitro lipid digestion. Food Hydrocoll. 2019, 96, 709–716. [Google Scholar] [CrossRef]
- Mat, D.J.L.; Souchon, I.; Michon, C.; Le Feunteun, S. Gastro-intestinal in vitro digestions of protein emulsions monitored by pH-stat: Influence of structural properties and interplay between proteolysis and lipolysis. Food Chem. 2020, 311, 125946. [Google Scholar] [CrossRef]
- Grundy, M.M.; Abrahamse, E.; Almgren, A.; Alminger, M.; Andres, A.; Ariëns, R.M.; Bastiaan-Net, S.; Bourlieu-Lacanal, C.; Brodkorb, A.; Bronze, M.R.; et al. INFOGEST inter-laboratory recommendations for assaying gastric and pancreatic lipases activities prior to in vitro digestion studies. J. Funct. Foods 2021, 82, 104497. [Google Scholar] [CrossRef]
- Mulet-Cabero, A.-I.; Egger, L.; Portmann, R.; Ménard, O.; Marze, S.; Minekus, M.; Le Feunteun, S.; Sarkar, A.; Grundy, M.M.-L.; Carrière, F.; et al. A standardised semi-dynamic in vitro digestion method suitable for food—An international consensus. Food Funct. 2020, 11, 1702–1720. [Google Scholar] [CrossRef] [PubMed]
- Armand, M.; Pasquier, B.; André, M.; Borel, P.; Senft, M.; Peyrot, J.; Salducci, J.; Portugal, H.; Jaussan, V.; Lairon, D. Digestion and absorption of 2 fat emulsions with different droplet sizes in the human digestive tract. Am. J. Clin. Nutr. 1999, 70, 1096–1106. [Google Scholar] [CrossRef]
- Guo, Q.; Bellissimo, N.; Rousseau, D. Role of gel structure in controlling in vitro intestinal lipid digestion in whey protein emulsion gels. Food Hydrocoll. 2017, 69, 264–272. [Google Scholar] [CrossRef]
- Ye, A.; Wang, X.; Lin, Q.; Han, J.; Singh, H. Dynamic gastric stability and in vitro lipid digestion of whey-protein-stabilised emulsions: Effect of heat treatment. Food Chem. 2020, 318, 126463. [Google Scholar] [CrossRef]
- Kenta, S.; Raikos, V.; Kapolos, J.; Koliadima, A.; Karaiskakis, G. Sedimentation Field-Flow Fractionation as a Tool for the Study of Milk Protein-Stabilized Model Oil-in-Water Emulsions: Effect of Protein Concentration and Homogenization Pressure. J. Liq. Chromatogr. Relat. Technol. 2013, 36, 288–303. [Google Scholar] [CrossRef]
- Qu, H.; Wang, J.; Wu, Y.; Zheng, J.; Krishnaiah, Y.S.; Absar, M.; Choi, S.; Ashraf, M.; Cruz, C.N.; Xu, X. Asymmetric flow field flow fractionation for the characterization of globule size distribution in complex formulations: A cyclosporine ophthalmic emulsion case. Int. J. Pharm. 2018, 538, 215–222. [Google Scholar] [CrossRef] [PubMed]
- Caldwell, K.D.; Li, J. Emulsion characterization by the combined sedimentation field—Flow fractionation—Photon correlation spectroscopy methods. J. Colloid Interface Sci. 1989, 132, 256–268. [Google Scholar] [CrossRef]
- Miller, C.M.; Venkatesan, J.; Silebi, C.A.; Sudol, E.D.; El-Aasser, M.S. Characterization of Miniemulsion Droplet Size and Stability Using Capillary Hydrodynamic Fractionation. J. Colloid Interface Sci. 1994, 162, 11–18. [Google Scholar] [CrossRef]
- Giordani, S.; Marassi, V.; Placci, A.; Zattoni, A.; Roda, B.; Reschiglian, P. Field-Flow Fractionation in Molecular Biology and Biotechnology. Molecules 2023, 28, 6201. [Google Scholar] [CrossRef]
- Venkatesh, S.; Li, J.; Caldwell, K.D.; Anderson, B.D. Compositional heterogeneity in parenteral lipid emulsions after sedimentation field flow fractionation. J. Pharm. Sci. 1998, 87, 859–866. [Google Scholar] [CrossRef]
- Chmelik, J. Applications of field-flow fractionation in proteomics: Presence and future. Proteomics 2007, 7, 2719–2728. [Google Scholar] [CrossRef]
- Yohannes, G.; Jussila, M.; Hartonen, K.; Riekkola, M.L. Asymmetrical flow field-flow fractionation technique for separation and characterization of biopolymers and bioparticles. J. Chromatogr. A 2011, 1218, 4104–4116. [Google Scholar] [CrossRef] [PubMed]
- Reschiglian, P.; Zattoni, A.; Roda, B.; Michelini, E.; Roda, A. Field-flow fractionation and biotechnology. Trends Biotechnol. 2005, 23, 475–483. [Google Scholar] [CrossRef] [PubMed]
- Janča, J.; Sobota, J. Trends in Polymer and Particle Characterization by Microfluidic Field-Flow Fractionation Methods: Science or Business? Int. J. Polym. Anal. Charact. 2014, 19, 296–308. [Google Scholar] [CrossRef]
- Saenmuangchin, R.; Techarang, T.; Mekprayoon, S.; Zulfah, N.L.; Siripinyanond, A. Field-flow fractionation. In Sample Introduction Systems in ICPMS and ICPOES; Elsevier: Amsterdam, The Netherlands, 2020; pp. 357–380. [Google Scholar] [CrossRef]
- Wahlund, K.G. Flow field-flow fractionation: Critical overview. J. Chromatogr. A 2013, 1287, 97–112. [Google Scholar] [CrossRef]
- Zattoni, A.; Roda, B.; Borghi, F.; Marassi, V.; Reschiglian, P. Flow field-flow fractionation for the analysis of nanoparticles used in drug delivery. J. Pharm. Biomed. Anal. 2014, 87, 53–61. [Google Scholar] [CrossRef]
- Shin, S.Y.; Seo, J.W.; Kim, J.Y.; Williams, P.S.; Moon, M.H. Flow Field-Flow Fractionation with a Thickness-Tapered Channel. Anal. Chem. 2022, 94, 14460–14466. [Google Scholar] [CrossRef] [PubMed]
- Marassi, V.; Roda, B.; Casolari, S.; Ortelli, S.; Blosi, M.; Zattoni, A.; Costa, A.L.; Reschiglian, P. Hollow-fiber flow field-flow fractionation and multi-angle light scattering as a new analytical solution for quality control in pharmaceutical nanotechnology. Microchem. J. 2018, 136, 149–156. [Google Scholar] [CrossRef]
- Rambaldi, D.C.; Zattoni, A.; Casolari, S.; Reschiglian, P.; Roessner, D.; Johann, C. An Analytical Method for Size and Shape Characterization of Blood Lipoproteins. Clin. Chem. 2007, 53, 2026–2029. [Google Scholar] [CrossRef][Green Version]
- Marassi, V.; Beretti, F.; Roda, B.; Alessandrini, A.; Facci, P.; Maraldi, T.; Zattoni, A.; Reschiglian, P.; Portolani, M. A new approach for the separation, characterization and testing of potential prionoid protein aggregates through hollow-fiber flow field-flow fractionation and multi-angle light scattering. Anal. Chim. Acta 2019, 1087, 121–130. [Google Scholar] [CrossRef]
- Lee, J.Y.; Byeon, S.K.; Moon, M.H. Profiling of oxidized phospholipids in lipoproteins from patients with coronary artery disease by hollow fiber flow field-flow fractionation and nanoflow liquid chromatography-tandem mass spectrometry. Anal. Chem. 2015, 87, 1266–1273. [Google Scholar] [CrossRef]
- Carlshaf, A.; Jonsson, J.A. Perturbations of the Retention Parameter Due to Sample Overloading in Hollow-Fiber Flow Field-Flow Fractionation. Sep. Sci. Technol. 1993, 28, 1191–1201. [Google Scholar] [CrossRef]
- Litzén, A. Separation Speed, Retention, and Dispersion in Asymmetrical Flow Field-Flow Fractionation as Functions of Channel Dimensions and Flow Rates. Anal. Chem. 1993, 65, 461–470. [Google Scholar] [CrossRef]
- Gale, B.K.; Caldwell, K.D.; Bruno Frazier, A. A micromachined electrical field-flow fractionation (μ-EFFF) system. IEEE Trans. Biomed. Eng. 1998, 45, 1459–1469. [Google Scholar] [CrossRef]
- Tri, N.; Caldwell, K.; Beckett, R. Development of Electrical Field-Flow Fractionation. Anal. Chem. 2000, 72, 1823–1829. [Google Scholar] [CrossRef] [PubMed]
- Zhang, X.; Li, Y.; Shen, S.; Lee, S.; Dou, H. Field-flow fractionation: A gentle separation and characterization technique in biomedicine. TrAC Trends Anal. Chem. 2018, 108, 231–238. [Google Scholar] [CrossRef]
- Makan, A.C.; Williams, R.P.; Pasch, H. Field Flow Fractionation for the Size, Molar Mass, and Gel Content Analysis of Emulsion Polymers for Water-Based Coatings. Macromol. Chem. Phys. 2016, 217, 2027–2040. [Google Scholar] [CrossRef]
- Choi, J.; Fuentes, C.; Fransson, J.; Wahlgren, M.; Nilsson, L. Separation and zeta-potential determination of proteins and their oligomers using electrical asymmetrical flow field-flow fractionation (EAF4). J. Chromatogr. A 2020, 1633, 461625. [Google Scholar] [CrossRef] [PubMed]
- Erdem, B.; Sully, Y.; Sudol, E.D.; Dimonie, V.L.; El-Aasser, M.S. Determination of Miniemulsion Droplet Size via Soap Titration. Langmuir 2000, 16, 4890–4895. [Google Scholar] [CrossRef]
- Silebi, C.A.; Dosramos, J.G. Separation of submicrometer particles by capillary hydrodynamic fractionation (CHDF). J. Colloid Interface Sci. 1989, 130, 14–24. [Google Scholar] [CrossRef]
- Texter, J. Capillary Hydrodynamic Fractionation of Organic Nanopigment Dispersions. In Particle Sizing and Characterization; ACS: Singapore, 2004; pp. 151–173. [Google Scholar] [CrossRef]
- Clementi, L.A.; Artetxe, Z.; Aguirreurreta, Z.; Agirre, A.; Leiza, J.R.; Gugliotta, L.M.; Vega, J.R. Capillary hydrodynamic fractionation of hydrophobic colloids: Errors in the estimated particle size distribution. Particuology 2014, 17, 97–105. [Google Scholar] [CrossRef]
- DosRamos, J.G.; Silebi, C.A. The determination of particle size distribution of submicrometer particles by capillary hydrodynamic fractionation (CHDF). J. Colloid Interface Sci. 1990, 135, 165–177. [Google Scholar] [CrossRef]


Disclaimer/Publisher’s Note: The statements, opinions and data contained in all publications are solely those of the individual author(s) and contributor(s) and not of MDPI and/or the editor(s). MDPI and/or the editor(s) disclaim responsibility for any injury to people or property resulting from any ideas, methods, instructions or products referred to in the content. |
© 2024 by the authors. Licensee MDPI, Basel, Switzerland. This article is an open access article distributed under the terms and conditions of the Creative Commons Attribution (CC BY) license (https://creativecommons.org/licenses/by/4.0/).