1. Introduction
With the intensive evolution of IT ecosystems, such as the cloud computing infrastructures and the Internet of Things (IoT), in complexity and sophistication, automated management methods are becoming increasingly important for the industry. Performance surveillance and root cause analysis (RCA) of issues using traditional monitoring tools, dashboarding of such environments, and operator-driven correlation of occurring atomic events for inference are not sufficient to effectively derive sources of misbehaviors. Providers of cloud services, including VMware, are continuously researching novel solutions and product features with machine intelligence to address this challenge. It concerns the diagnosis of customer data centers and the products managing those assets. In particular, when a problem has been detected (reflected in an alert with related symptoms) within an application service, in most cases, it is not self-explainable in terms of its underlying reasons. Whether it comes from a machine learning (ML) module that senses an atypical or anomalous behavior (in a performance metric or a super-metric representing its health status) or user-defined conditions, identifying the potential causes of such an event among a lot of other co-occurring events remains a hard task to be delegated to another ML engine. There are no generic resolutions to this challenge in the cloud space because of the diversities and specificities in those applications with various constraints and limitations, especially when it comes to the issue of unavailability of annotated datasets for supervised learning purposes. Approaches vary on a use case basis, some of which are outlined in the related discussion in
Section 2. In this regard, our goal in the current study is to design an interpretable ML approach and related system for identifying conditions of occurrence of major performance problems in the service with simple rules that are easily comprehensible for human operators. For such a goal, therefore, we have to deal with a supervised ML while finding sources of labels associated with the performance issue. In this scenario, each problem type has its special RCA model.
Currently,
Problem/Alert troubleshooting or RCA in cloud services remains a permanent headache for product engineers despite the extensive efforts, developed concepts, and toolsets, including Aria management platform [
1,
2,
3,
4] authors working towards its enhancement with AI Ops capabilities.
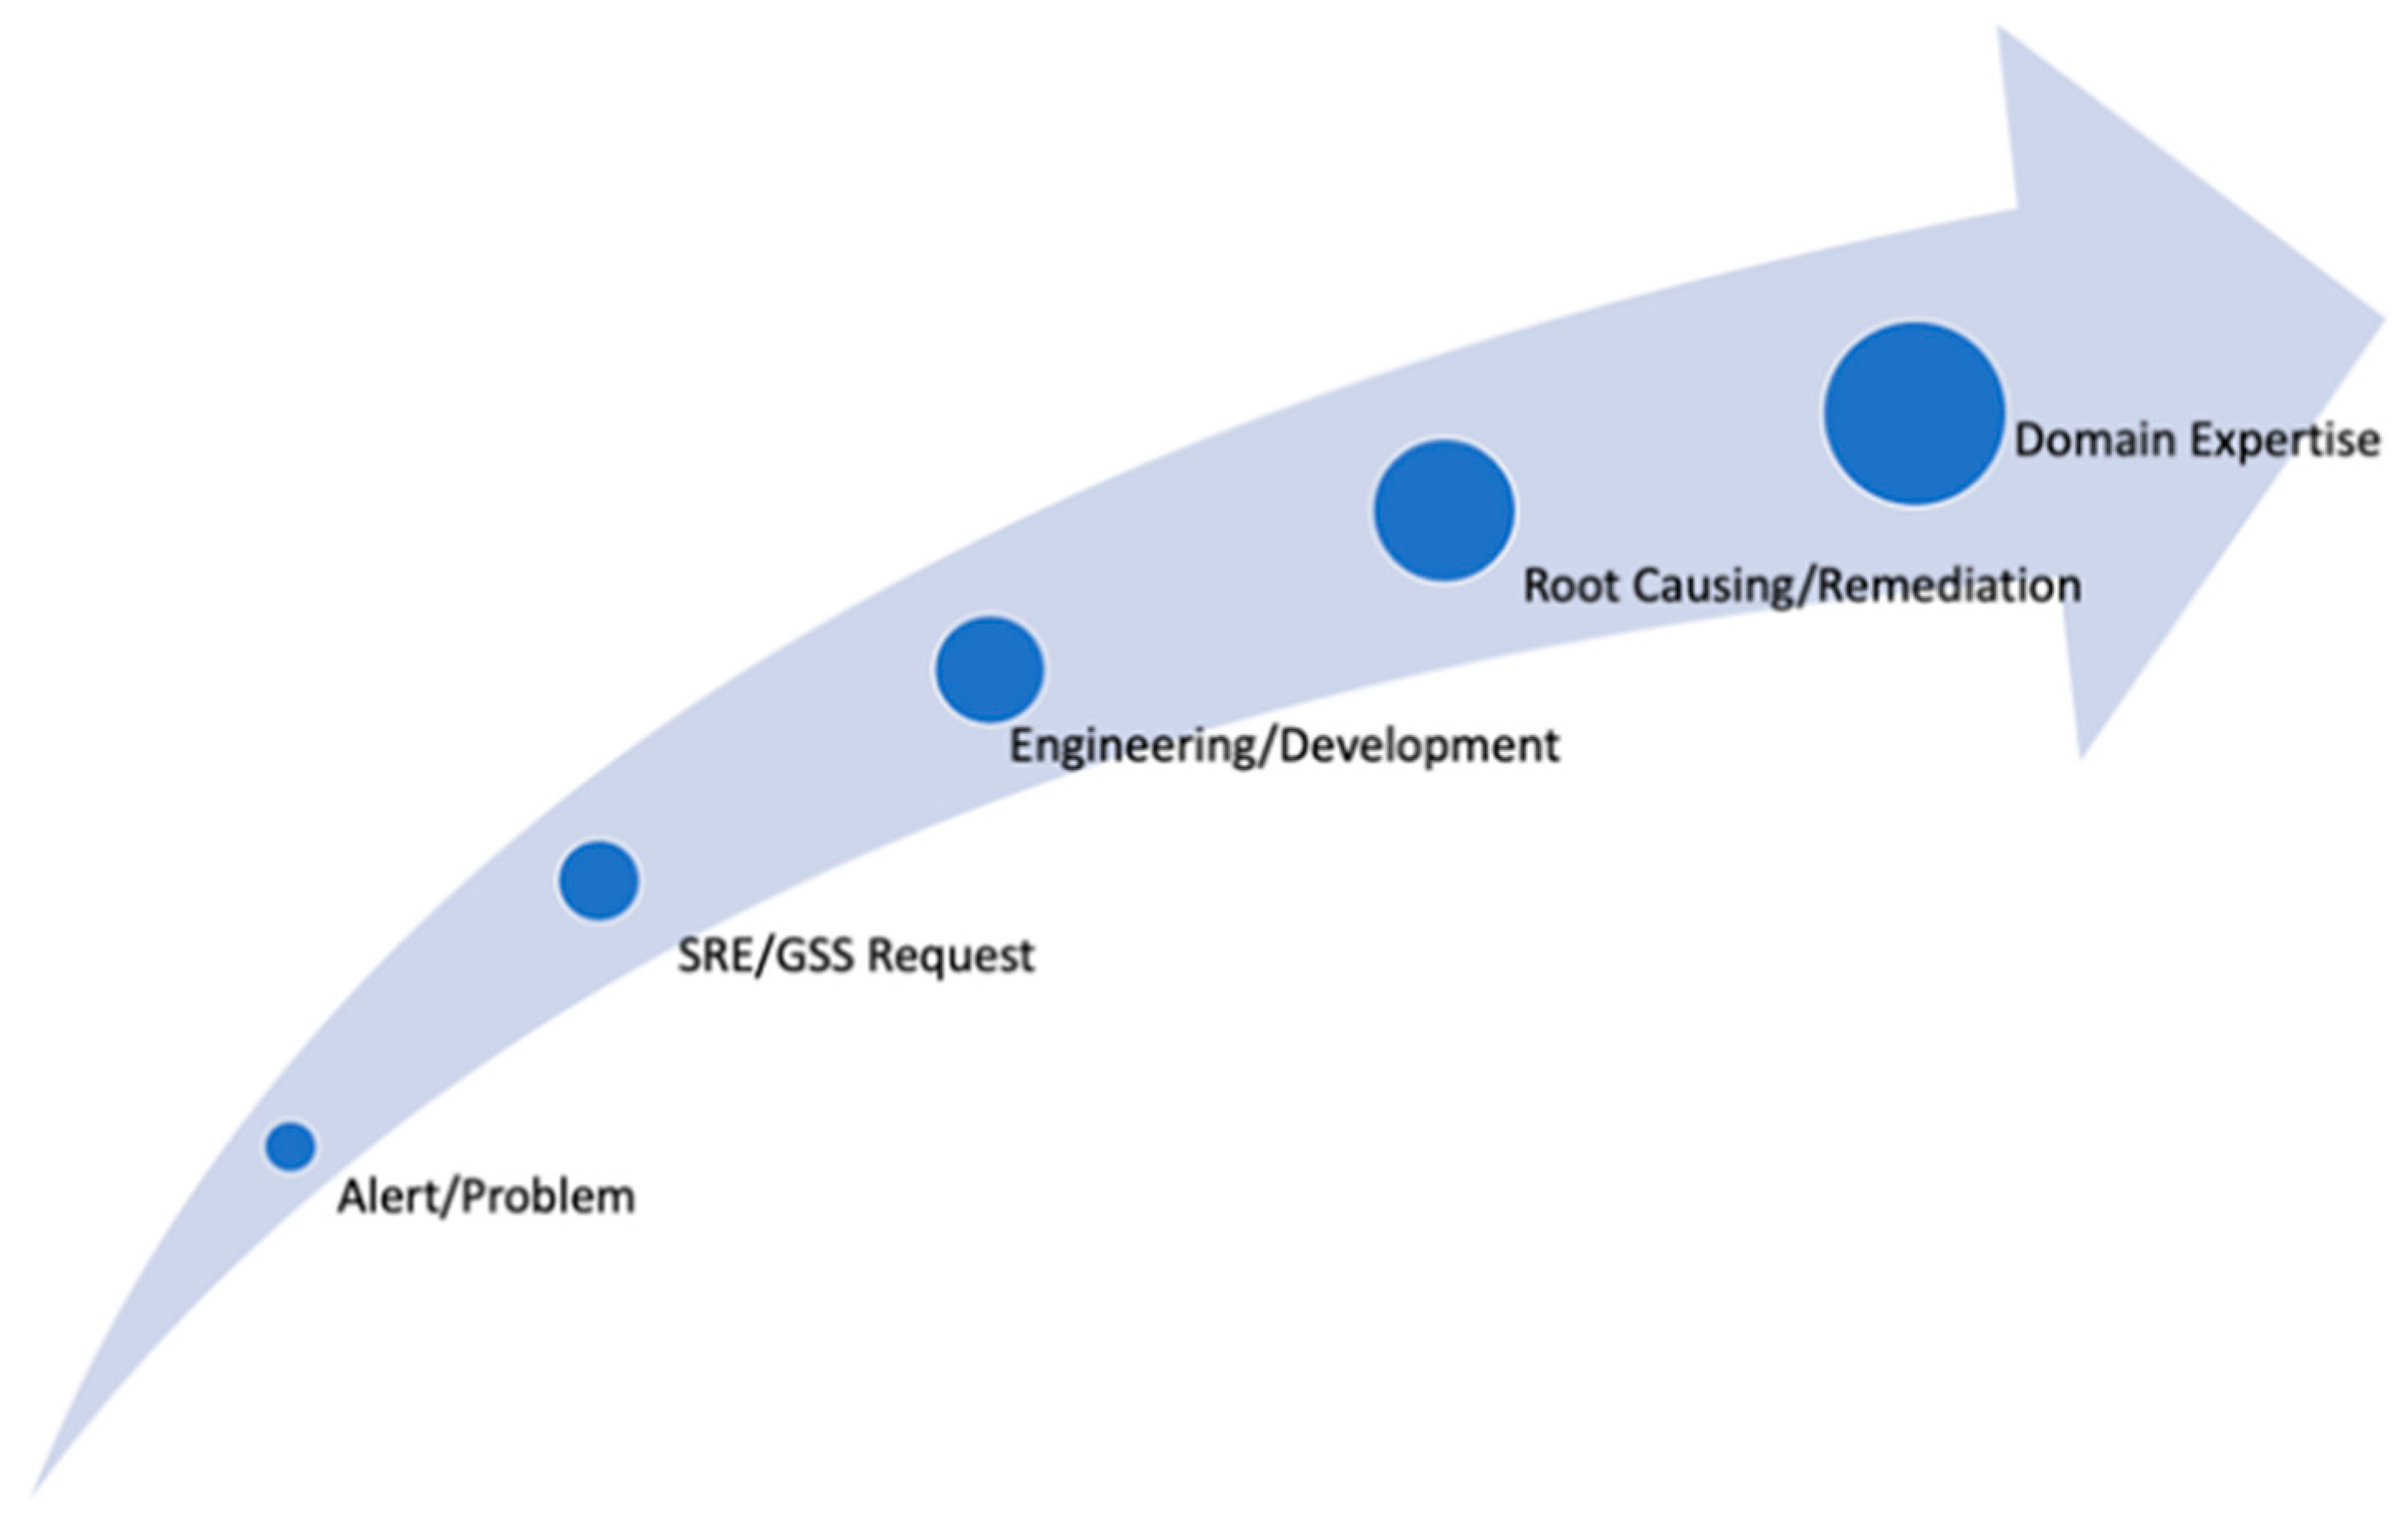
Figure 1 shows a typical chain (shared with us by the partner colleagues in the relevant department) of activities that a product engineer faces across his/her troubleshooting journeys:
- a.
Aria Ops (former vR Ops) generates a mission-critical alert, and a customer/user cannot diagnose or even understand the situation.
- b.
Site Reliability Engineering (SRE) or Global Support Services (GSS) teams are involved in the issue resolution.
- c.
If the issue necessitates, development teams are included in the process.
- d.
Development spends hours and days performing root cause analysis.
- e.
Development provides the fix for the problem.
- f.
Participating engineers gain valuable domain knowledge/expertise.
Overall, this process chain consumes varying amounts of time and human resources and implies impacts on customer business application loyalty.
At the same time, because of such intensive efforts, the knowledge gained during this process largely remains unsystematized for faster and more machine-based facilitation of handling the next cases to save critically important development resources and relocating them to the delivery of the core solutions/features in the roadmap of off-the-shelf product releases. Of course, in specific cases, when domain expertise is well developed and available, just by inspecting some performance metrics (time series) and log messages, it is quite straightforward to fix the problem with such a manual RCA. Our SRE partners in this study exemplify such situations from their experience. However, from the product perspective, the development teams have no mechanism for automatic knowledge sharing and RCA, which eventually could help the customer to quickly resolve the issue without involvement of third parties.
Our proposal is motivated by the above-mentioned traditional and inefficient ways of problem troubleshooting in such real-time services of business-critical importance and addresses the related lack of capabilities with a recommendation engine (ProbRCA), which is AI-driven and explainable for human operators. Users can easily approve/decline those recommendations for action frameworks and/or enrich related alert definitions with resolution recipes.
This paper focuses on an explainable AI Ops approach [
5] (see also survey [
6] on RCA methods) to automatically identify conditions that recommend the roots of a specific type of problem occurring across the customer base. Thus, separate ML models need to be trained and continuously improved with additional factual data for trending issues within the provider services. This will allow providers to fix the problems in a timely manner, and even automatically, within a global analytics service/recommender system, especially where the software-as-a-service (SaaS) delivery model is concerned (with the related opportunity to generalize cross-customer patterns based on available self-monitoring metrics of the cloud product). As previously mentioned, human ground truths are unavailable in our use case. Therefore, explainable ML methodologies become attainable with a self-labeling technique we adopt in our research while using system performance indicators (which might be a time series metric) as sources of generating labels. We recently validated this kind of self-supervised learning in the data center administration contexts in other research initiatives on cloud observability tasks (based also on log and trace data).
We also incorporate into our study a rule validation mechanism based on the Dempster–Shafer theory (DST) of evidence [
7] with uncertainty modeling, which essentially provides a “what-if” analysis framework for diagnosing the underlying system and its phenomena. This allows cloud users or developers of services to rigorously verify their hypotheses about the system behavior using a recently proposed interpretable classifier [
8] with expert encoded rule conditions on system features. It enables owners/experts of the cloud infrastructure or application services to build a troubleshooting knowledge base that systemizes their professional wisdom with scientifically grounded theory and explainable ML mechanisms for more effective and automated diagnosis of business-critical software for which they are responsible for healthy availability. This is another novelty aspect we incorporate into our study since, as stated in the survey [
6], no specific learning algorithm was found in the literature on DST.
2. Related Research
As noted in the introduction, real-time diagnostics of offered services remains a challenge. Assistive frameworks, such as Troubleshooting Workbench (TW) by Aria Operations [
1], which provide intelligent event/alert consolidation methods of guessing the origin of issues, target this critical task from different angles. TW relies on discovery of important and relevant changes occurring within a delta time-and-topology scope of the cloud infrastructure hierarchy that might provide evidence about the source of the problem, while the alert grouping concepts rely on helping users to focus on the larger incidents to make inference of the root issues easier, as well as helping to look into the problem in relation to co-occurring events across time and infra/app topology axes. However, all these methods are too inherently limited in automation capacities and intelligence power to perform deep and targeted RCA for alerts.
Other event management vendors, such as Big Panda (Redwood City, CA, USA) [
9], Moogsoft (San Francisco, CA, USA) [
10], and Pager Duty (San Francisco, CA, USA) [
11], have adopted the consolidated insight and incident discovery strategy but also built a vision of human-driven guidance of alerts and incidents consisting of those atomic events for training supervised RCA models. An important related approach in the industry is represented by InfoSight (Miami Lakes, FL, USA) [
12] by HPE, an AI-powered autonomous operations service applying analytics from global learning with a self-managing, self-healing, and self-optimizing vision for cloud applications. In this regard, ProbRCA was proposed to realize self-support for cloud management offerings with explainable features. It applies cross-customer user and developer feedback and trains accurate models over time to use them to recommend problem resolutions while interpreting/justifying those measures.
In various research initiatives (see [
13]), ML methods underly the automation of the management of complex data center applications (built upon many networked objects such as virtual machines (VMs), hosts, datastores, etc.) based on large volumes of data measured from those environments for complete monitoring and observability. At the same time, cloud services must be furnished with efficient self-diagnostics capabilities for business continuity and availability to avoid/eliminate time-consuming analysis of issues by product support specialists. This is a critical problem within self-driving data centers [
14]. Moreover, interpretable models (see [
15,
16]) in RCA are preferable compared to their black-box versions to produce justified recommendations to users and mitigate potential impacts and risks induced by those recommendations. There are specific use cases (e.g., [
17,
18,
19,
20]) recently modeled by researchers in the domain of intelligent cloud applications relevant to our current study. In some related areas, such as cellular networks [
21] and cloud databases [
22], authors perform domain-specific modeling for similar problem solutions, which, in our use cases, are not readily achievable because of many factors, including a lack of labeled/annotated datasets, which are hard to obtain for cloud infrastructures. In this regard, we investigate more universal ways to build RCA models while adopting self-supervised strategies in training those models.
3. Materials and Methods for ProbRCA
As an automation solution to the resource-expensive issue of managing problems in product troubleshooting, we suggest ProbRCA, an analytics system with AI Ops that builds and maintains ML models capable of learning explainable and causative patterns (remediation rules) for alert/problem types. In the Aria Ops integration scenario, this approach can automatically check the existence of those rules and proactively provide appropriate recommendations for the resolution of a problem that is not even reported yet or reflected in the alerts stream. As a result, a user quickly obtains valuable data for comprehending the problem and its possible fix, without including additional resources and avoiding the need for time-intensive investments. ProbRCA essentially supports the pipeline in
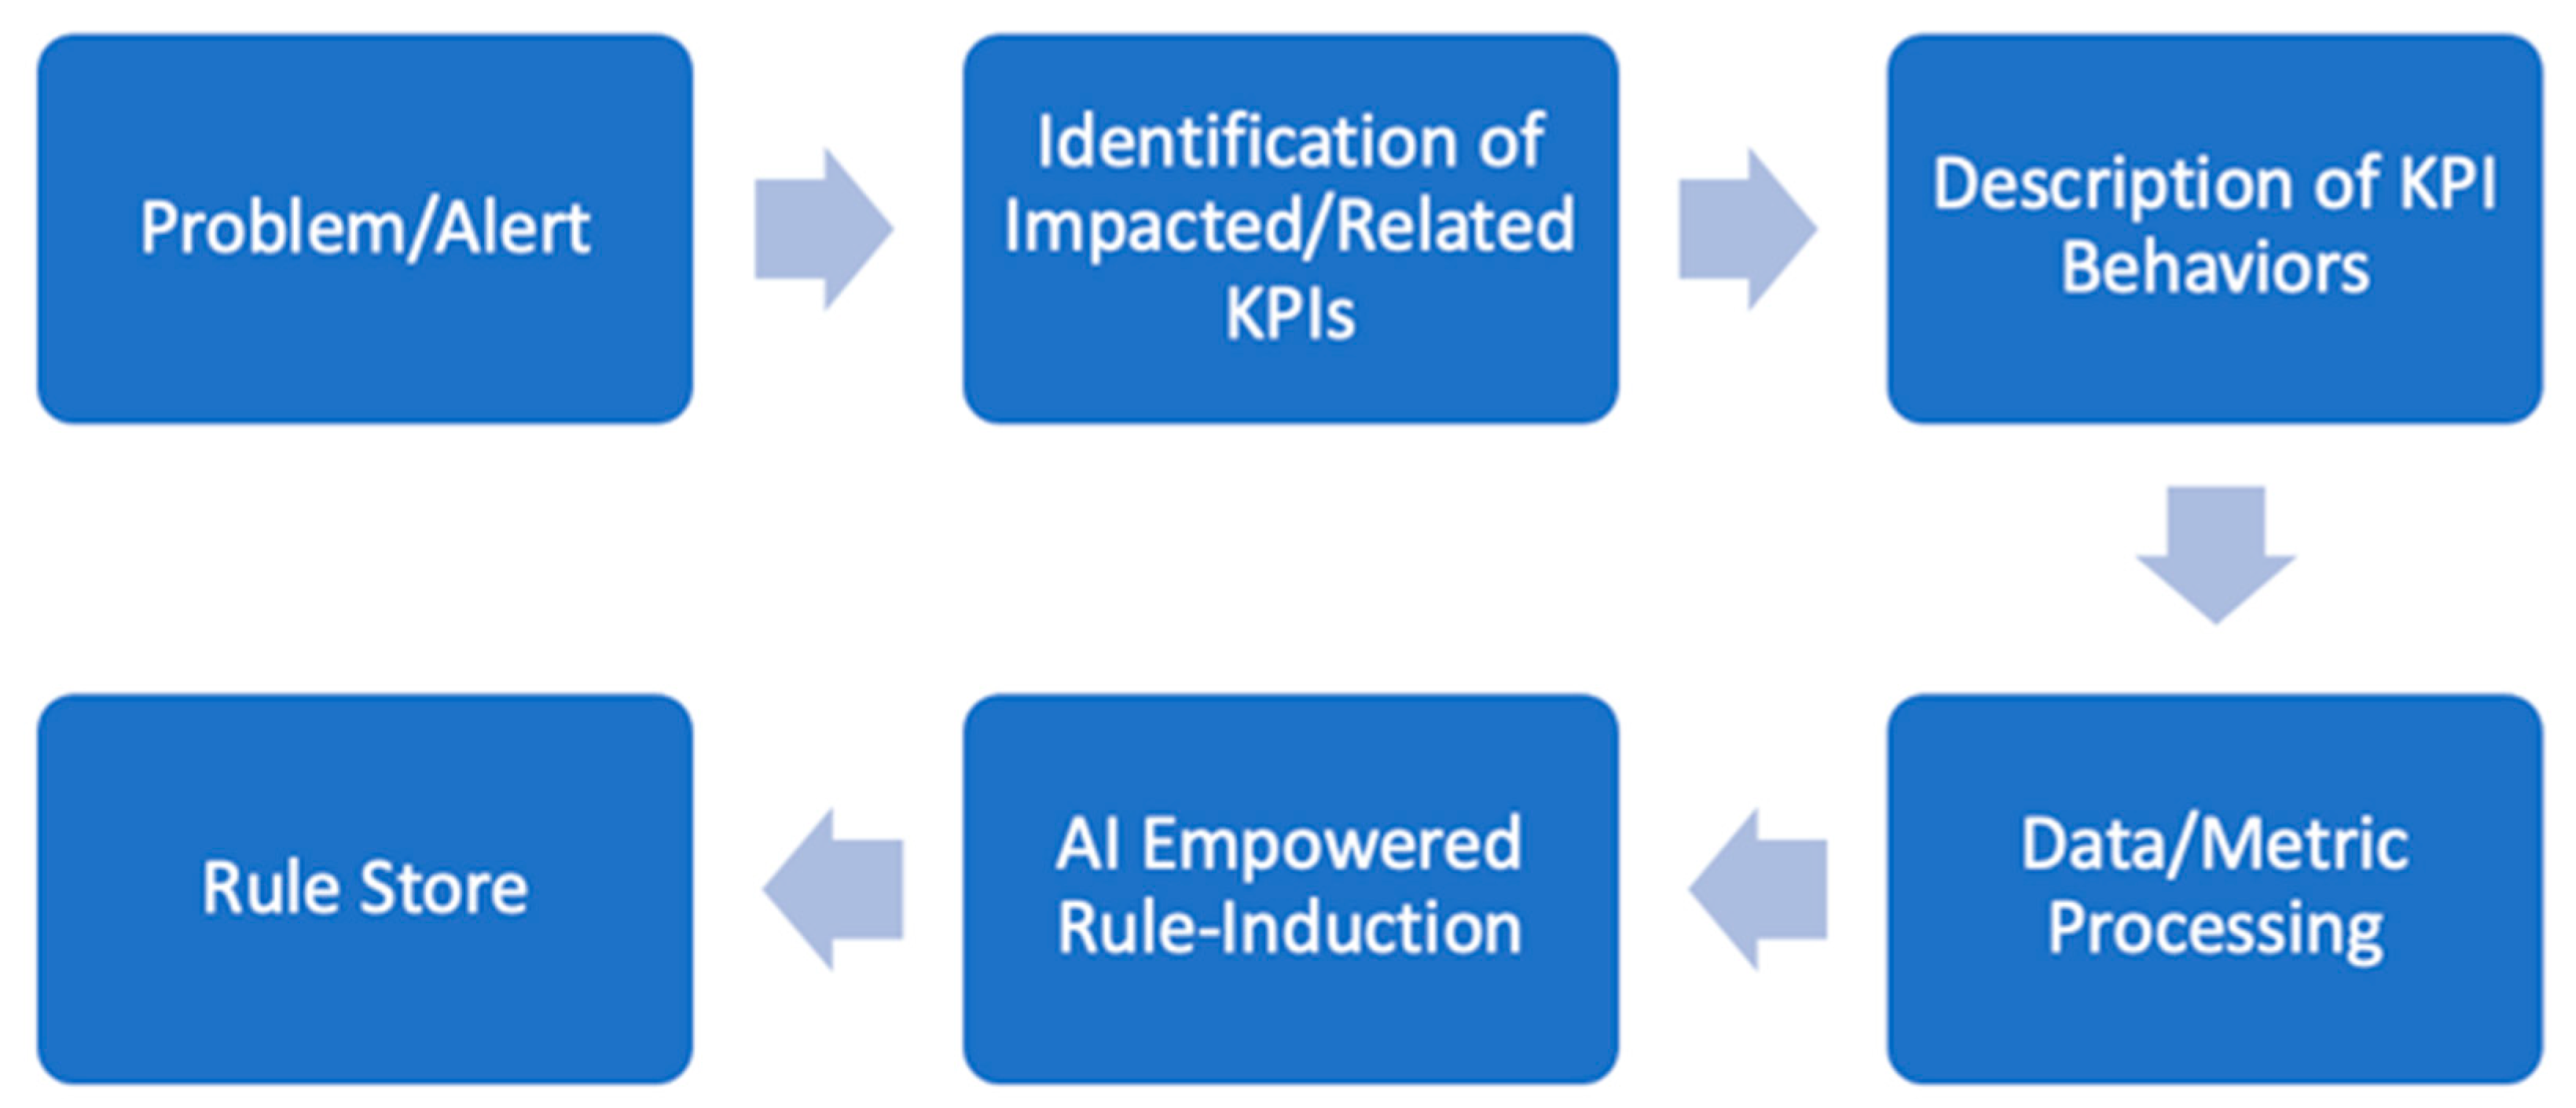
Figure 2 with the building blocks summarized in the following items (reflected in the process diagram of
Figure 3):
- a.
Aira Ops generates mission-critical alerts.
- b.
ProbRCA sets its general scope to the alert-related other impacted key performance indicators (KPIs) and their monitoring data for trainings.
- c.
Related time series metrics preprocessing, e.g., smoothing, min/max normalization, thus making the data ready for an accurate analysis.
- d.
Executing rule induction learning.
- e.
Discovered rules are added to the library of rules.
- f.
Relevant rules are tracked and recommended for alert resolution.
Within the SaaS offering model, the self-monitoring metrics for Aria Ops components are owned and managed by the provider, which means that there is a huge and extremely valuable dataset from different customers to be utilized for training the ML models underlying ProbRCA and delivering real-time troubleshooting.
However,
Figure 3 can make an expression in which our goal is to design a system that will automatically detect and remediate all types of IT issues. Unfortunately, that is not feasible in general. The same KPI degradations may correspond to totally different IT issues, especially in different customer environments.
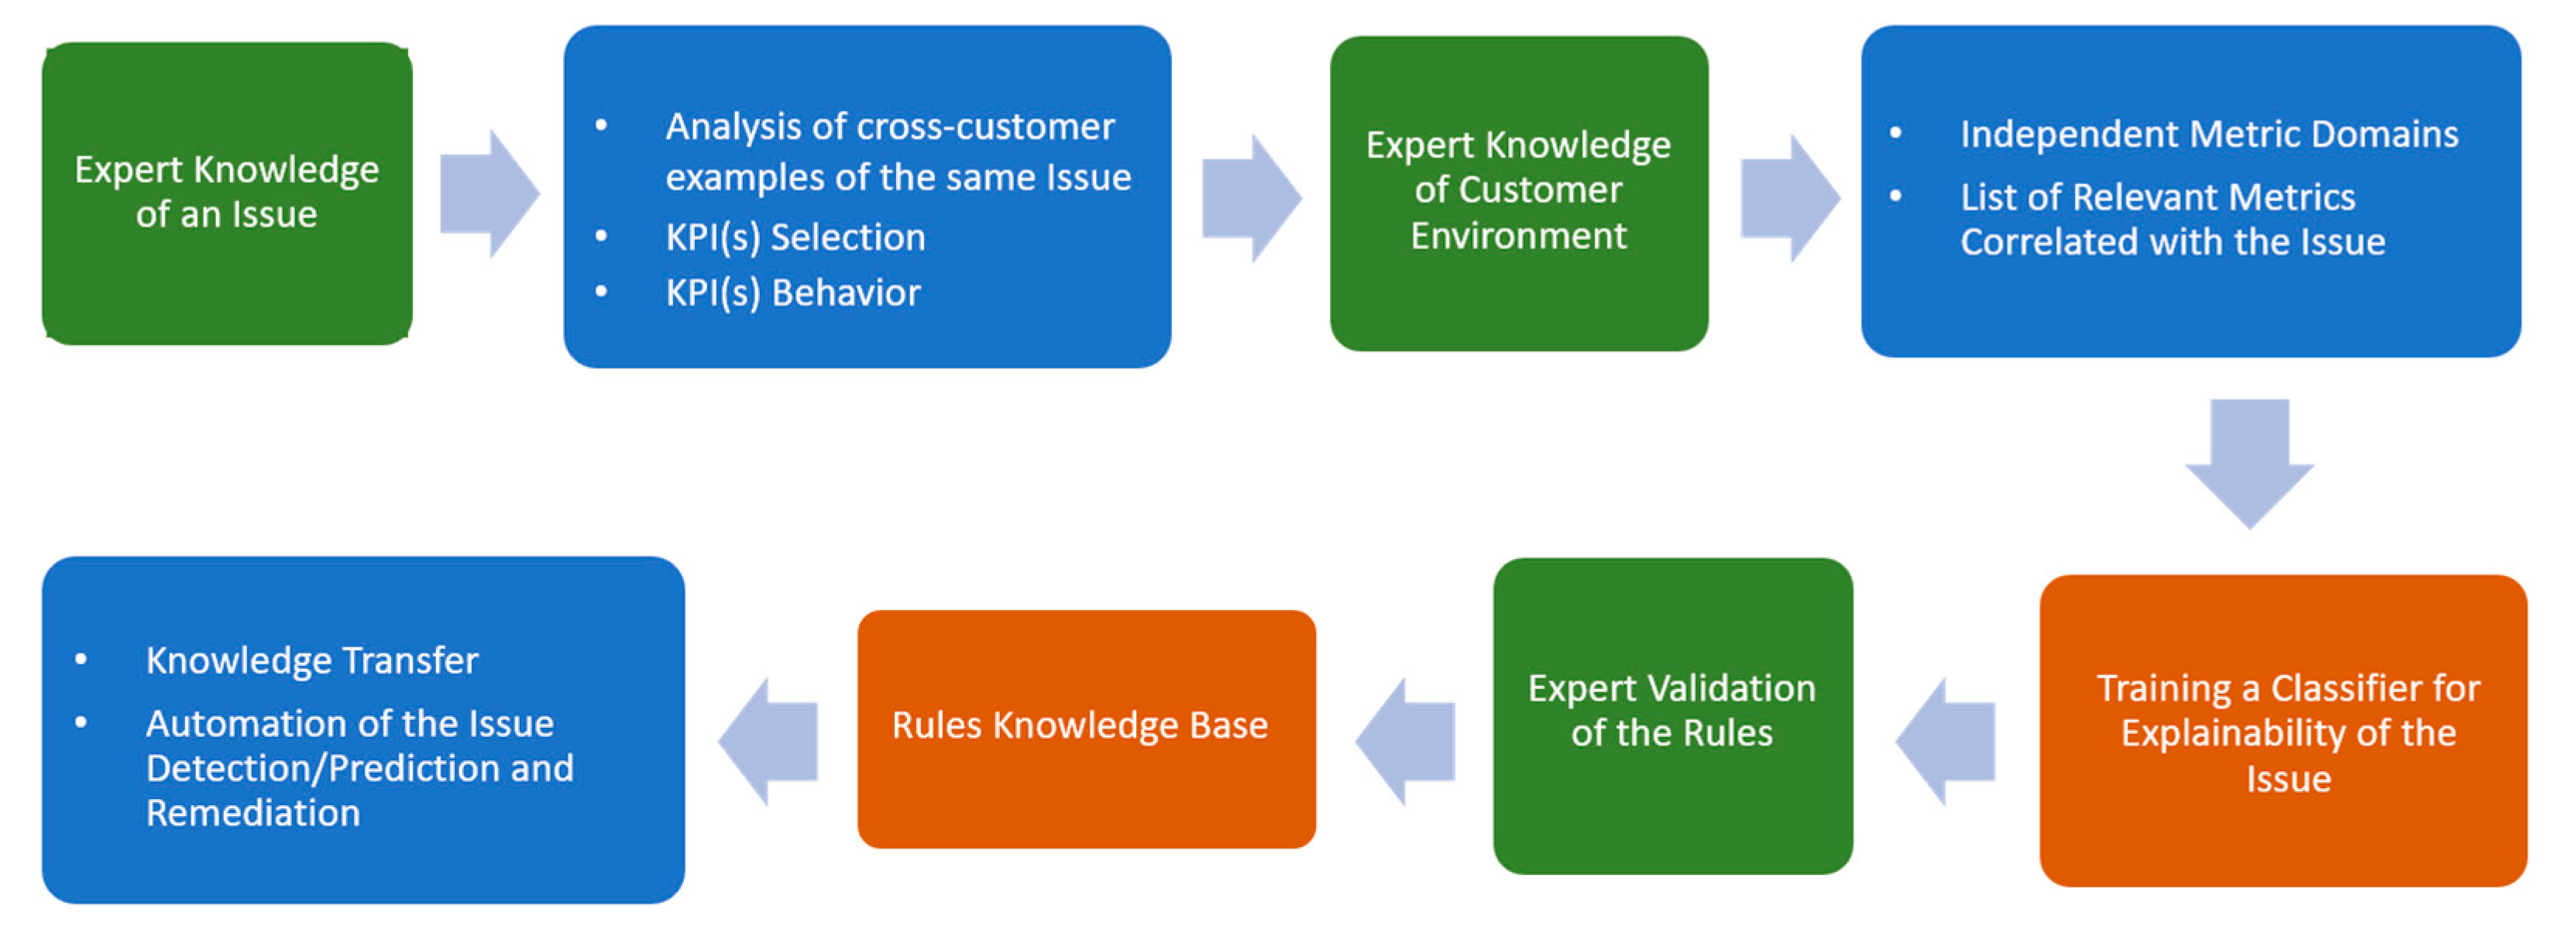
Figure 4 indicates that the main goal of our system is to generalize, explain, and store the experience of experts for a specific problem and with specific KPI behavior, and automate the process of the proactive detection of similar issues for potentially impacted customers with similar cloud environments. Our system also supports the knowledge transfer from experienced experts who worked for specific customer escalations and stores this information in Knowledge Datastores for further utilization by other specialists.
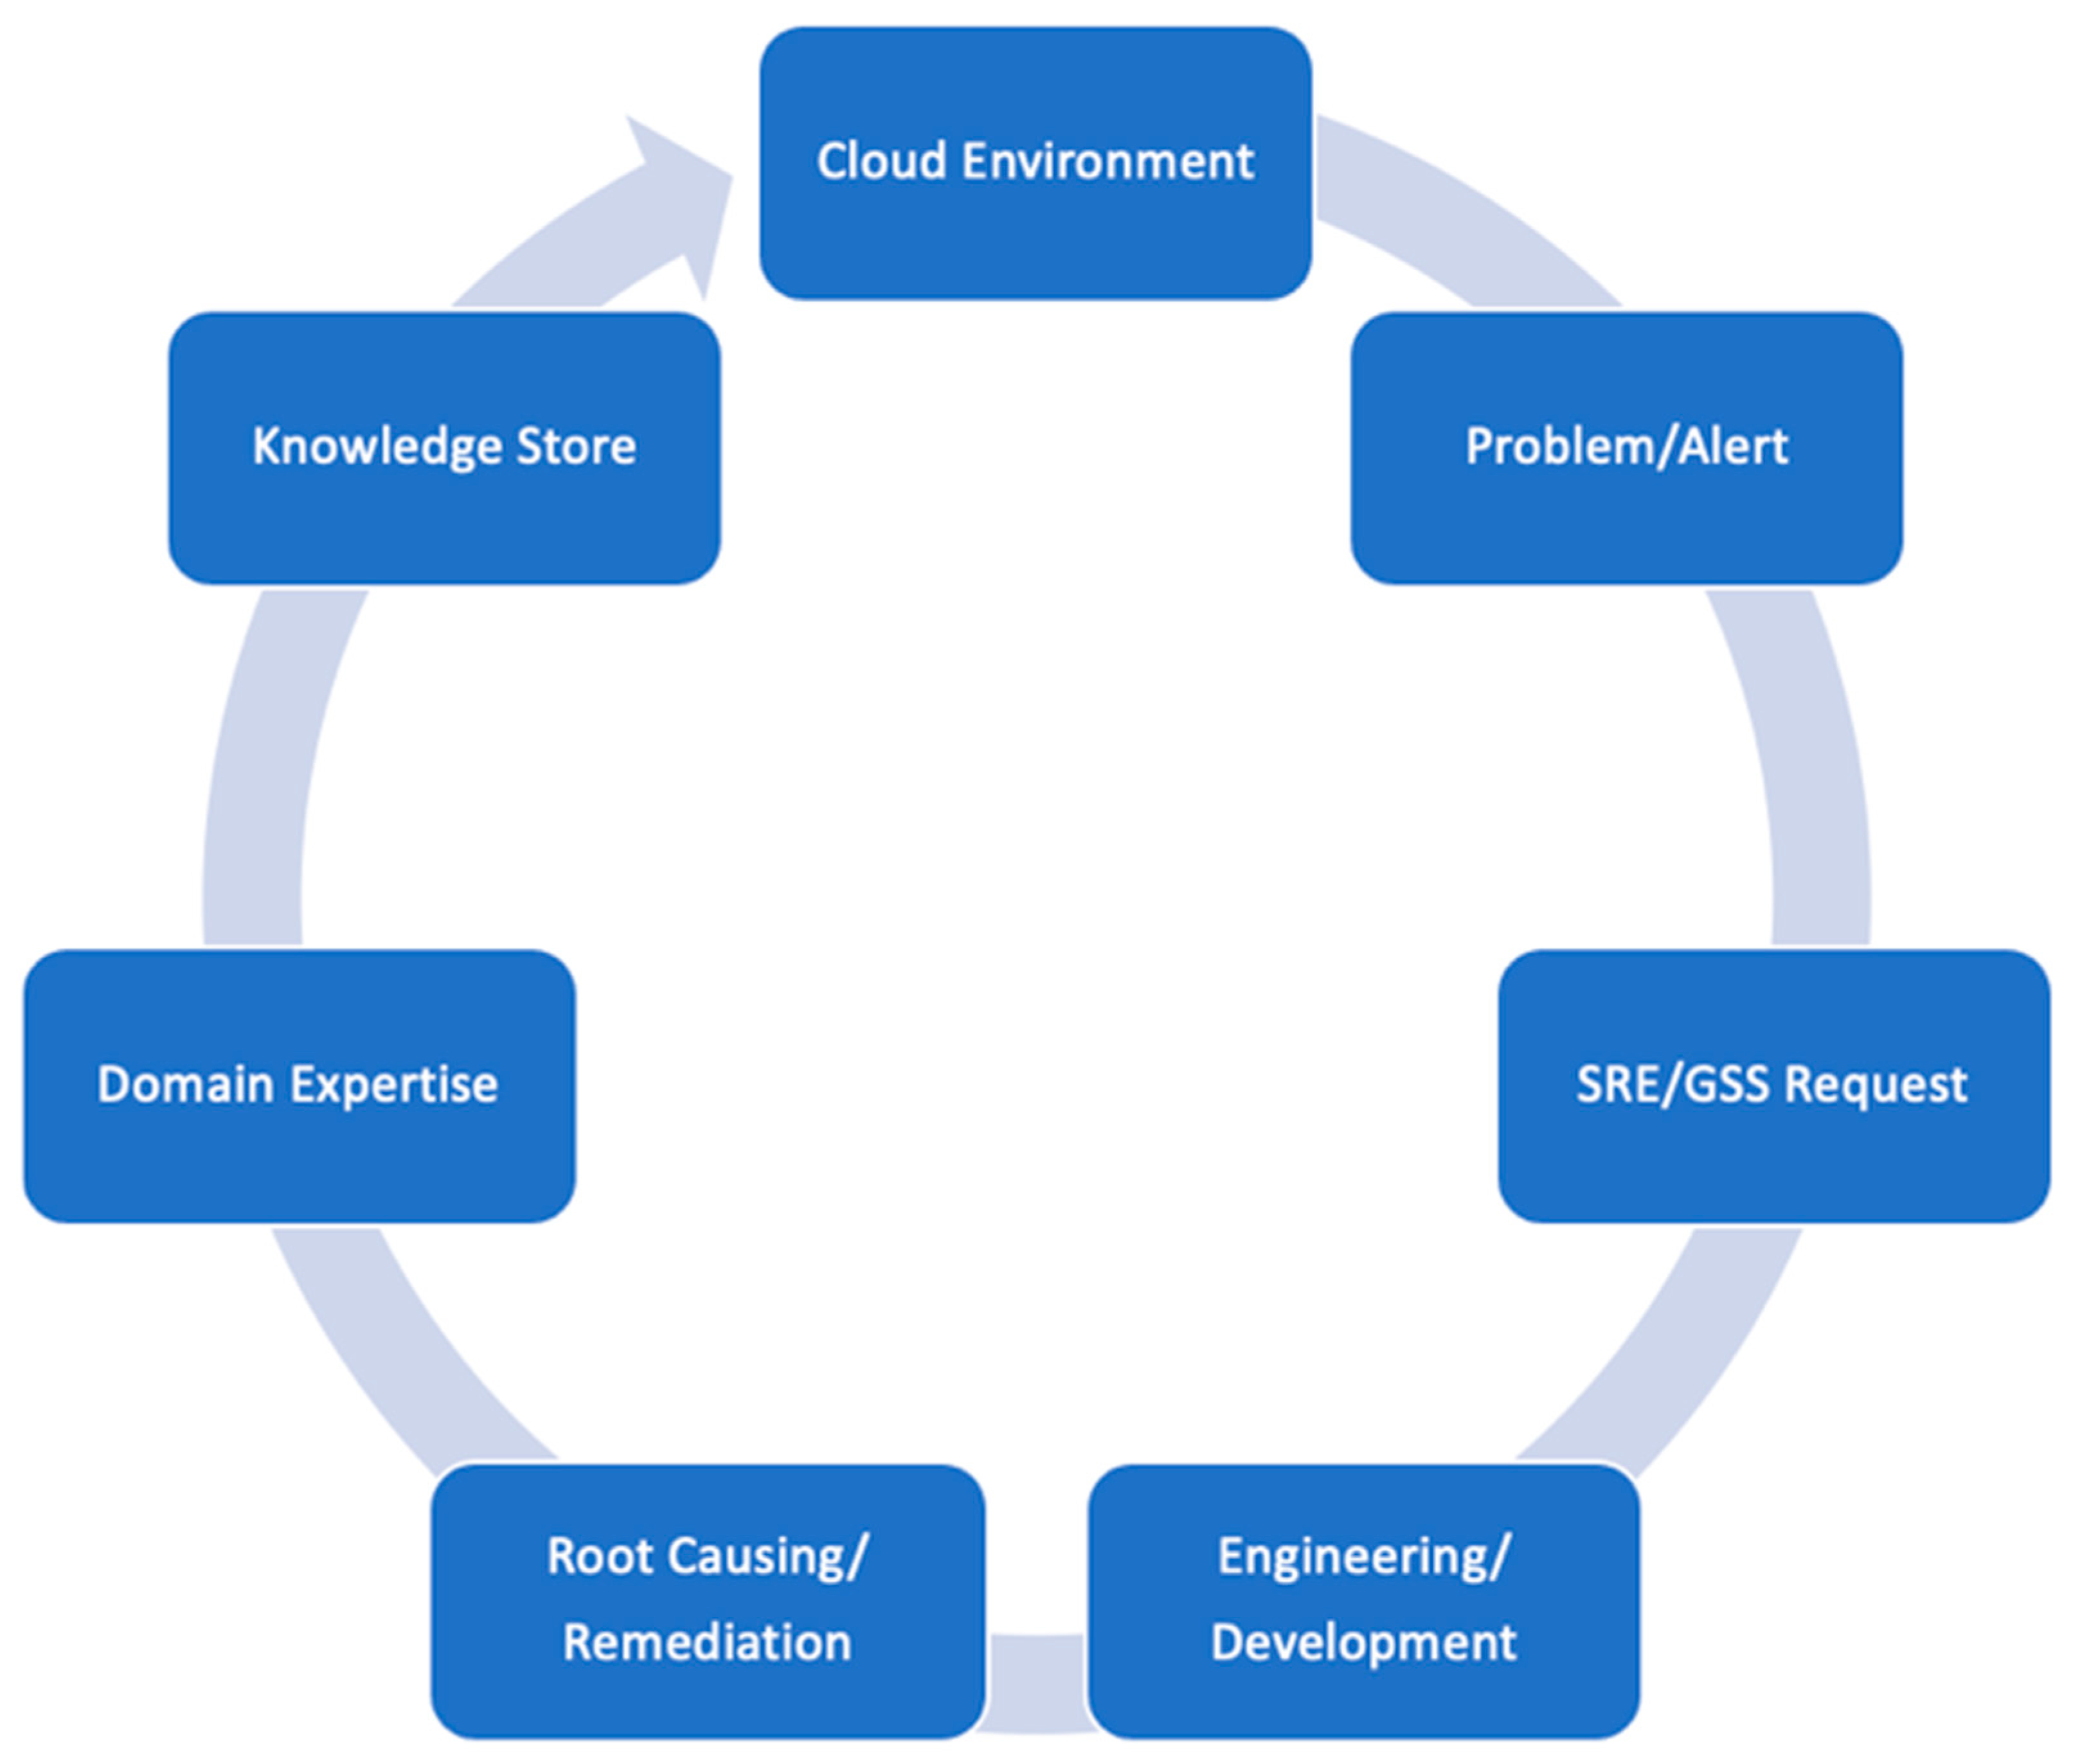
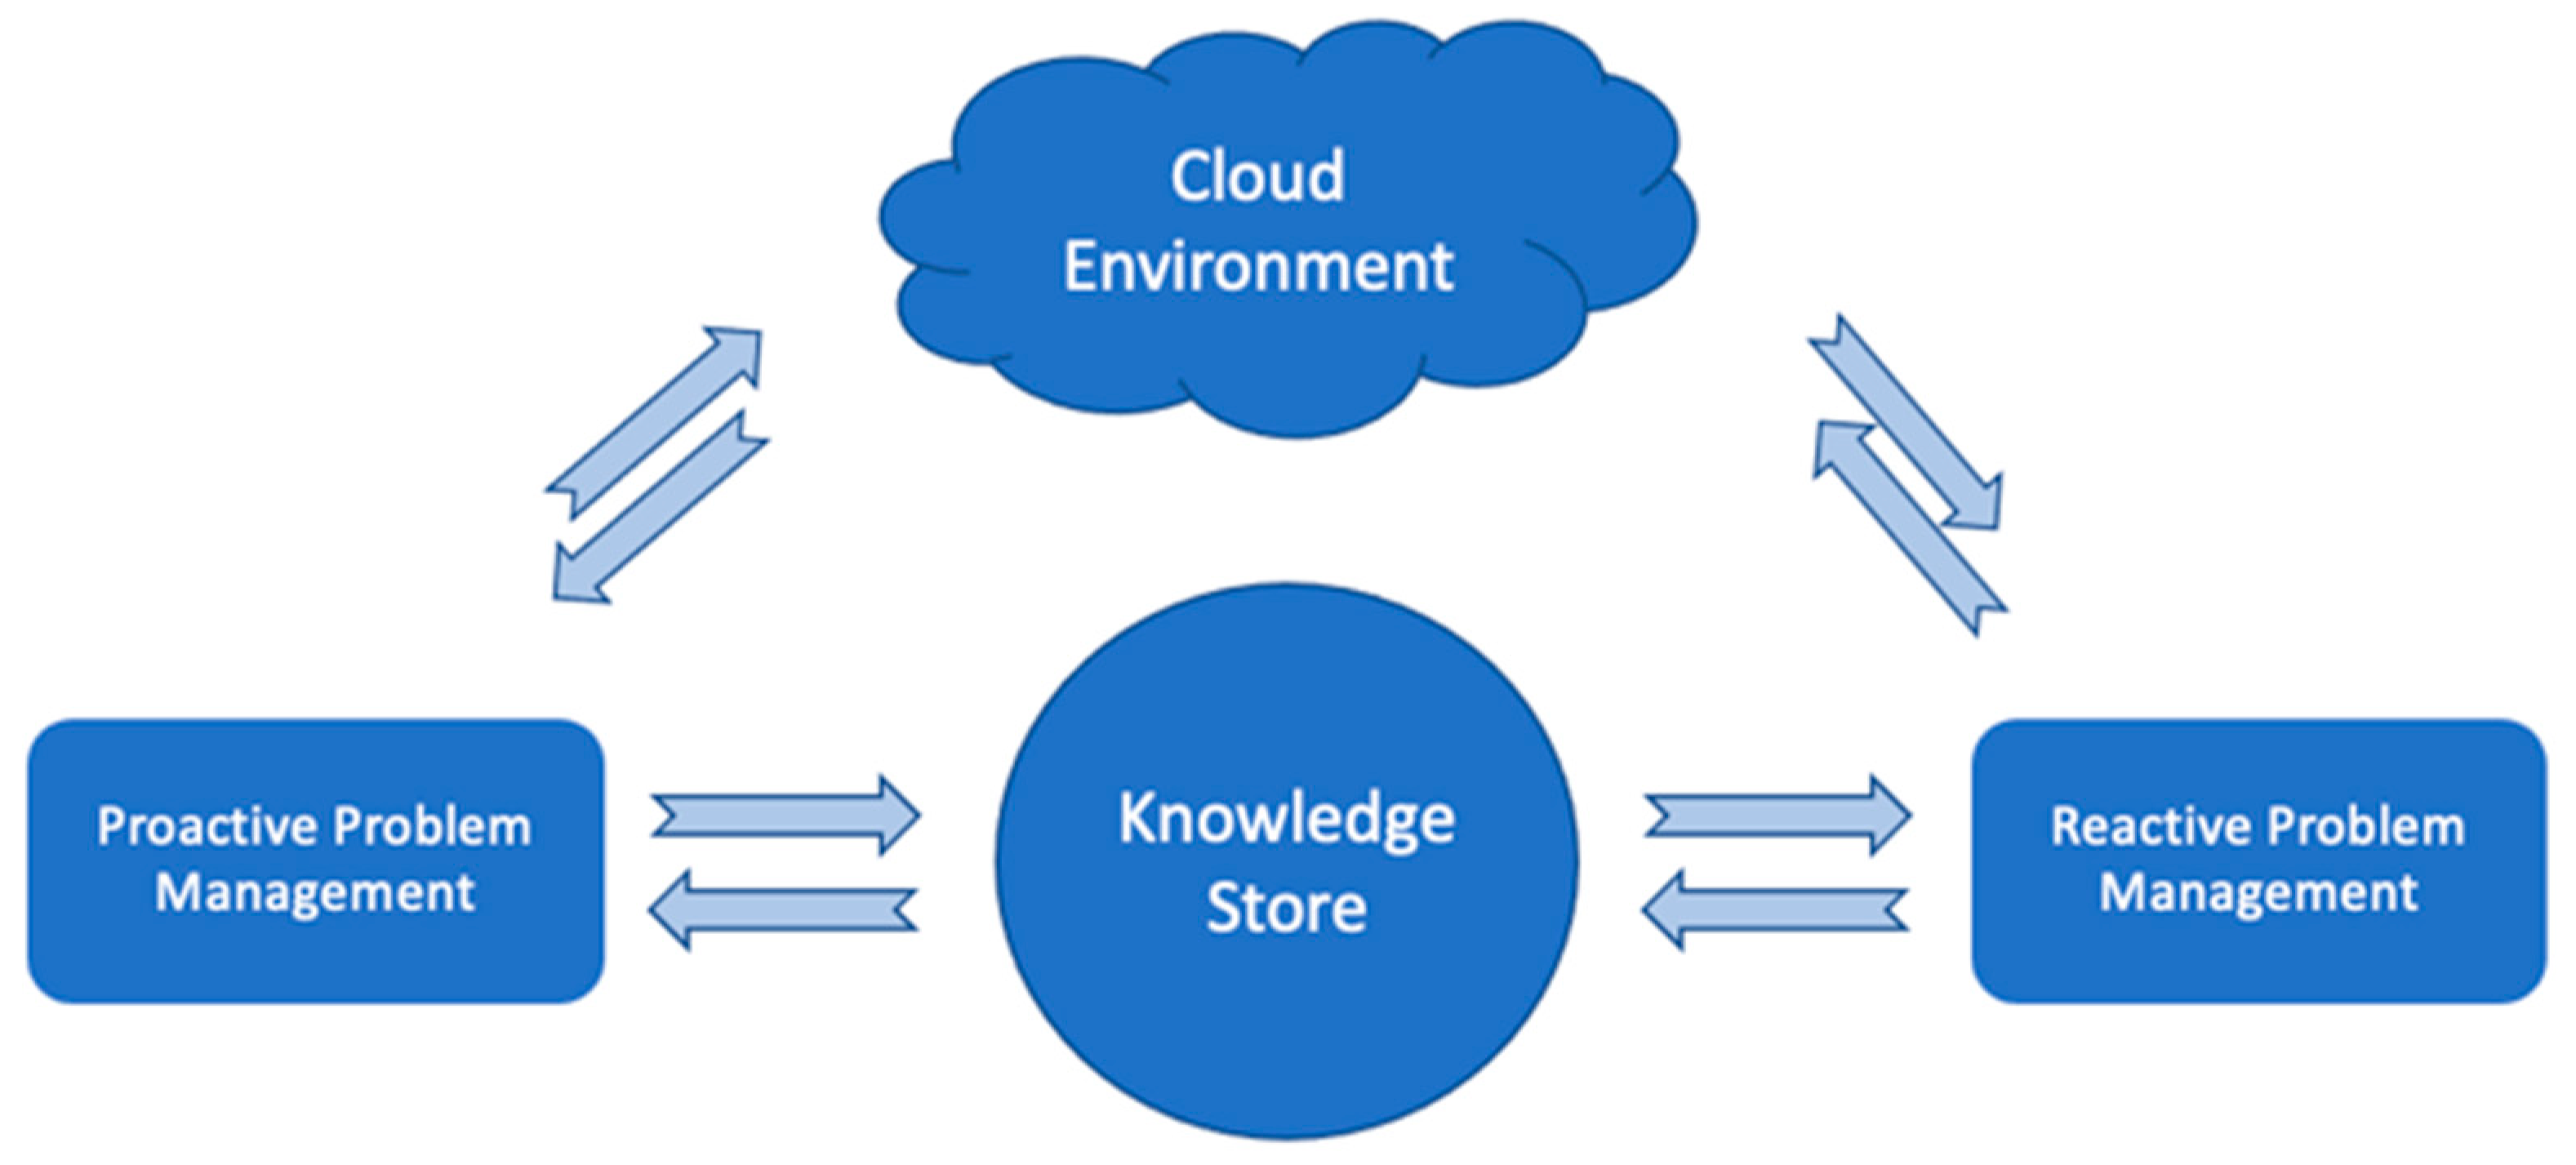
This also means that even without the most advanced AI-driven intelligence, ProbRCA may still represent problem solving, a common knowledge sharing/extraction system leveraging cross-customer insights, and a troubleshooting center relying on the basic conceptual and architectural components, as depicted in
Figure 5, where reactive and proactive problem resolution depends on the availability of relevant ML models trained on the datasets identified according to the above-mentioned items and the pipeline in
Figure 3 and
Figure 4.
Analysis of specific issues by developers at a serviced cloud eco-system with the Aria Ops management solution and the objective of finding their root causes have resulted in the following interesting lessons:
Aria Ops collects and stores data with some monitoring intervals. The traditional monitoring interval is 5 min. This means that Aria Ops averages the available values of a metric within this interval and stores them with a time stamp corresponding to the end of that interval. As a result, the average can vary from the actual value corresponding to that specific time stamp, and the difference may be very large, especially in the case of many outliers. We noticed that due to these random fluctuations, some correlated metrics are no longer detectable by the correlation analytics in Aria Ops based on the Pearson coefficient. Hence, this effect makes the correlation engine of the product unfairly useless.
This synchronization problem can only be resolved by the application of proper data-smoothing techniques. In our experiments, we apply a well-known min–max smoothing technique that Aria Ops uses in UI for visualizing many data points on a small window. It takes a time window (say, 6 h), finds the minimum and maximum values of a metric, and puts them in the middle and at the end of that interval in the same order as they appeared in that interval. For example, if the minimum occurred earlier than the maximum, then the value of the minimum should be put in the middle and the value of the maximum at the end. Then, it shifts the window by 6 h and reiterates the procedure until the end of the metric.
Aria Ops collects a vast number of metrics from cloud infrastructures and a number of self-generated metrics constructed by domain experts. The final monitored datasets contain thousands of metrics with highly correlated subsets describing the same process. As a result, the metric correlation engine, or TW, can detect hundreds of other metrics with the same behavior. However, it will be very hard to separate the metrics that describe the same process from the metrics related to different ones for the detection of possible causations. This problem can be resolved only by users with some expertise. They need to manually separate the possible domains of interrelations and skip analysis within the same areas. That is why we work separately with three different datasets below, thus manually decreasing the total number of possible correlations.
Alerts/alarms are another source of uncertainty in Aria Ops. Many alerts are not directly connected to a problem, as user-defined ones are not always sufficiently indicative. Conversely, many problems have appeared without proper alert generation. In our example below, the problem is not connected to a known alert–the “Remote Collector Down” metric does not trigger any alert due to its fast oscillations. We found that a problem analysis always starts from the corresponding KPI and its behavior. Even if the problem description starts from an alert, the set of appropriate KPI metrics should be identified and described.
Finally, as we mentioned before, the expert knowledge of Aria Ops engineers remains hidden in internal departments among a small number of specialists. As a rule, this knowledge is not systemized, not shared appropriately, and cannot be used for consistent and proactive management or a fast resolution of similar issues, especially in cross-customer mode.
4. Trending Problem Scenarios
Let us describe a specific trending problem for a period that has impacted many user environments (within several weeks, leading to multiple customer excavations):
Customers did not configure their firewall for Aria Ops Cloud Proxy [
23] properly, which means ensuring outgoing traffic to various sub-services.
vR Ops Cloud Proxy is a primary component for data collection. In the case of the SaaS offering, it is the only appliance deployed in the customer environments and the only means of data collection. Because of this, over time, a big set of different functionalities were added to it. All this means is that whenever there is a problem with Cloud Proxy-to-vR Ops cluster communication, the data collection, alerts stream, etc., are all stopped to be serviced; in other words, vR Ops actually is not available.
Cloud Proxy basically contains two major services: the collector service, which is responsible for the collection of data from the endpoints and sending them to the vR Ops cluster, and CaSA (cluster and slice administration), which is responsible for the management of the Cloud Proxy, i.e., initial deployment, upgrade, configuration, etc. For both, as well as for the CP VM, vR Ops collects self-monitoring metrics. All the communication from Cloud Proxy to the vR Ops cluster goes out from HAproxy.
From the engineers’ experience, whenever there is a problem on the customer side, e.g., deployment was not performed properly, or the network and firewall were not configured properly, tremendous efforts are required to root out the cause of the situation and validate the resolution. This is especially true in cases related to the firewall, as they require the involvement of different departments and third parties, the customer’s network team, the security team, the firewall support team, and development. This results in exhausting communication back and forth and time-consuming activities. We omit listing here SRs that provide evidence for this and contain private information.
In all these cases, the situation is rather simple. It takes time until a customer notices the issue. Then GSS becomes involved, and later, developers join the investigations. Finally, it becomes clear that the cause is the customer’s firewall configuration. In the best case, according to our SRE partners’ estimate, it takes a week to identify and fix it, but there were cases when it took longer. Additionally, it requires much effort to prove and convince the customer that the problem is not vR Ops-related. This is a common story in practice. Furthermore, in all these cases, Cloud Proxy goes down periodically, and the cloud proxies deployed within the same network and firewall act with the same periodicity. Another observation is that a service can have issues sending the data to the vR Ops cluster in the case of a product bug. In this use case scenario, the developer’s investigations lead to the discovery of a common sequence of patterns:
- a.
An issue with the collector service in the cloud proxy is reported;
- b.
The CaSA service is also not sending self-metrics;
- c.
However, whenever the cluster starts receiving (self-monitoring) metrics data, it is found that the cloud proxy VM was not down during the span of the issue;
- d.
These patterns happen periodically and synchronously.
It is then becoming clear that the problem is network-/firewall-related. We collected datasets on the problem instances of cloud proxy failures detailed above to train and validate interpretable ML algorithms capable of discovering the conditions or causes of those failures (which are already established by the developers as the ground truth of such poor performance).
5. Experiments and Discussions
According to the system diagram of ProbRCA, we conducted initial research on the above-mentioned trending problem and related identification of impacted KPIs. The status of cloud proxy down was chosen. We identified the periodicity and the same behavior for the KPI metrics in case cloud proxies share the same network and firewall. Later, we identified components that can be useful to include in our analysis with their self-monitoring metrics (i.e., collector, CaSA, and Cloud Proxy).
5.1. Data
We utilize three different datasets synchronized by the time stamps. The first dataset contains the metrics from CaSA. It has 36 metrics (columns) and 7530 metric values (rows) with a 5 min monitoring interval. Some of the metrics are “API Calls Avg Response Time”, “Free Physical Memory”, “Garbage Collector PS Scavenge Collection Time”, “Max Heap Size”, and “System Attributes Original Total Alert Count”.
The second dataset contains the metrics of the collector, with 138 columns and 7530 rows (5 min monitoring interval). Engineers removed some of the redundant metrics. This dataset is composed of metrics such as “Control To Collector Task Action Status Elapsed Time Summary”, “Controller To Collector Perform Action Tasks Receive”, “Collector To Controller Get Adapter Ids Elapsed Time Summary”.
The third dataset is a collection of cloud proxy metrics with 151 columns and 7530 rows (5 min monitoring interval). Some of the names of metrics are “Net TCP CP Close Wait”, “Data Receiving Status”, “Disk File System Storage DB Files Free”, “Disk File System Write Bytes”, “Net All Inbound Total”.
5.2. Specific Results
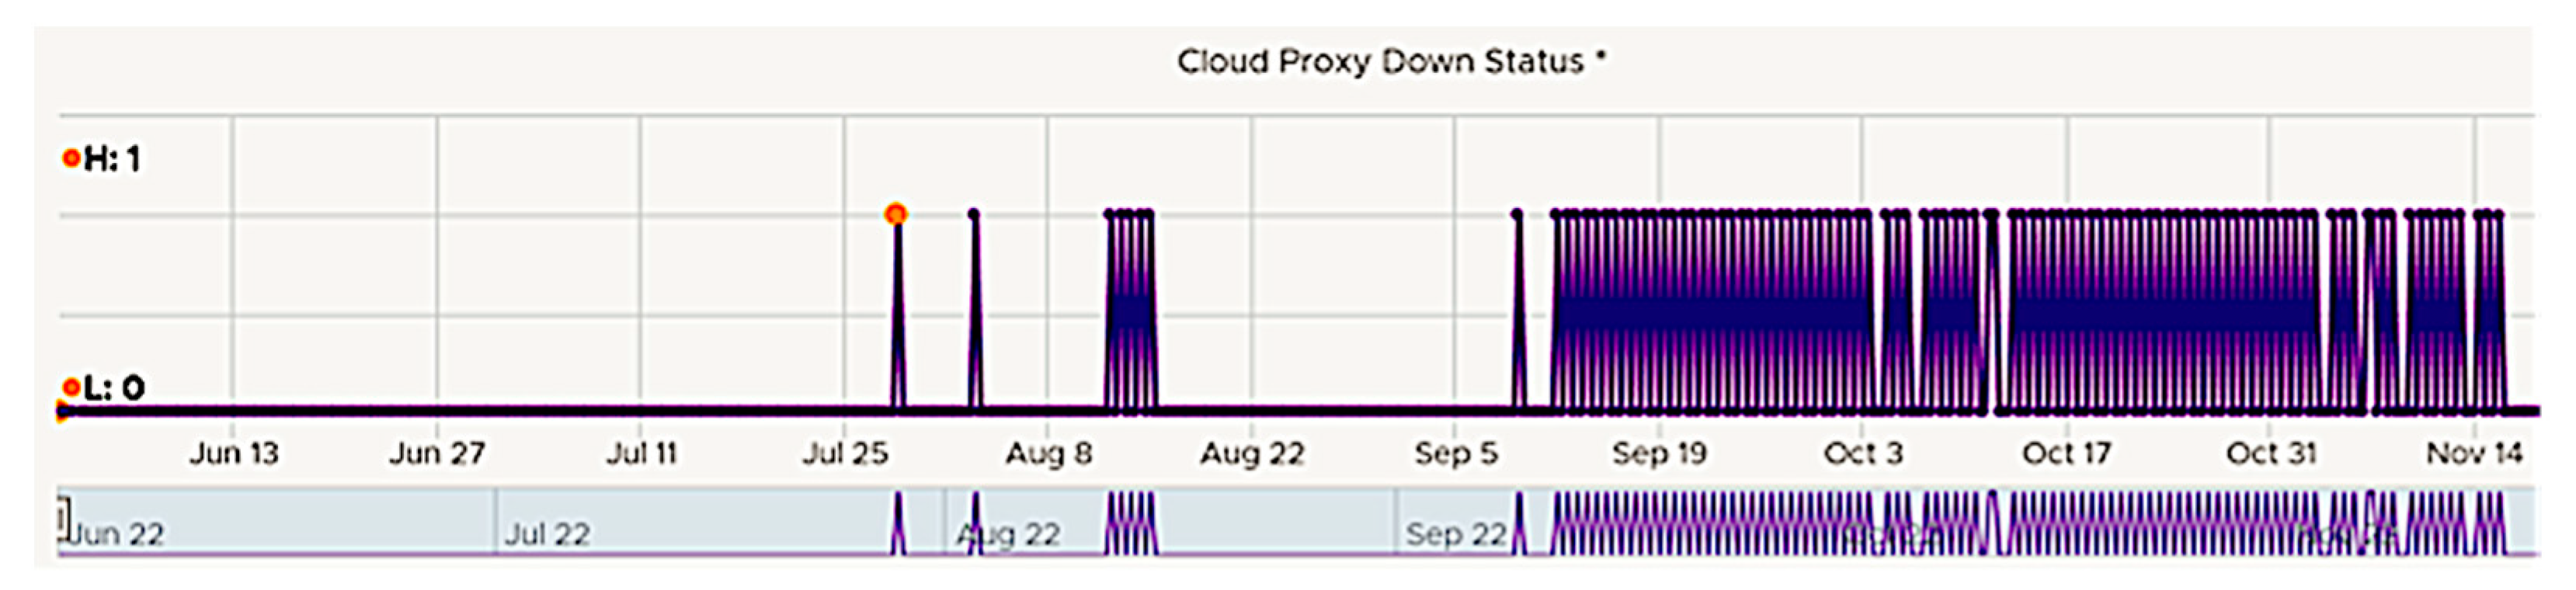
According to our general planning, we start with identifying the KPI. For this specific problem, the corresponding alert is missing, but the “Remote Collector Down” KPI has a typical behavior shown in
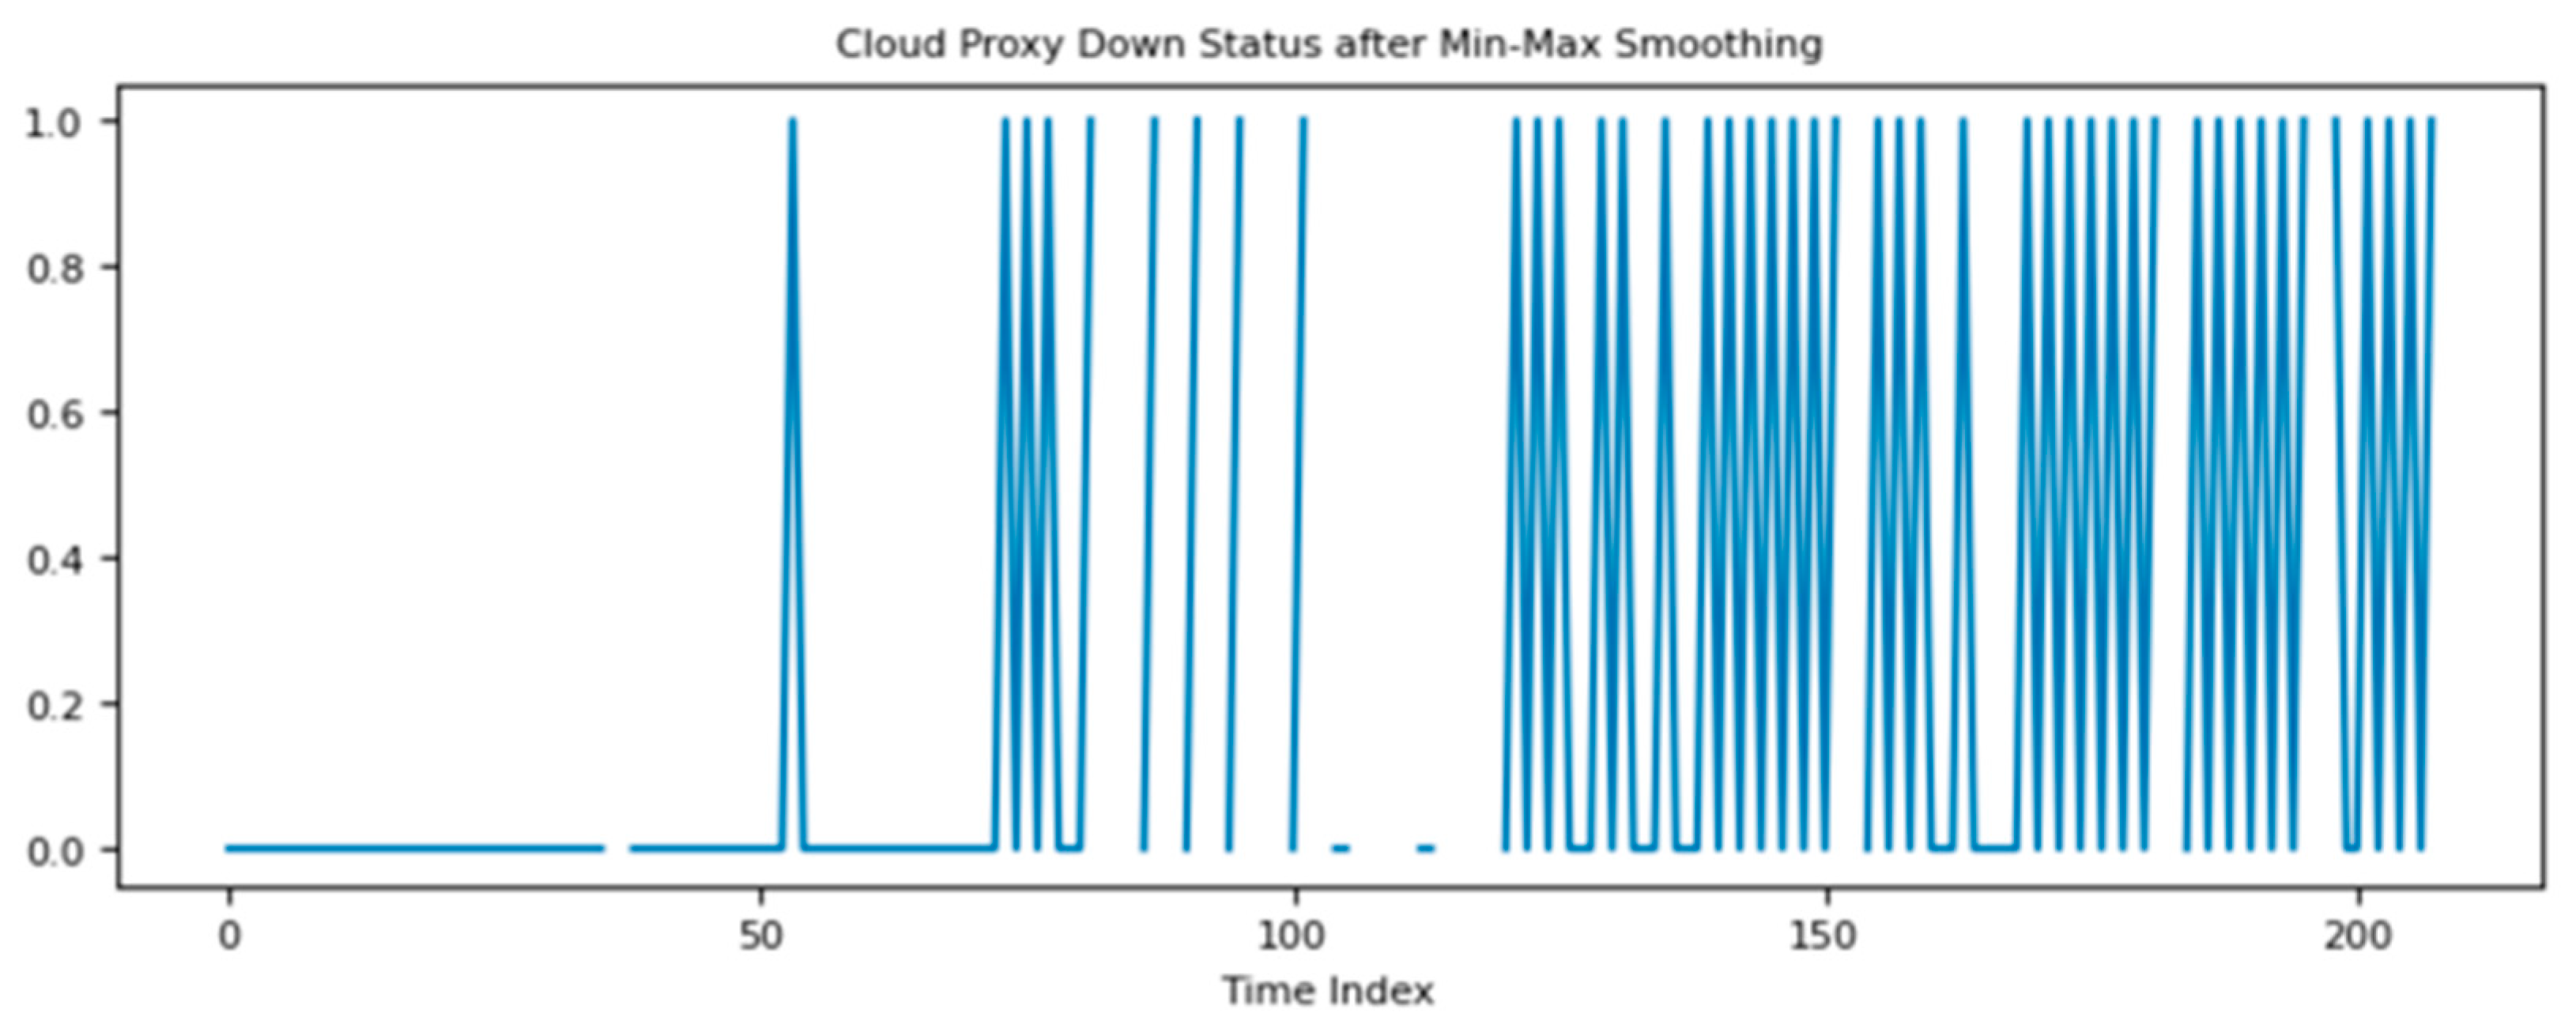
Figure 6. It started to oscillate, going up and down rather frequently, indicating a problem. The same behavior of the same KPI has been detected for a series of customers with totally independent cloud environments. We apply min–max smoothing with a 6 h time interval before applying more intelligent solutions.
Figure 7 confirms the oscillating behavior of the KPI after the smoothing. It reduces the number of metric values from 7530 to 208.
We separately analyze connections between the KPI and other indicative metrics for CaSA, collector, and Cloud Proxy. Since our research focuses on interpretable ML strategies, we apply the classification rule-induction system RIPPER (see the related literature [
24,
25]), which reveals rules containing the names of important metrics with some thresholds combined in conditions. The labeling of datasets is performed via the values of KPI (labels = 0, 1), where label = 1 indicates the “down” status of the cloud proxy. We detected 44 down conditions from 208 available data points.
Applying RIPPER to the CaSA dataset exposed the following rule (Rule 1):
The fraction at the end of the rule characterizes the importance. The number 23 shows how often the rule has been fired, and the denominator indicates the number of misclassifications. The coverage of the rule is
and the accuracy is
Applying RIPPER to the collector dataset detects the second rule (Rule 2):
This rule has 84% coverage and 88% confidence.
Applying RIPPER to the Cloud Proxy dataset returns the third rule (Rule 3):
which has 86% coverage and 80% accuracy.
These rules and the KPI’s specific behavior can be stored as the knowledge that can be used to identify and quickly resolve similar issues. Aria Ops engineers have verified Rules 1–3, which, in combination, indicate firewall problems.
5.3. Experimental Setup
The explainability of predictions (KPI = Up/Down) is critically important for systems owned/managed by experts. AI recommendations must be transparent and trusted, allowing experts to validate and adopt the solutions. Explainable AI (XAI) has many powerful methods with internal (built-in) and external interpretability capabilities. These can reveal the important set of features and sometimes also unveil the ranges of those features, providing a more detailed understanding of specific predictions. These recommendations, given as a set of rules, are known to provide the highest level of explainability that can be easily consumed by domain experts. Modern rule-learning methods contain several powerful classifiers. Two well-known classical approaches known as C5 rules and RIPPER are the state-of-the-art rule induction. RIPPER is especially powerful for large and noisy datasets as it scales linearly with the number of observations. However, we can equally apply both approaches as our datasets are rather small. In those cases, they show similar performance. The selection of RIPPER is simply connected with its efficient implementation in WEKA 3 machine learning software (
https://www.cs.waikato.ac.nz/ml/weka/, accessed on 29 November 2023). The corresponding implementation is known as JRip (Java RIPPER).
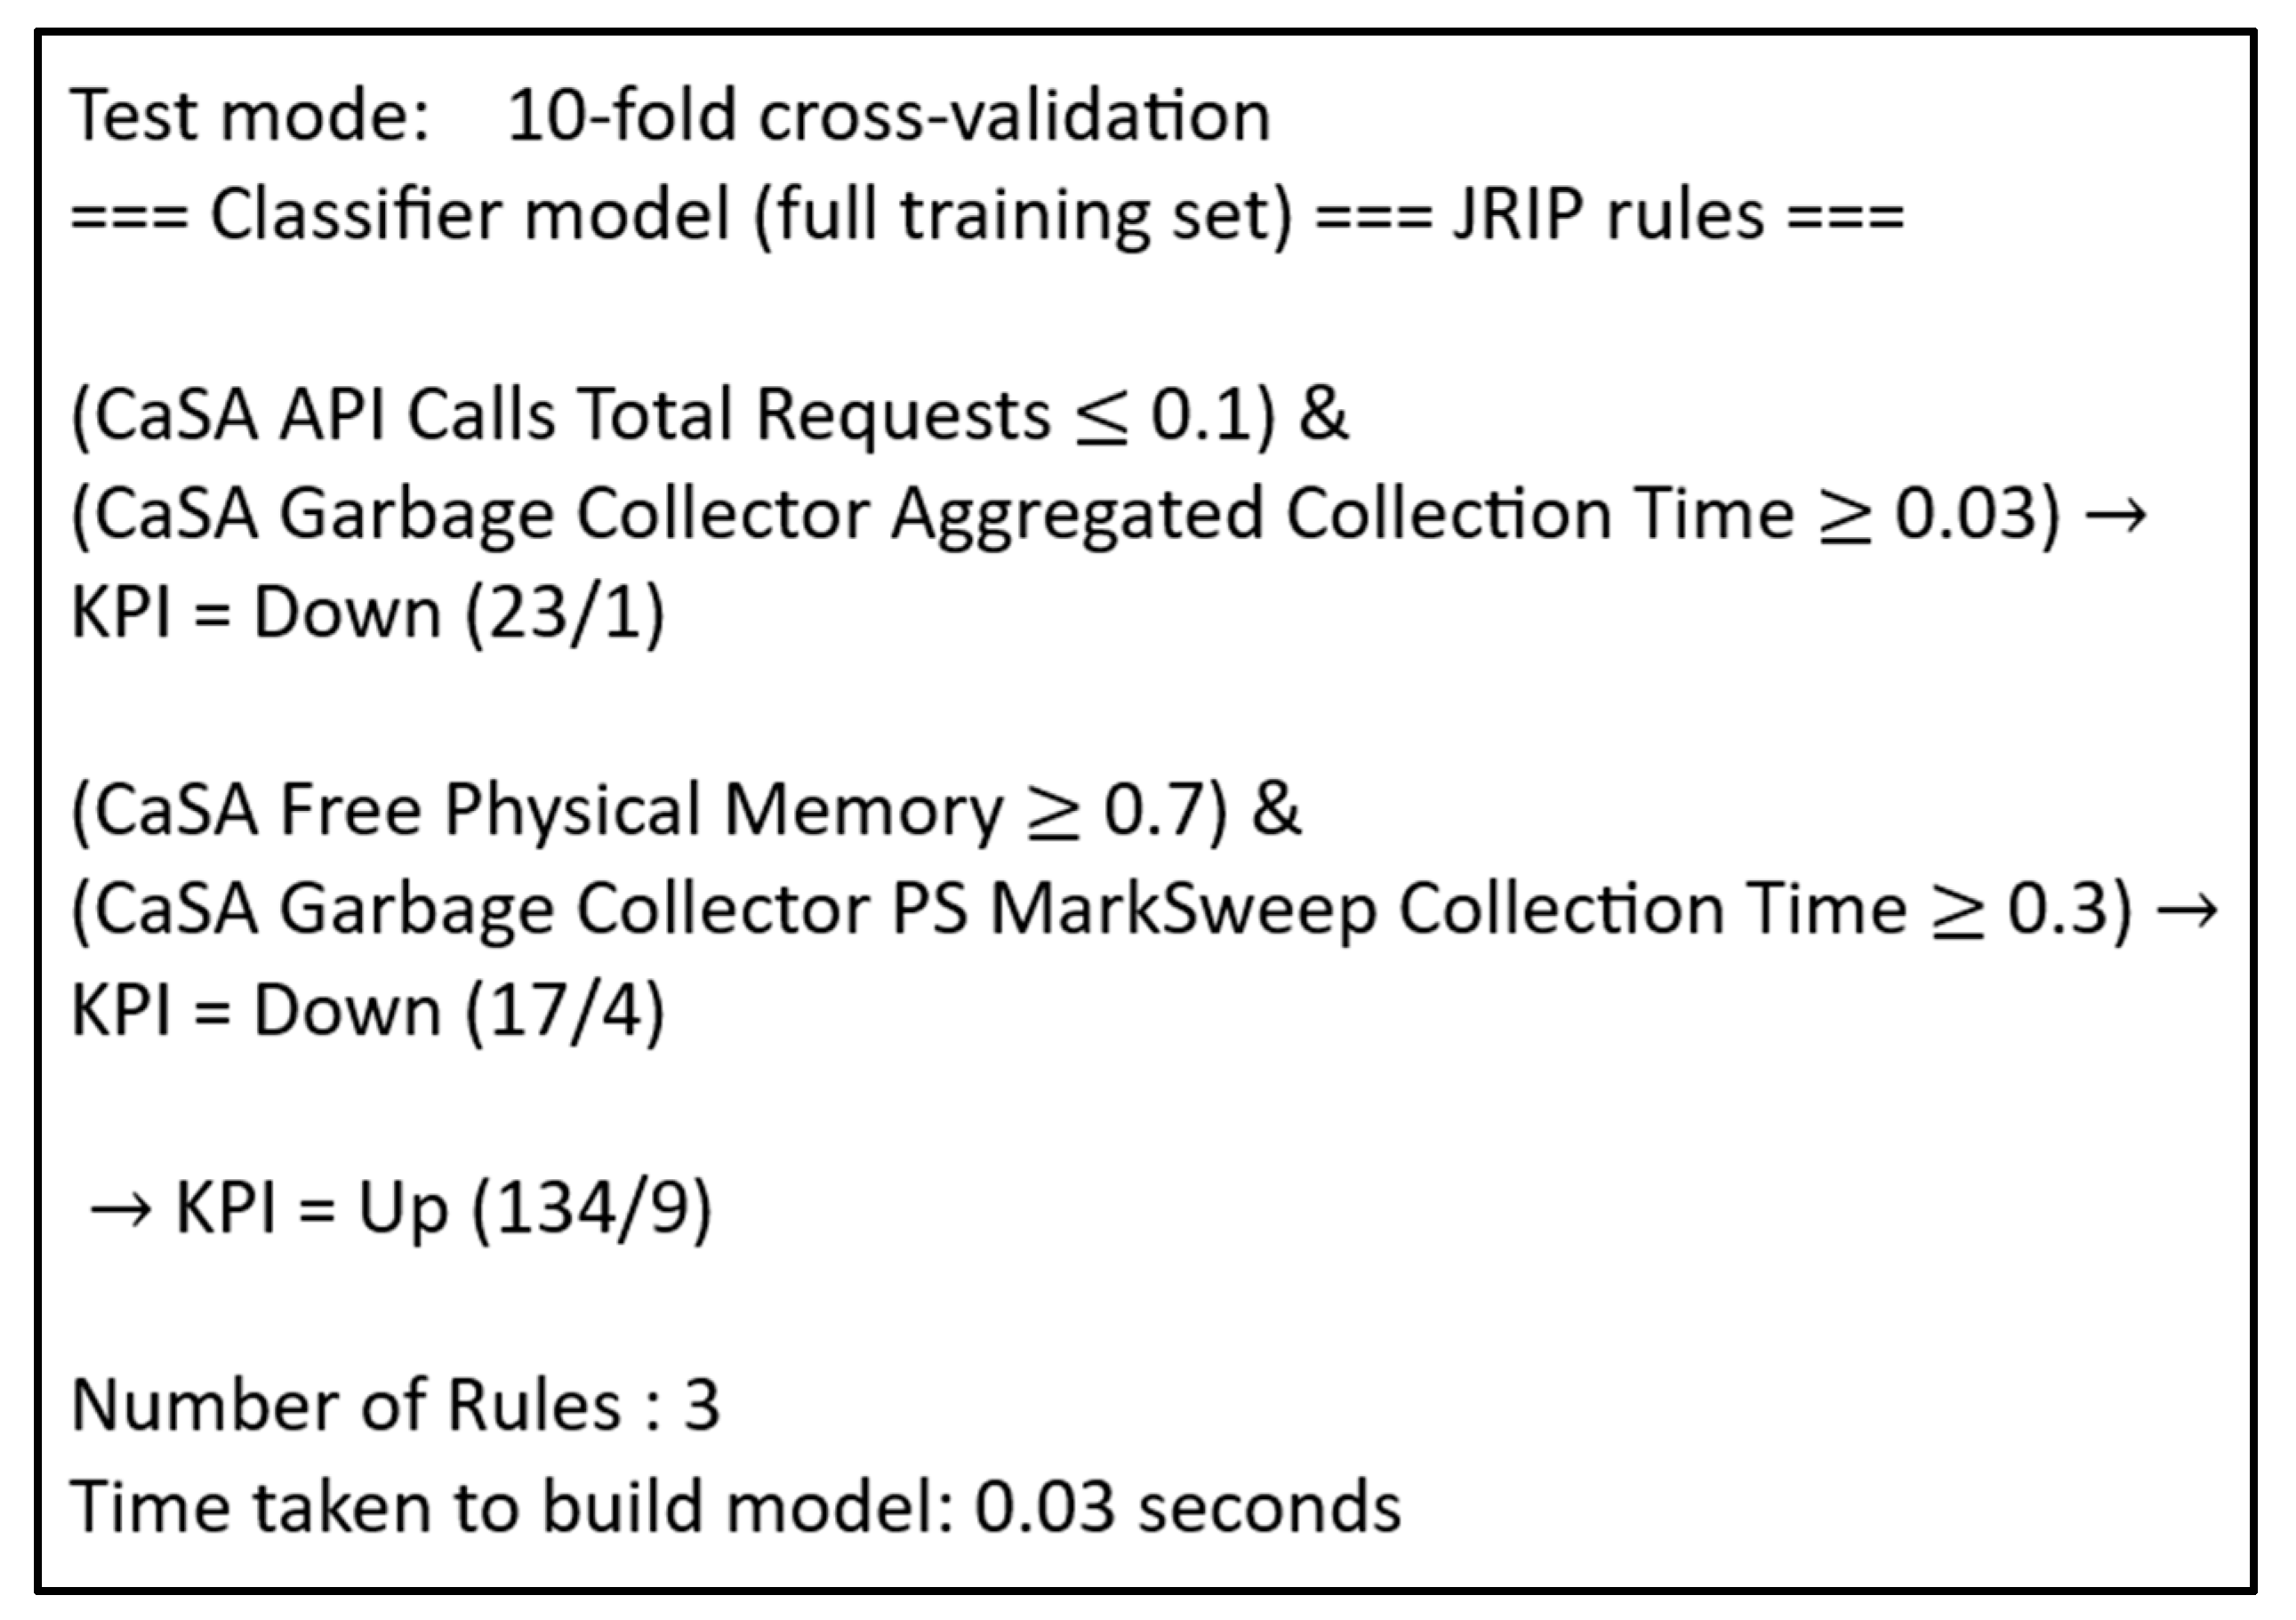
Let us show how JRip provides the recommendations. We apply it to the first dataset (CaSA) and obtain a set of rules, as in
Figure 8. The first two rules explain the positive class (KPI is Down), and the final one labels all the remaining observations from the negative class (KPI is Up). RIPPER rules have hierarchical importance. The first has the largest coverage. After removing the observations (negative and positive) that fire the first rule, we can use the second rule to explain the labels of the remaining instances. Then, we remove the observations that fire the second rule, and all the remaining instances are labeled from the negative class. Our experiments showed only the first rules, although the others can be stored as relevant. We see that RIPPER is very fast for such small datasets. It generated those three rules in 0.03 s.
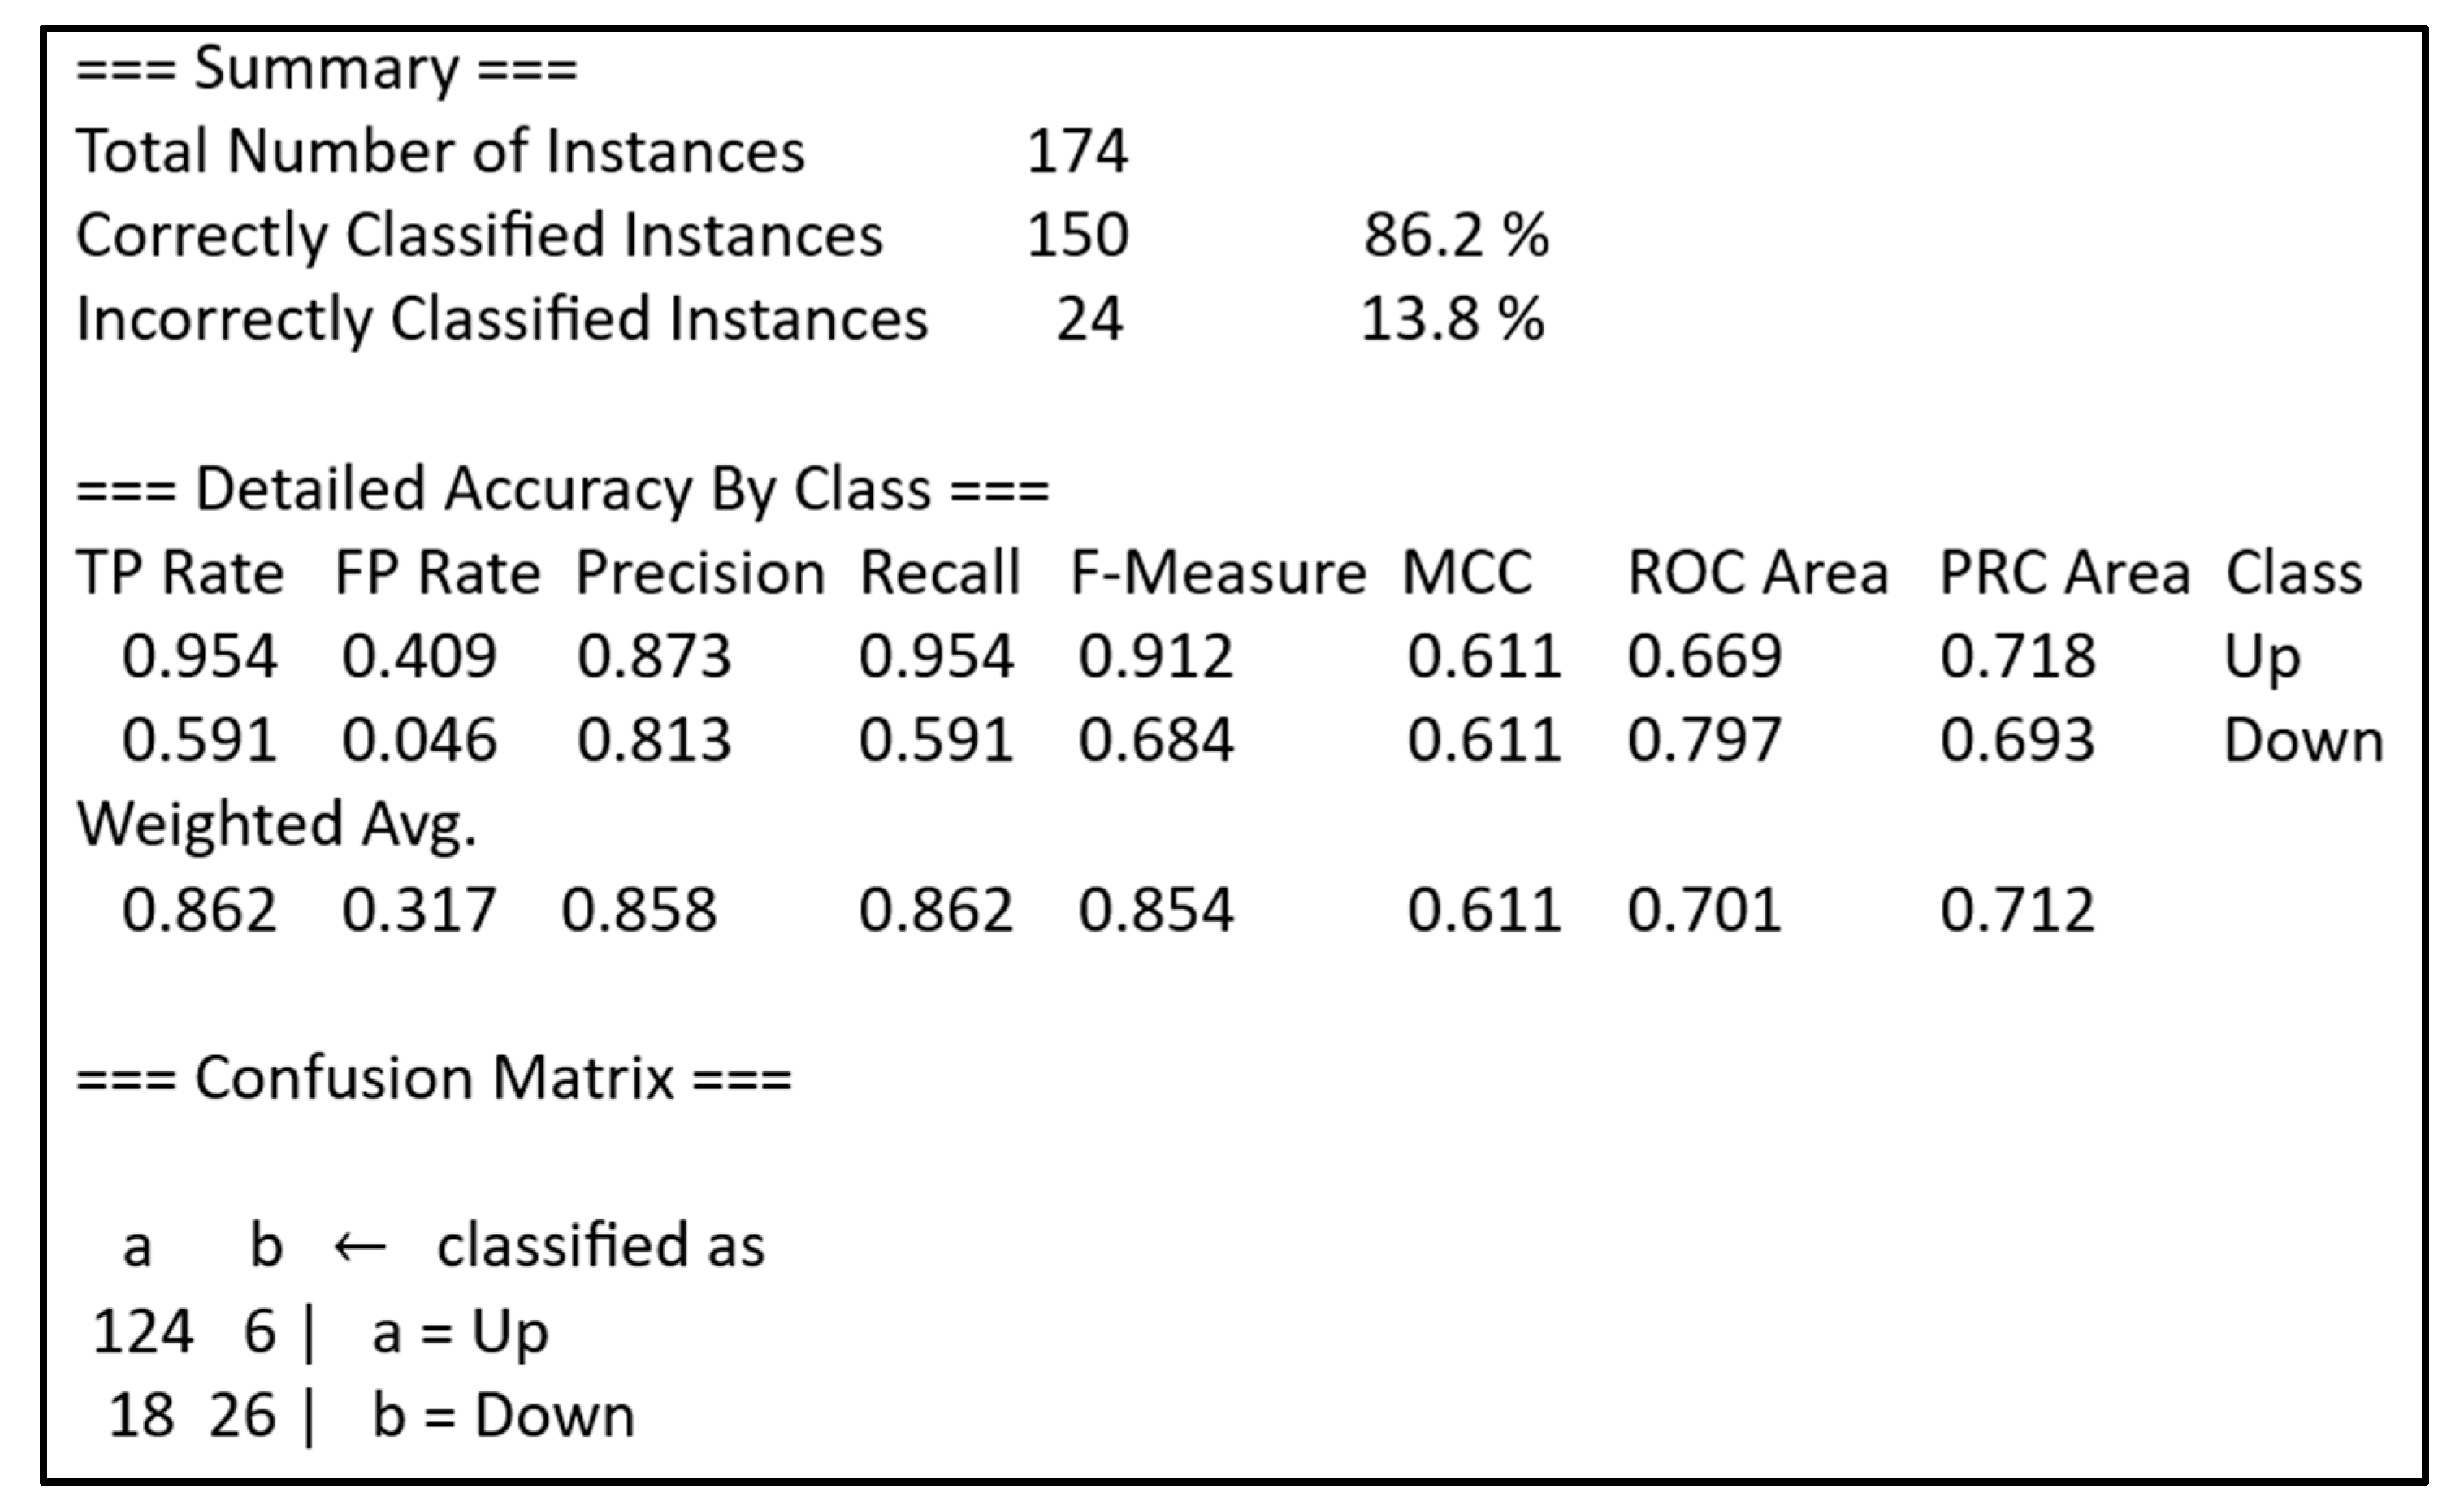
JRip’s output also reveals the classification measures in
Figure 9. The accuracy is 86.2% for the first dataset. The corresponding evaluation is very important, as we cannot rely on the rules that eventually result in small accuracy. Similar analysis we performed for all three datasets evaluates the models’ performance, calculates the precisions and recalls of the rules, and enables an expert validation if the corresponding scores are acceptable. We cannot control the number of rules. These rules can be simple or complex. Moreover, the experts can reject even very confident rules if the conclusions are frustrating or if they cannot validate them.
5.4. Rule Validation with Dempster-Shafer Theory
To generalize expert views or knowledge gained over larger contexts and measured data horizons related to various scales of product ecosystems and the workloads they manage, we alternatively study a special rule verification framework and the corresponding classifier proposed in [
8]. This takes expert hypotheses as rules defined on features (and their combinations) to assess their quality, thus realizing an interpretable what-if analysis for further utilization in the knowledge store and real-time remedial executions. This framework utilizes DST of evidence or plausibility as additional assistance to help experts validate their observations about the environmental conditions in the classification setting. Thus, if their experience tells them that some patterns or behaviors of specific features within particular ranges might lead to the system misbehaving, they plug those hypotheses (in other words, rules) into the DS classifier and obtain validation of their quality, including uncertainty estimates to account for. Moreover, the classical rule induction algorithms and DS rule verification approach can be leveraged and combined, while feeding the automatically learned rules from the first strategy to be estimated with the second. In particular, Rule 1, discovered by RIPPER, obtains a low uncertainty estimate through DS rule testing:
with a probability of positive class 0.943 and uncertainty 0.057.
For Rules 2 and 3 learned by RIPPER, DST results in the following estimates:
with a probability of positive class 0.861 and uncertainty 0.139; and
with a probability of positive class 0.763 and uncertainty 0.237. In the above, we see a higher uncertainty in the last rule compared to the previous ones, which indicates that there is less evidence for such a condition leading to a KPI breach.
The user of this framework can simply break value ranges (rule intervals) of all the data frame features to verify how they can be indicative, standalone, or in any combination. Here is a set of rules validated with splitting features into two ranges, which in several cases surprisingly results in high-quality rules:
with a probability of positive class 0.998 and uncertainty 0.002;
with a probability of positive class 0.993 and uncertainty 0.067;
with a probability of positive class 0.859 and uncertainty 0.141;
with a probability of positive class 0.857 and uncertainty 0.143.
Another complex rule enforced by the user obtains the following estimate:
with a probability of positive class 0.973 and uncertainty 0.027.
The two-interval split is just motivated by the simplicity of rules that experts can expect from the DS rule verification. It also has cheap performance in terms of the algorithm execution. The probability of the positive class and the uncertainty level in the rule estimated by the DST are the main factors the expert user could take into account in approving it for the Knowledge Base and linking it to the troubleshooting procedures and action frameworks. As an expert tool, the DST rule verification allows users to discover patterns/conditions that affect the KPI state, thus guiding them to focus on the corresponding attributes of the environment in root cause identification or prevention of potential misbehaviors. In one of the above rules obtained by DST rule induction, we observe that a free physical memory attribute above some level (0.397) leads to “KPI down” with high probability; thus, the user needs to take care of its tuning accordingly in order to prevent reoccurrence of the issue.
6. Evaluation of Results
We apply available knowledge to an unknown issue in our further evaluation analysis. Aria Ops detected similar problems in other customer environments. We analyze one of those problems. The “Remote Collector Down” KPI inspection showed the same behavior as in
Figure 6 and
Figure 7. We detected 46 cases when the cloud proxy was down. Verification of rules showed that in the case of Rule 1, the rule was correctly fired in 31 of the cases. In the case of Rule 2, the rule was correctly fired in 32 of the cases. In the case of Rule 3, the rule was correctly fired in 38 of the cases. We can confirm the matching of the problem pattern stored in the rules’ library. These highly accurate results on unseen data demonstrate the feasibility of the chosen approach and the quality of the explainable ML models trained.
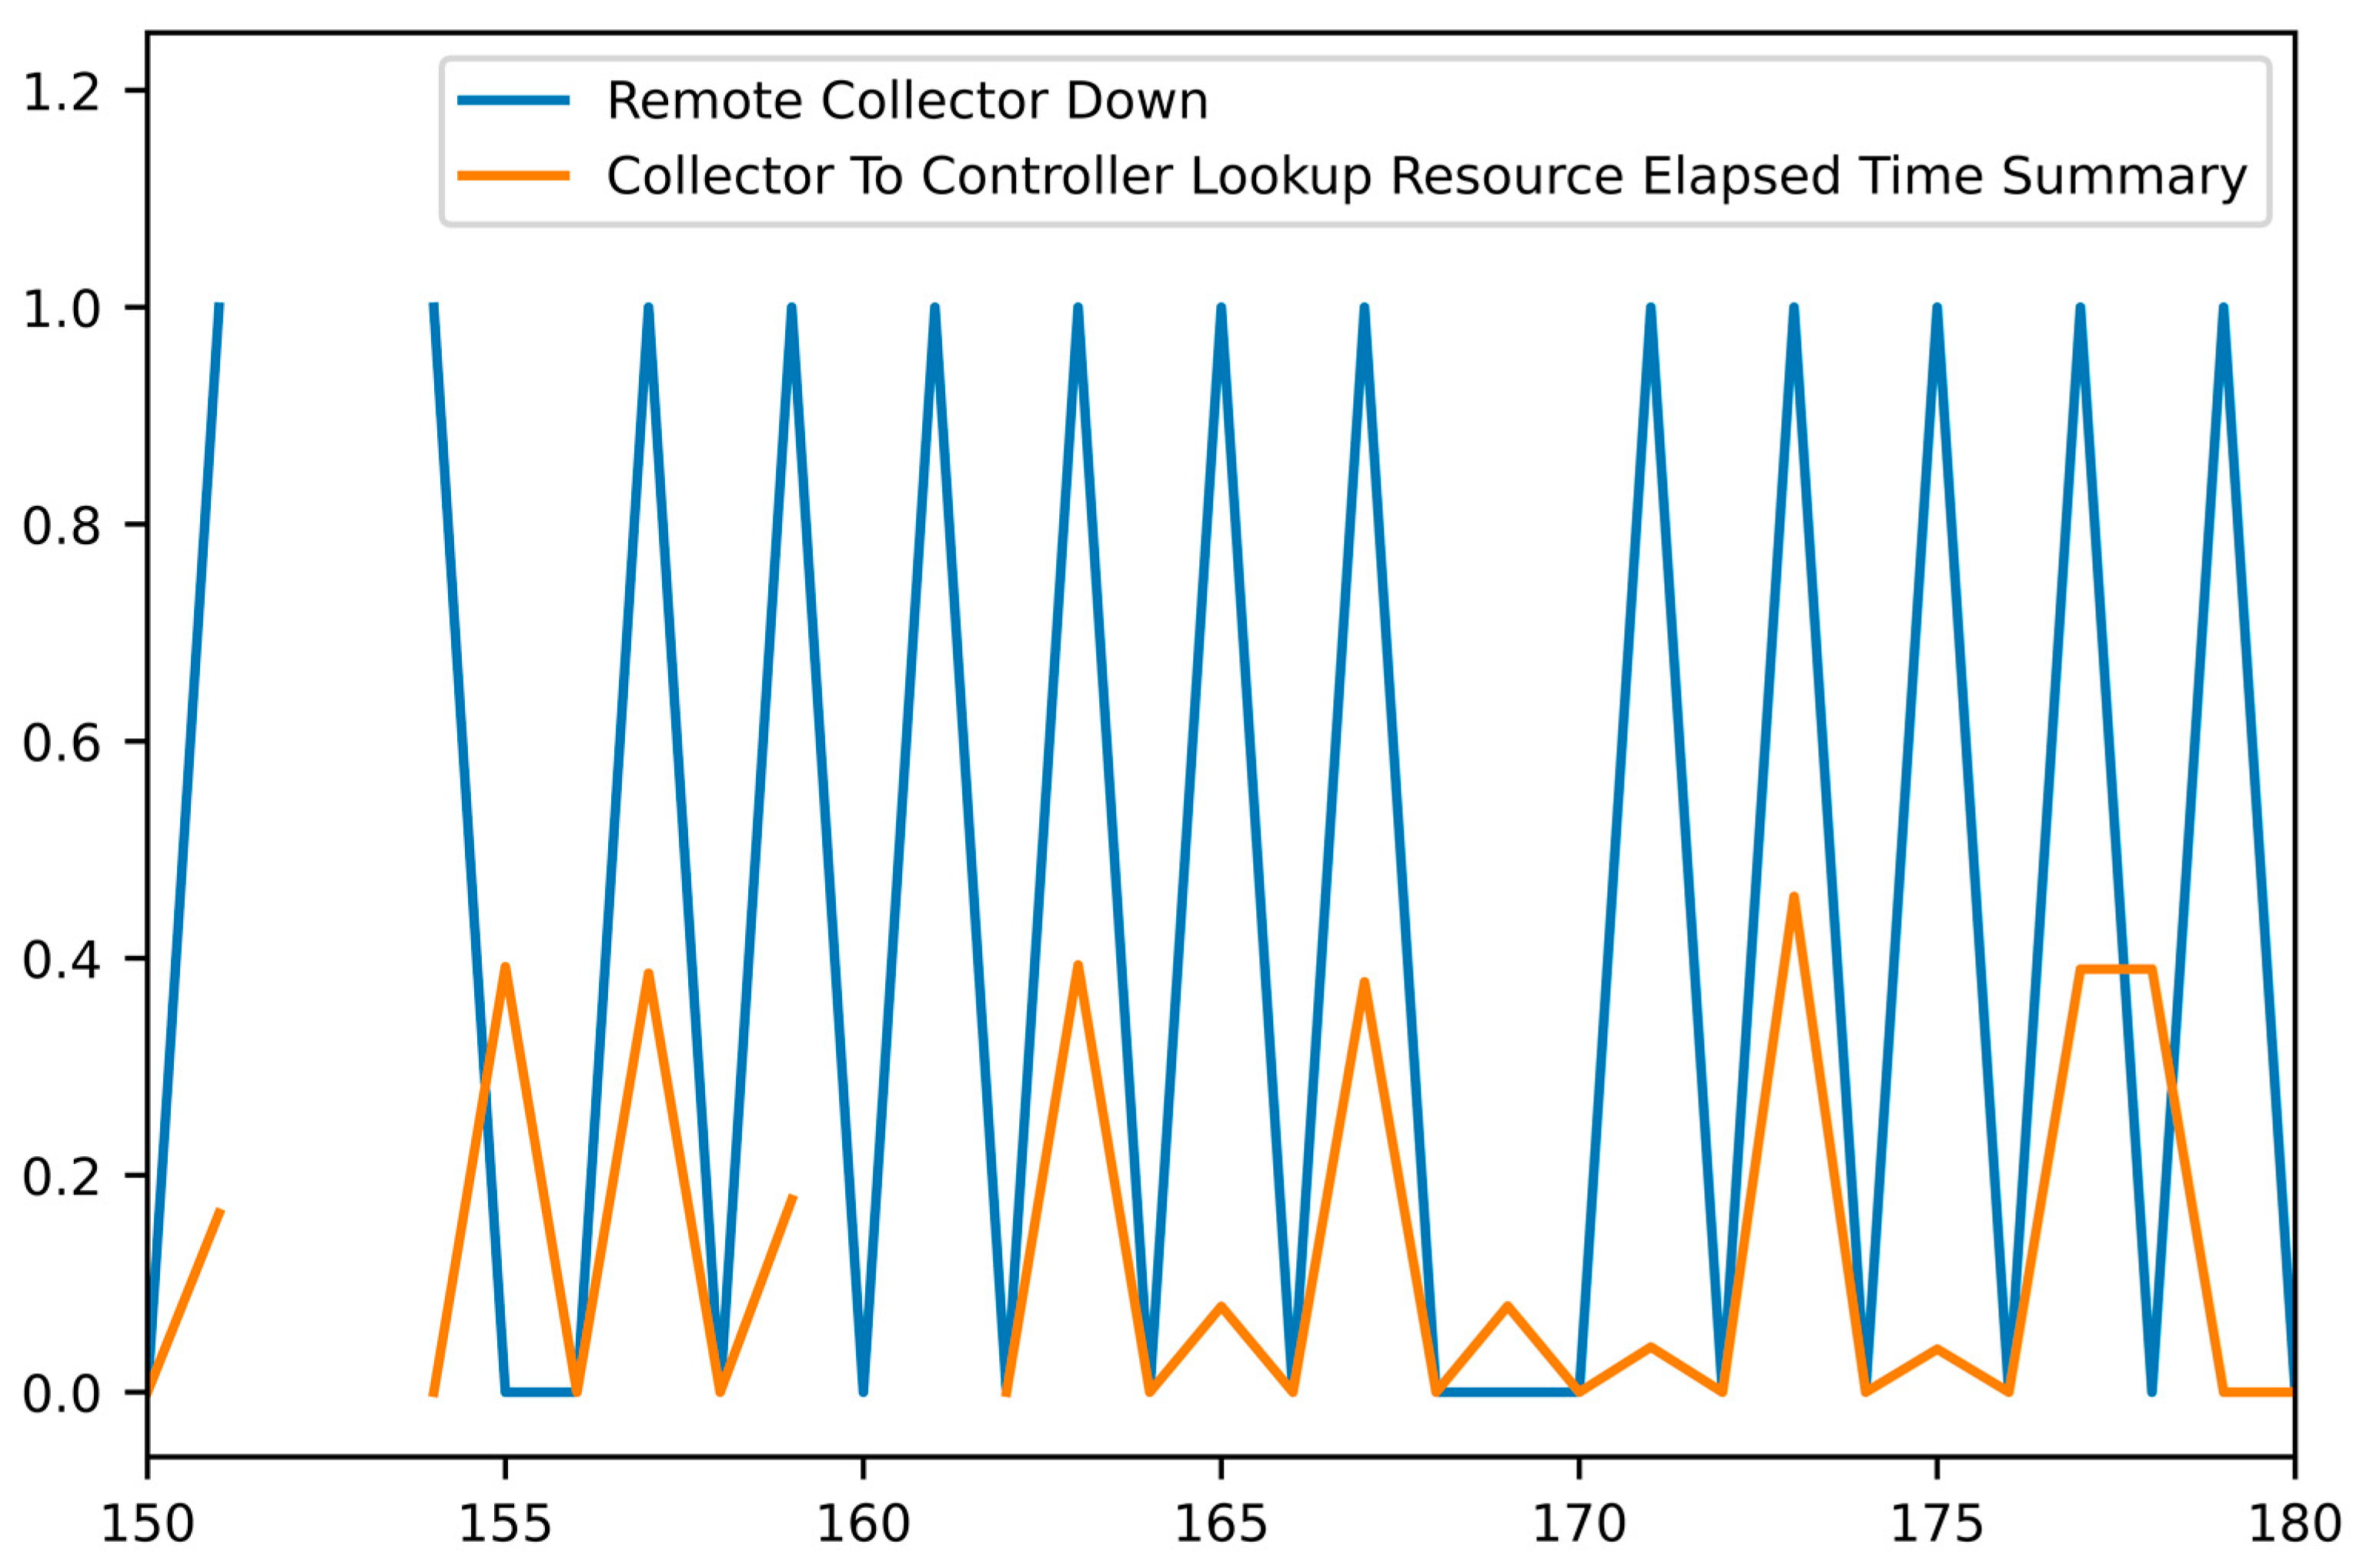
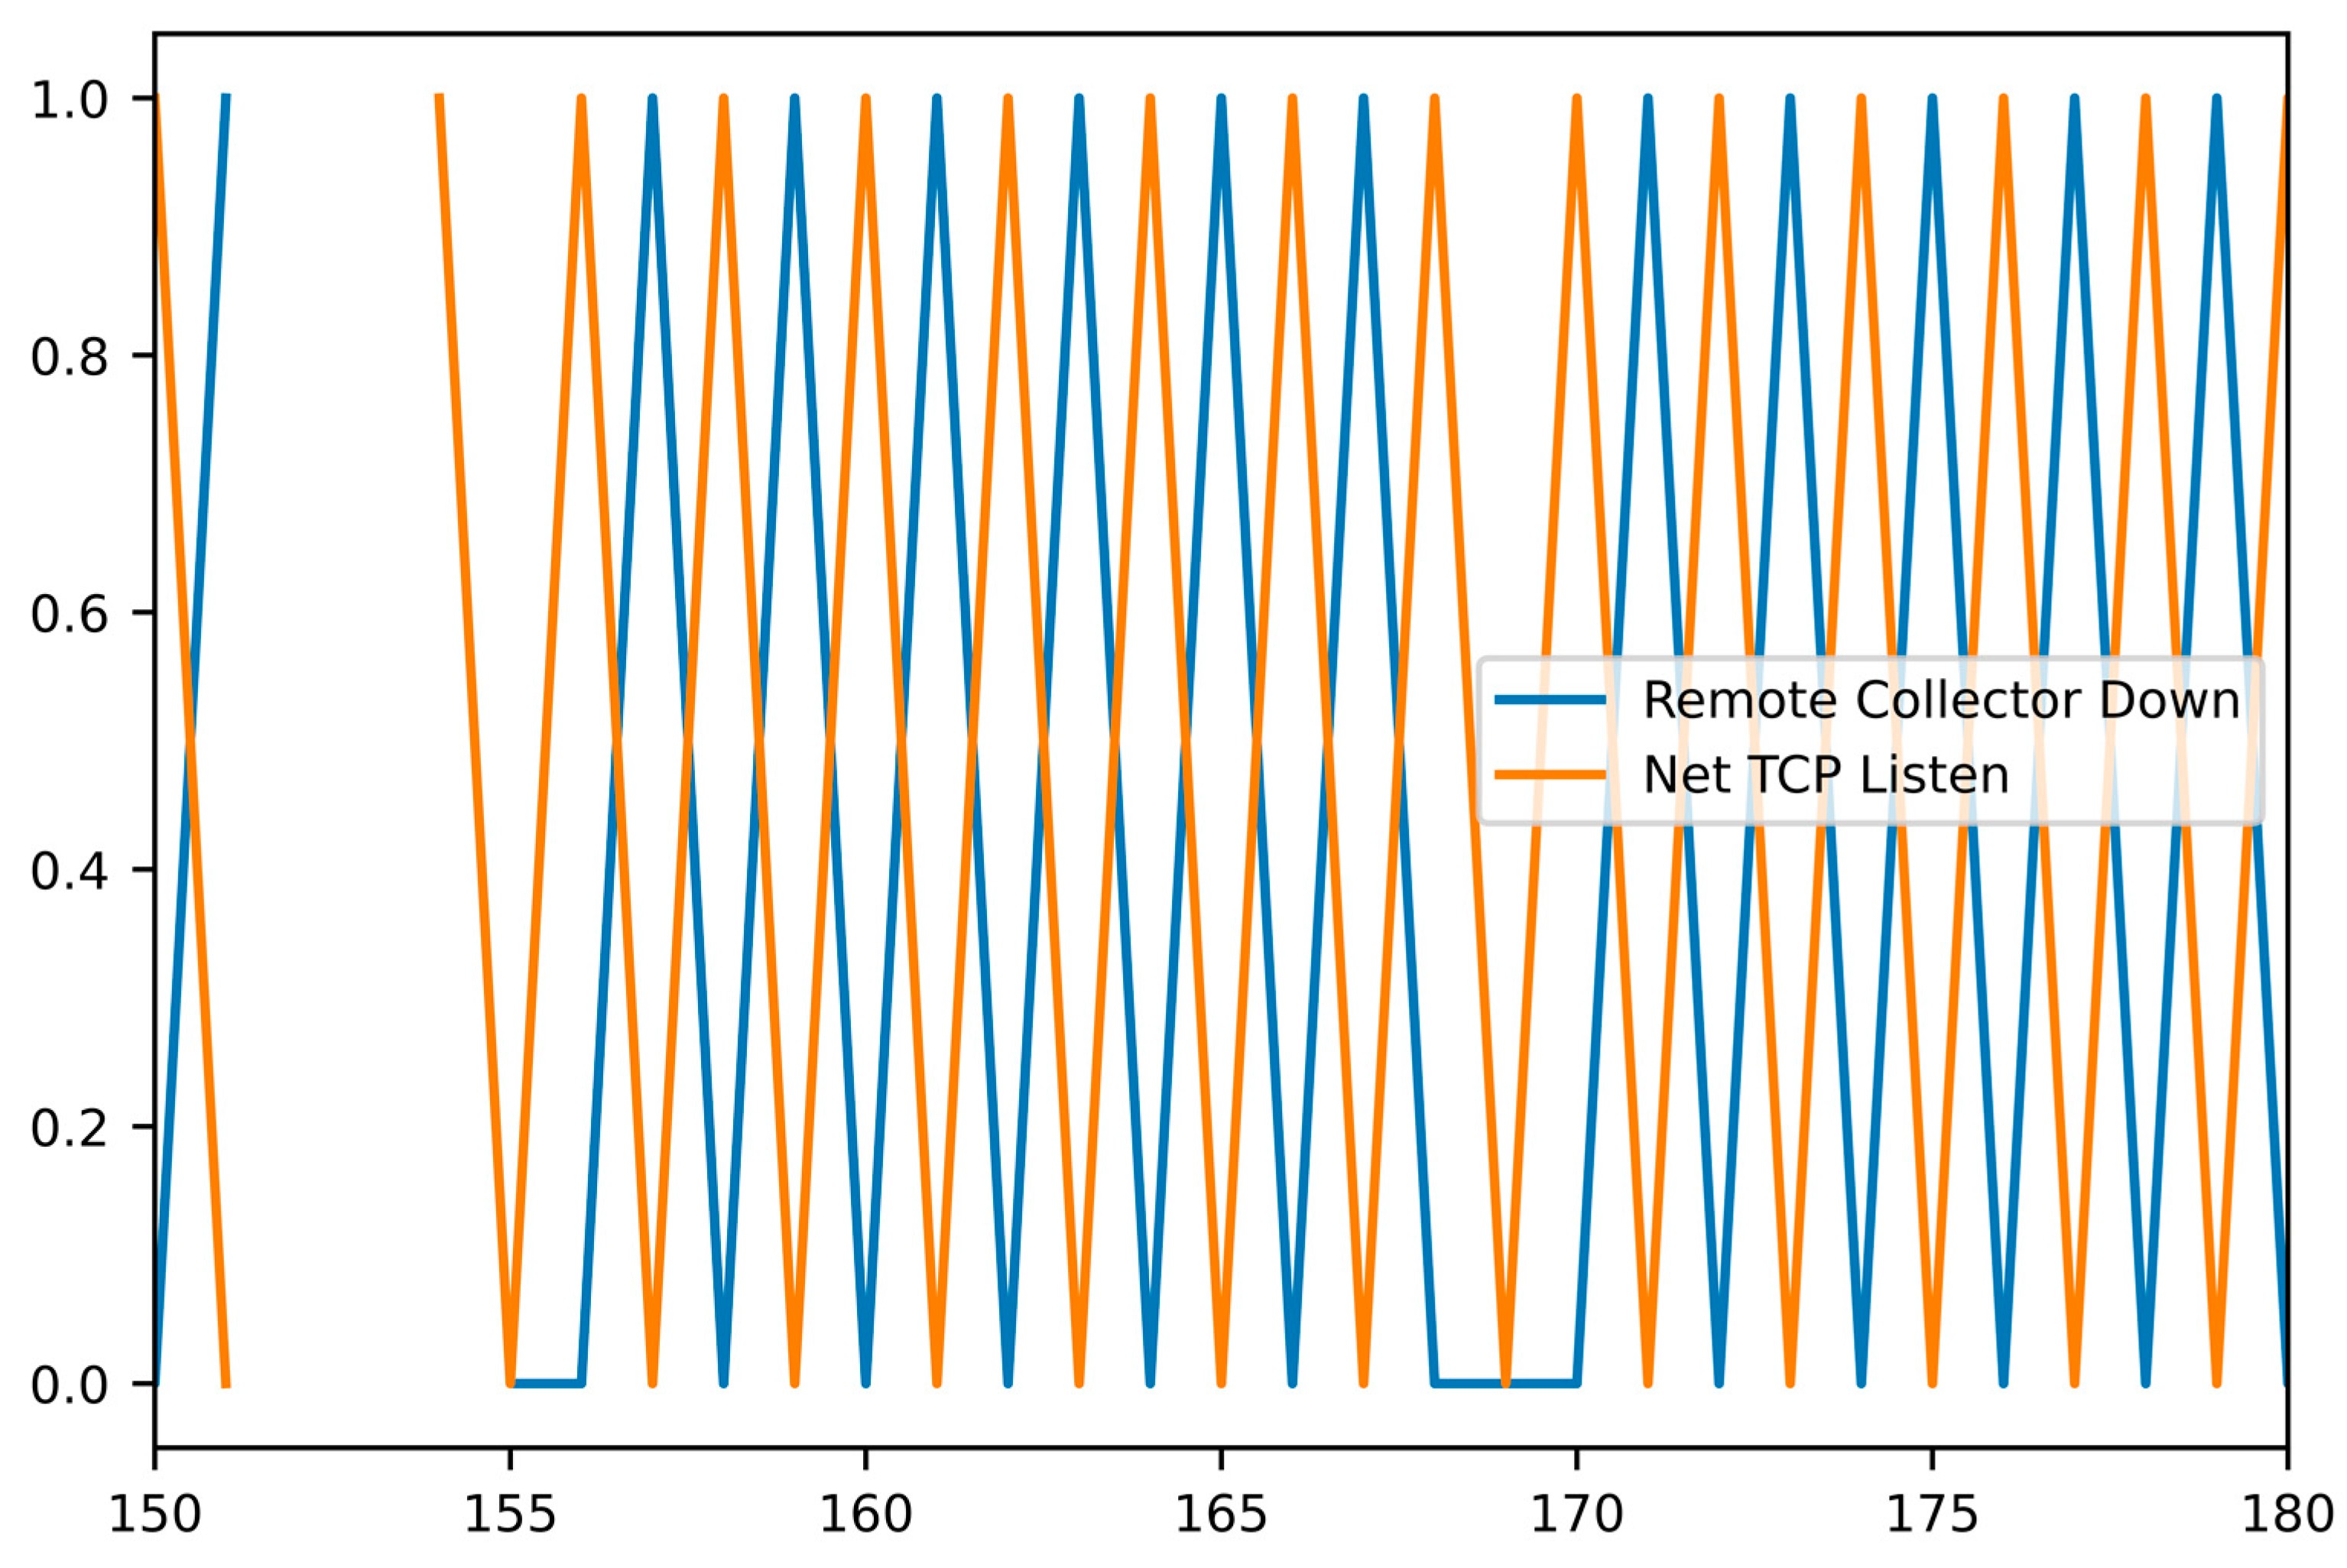
Figure 10 and
Figure 11 present the behavior of some of the metrics that participated in the rules in combination with the “Remote Collector Down” KPI after min–max smoothing to clarify the correlations.
7. Conclusions and Future Work
Our study proposes an explainable ML framework for automated troubleshooting of cloud services, validating it for several trending problem use cases. It incorporates rule induction methods to learn conditions or sources of anomalous behaviors for application KPIs. Machine-detected causality conditions can enrich the alert definitions in cloud operations services, thus enhancing their event management capabilities with AI-driven problem resolution assistance as an easily achievable implication of this work. We also described our larger vision of building a real-time self-diagnostic system and RCA tool based on global learning across the customer eco-systems within the SaaS cloud delivery model. Our method demonstrated accurate predictions of the root causes of those problem types. We plan to extend our analysis to other problem types and derive insights and quality metrics from larger experimental test beds.
Architecting an end-to-end ProbRCA service requires substantial development work. Within this study, our objective was to prove the viability of such a system from a data science perspective. There are several aspects to work on for a consistent benchmarking solution design, improvement, and evaluation. Continuously retraining ML models for problem types while performing the relevant data labeling in a pipeline, performance analysis of rule induction methods for real-time recommendations, and their validation over time with user feedback mechanisms or indirect means of tracking their actions are several of those aspects. We also plan to put effort into adopting DST-based approaches to better understand this theory’s frontiers and its practical significance as an apparatus for characterizing and comprehending managed services.
This communication relates to and builds upon our prior research [
26,
27] on various specific tasks in cloud diagnostics and administration comprising time series forecasting, anomaly and change detection in not only such structured data, but also in logs and traces, as well as abnormality root cause inference from these types of information sources. Based on these solutions, our outlook for the future of intelligent cloud management includes designing comprehensive AI-driven systems for self-driving data centers.
8. Patents
The study is supported by a filed (2023) US patent.


 ,
, 