Article

Somatosensory Mismatch Response in Patients with Cerebral Palsy

1
Research Unit of the Buhl-Strohmaier Foundation for Cerebral Palsy and Pediatric Neuroorthopaedics, Department of Orthopaedics and Sports Orthopaedics, TUM School of Medicine and Health, University Hospital Rechts der Isar, Technical University of Munich, Ismaninger Strasse 22, 81675 Munich, Germany
2
SETLabs Research GmbH, Healthcare Technologies, Elsenheimerstrasse 55, 80687 Munich, Germany
3
Markus Würth Professorship, Technical University of Munich, Ismaninger Strasse 22, 81675 Munich, Germany
*
Author to whom correspondence should be addressed.
These authors contributed equally to this work.
Appl. Sci. 2024, 14(3), 1030; https://doi.org/10.3390/app14031030
Submission received: 6 November 2023 / Revised: 19 January 2024 / Accepted: 21 January 2024 / Published: 25 January 2024
(This article belongs to the Special Issue Computational and Mathematical Methods for Neuroscience)

Abstract

:
Background: Mismatch negativity (MMN), an event-related potential (ERP) component occurring at specific recording sites and latency, is associated with an automatic change detection response, generally elicited using oddball paradigms wherein infrequent stimuli are embedded in repeated, frequent stimuli. To verify the presence of mismatch-related ERP responses to somatosensory stimulation in individuals with cerebral palsy (CP), we conducted a preliminary study involving healthy participants and patients with CP. Methods: Both groups underwent ‘frequent’ and ’infrequent’ stimulation applied to the ring finger and thumb of their left hand, respectively. ERPs were recorded at frontal, central, and parietal scalp locations using electroencephalography. A healthy cohort tested the experimental protocol and showed evidence that mismatch-related ERP responses were observable. Subsequent analysis focused on the patient group. Results: Statistically significant differences between the two types of stimuli were observed on the frontocentral and parietal channels between 150 and 250 ms after the stimulus onset in the patient group. Furthermore, a late discriminative response was observed in the frontal and parietal channels. Conclusion: The results demonstrate the presence of mismatch-related ERP responses in individuals with CP.

1. Introduction

Event-related potential (ERP) is a measured brain response to a specific sensory, cognitive, or motor event. ERPs are measured by means of electroencephalography (EEG), which is a noninvasive electrophysiological method of monitoring the brain’s electrical activities. Mismatch negativity (MMN) is a component of an ERP observable at specific recording sites (e.g., frontal) and latency (∼120–200 ms) relative to the moment of stimulus presentation, as detected in the EEG signal. MMN occurs when a sequence of repetitive standard stimuli is interrupted by an odd or deviant stimulus, i.e., when the brain detects a change in a background of homogeneous events [1]. For example, if one hears a series of identical tones (i.e., standard stimuli), and then a slightly different tone (i.e., odd stimulus) is introduced, MMN reflects the brain’s automatic response to this deviation. The odd stimulus must differ from the standard stimulus in at least one stimulus attribute, in frequency, duration, or intensity. MMN is associated with automatic, subconscious memory processes [1], through its role in detecting and registering deviations from expected stimuli. A sequence of frequent stimuli causes a track or a regular pattern of stimuli in the sensory memory, and any new incoming stimulus is then compared with that created memory track. When a stimulus breaks that regular pattern, MMN is elicited, indicating that the brain has detected a mismatch. This process is thought to be related to preattentive, automatic memory mechanisms. MMN reflects the brain’s ability to compare incoming sensory information with stored memory representations, contributing to the early stages of memory formation and updating [2].
MMN has been originally discovered and studied intensively by auditory stimuli [3], but there is evidence of MMN in the visual [4,5] and somatosensory [6,7,8] modalities also. In the visual domain, it involves changes in visual stimuli, such as color, shape, orientation, and emotional expression [9,10]. In the somatosensory domain, it has been assessed most commonly using vibrotactile stimuli and is known as somatosensory MMN (sMMN). For example, different durations, different frequencies of stimulation, or stimulation of different body parts is used for standard and odd stimuli [11,12].
The better a subject can distinguish the deviant from the standard stimuli, the larger the MMN [13]. Especially in the auditory domain, MMN has been widely employed to study speech and language development. This research includes both typical cases, such as infants exposed to one or two languages with normal development [14], and atypical cases, like children having problems with a specific language impairment [15]. Visual MMN in the context of cognitive impairment and aging can provide information about age-related changes in sensory processing and cognitive function [16,17]. Furthermore, visual MMN seems to be sensitive enough to disclose gender differences [18,19]. In the tactile domain, few studies reported the existence of somatosensory MMN in healthy individuals [6,11,20,21]. However, to our knowledge, contrary to MMN studies in the auditory and visual modalities, much less is known about the effects of mismatch in the sMMN modalities, and related developmental studies are very sparse. The reported somatosensory ERPs showed different results depending on the stimulus properties, such as duration, spatial location, and vibrotactile frequencies. For example, Kekoni et al. [11] used a vibratory mismatch paradigm and observed sMMN as a negative deflection at 100–200 ms, while Shinozaki et al. [22] found sMMN as a positive deflection at 100–200 ms, using a topographical mismatch paradigm. Tamura et al. adopted a two-point discrimination paradigm and obtained a negative potential at ∼140 ms (N140) and two positive components at around 300 and 500 ms [23]. On the other hand, using a temporal discrimination task, Akatsuka et al. found a negative component peaking at approximately 60 ms (N60) and a large positive peak at around 100–200 ms (P150) [7]. In most cases, sMMN appeared over the frontocentral regions [6,11].
In addition to MMN, a later negative mismatch-related ERP component is often observed in both auditory [24,25,26] and somatosensory [21] oddball paradigms and is referred to as late discriminative negativity (LDN). Generally, LDN is observed at around 400 ms, following MMN [27]. Although less is known about LDN, its amplitude is typically higher in infants and children, but it has also been observed in adults [24,28].
Irrespective of the modalities of mismatch-related ERP components, they are widely used for monitoring treatment adequacy in cognitive-impairment-related diseases like schizophrenia, Alzheimer’s, and vascular dementia [23,29,30]. While the potential uses of mismatch responses are noteworthy, studies involving patients with cerebral palsy (CP) are generally lacking to date, and to our knowledge. CP leads to a movement disorder caused by nonprogressive damage in the developing brain during early childhood. The movement disorder associated with CP is classified into three types: spasticity, dyskinesia, and ataxic CP. Depending on the extent of the brain damage, patients with CP may also exhibit additional symptoms such as cognitive, communicative, and/or behavioral deficits. CP is mainly characterized by motor abnormalities. Any correctly initiated movement requires an intact sensory motor system. Therefore, it is evident and supported by research also that somatosensory dysfunction plays a crucial role in movement control in the case of CP. Furthermore, children with CP often have difficulties processing somatosensory information, which can also lead to difficulties in learning and movement execution. For example, in the case of hemiplegia, the hand on the less affected side may process touch differently than the one on the more affected side. This difference in sensory information processing is frequently manifested in more pronounced disparities in movement execution and strength between the two sides of the body [31,32,33].
Mismatch-related ERP responses have the potential to serve as a valuable tool for probing the neural mechanisms underlying somatosensory processing in patients with CP. By studying those, researchers and clinicians can gain insights into the nature of sensory abnormalities. Knowledge of the sensory process can help to develop different therapies tailored to the problem. For instance, Restuccia et al. [34] demonstrated that the cerebellum plays a role in the automatic detection of changes in somatosensory input. Their study not only validated the reliability of somatosensory mismatch negativity (sMMN) recordings but also suggested that individuals with cerebellar damage might experience difficulties in processing incoming somatosensory information in the cortex.
Conducting ERP experiments would be particularly suitable for patients with CP, including young adults, considering potential challenges in concentration and attention span during tasks [35,36]. Mismatch-related ERP responses, in particular, provide an opportunity to look at cognitive processing even when a patient faces concentration deficit, as the patient does not need to focus on the task. The appearance of mismatch-related responses in the EEG allows one to detect changes related to sensory or cognitive processes in the brain. In this study, we chose an adult population of patients with CP who were able to read and had sufficient concentration. Our goal was to assess the tolerability of the EEG cap preparation. Additionally, we aimed to know whether it was feasible to derive any mismatch-related ERP responses at all in the case of CP with our experimental protocol (i.e., can the participants perform the tasks?). Furthermore, the study is based on the assumption that sMMN is elicited between 150 and 250 ms, and LDN is elicited at around 400 ms after the stimulus onset, as either a negative or positive component [6,11,12,24,27,28]. These assumptions are based on the literature, where most of the studies involve healthy children and adults. The further goal of the present study was to verify the assumption in the case of CP. The study first recorded the EEG responses in four healthy adults and then in seven patients diagnosed with CP. All participants experienced mechanical vibrations on their middle finger (‘standard’ stimulus) interrupted by frequent vibrations on the thumb (‘deviant’ stimulus) while reading a text. With the healthy cohort, the experimental protocol and the EEG cap were initially tested; further, mismatch-related ERP responses were confirmed. Subsequent analysis focused on the patient group.

2. Methods

2.1. Participants

EEG was collected from 4 healthy volunteers and 7 patients with CP. Healthy volunteers were aged between 29 and 55 years and recruited among personnel working at the hospital. Patients were aged between 23 and 53 years and recruited from a special center for people diagnosed with CP. The diagnosis of CP was confirmed by a senior orthopedic specialist before the start of the study. Additionally, the inclusion criteria of the selected patients included the ability to read and maintain adequate concentration during reading. Table 1 shows the patients’ information in addition to their diagnosis. The degree of the patient’s mobility was expressed according to the Gross Motor Function Classification System (GMFCS) [37]. This system defines five different levels of mobility from a GMFCS of I, when the person can walk freely without the need of a walking aid, to a GMFCS level of V, when a person has substantial motor limitations and requires a wheelchair permanently, not being able to move by himself or herself. The GMFCS levels of the participants of this study varied from a GMFCS of I to IV (Table 1). The Manual Ability Classification System (MACS) describes how patients use their hands to handle objects in daily activities. MACS ranges from 0 to 5, with a higher MACS level indicating a higher level of spasticity [38].
The ability to read is independent of the severity of the disability. This is also the reason why the selected group was very inhomogeneous concerning GMFCS. In principle, the participants did not need to focus on the vibratory stimulus while reading because mismatch-related ERP signals occur when participants are not focused on the task. One should not be able to detect mismatch-related responses if the participants are focused on the task, or the observed EEG signals occurring in an atypical time course, unrelated to the mismatch-related signal.

2.2. Experimental Procedure and Data Analysis

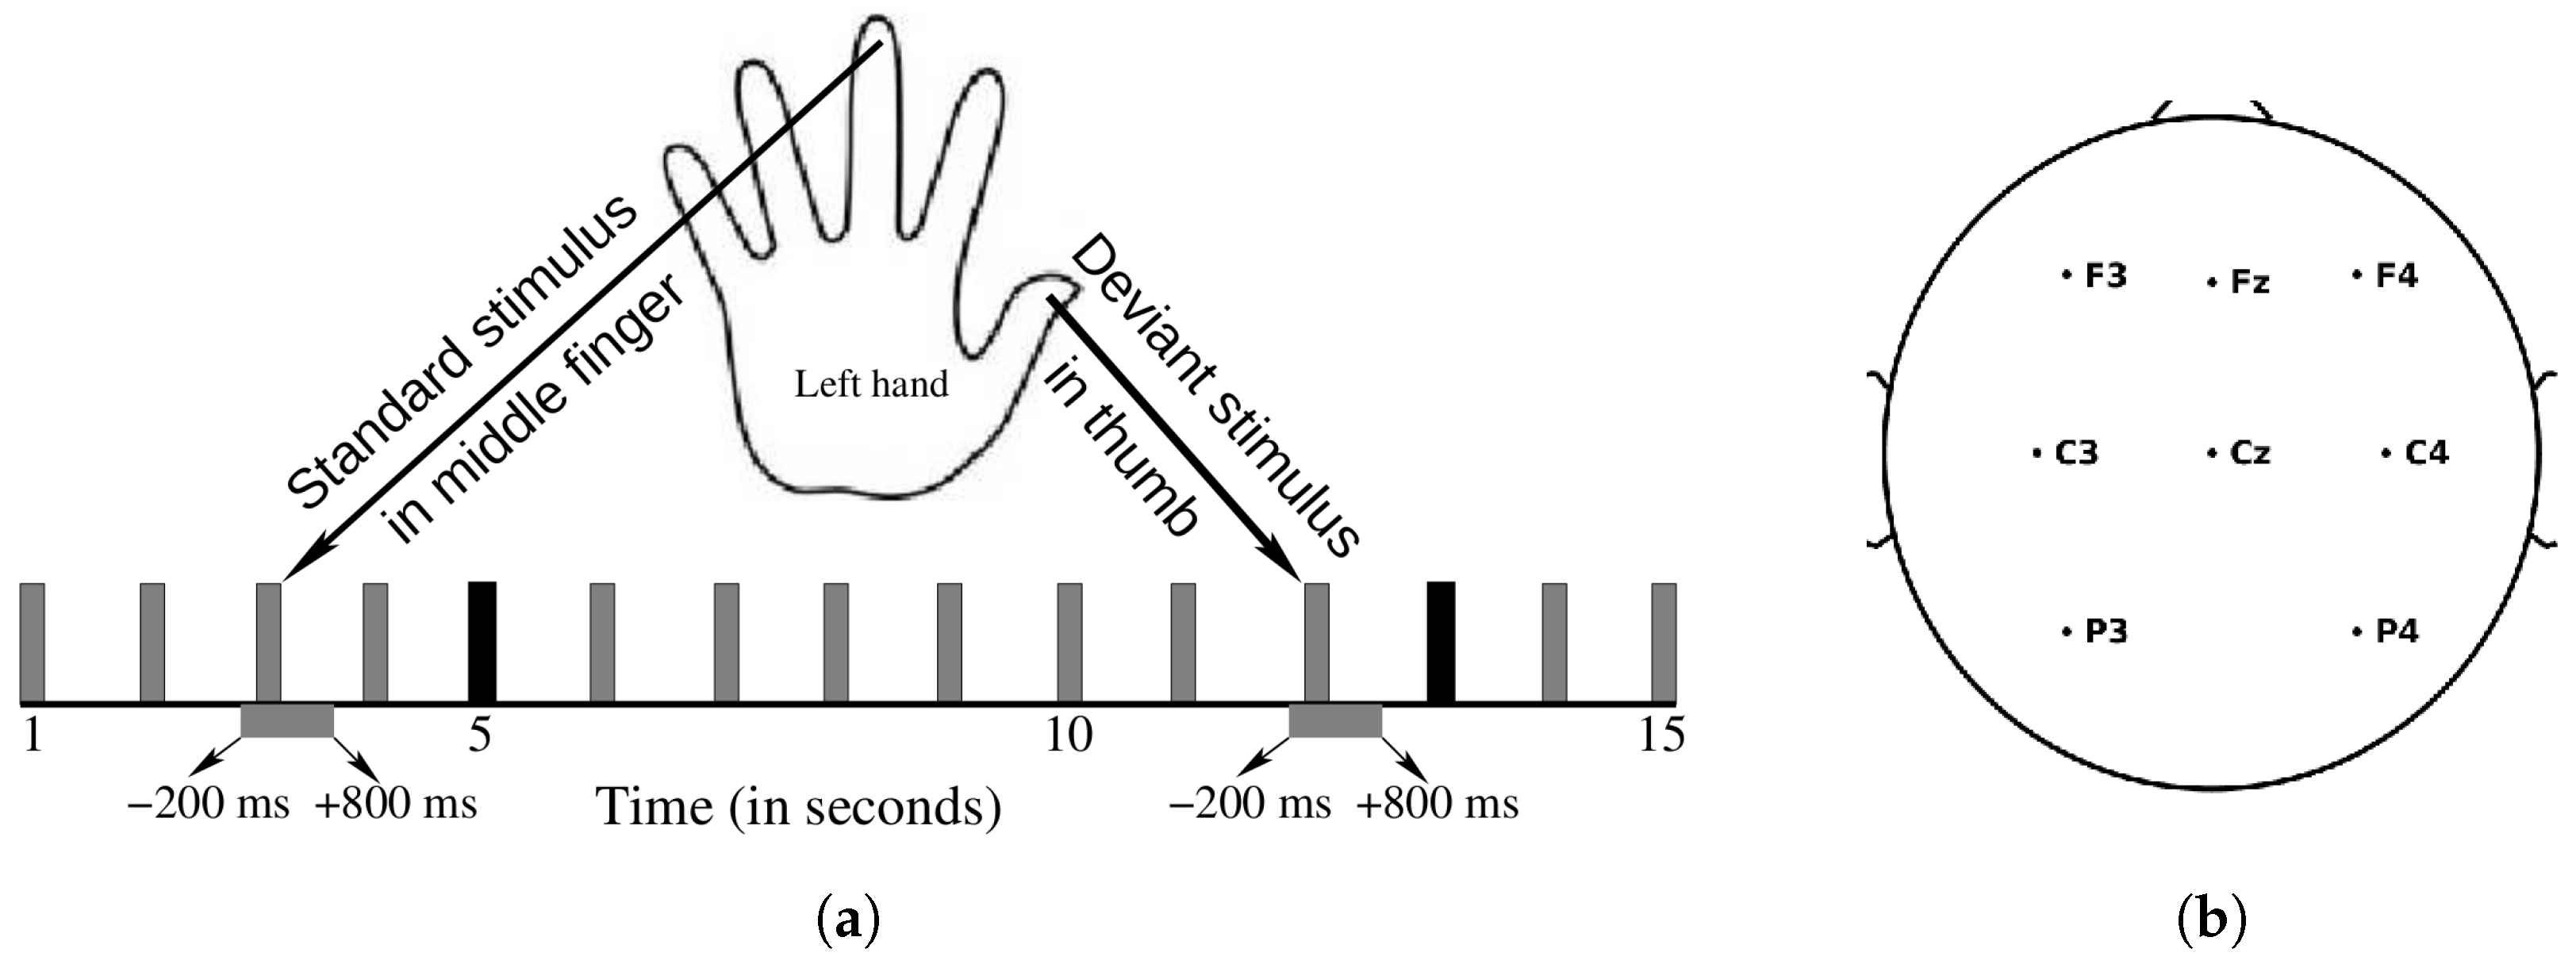
2.2.1. Stimuli and Procedure

Mechanical vibrations were delivered via vibration motors placed on the fingers. ‘Frequent’ (or ‘standard’) and ‘infrequent’ (or ‘deviant’) stimulations were delivered to the ring finger and thumb of the left hand, respectively. Frequent and infrequent stimulation occurred at a ratio of 90 % and 10 % , respectively, with pseudo-randomized occurrence. Figure 1a shows a schematic diagram of the protocol for stimulus delivery. Three successive runs of 500 stimuli were delivered with 1 s of interstimulus interval. During the experiment, the participants sat comfortably in a chair in a quiet room and were asked to read a text displayed on a screen while stimuli were delivered to their fingers. The vibration motors were attached to the nail side of the finger (Figure 1a) because of the more direct transmission of vibration. A microcontroller provided an interface between the vibration motors and a computer. A Viewablewritten software controlled the delivery of vibrations, i.e., the sequence of stimulation. All subjects received the same vibration amplitude and frequency (1 G at 200 Hz).
All participants could easily perceive the intensity of the vibration and did not report any pain or discomfort resulting from the stimulation. The participants were advised not to pay attention to their hands during the session but to relax with the text reading on the screen.

2.2.2. EEG Acquisition

Electroencephalogram was recorded with an Enobio wireless EEG system [39] at 8 scalp locations (Figure 1b). Electrodes drained with saline solution were placed on the electrode cap (Enobio 8 EEG cap) at the F3, Fz, F4, C3, Cz, C4, P3, and P4 positions according to the international 10–20 system, referenced to an electrode placed on the left mastoid. The ground electrode was placed in the middle of the forehead. The signal was stored on a hard disk at a sampling rate of 500 Hz. At first, the experimental protocol was tested on healthy participants, and then the same procedure was followed for the patients.

2.2.3. Data Processing
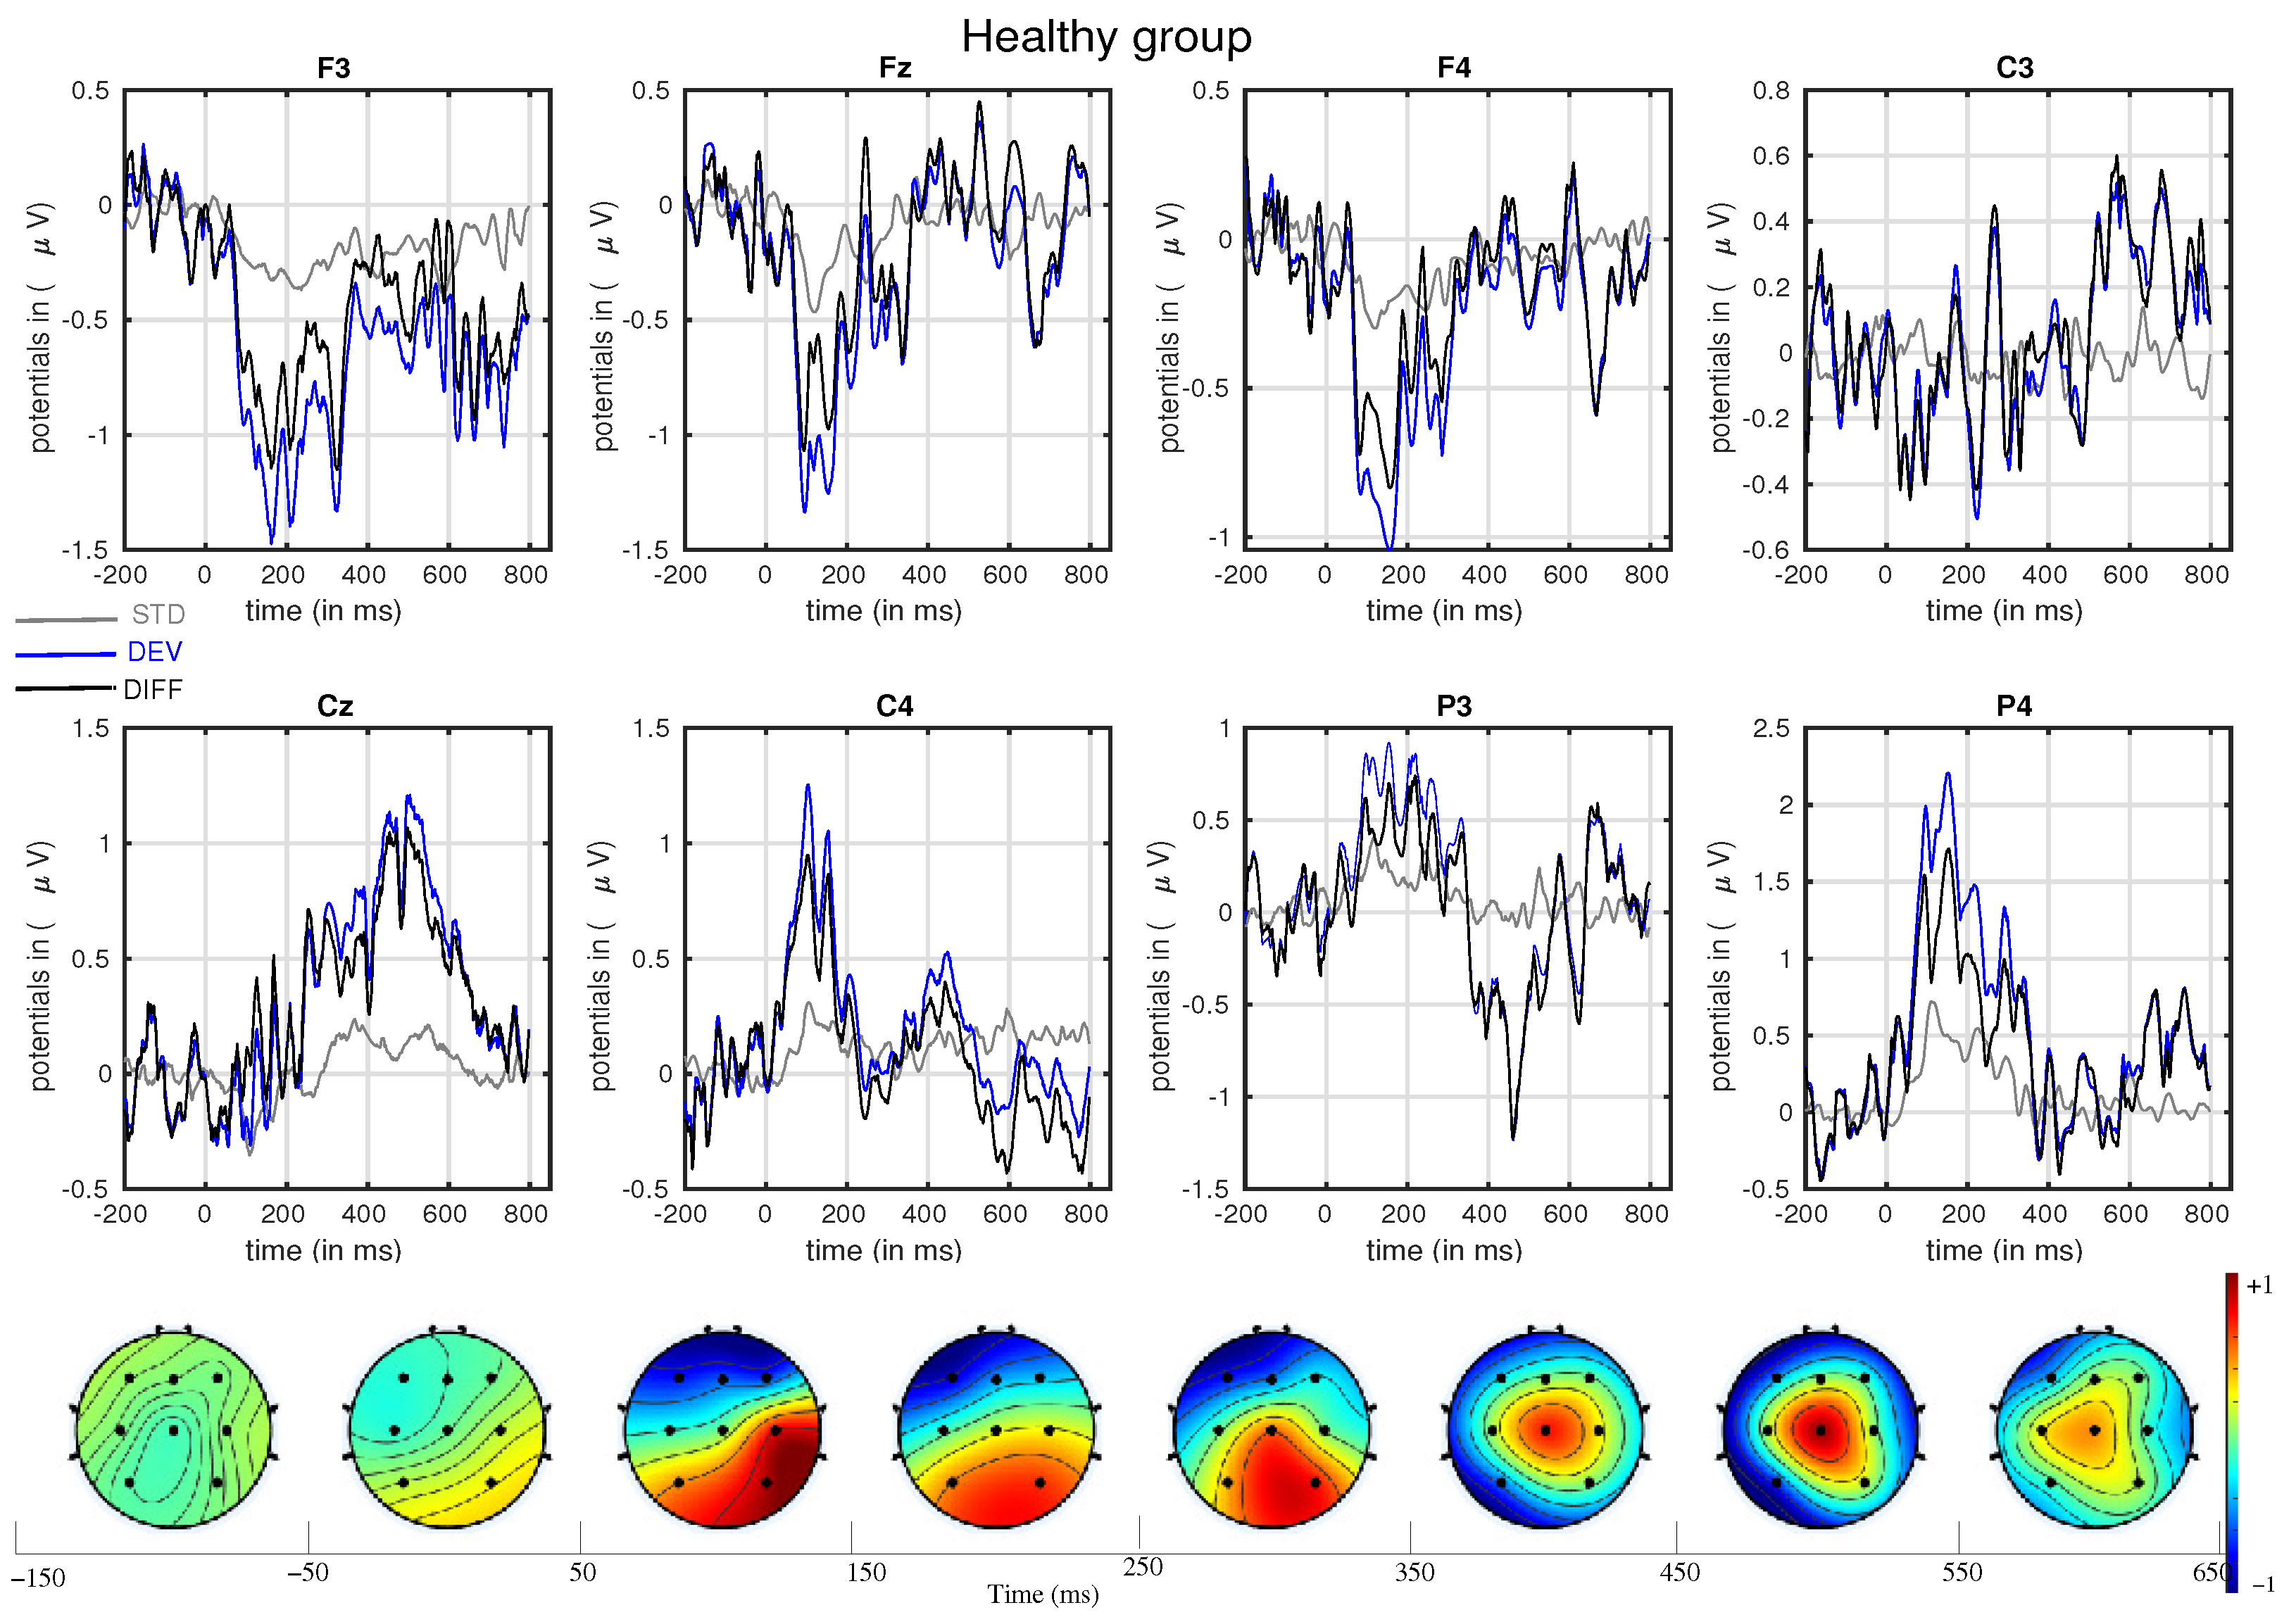
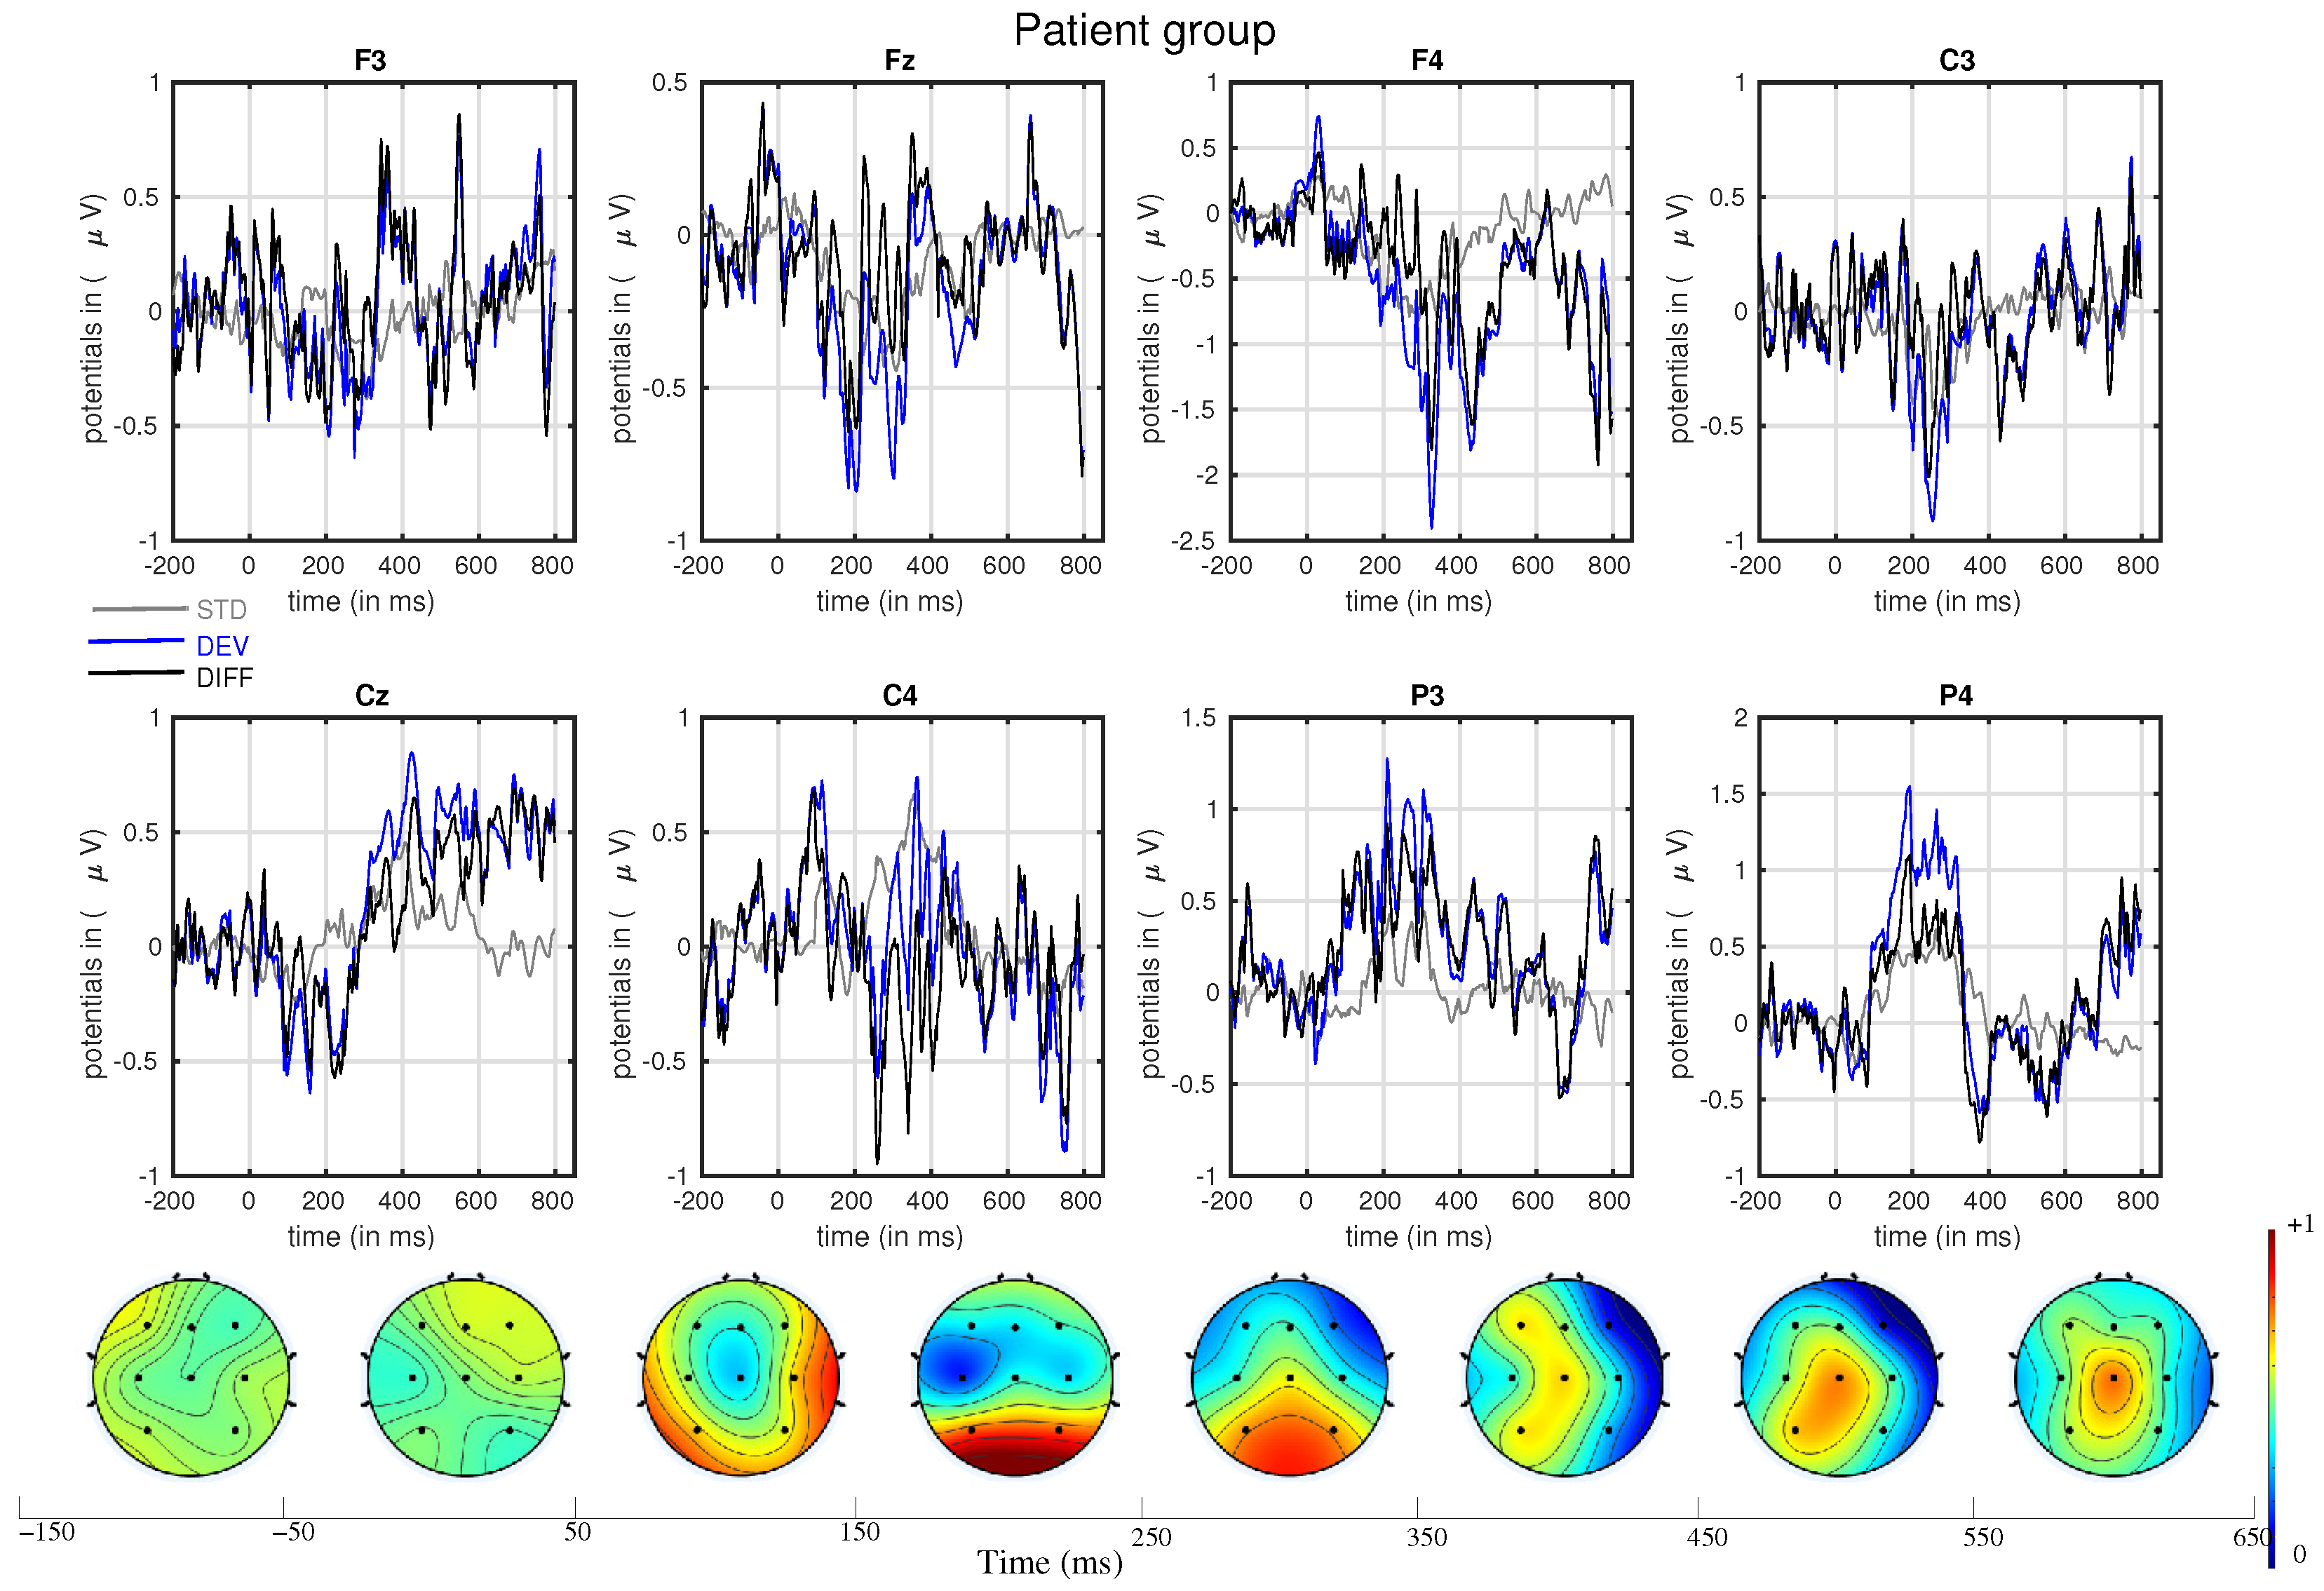
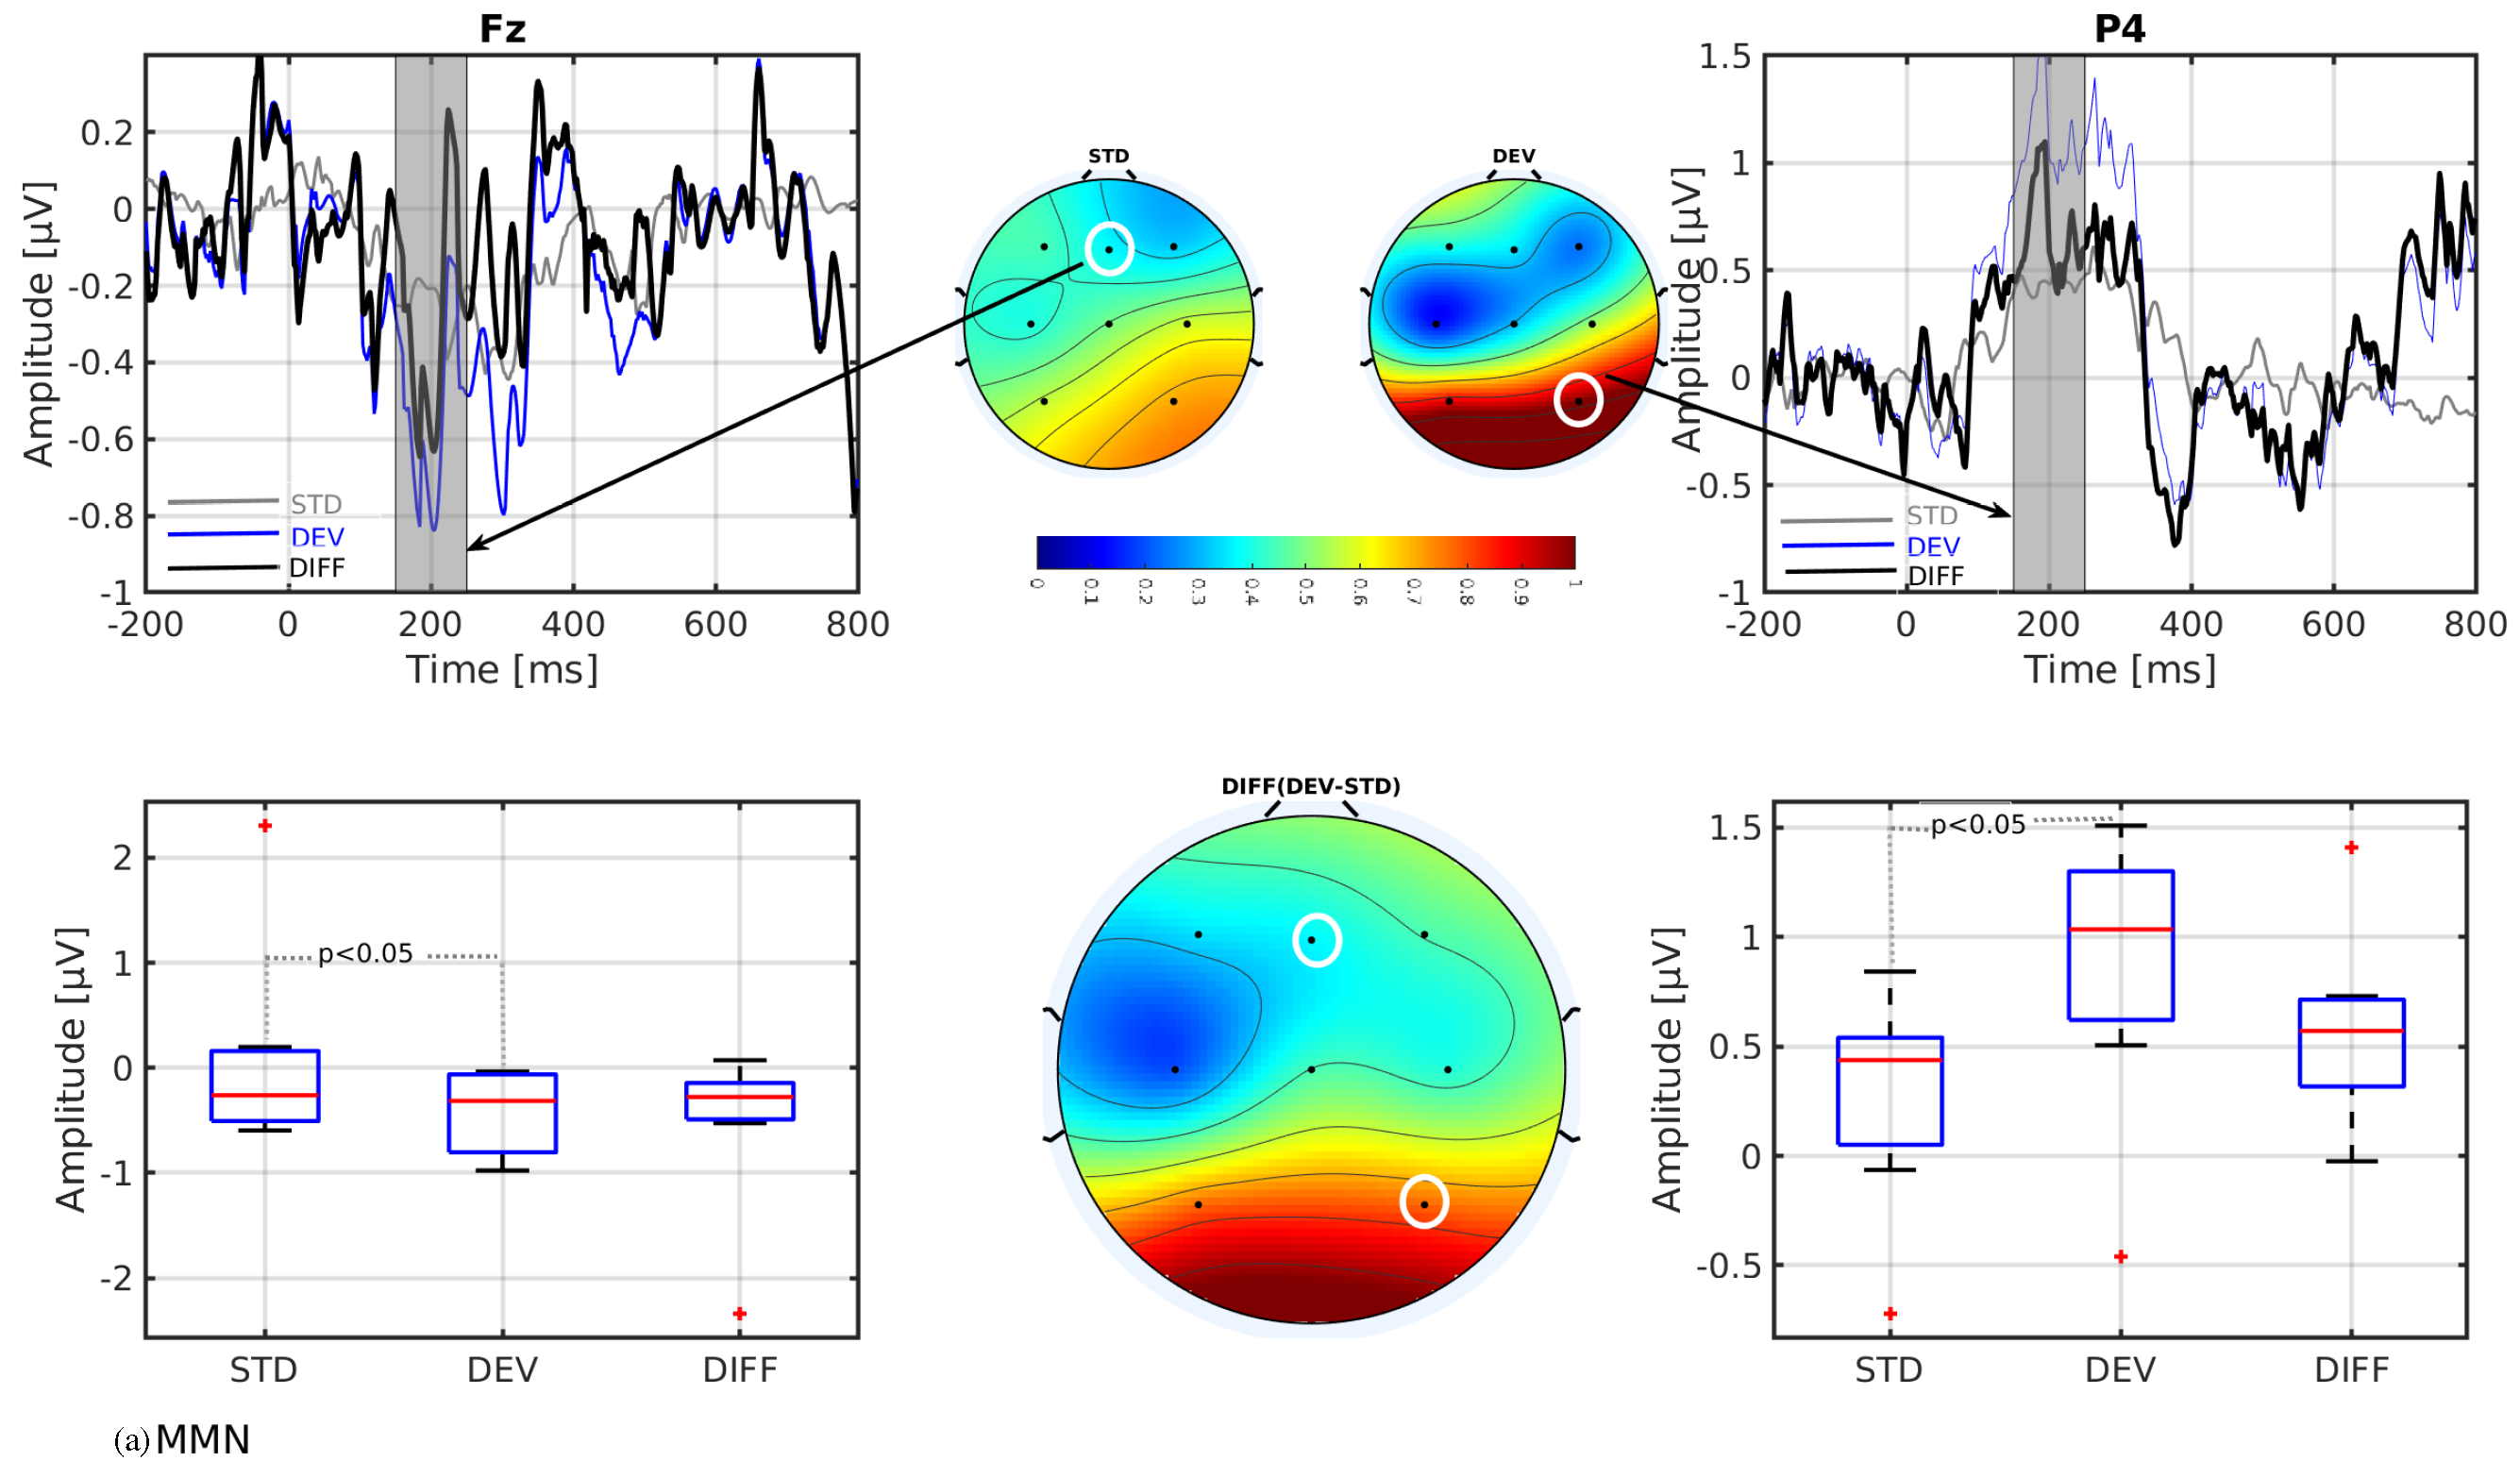
Data preprocessing was performed using the EEGlab v2023.0 toolbox running on Matlab R2020a. Data were first band-pass-filtered between 1 and 30 Hz and then re-referenced to the common average. After re-referencing, the three sets of 500 trials were concatenated together. The data were examined for possible bad channels using Kurtosis statistics with a threshold value of 2. Since no channels were found bad, data from all the channels were used for the analysis. The continuous merged data were then decomposed by independent component analysis (ICA) using the ‘runica’ function of the EEGlab toolbox. The decomposed data were manually inspected individually, and the non-neuronal originated artifacts such as components related to muscle activity and eye blinks were identified on the basis of their scalp topography and component activity power spectrum, and removed from the data set. Artifact-corrected data were then used to study event-related EEG responses. The data epochs time-locked to standard and deviant events were extracted from −200 to 800 ms relative to stimulus onset from the resulting continuous data signals. A baseline correction of 200 ms was applied. Event segments with amplitudes larger than ± 120 μ V o l t were removed for further analysis. On average, 1315 epochs per subject were accepted for further analyses.
In line with our primary objectives, the key analysis strategy involved determining our ability to extract somatosensory mismatch-related ERP responses. Additionally, we aimed to verify the following assumption in the case of adult patients with CP: the presence of sMMN, elicited at about 150–250 ms after the stimulus onset over the frontocentral regions, as either a negative or positive component [6,11,12], followed by LDN, a second component in the difference signal, at an approximate latency of 350 ms [25,40]. This assumption finds support in studies mostly involving healthy young and elderly adults. Therefore, a further statistical test was performed exclusively on the data obtained from patients. Wilcoxon signed-rank tests were performed on standard and deviant responses for each channel within two predefined time ranges, averaged across patients. The selected time ranges were between 150–250 ms for sMMN [12,41] and 350–450 ms for LDN [24] based on literature where mismatch-related activities are expected. The nonparametric test statistics determined the sum of the ranks of positive differences between the observations in the samples, in this case, the differences between the two traces obtained for frequent and infrequent stimuli.

3. Results

Figure 2 presents the stimulus onset-locked segments, separated from −200 to +800 ms taking the median, across the healthy participants. Each block in the top and middle panels represents the results from individual channels, showcasing ERPs for the standard (‘STD’) and deviant (‘DEV’) events along with their differences (‘DIFF’). The lower panel displays the scalp topographies of differences (deviant minus standard ERPs) in different time windows. The figure illustrates noticeable differences between the two ERP traces, confirming our experimental protocol qualitatively in the healthy cohort. This supports our further tests for the patients.
Equivalent to Figure 2, Figure 3 shows the median across patient stimulus onset-locked segments. The figure illustrates that there exist obvious differences between the two ERP traces. Although not shown in the figure, analysis of subject-specific ERPs reveals that irrespective of the age and gender of the participants in this study, the amplitude due to deviant stimulus response was higher than the amplitude due to standard stimulus response.
The distributions of the detected significant channels over the resulting time windows are visualized with the box plots presented in Figure 4 along with the scalp topographic maps. The left panel of Figure 4a shows the median trace for ’STD’ and ’DEV’ events and their differences for the channel F z ( p = 0.046 ) and the box plot for them over a time window of 150–250 ms. The right panel shows the same but for the channel P 4 ( p = 0.031 ). The distributions of the boxes and the separation of the medians of the boxes specified for ‘STD’ and ‘DEV ’events indicate the differences between the events. The middle panel illustrates the scalp topographic maps for the standard and deviant stimuli along with their differences over a time range of 150–250 ms. The upper rows of the middle panel show the median of the topography map for standard and deviant stimuli, while the lower row shows the difference between them. A difference in distributions for the standard and the deviant stimulus, especially larger variation due to deviant stimulus, supports the existence of sMMN within this time window. Additionally, the topographic map for the difference trace also supports that finding. Figure 4b shows the same but for the time window 350–450 ms for the statistically significant channels, i.e., F 4 ( p = 0.031 ) and P 4 ( p = 0.046 ) .

4. Discussion

Somatosensory evoked event-related potentials were recorded in healthy individuals and patients with cerebral palsy to verify the presence of mismatch-related ERP components especially in patients with CP. The central findings of the study are as follows:
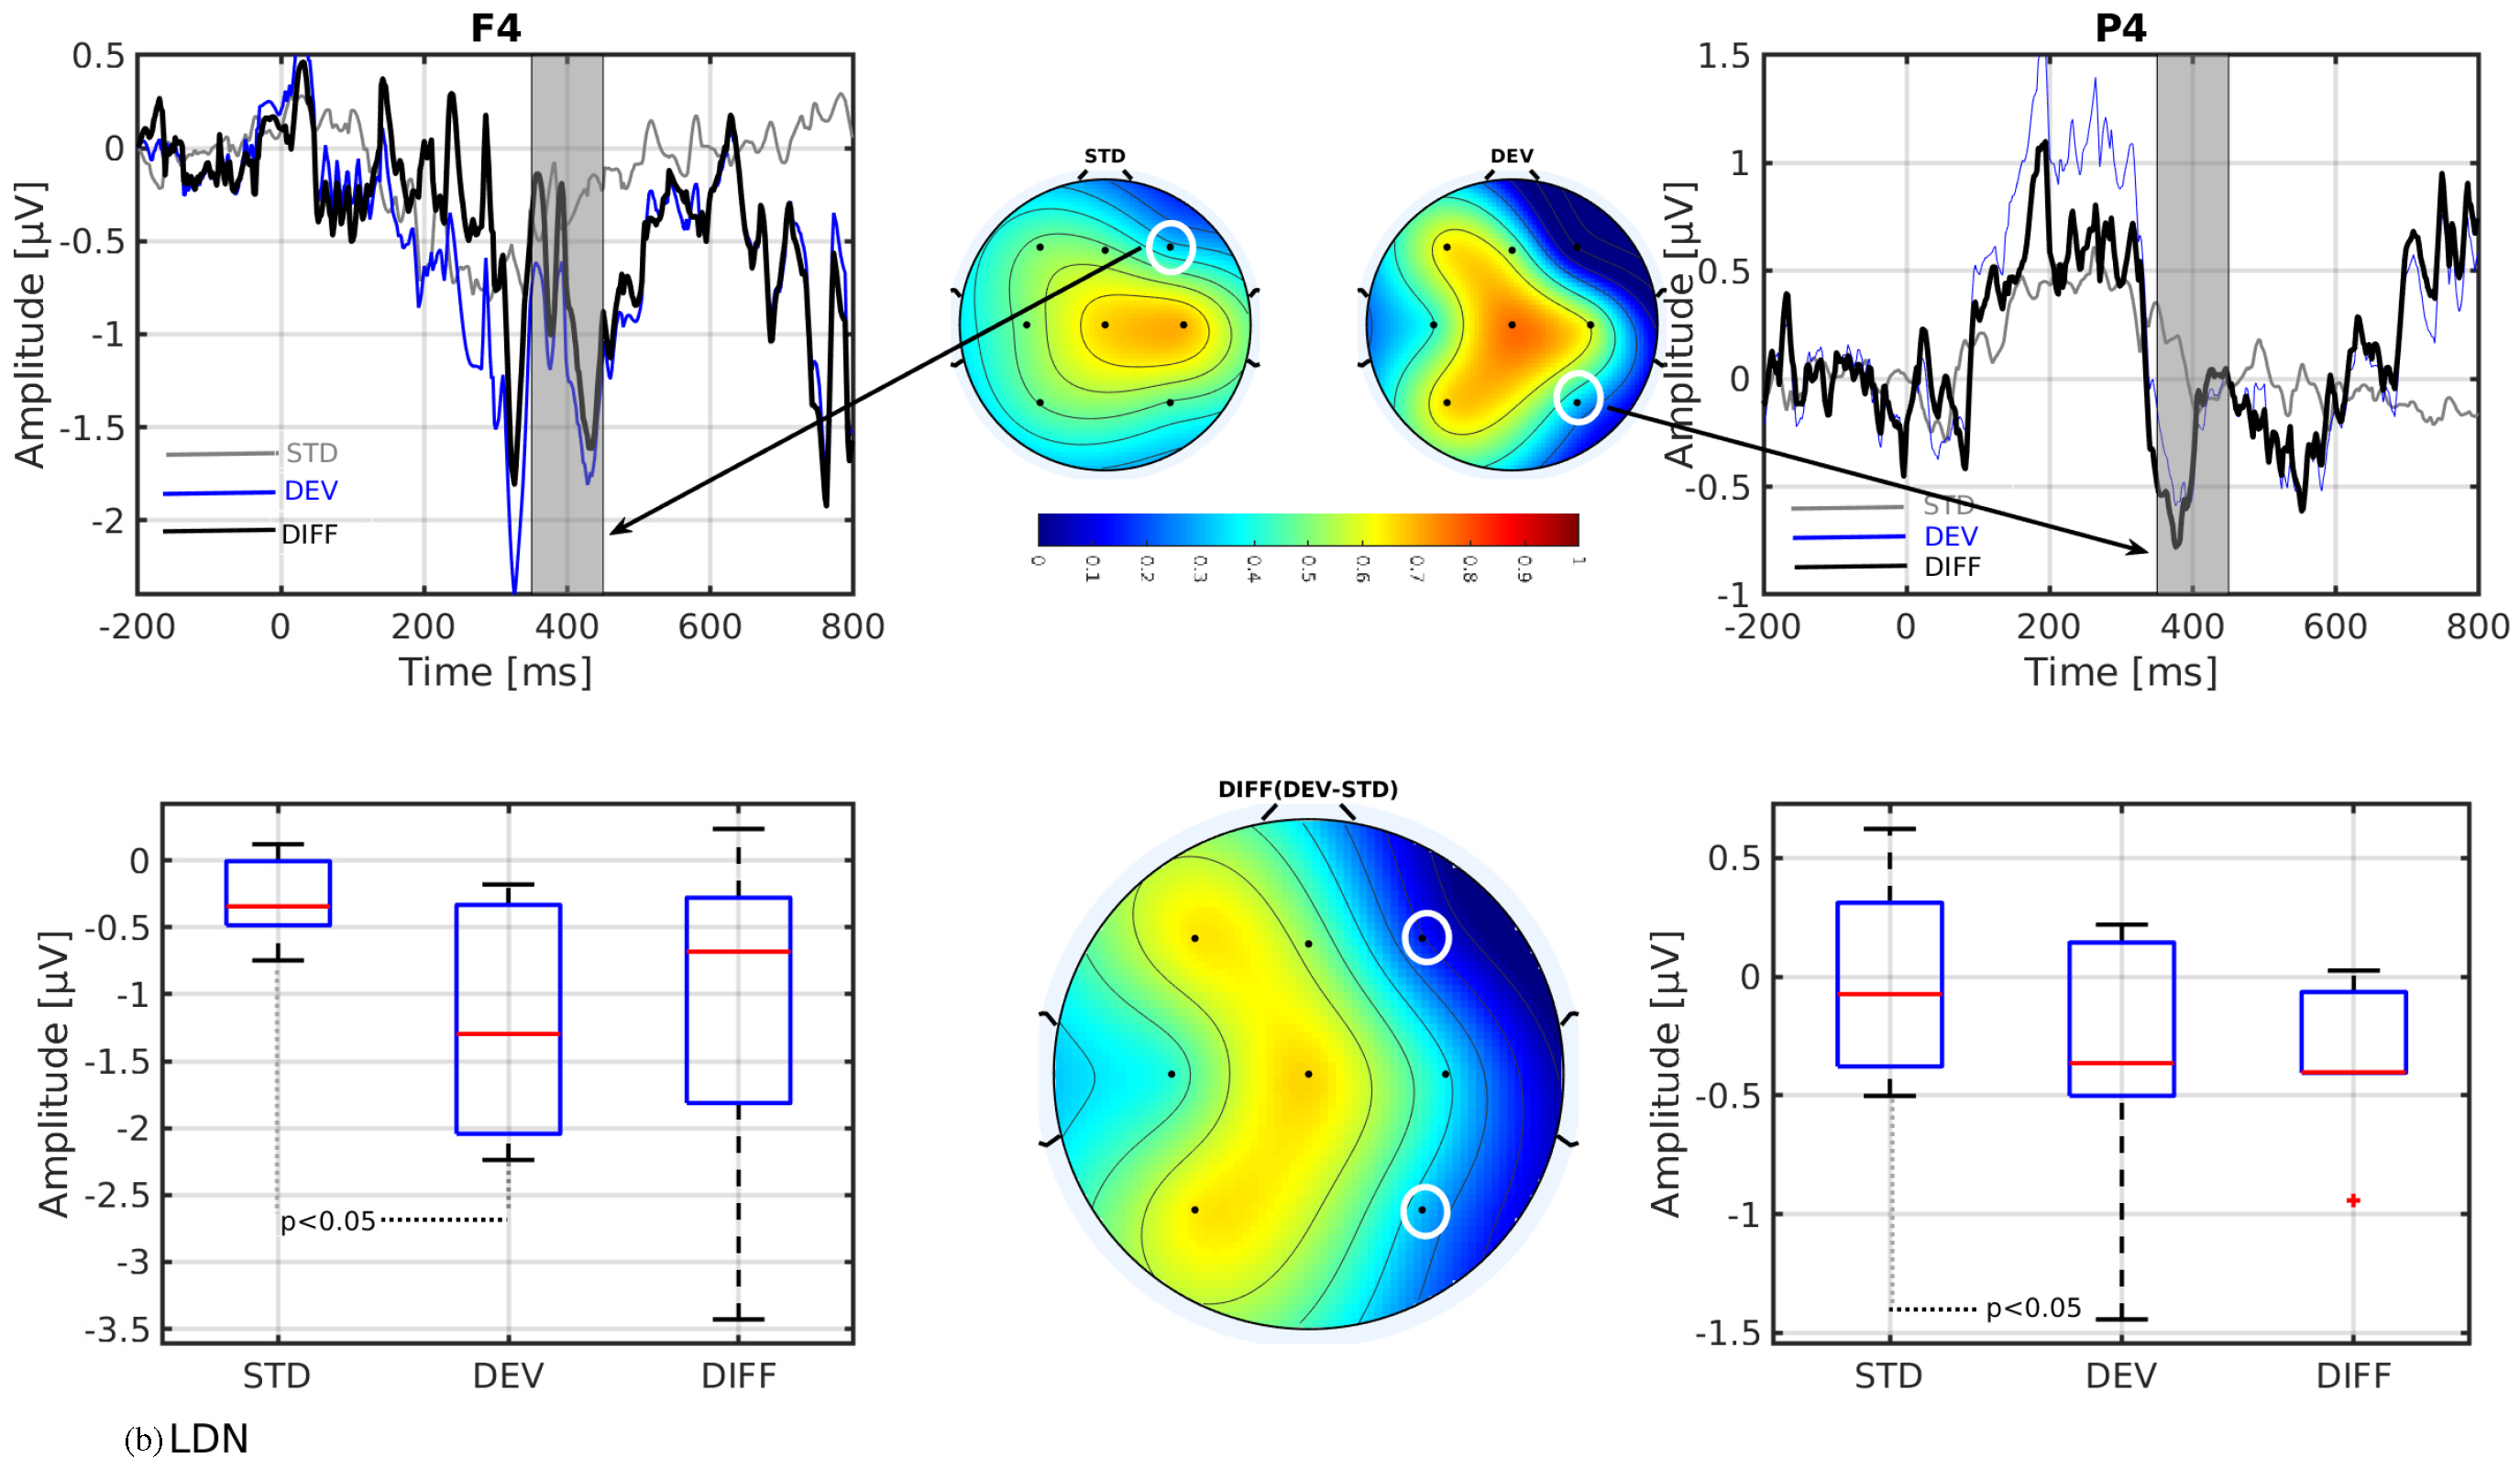
  • The mismatch-related somatosensory responses can be observed in patients with cerebral palsy.
  • In line with our assumption, the observed mismatch-related ERP components from frontal and parietal channels were statistically significant at two predefined latency ranges: F z and P 4 channels at 150–250 ms and F 4 and P 4 channels at 350–450 ms after the stimulus onset. The observed response in the time range of 150–250 ms is considered as sMMN, and the response in the time range of 350–450 ms is considered as LDN. In terms of time window and channel location, these findings are qualitatively in good agreement with the studies involving healthy adults [21,25].
In an early study on auditory MMN, Giar et al. [42] proposed that MMN rises at around 100–150 ms after stimulus onset and peaks at around 200–250 ms over the frontocentral areas of the scalp. Later on, further studies confirmed that auditory MMN is generated in the temporal and frontal areas [34]. In most somatosensory studies, MMN has been confirmed over the frontocentral regions as either a negative or positive component at about 100–250 ms of latency [7,11,12]. Some other studies found mismatch-related ERP responses at two separate latencies. For example, Strömmer et al. [6] found sMMN centroparietally at 180–220 ms and frontocentrally at 250–290 ms after the stimulus onset in adults (22–36 years). Spackman et al. [12] reported a frontocentral negative peak at 100–200 ms, followed by a centroparietal positive shift at 150–250 ms to vibrotactile presented changes in duration and frequency. On the other hand, Akatsuka et al. [7,43] found a significantly enhanced sMMN in early negativity (30–70 ms) and later a positive peak at 100–200 ms after stimulus. Similarly, Butler et al. [41] reported an sMMN response over the frontal midline scalp with two phases of MMN waveform: an earlier negative peak at ∼145 ms, followed by a positive peak at ∼235 ms. Our present sMMN peak between 150 and 250 ms agrees with the findings of Strömmer et al. [6], and the appeared peak between 350 and 450 ms is likely representing LDN [25,44].
The results indicate the presence and observability of mismatch-related components in the case of patients with CP. Nevertheless, this study has certain limitations that should be explored and addressed in subsequent research.
A central limitation is the relatively small and inhomogeneous patient cohort. While this limitation does not affect the main finding of this study, the data provide insufficient power for more in-depth investigations. A larger patient cohort would, for instance, enable the examination of relationships between clinical parameters, such as somatosensory impairments, and the expression of mismatch-related ERP responses, providing an important basis for the establishment of mismatch-related ERP responses as diagnostic or monitoring biomarkers in CP. Another limitation relates to the fixed interstimulus interval (ISI) rather than a randomized ISI, which is typically favored in the design of ERP studies. While a definite confirmation of whether this has an effect on the observed mismatch-related ERP responses requires further research, we expect, if at all, a randomized ISI to lead to a rather larger effect size relative to a fixed ISI due to the habituation effect. Therefore, we expect the findings to be equivalent, if not more pronounced in case of a randomized ISI.
Despite the limitations, our study provides evidence for the reliable measurement of sMMN in patients with CP. With this simplistic experimental setup, our results indicate the feasibility of successfully measuring sMMN in patients with CP, who typically have limited attention span. The paradigm may also be suitable for children with CP, which, however, requires further thorough investigation. Due to the ongoing development of a child’s brain, it is reasonable to assume that brain waves are distributed differently than in adults, and therefore, the response to stimulation is likely to be different. Therefore, experiments should be conducted separately across different age groups, and in general, a larger number of patients are needed. While the current study does not establish a basis for predicting the extent of somatosensory impairments through sMMN, our results still offer a valuable starting point for the advancement of diagnostic or therapeutic tools. Mismatch responses may be used to probe for somatosensory impairments in CP patients, or monitor changes in somatosensory perception as a result of sensorimotor rehabilitation, which has been performed in healthy subjects [45,46].

Author Contributions

Conceptualization, S.R., S.K.E. and R.L.; methodology, S.R. and S.K.E.; formal analysis, S.R.; resources, R.L.; data curation, R.L.; writing—original draft preparation, S.R.; writing—review and editing, S.K.E. and R.L.; supervision, R.L.; project administration, R.L.; funding acquisition, R.L. All authors have read and agreed to the final version of the manuscript.

Funding

This research was supported by funds provided by the Buhl-Strohmaier Foundation and the Würth Foundation. The experimental work was supported by the Leonhard Lorenz Foundation.

Institutional Review Board Statement

The study was conducted in accordance with the Declaration of Helsinki, and the experiment and all its procedures related to patients’ data privacy and personal interests were approved by the Ethics Committee of the Faculty of Medicine of the Technical University of Munich (Number: 582/16 S).

Informed Consent Statement

Participation in this study was voluntary. Informed written consent was obtained from all the participants involved in the study.

Data Availability Statement

The data set generated and/or analyzed during the current study is available from the corresponding author on reasonable request.

Acknowledgments

The authors would like to thank the participants for their time and support for this study. The authors sincerely acknowledge the support received from Ana Alves Pinto, for the EEG data collection, part of the experimental fund acquisition, and her valuable suggestions.

Conflicts of Interest

Stefan K. Ehrlich was employed by the company SETLabs Research GmbH, Healthcare Technologies. The remaining authors declare that the research was conducted in the absence of any commercial or financial relationships that could be construed as a potential conflict of interest. The funders had no role in the design of the study; in the collection, analyses, or interpretation of data; in the writing of the manuscript; or in the decision to publish the results.

References

  1. Näätänen, R.; Jacobsen, T.; Winkler, I. Memory-based or afferent processes in mismatch negativity (MMN): A review of the evidence. Psychophysiology 2005, 42, 25–32. [Google Scholar] [CrossRef]
  2. Schröger, E. Measurement and interpretation of the mismatch negativity. Behav. Res. Methods Instrum. Comput. 1998, 30, 131–145. [Google Scholar] [CrossRef]
  3. Näätänen, R.; Gaillard, A.; Mäntysalo, S. Early selective-attention effect on evoked potential reinterpreted. Acta Psychol. 1978, 42, 313–329. [Google Scholar] [CrossRef]
  4. Tales, A.; Troscianko, T.; Wilcock, G.K.; Newton, P.; Butler, S.R. Agerelated changes in the preattentional detection of visual change. Neuroreport 2002, 13, 969–972. [Google Scholar] [CrossRef] [PubMed]
  5. Lorenzo-Lopez, L.; Amenedo, E.; Pazo-Alvarez, P.; Cadaveira, F. Preattentive detection of motion direction changes in normal aging. Neuro Rep. 2004, 15, 2633–2636. [Google Scholar] [CrossRef]
  6. Strömmer, J.M.; Tarkka, I.M.; Astikainen, P. Somatosensory mismatch response in young and elderly adults. Front. Aging Neurosci. 2014, 6, 293. [Google Scholar] [CrossRef]
  7. Akatsuka, K.; Wasaka, T.; Nakata, H.; Inui, K.; Hoshiyama, M.; Kakigi, R. Mismatch responses related to temporal discrimination of somatosensory stimulation. Clin. Neurophysiol. 2005, 116, 1930–1937. [Google Scholar] [CrossRef]
  8. Astikainen, P.; Ruusuvirta, T.; Korhonen, T. Somatosensory event-related potentials in the rabbit cerebral and cerebellar cortices: A correspondence with mismatch responses in humans. Neurosci. Lett. 2001, 298, 222–224. [Google Scholar] [CrossRef] [PubMed]
  9. Czigler, I.; Balázs, L.; Winkler, I. Memory-based detection of task-irrelevant visual changes. Psychophysiology 2002, 39, 869–873. [Google Scholar] [CrossRef] [PubMed]
  10. Li, X.; Lu, Y.; Sun, G.; Gao, L.; Zhao, L. Visual mismatch negativity elicited by facial expressions: New evidence from the equiprobable paradigm. Behav. Brain Funct. 2012, 8, 7. [Google Scholar] [CrossRef]
  11. Kekoni, J.; Hämäläinen, H.; Saarinen, M.; Gröhn, J.; Reinikainen, K.; Lehtokoski, A.; Näätänen, R. Rate effect and mismatch responses in the somatosensory system: ERP-recordings in humans. Biol. Psychol. 1997, 46, 125–142. [Google Scholar] [CrossRef]
  12. Spackman, L.; Boyd, S.; Towell, A. Effects of stimulus frequency and duration on the somatosensory mismatch negativity. Clin. Neurophysiol. 2007, 118, e175. [Google Scholar] [CrossRef]
  13. Novitski, N.; Tervaniemi, M.; Huotilainen, M.; Näätänen, R. Frequency discrimination at different frequency levels as indexed by electrophysiological and behavioral measures. Cogn. Brain Res. 2004, 20, 26–36. [Google Scholar] [CrossRef]
  14. Shafer, V.; Yu, Y.; Garrido-Nag, K. Neural mismatch indices of vowel discrimination in monolingually and bilingually exposed infants: Does attention matter? Neurosci. Lett. 2012, 526, 10–14. [Google Scholar] [CrossRef]
  15. Rinker, T.; Kohls, G.; Richter, C.; Maas, V.; Schulz, E.; Schecker, M. Abnormal frequency discrimination in children with SLI as indexed by mismatch negativity (MMN). Neurosci. Lett. 2007, 413, 99–104. [Google Scholar] [CrossRef]
  16. Stothart, G.; Tales, A.; Kazanina, N. Evoked potentials reveal age-related compensatory mechanisms in early visual processing. Neurobiol. Aging 2013, 34, 1302–1308. [Google Scholar] [CrossRef] [PubMed]
  17. Tales, A.; Haworth, J.; Wilcock, G.; Newton, P.; Butler, S. Visual mismatch negativity highlights abnormal pre-attentive visual processing in mild cognitive impairment and Alzheimer’s disease. Neuropsychologia 2008, 46, 1224–1232. [Google Scholar] [CrossRef] [PubMed]
  18. Whittle, S.; Yücel, M.; Yap, M.B.; Allen, N.B. Sex differences in the neural correlates of emotion: Evidence from neuroimaging. Biol. Psychol. 2011, 87, 319–333. [Google Scholar] [CrossRef] [PubMed]
  19. Yang, X.; Yu, Y.; Chen, L.; Sun, H.; Qiao, Z.; Qiu, X.; Zhang, C.; Wang, L.; Zhu, X.; He, J.; et al. Gender differences in pre-attentive change detection for visual but not auditory stimuli. Clin. Neurophysiol. 2016, 127, 431–441. [Google Scholar] [CrossRef]
  20. Näätänen, R. Somatosensory mismatch negativity: A new clinical tool for developmental neurological research? Dev. Med. Child Neurol. 2009, 51, 930–931. [Google Scholar] [CrossRef]
  21. Shen, G.; Weiss, S.M.; Meltzoff, A.N.; Marshall, P.J. The somatosensory mismatch negativity as a window into body representations in infancy. Int. J. Psychophysiol. 2018, 134, 144–150. [Google Scholar] [CrossRef] [PubMed]
  22. Shinozaki, N.; Yabe, H.; Sutoh, T.; Hiruma, T.; Kaneko, S. Somatosensory automatic responses to deviant stimuli. Brain Res. Cogn. Brain Res. 1998, 7, 165–171. [Google Scholar] [CrossRef]
  23. Tamura, Y.; Hoshiyama, M.; Inui, K.; Nakata, H.; Wasaka, T.; Ojima, S.; Inoue, K.; Kakigi, R. Cognitive processes in two-point discrimination: An ERP study. Clin. Neurophysiol. 2004, 115, 1875–1884. [Google Scholar] [CrossRef] [PubMed]
  24. Cheour, M.; Korpilahti, P.; Martynova, O.; Lang, A.H. Mismatch Negativity and Late Discriminative Negativity in Investigating Speech Perception and Learning in Children and Infants. Audiol. Neurotol. 2001, 6, 2–11. Available online: https://karger.com/aud/article-pdf/6/1/2/2249646/000046804.pdf (accessed on 26 October 2023). [CrossRef] [PubMed]
  25. Petermann, M.; Kummer, P.; Burger, M.; Lohscheller, J.; Eysholdt, U.; Döllinger, M. Statistical detection and analysis of mismatch negativity derived by a multi-deviant design from normal hearing children. Hear. Res. 2009, 247, 128–136. [Google Scholar] [CrossRef] [PubMed]
  26. Bishop, D.V.; Hardiman, M.J.; Barry, J.G. Is auditory discrimination mature by middle childhood? A study using time-frequency analysis of mismatch responses from 7 years to adulthood. Dev. Sci. 2011, 14, 402–416. Available online: https://onlinelibrary.wiley.com/doi/pdf/10.1111/j.1467-7687.2010.00990.x (accessed on 27 October 2023). [CrossRef] [PubMed]
  27. Čeponienė, R.; Lepistö, T.; Soininen, M.; Aronen, E.; Alku, P.; Näätänen, R. Event-related potentials associated with sound discrimination versus novelty detection in children. Psychophysiology 2004, 41, 130–141. Available online: https://onlinelibrary.wiley.com/doi/pdf/10.1111/j.1469-8986.2003.00138.x (accessed on 26 October 2023). [CrossRef]
  28. Schulte-Körne, G.; Deimel, W.; Bartling, J.; Remschmidt, H. Speech perception deficit in dyslexic adults as measured by mismatch negativity (MMN). Int. J. Psychophysiol. 2001, 40, 77–87. [Google Scholar] [CrossRef]
  29. Kropotov, J.D. Chapter 18—Schizophrenia; Academic Press: San Diego, CA, USA, 2009; pp. 420–431. [Google Scholar] [CrossRef]
  30. Rüsseler, J.; Münte, T. Kognitive Potenziale (ereigniskorrelierte Potenziale, EKP). Evozierte Potenziale, Neurovegetative Diagnostik, Okulographie; Buchner, H., Noth, J., Eds.; Georg Thieme Verlag KG: Stuttgart, Germany, 2005; Chapter 7; pp. 80–94. [Google Scholar] [CrossRef]
  31. Kurz, M.J.; Heinrichs-Graham, E.; Arpin, D.J.; Becker, K.M.; Wilson, T.W. Aberrant synchrony in the somatosensory cortices predicts motor performance errors in children with cerebral palsy. J. Neurophysiol. 2014, 111, 573–579. [Google Scholar] [CrossRef]
  32. Hoon, A.H., Jr.; Stashinko, E.E.; Nagae, L.M.; Lin, D.D.M.; Keller, J.; Bastian, A.; Campbell, M.L.; Levey, E.; Mori, S.; Johnston, M.V. Sensory and motor deficits in children with cerebral palsy born preterm correlate with diffusion tensor imaging abnormalities in thalamocortical pathways. Dev. Med. Child Neurol. 2009, 51, 697–704. [Google Scholar] [CrossRef]
  33. Matusz, P.J.; Key, A.P.; Gogliotti, S.; Pearson, J.; Auld, M.L.; Murray, M.M.; Maitre, N.L. Somatosensory Plasticity in Pediatric Cerebral Palsy following Constraint-Induced Movement Therapy. Neural Plast. 2018, 2018, 1891978. [Google Scholar] [CrossRef]
  34. Restuccia, D.; Della Marca, G.; Valeriani, M.; Leggio, M.G.; Molinari, M. Cerebellar damage impairs detection of somatosensory input changes. A somatosensory mismatch-negativity study. Brain 2007, 130 Pt 1, 276–287. [Google Scholar] [CrossRef] [PubMed]
  35. Hakkarainen, E.; Pirilä, S.; Kaartinen, J.; Meere, J. Stimulus evaluation, event preparation, and motor action planning in young patients with mild spastic cerebral palsy: An event-related brain potential study. J. Child Neurol. 2012, 27, 465–470. [Google Scholar] [CrossRef]
  36. Lackner, C.; Gorter, J.; Segalowitz, S. Cognitive Event-Related Potentials in Young Adults With Cerebral Palsy: A Proof-of-Concept Study. Clin. EEG Neurosci. 2024, 55, 64–75. [Google Scholar] [CrossRef]
  37. Palisano, R.; Rosenbaum, P.; Walter, S.; Russell, D.; Wood, E.; Galuppi, B. Development and reliability of a system to classify gross motor function in children with cerebral palsy. Dev. Med. Child Neurol. 1997, 39, 214–223. [Google Scholar] [CrossRef] [PubMed]
  38. Eliasson, A.; Krumlinde-Sundholm, L.; Rösblad, B.; Beckung, E.; Arner, M.; Ohrvall, A.; Rosenbaum, P. The Manual Ability Classification System (MACS) for children with cerebral palsy: Scale development and evidence of validity and reliability. Dev. Med. Child Neurol. 2006, 48, 549–554. [Google Scholar] [CrossRef] [PubMed]
  39. Ruffini, G.; Dunne, S.; Farres, E.; Marco-Pallares, J.; Ray, C.; Mendoza, E.; Silva, R.; Grau, C. A dry electrophysiology electrode using CNT arrays. Sens. Actuators A Phys. 2006, 132, 34–41. [Google Scholar] [CrossRef]
  40. Garrido, M.; Kilner, J.; Stephan, K.; Friston, K. The mismatch negativity: A review of underlying mechanisms. Clin. Neurophysiol. 2009, 120, 453–463. [Google Scholar] [CrossRef]
  41. Butler, J.; Molholm, S.; Fiebelkorn, I.; Mercier, M.; Schwartz, T.; Foxe, J. Common or redundant neural circuits for duration processing across audition and touch. J. Neurosci. 2011, 31, 3400–3406. [Google Scholar] [CrossRef]
  42. Giard, M.; Perrin, F.; Pernier, J.; Bouchet, P. Brain generators implicated in the processing of auditory stimulus deviance: A topographic event-related potential study. Psychophysiology 1990, 27, 627–640. [Google Scholar] [CrossRef]
  43. Akatsuka, K.; Wasaka, T.; Nakata, H.; Kida, T.; Kakigi, R. The effect of stimulus probability on the somatosensory mismatch field. Exp. Brain Res. 2007, 181, 607–614. [Google Scholar] [CrossRef] [PubMed]
  44. Makeig, S.; Jung, T.; Bell, A.; Gharemani, D.; Sejnowski, T. Blind separation of auditory event-related brain responses into independent components. Proc. Natl. Acad. Sci. USA 1997, 94, 10979–10984. [Google Scholar] [CrossRef] [PubMed]
  45. Xide, Y.; Tao, L.; Dingguo, G. The Mismatch Negativity: An Indicator of Perception of Regularities in Music. Behav. Neurol. 2015, 2015, 469508. [Google Scholar] [CrossRef]
  46. Näätänen, R.; Paavilainen, P.; Rinne, T.; Alho, K. The mismatch negativity (MMN) in basic research of central auditory processing: A review. Clin. Neurophysiol. 2007, 118, 2544–2590. [Google Scholar] [CrossRef] [PubMed]
Figure 1. (a) Schematic illustration of the stimulus sequence of the standard and deviant stimulus used for the ERP experiment. A sequence of vibrations was delivered with 1 s intervals mostly to the ring finger denoted as standard stimulus (gray filled block); 10 % of them were delivered to the thumb finger, denoted as deviant stimulus (black filled block). The difference in waveforms between the ERP responses to deviant stimuli and standard stimuli is mismatch-related ERP response. The processed signals were separated from −200 to +800 ms by the deviant and standard stimulus. (b) An EEG montage with 8 electrodes (frontal, central, and parietal) was used in the experiment.
Applsci 14 01030 g001
Figure 2. Top and middle panels: median traces of event-related potentials and their differences across the healthy participants for different channels. Traces for standard stimuli are represented with a gray line, for deviant stimuli with a blue line, and for differences with a black line. STD—standard; DEV—deviant; DIFF—difference. Lower panel: spatial topography of activation patterns (difference: deviant minus standard) for different time frames.
Applsci 14 01030 g002
Figure 3. Top and middle panels: median traces of event-related potentials and their differences across the patients for different channels. Traces for standard stimuli are represented with a gray line, for deviant stimuli with a blue line, and for differences with a black line. STD—standard; DEV—deviant; DIFF—difference. Lower panel: spatial topography of activation patterns (difference: deviant minus standard) on different time windows.
Applsci 14 01030 g003
Figure 4. (a) The left and right panels show the distributions for the statistically significant channels, e.g., F z and P 4 , along with their box plots for the time window 150–250 ms. The middle panel shows the scalp topographic maps for this time window. STD—standard; DEV—deviant; DIFF—deviant minus standard. (b) The same but for the statistically significant channels, e.g., F z and P 4 , for the time window 350–450 ms.
Applsci 14 01030 g004aApplsci 14 01030 g004b
Table 1. Demographic characteristics of enrolled participants and diagnosis classifications of their mobility according to GMFCS and according to their hand’s performance in daily life, i.e., MACS level.
ParticipantGenderAgeGMFCSMACSMACSDiagnosis
Year LR
P01Female23I41Unilateral CP
P02Male45III11Bilateral CP
P03Male39III33Bilateral CP
P04Male36IV44Bilateral CP
P05Female53IV22Ataxic CP
P06Female47II24Unilateral spastic CP
P07Male25III22Bilateral spastic CP
Disclaimer/Publisher’s Note: The statements, opinions and data contained in all publications are solely those of the individual author(s) and contributor(s) and not of MDPI and/or the editor(s). MDPI and/or the editor(s) disclaim responsibility for any injury to people or property resulting from any ideas, methods, instructions or products referred to in the content.

