Abstract
This study aims to optimize the sustainable utilization of excavated soil by incorporating it exclusively as a fine aggregate and cement in the formulation of soil-based controlled low-strength materials. The polycarboxylate superplasticizer was introduced to enhance flowability. Various factors, including the cement contents, initial water contents, and curing time, were systematically analyzed for their effects on the fresh properties, mechanical parameters, transverse relaxation time distribution, pore size distribution, porosity, and corrosivity of soil-based controlled low-strength materials. The results indicate that polycarboxylate superplasticizer effectively dispersed clay minerals and cement particles, enhancing the flowability. The unconfined compressive strength increased with the rising cement content and decreased with the increasing initial water content. Additionally, the transverse relaxation time distribution curves of the soil-based controlled low-strength materials exhibited two peaks. These curves shifted to smaller transverse relaxation time values with the increasing cement content, while gradually shifting to larger transverse relaxation time values with the increasing initial water content. An increase in the cement content resulted in higher volume percentages of small and mesopores, while extra-large pores and macropores decreased. The addition of the polycarboxylate superplasticizer had minimal impact on the pore volume percentage distribution. Furthermore, porosity experienced a decline with the rise in the cement content and curing time, in contrast to a notable increase with a higher initial water content. This investigation provides valuable insights into the engineering properties and microstructural characteristics of soil-based controlled low-strength materials, offering a foundation for sustainable waste management practices in geotechnical applications.
1. Introduction
Controlled low-strength materials (CLSMs) are flowable, self-compacting, self-levelling cementitious backfill materials [1]. They typically consist of coarse aggregates, cementitious materials, by-products (usually fly ash), water, and additional additives. CLSMs have demonstrated effectiveness as a backfill material, replacing compacted soil in various countries [2]. The constituents and mix proportions of CLSMs are not explicitly defined, relying on trial and error to achieve the desired properties, such as flowability, strength, and density [3].
The escalation of construction activities annually results in substantial amounts of surplus excavated soil [4]. The excavated soil is challenging to use directly and has to be transported to stacking sites or landfills. This not only increases project expenses, but also poses environmental threats, particularly in urban areas. To address the disposal of excavated soil, increased attention has been given to its potential use as a partial substitute for fine aggregate in CLSMs. CLSMs incorporating soil are referred to as soil-based CLSMs, soil cement slurry, and ready-mixed soil materials [5]. Various research highlights the successful application of the excavated soil as a constituent in CLSMs [5,6]. For example, the high-plasticity clays could be utilized for the preparation of CLSMs [6].
Flowability is a crucial parameter for evaluating the workability of CLSMs. Both the water content and fine particle content play pivotal roles in the flow value of soil-based CLSMs [7]. Due to the high water absorption capacity of clay fines in soil, soil only partially replaces the fine aggregate in CLSMs, with a small mix proportion of soil in soil-based CLSMs [8]. Specifically, the proportion of excavated soil classified as silty sand should not exceed 30% when substituting for ponded ash in CLSMs [9]. Wu and Lee [10] pointed out that in general, flowability is primarily controlled by the amount of water. They observed an increase in flowability with a higher ratio of water to solid, recommending optimal ratios of 0.5~0.7 for cement to water and 0.7 for water to solid, considering flowability, strength, and bleeding. In cases where the added water was fixed, the proportion of excavated soil increased from 10% to 40%, resulting in a reduction in the flowability of the mixture approximately from 275 mm to 161 mm [9]. However, the water added to enhance flowability often surpasses the requirements for cement hydration, leading to excess water and subsequent strength reduction [10]. The research on using only clayey soils as aggregates in soil-based CLSMs is limited [6,10].
Polycarboxylate superplasticizer (PCE) is widely utilized in concrete engineering for its superior water reducing rate [11]. It effectively absorbs and disperses cement particles, reducing water consumption and enhancing the concrete strength. PCE has been recommended to decrease the water demand of CLSMs [12]. Tan, et al. [13] noted that the CLSMs prepared from coarse-grained soils with PCE showed superior flowability compared to the mixture with sulfonated acetone formaldehyde (SAF) within 30 min. They pointed out that the water-reducing effect of PCE was superior to that of SAF. Nevertheless, practical application revealed that the clay particles in sand and gravel aggregates can compromise PCE’s water-reducing effectiveness [14]. In specific instances, the plasticizer Pozzolith 475N, applied at a dosage of 1.5% by weight of cement, did not significantly impact flowability due to the high water content and low cement content in CLSMs [15]. Jian, et al. [16] confirmed that PCE cannot effectively reduce water consumption in soil-based CLSMs. Clay minerals, particularly montmorillonite, exhibit a higher PCE adsorption capacity than cement particles, attributed to their layered structure [17]. The competitive adsorption of PCE between clay particles and cement ultimately diminishes PCE’s effectiveness. Therefore, the effectiveness of PCE in mixtures containing clay particles remains controversial. The water-reducing effect of PCE in soil-based CLSMs on the flowability and strength of soil-based CLSMs needs to be further investigated.
The existing literature on soil-based CLSMs predominantly focuses on their preparation and strength, while research on the pore structure of soil-based CLSMs is still in its early stages. Mercury intrusion porosimetry (MIP) is a traditional method for quantitatively studying the microscopic pore structure of tested samples [18]. The intrusion of mercury under high pressure in MIP can disrupt the sample structure, leading to inaccurate estimates of the pore size distribution and porosity [19]. Additionally, the presence of clusters of smaller pores within a continuous network of larger pores can result in the pore shielding effect, causing temporary mercury entrapment and increasing uncertainty in the test results [20]. In contrast, low-field nuclear magnetic resonance (NMR) utilizes hydrogen protons as probes to measure the pore size distribution and porosity of samples in a low external magnetic field [21]. This technique offers advantages such as rapidity, accuracy, reusability, and non-destructiveness. Low-field NMR has been successfully applied to study porous materials like cement-based materials [21], coal [22], and rock [23].
This study explored the feasibility of producing soil-based CLSMs using excavated soil as the sole fine aggregate and cement. PCE was employed as a substitute for water to enhance the flowability of soil-based CLSMs. The influence of varying cement contents, initial water contents, and the curing time on the mechanical properties and corrosivity of soil-based CLSMs with PCE was investigated. Furthermore, the transverse relaxation time T2 distribution, pore size distribution and porosity were analyzed through low-field NMR, revealing the microscopic mechanism of strength development in soil-based CLSMs with PCE.
2. Materials and Methods
2.1. Raw Materials
The excavated soil was obtained from a construction site on Jinsha West Road, Shantou, Guangdong Province, China. The particle size distribution curve was determined using laser diffraction analysis and the screening method, as shown in Figure 1a. The maximum particle size of the excavated soil was 5 mm. The particle size analysis provides the content percentages of clay (<0.005 mm), silt (0.005–0.075 mm), sand (0.075–2 mm), and gravel (>2 mm) in the excavated soil, as presented in Table 1. The natural water content of the excavated soil was 38.8%. The liquid limit wL, plastic limit wP, and plasticity index IP of the excavated soil were 31%, 14.6%, and 16.4%, respectively, determined by Atterberg limit tests according to the Chinese standard GB/T 50123-2019 [24]. In accordance with ASTM D2487 [25], the excavated soil was classified as SM in the unified soil classification system (USCS). X-ray Diffraction (XRD) spectra revealed that the excavated soil primarily consisted of quartz, kaolinite, and mullite, as shown in Figure 1b. The identification of quartz, kaolinite, and mullite was based on the powder diffraction file (PDF) from the International Centre for Diffraction Data. Ordinary Portland cement 42.5 was selected as the cementitious material for soil-based CLSMs. The chemical composition and physical properties of the cement, provided by Jiuqi Building Materials Co., Ltd. (Zhucheng, China), are summarized in Table 2.
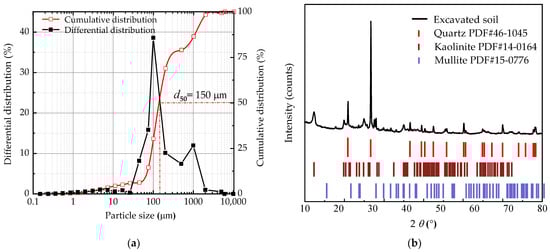
Figure 1.
Properties of the excavated soil: (a) particle size distribution; (b) XRD spectra.

Table 1.
Properties of excavated soil [in %].
Table 2.
Chemical composition and physical properties of cement [in %]
Polycarboxylate superplasticizer (PCE) was a lightly yellowish solid powder with a bulk density of 600 ± 100 kg/m3, provided by Suzhou Fuclear Technology Co., Ltd. (Suzhou, China). This environmentally friendly additive complies with ISO 14001 [26] certificates and significantly reduces water consumption. The water reduction achieved by PCE for cement mortar reaches up to 30%. PCE was integrated into soil-based CLSMs to reduce the water requirements and enhance the flowability of the mixture.
2.2. Mixture Proportion Optimization and Test Methods
The flowability of soil-based CLSMs is significantly influenced by both the cement content and initial water content. The American Concrete Institute suggests that the flowability of the fresh CLSM mixture should be greater than 200 mm [1]. A preliminary experiment was conducted to assess the flowability, involving the variation of the PCE contents across different initial water contents and cement contents. The excavated soil, ordinary Portland cement, water, and the prescribed quantity of PCE were proportionally added to a cement mortar mixer. The flow value of the soil-based CLSM was promptly measured after the thorough mixing of all raw materials. The PCE content was iteratively adjusted at different cement and initial water contents through a trial-and-error approach until the flow value of the soil-based CLSM exceeded 200 mm. Subsequently, a series of laboratory tests were conducted to investigate the mechanical properties and microstructure of the soil-based CLSM.
2.2.1. Mixture Proportions
The mixture proportions, with flowability exceeding 200 mm, are presented in Table 3. The initial water content represents the proportion of water mass to dry soil mass (in percentage). The cement content is the proportion of cement mass to dry soil mass (in percentage). The PCE content is the proportion of PCE mass to the total mass of dry soil and cement (in percentage). T1 and T2 were designed to investigate the effect of PCE on both flowability and strength. T2, T3, T4, T5, and T6 were designed to examine the impact of a varying cement content. T2, T7, T8, and T9, corresponding to 38.8% (natural water content), 46.5% (1.5 wL), 62% (2 wL), and 80% (2.58 wL), respectively, were designed to assess the influence of the initial water content. The selection of 80% water content was based on the observation that, at this initial water content (with a cement content of 8%), the flow value of the mixture could exceed 200 mm without the addition of PCE.
Table 3.
Mix proportions of soil-based CLSMs.
2.2.2. Sample Preparation and Test Methods
The flow value was measured in accordance with ASTM D6103 [27]. The fresh soil-based CLSM was poured into an open-ended polyvinyl chloride (PVC) cylinder (75 mm in diameter, 150 mm in height). The cylinder was lifted vertically within 5 s, allowing the mixture to flow into a patty. The diameter of the resulting slurry patty was measured in two perpendicular directions using a vernier caliper, as shown in Figure 2. The fresh density was determined using a cylinder mold (50 mm in diameter, 100 mm in height) in triplicate. The specimens were cast in PVC molds (50 mm in diameter, 100 mm in height). To prevent leakage, cling film was applied to the bottom of the PVC molds. Upon introducing the cement to the excavated soil, the resulting mixture (labeled T1) quickly formed a floc, rendering it non-fluid. The T1 samples were compacted layer by layer in the PVC molds. After 24 h, all samples were demolded and covered with PVC plastic bags to prevent water exchange with the curing environment. Subsequently, they were placed in a curing box with a temperature of 20 ± 1 °C and a relative humidity exceeding 95% until the desired curing time (7, 14, and 28 days) was achieved.
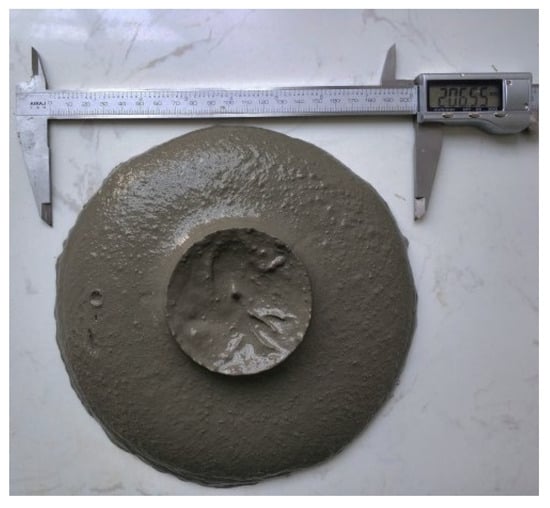
Figure 2.
Flow consistency test.
Unconfined compressive strength tests were conducted using an electro-hydraulic servo universal testing machine (WDW-100Y), with a loading rate of 1.0 mm/min, adhering to the Chinese standard GB/T 50123-2019. The strength tests were conducted in triplicate, and the average was adopted. The strain corresponding to the peak strength in the stress–strain curve is denoted as the failure strain εf. The deformation modulus E50 was calculated using Equation (1) [28].
where represents the stress corresponding to half of the failure strain obtained from the stress–strain curves, in kPa. The peak strain energy Eu is defined as the area under the stress–strain curve up to the peak strength.
X-ray diffraction (XRD) spectra of the dry excavation soil powder were obtained using the X-ray diffractometer (D8 Discover, Bruker Corporation, Germany; with Cu Kα radiation at 40 kV and 30 mA). This was conducted in the 10–80° 2θ range, employing a scanning rate of 2°/min.
After 7 days of curing, the samples underwent 12 h of vacuum saturation to ensure complete pore filling with water. Subsequently, free water on the surface of the saturated specimens was removed using a wet towel, and their weight and volume were sequentially measured. The soil-based CLSM samples were placed in the measurement area of the low-field nuclear magnetic resonance (NMR) instrument (PQ-001 of Suzhou Newmag Analytical Instrument Co., Ltd., Suzhou, China). The relaxation signal of the sample can be obtained through a Carr–Purcell–Meiboom–Gill (CPMG) NMR pulse sequence. The transverse relaxation time T2 distribution curve and porosity of the soil-based CLSM samples were obtained through the inversion analysis software built into the instrument. Surface-limited relaxation is a crucial factor in the transverse relaxation process of water within porous media [21]. The pore diameter D can be calculated using the transverse relaxation time T2 according to Equation (2) [29]:
where S is the pore area, in nm2; V is the pore volume, in nm3; and is the pore shape factor, with values of 1, 2, and 3 corresponding to planar, cylindrical, and spherical shapes, respectively. is the surface relaxivity, in nm/ms. Here, a cylindrical pore shape was considered. The surface relaxivity represents the relaxation strength of the liquid–solid surface and is difficult to measure accurately. As suggested by She et al. [21], is assumed to be 12 nm/ms for cement-based materials.
The corrosiveness of the soil-based CLSMs was assessed according to their pH values. After the unconfined compression strength test of the soil-based CLSMs after a 7-day curing time, the compromised samples were dried and pulverized into powder. The pH measurement followed the method outlined by Saride, et al. [30]. The water content of the soil-based CLSM samples was measured by placing them in a drying oven and drying at 105 °C for 8 h. The average of three replicate test results was reported.
3. Results and Discussion
3.1. Flowability and Fresh Density
Flowability serves as a crucial parameter in the practical application of soil-based CLSMs. For the purpose of comparing the influence of PCE, T1 and T2 (refer to Table 3) were designed. T1 and T2 kept the identical cement content and initial water content, specifically 8% and 38.8%, respectively. As shown in Figure 3, the flow values for all mixtures except T1 exceeded 200 mm, satisfying the criteria for backfilling underground pipes [31]. Furthermore, the fresh density of all mixtures ranged from 1590 to 1970 kg/m3, meeting the target density of 1360 to 2000 kg/m3 for fresh CLSMs containing industrial by-products [32]. The fresh density exhibited a slight rise with the increasing cement content in Figure 3a, and a notable decline with the increasing initial water content in Figure 3b. Compared to T1, the introduction of PCE into the soil-based CLSMs significantly increased the flow value. This enhancement can be attributed to the PCE’s side chain adsorbing onto the surfaces of the cement particles and hydrate particles, with its long side chain present in the liquid mixture [33]. Additionally, PCE adsorbed onto the surfaces and interlayers of the clay minerals, promoting their dispersion. Due to steric hindrance, electrostatic repulsion, adsorption, and depletion effects, PCE dispersed the cement particles and clay minerals, thereby enhancing the mixture’s flowability [34]. Moreover, the adsorption behavior between the PCE and cement particles facilitated the release of weakly bound water [35]. Consequently, the incorporation of PCE in the soil-based CLSMs proved effective in reducing water consumption and ensuring optimal flowability.
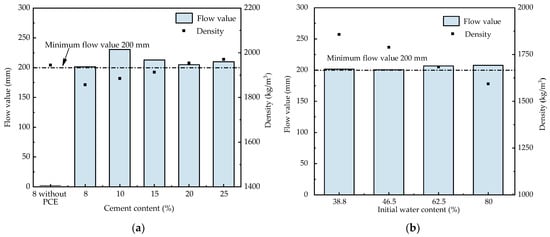
Figure 3.
Flow value and fresh density under different (a) cement contents and (b) initial water contents.
3.2. Mechanical Parameters
3.2.1. Unconfined Compressive Strength and Failure Strain
Figure 4 shows the unconfined compressive strength qu variations under different cement contents and curing time. As the cement content increased, the strength exhibited a roughly linear increase in Figure 4a. Additionally, the qu also increased with the increasing curing time in Figure 4b. This strength enhancement is primarily attributed to binding compounds, such as calcium silicate hydrates (C-S-H), calcium aluminate hydrates (C-A-H), and Ettringite (AFt), produced by hydration and the pozzolanic reaction of cement [36]. This positive correlation between the unconfined compressive strength and cement content, as well as the curing time, aligns with previous observations in solidified soil [37]. The qu of the soil-based CLSMs for different cement contents and curing time periods ranged from 564.0 to 3436.6 kPa, which did not exceed 8300 kPa, facilitating future excavation [38].
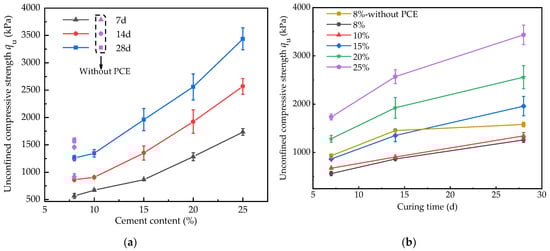
Figure 4.
Strength qu under different (a) cement contents and (b) curing time.
Significantly, after a curing time period of 7 days, the qu values of T1 and T2 were 930.3 kPa and 564.0 kPa, respectively. The qu of T1 was higher than that of T2, as illustrated in Figure 4. This trend persisted across different curing time periods. It is crucial to note that the T1 samples were prepared by compaction in molds, resulting from the lack of flowability. In contrast, the T2 samples were prepared by casting in molds, benefiting from good flowability. The presence of compaction energy led to higher strength in the T1 specimens. Additionally, Zhang, et al. [39] pointed out that PCE is adsorbed on the surface of binder particles and inhibits the hydration reaction. The PCE mass was determined based on the total mass of the dry soil and cement. The high dosage of PCE in soil-based CLSMs, combined with cement particles, may form local groups of entangled polymers, leading to the entrapment of additional water otherwise used for hydration reactions [40].
The relationships among the initial water content, curing time, and the qu are shown in Figure 5. As the initial water content increased, the qu of the soil-based CLSMs decreased significantly in Figure 5a. The qu increased with the higher curing time in Figure 5b. Furthermore, the increasing rates of qu for the initial water content of 38.8% and 46.5% were higher than those of qu for the initial water content of 62% and 80%. Mixtures with an initial water content of 38.8% and 80% had the same flowability, as shown in Figure 3, whereas the strength corresponding to the initial water content of 38.8% was 2.6~2.8 times the strength corresponding to the initial water content of 80% for different curing ages. This indicated that a large amount of water was added to increase the flow value, while the consumption of the hydration reaction of cement was limited; the excess water ultimately leads to a reduction in the strength of soil-based CLSMs. Huang, et al. [41] pointed out that flowable soil-based CLSMs have an especially higher water content due to the requirement of flowability, compared to cemented soil. Therefore, compared with an increasing water content, the addition of PCE could effectively increase the flow value and strength of soil-based CLSMs.
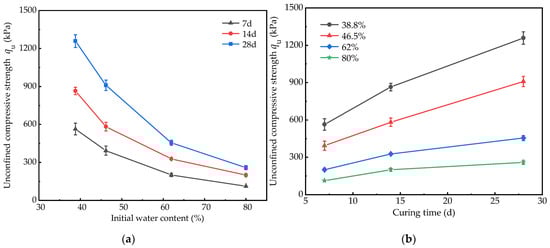
Figure 5.
Strength qu under different (a) initial water contents and (b) curing time.
The failure strain εf is an important parameter for assessing the deformation characteristics of geotechnical materials [42]. In Figure 6, εf predominantly fell within the range of 1.0% to 2.0%, corresponding to qu values ranging from 0.11 to 3.44 MPa. According to Huang, et al. [43], a failure strain of less than 2% indicates a typical brittle failure in the specimens. Consequently, the soil-based CLSM exhibited characteristics indicative of a typical brittle failure. The relationship between εf and qu for the soil-based CLSM was indeterminate. There is no mathematical expression to describe the relationship between εf and qu for the MgO–fly ash pastes reported by Wang et al. [44]. Ma et al. [45] pointed out that for cement-stabilized soil, the uncertainty in the failure strain and strength is attributed to the dispersion of failure strain in specimens.
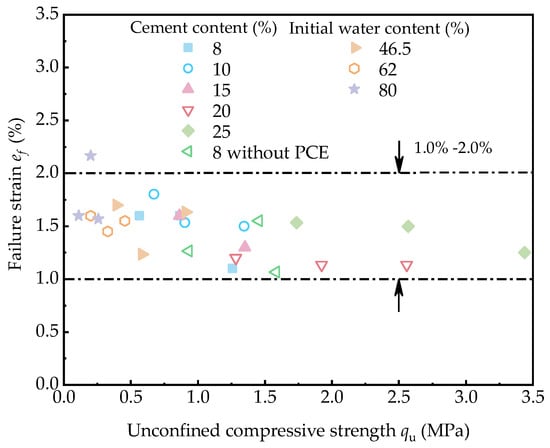
Figure 6.
The relationship of εf and qu.
3.2.2. Peak Strain Energy and Deformation Modulus
The peak strain energy Eu serves as a comprehensive indicator characterizing the toughness of the material, encompassing both the strength and ductility [46]. Figure 7 illustrates the variations in Eu concerning the initial water content and cement content and curing ages. In Figure 7a, Eu values exhibited a significant rise with the increasing cement content, ranging from 62.5 to 360.5 kJ/m3. As shown in Figure 7b, the Eu values showed a noticeable decline with the increasing initial water content, ranging from 17.1 to 116.0 kJ/m3. Furthermore, there was a general upward trend in Eu with the increasing curing time. Specifically, for the soil-based CLSM samples with a cement content of 25%, the Eu values were approximately 2.6 times higher than those for the soil-based CLSM samples with a cement content of 8%. At a cement content of 8%, the introduction of PCE resulted in a reduction in Eu. This reduction is consistent with the effect of PCE on strength. The Eu ranged from 50 to 350 kJ/m3 because the samples of recycled concrete powder stabilized the dispersive soil, and Eu was directly related to the strength improvement reported by Zhao, et al. [47].
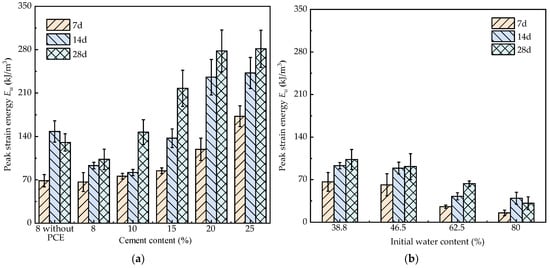
Figure 7.
Peak strain energy under different (a) cement contents and (b) initial water contents.
Figure 8 shows the change in the deformation modulus E50 under different cement contents, initial water contents, and curing time periods. As the cement content and curing time periods increased, a substantial enhancement in E50 values was observed in Figure 8a, indicating an improvement in specimen stiffness. The E50 values ranged from 60 to 360 MPa for different cement contents. However, a notable reduction in E50 values was evident with the rise in the initial water content, as shown in Figure 8b. Despite the extended curing time periods, there was a persistent increase in E50 values. The E50 values ranged from 15 to 120 MPa for different initial contents.
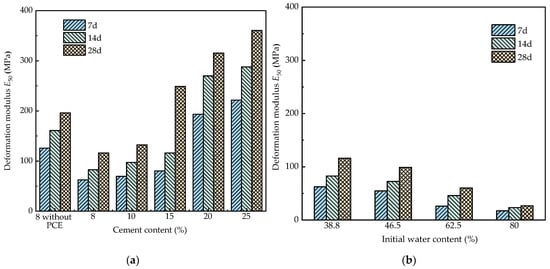
Figure 8.
Deformation modulus E50 under different (a) cement contents and (b) initial water contents.
As seen in Figure 9, the relationship between E50 and qu closely follows the same trend observed in the relationship between Eu and qu. With a least-squares-fitting-based regression analysis, both E50 and Eu exhibited a robust linear correlation with the strength qu. The associations of E50 and Eu with qu for the soil-based CLSM were effectively captured by the following linear functions: E50 = 111.520 qu + 1.658 and Eu = 90.989 qu + 14.217. Notably, the correlation coefficients R2 exceeded 0.95, indicating a strong relationship. Tsuchida, et al. [48] revealed that the relationship between E50 and qu for cement solidified dredged mud was expressed as E50 = 75~200 qu. Interestingly, the relationship between E50 and qu of the soil-based CLSM aligns consistently with that observed in cement solidified dredged mud.
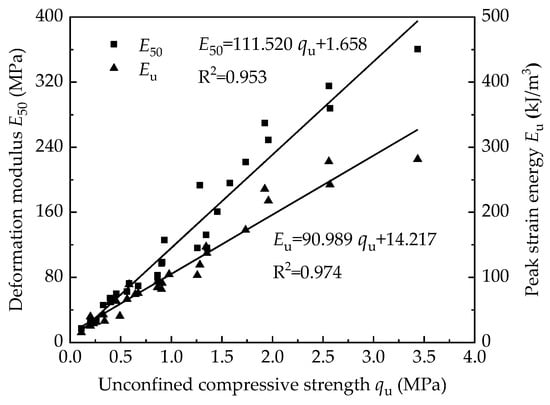
Figure 9.
Deformation modulus and peak strain energy in relationships with unconfined compressive strength.
3.3. Microstructure Analysis
3.3.1. Transverse Relaxation Time T2 Distribution
Figure 10 illustrates that the NMR transverse relaxation time T2 distribution of the soil-based CLSM showed a distinct bimodal distribution under varying cement contents and initial water contents. The left main peak exhibited a significantly larger signal amplitude per unit mass sample compared to the right secondary peak. The T2 distribution curves of the cemented tailings backfill also exhibited a main relaxation peak and a secondary relaxation peak [49]. This T2 distribution is indicative of water distribution within the pores of the soil-based CLSM sample. In Figure 10a, the T2 distribution curves shifted to smaller transverse relaxation time values with an increase in the cement content, accompanied by a notable decrease in the signal amplitude per unit mass sample corresponding to the main peak. As the cement content increased, the secondary peak also showed a similar trend to the main peak. The signal amplitude represents the amount of water signal at the corresponding transverse relaxation time. Consequently, it can be inferred that the water signal in the soil-based CLSM sample gradually shifted towards a smaller relaxation time with the increasing cement content, accompanied by a decrease in the water signal. Apart from variations in the signal amplitudes of the main peak, the distribution range of the main peak in the water distribution curve of the soil-based CLSM without PCE remained consistent with that of the soil-based CLSM with PCE. As a result of the compaction during the preparation of the T1 samples, the distribution range of the secondary peak decreased. As can be seen in Figure 10b, the T2 distribution curves gradually shifted to larger transverse relaxation time values with the increasing initial water content. The signal amplitude per unit mass sample corresponding to the main peak exhibited a significant increase, indicating a higher water content in the sample. Concurrently, the T2 distribution corresponding to the secondary peak had a wider distribution range with the increasing initial water content. The main peak of the T2 distribution curve in the soil-based CLSM was predominantly concentrated in the range of 0.01–5 ms for different cement contents and in the range of 0.05~9.0 ms for different initial water contents.
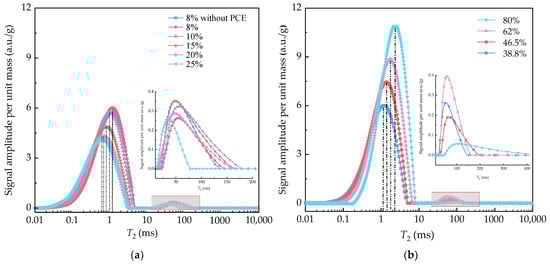
Figure 10.
T2 distribution under different (a) cement contents and (b) initial water contents. Notes: a.u. represent arbitrary units.
The T2 value corresponding to the main peak in the NMR T2 distribution is denoted as T2peak. Figure 11 shows the variation pattern of T2peak under different cement contents and initial water contents. T2peak exhibited a notable rise with a higher initial water content and a slight decline with an increasing cement content. At a cement content of 8%, the T2peak for the soil-based CLSM without PCE (T1) measured 1.18 ms, marginally lower than that of the soil-based CLSM with PCE (T2, 1.20 ms), indicating that the inclusion of PCE had a minimal impact on T2peak. T2peak represents the most probable aperture of the sample. Therefore, the most probable aperture in the soil-based CLSM decreased with a higher cement content and increased with an increasing initial water content.
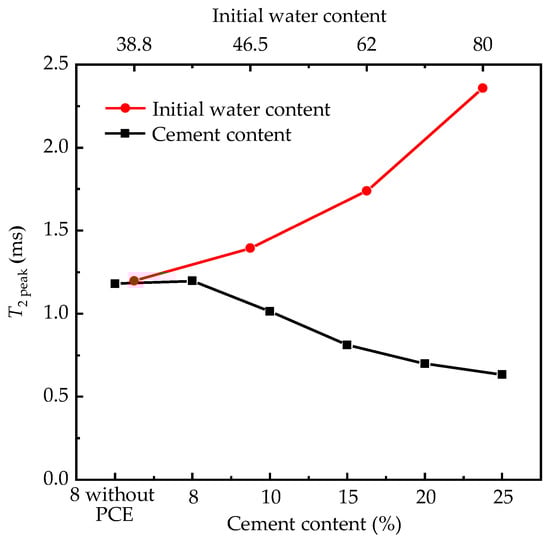
Figure 11.
T2peak under different cement contents and initial water contents.
3.3.2. Pore Size Distribution
Figure 12 shows the pore size distribution under different cement contents and initial water contents. The signal amplitude per unit mass is proportional to the number of pores in the samples, and the area under the curve is proportional to the volume of pores in the samples [50]. As shown in Figure 12a, the diameter, number, and volume of pores gradually reduced with the increasing cement content, attributed to the filling effect of hydration products on the pores [50]. As shown in Figure 12b, as the initial water content increased, the area under the curve and the pore size increased. This means that the rise in the initial water content leads to a loosening of the structure, explaining the decrease in strength. The pore diameter was mainly in the range of 1~300 nm for different soil-based CLSMs. The pore diameter of the cement-stabilized marine clay with metakaolin ranged from 5 to 1000 nm, as measured by MIP according to Deng, et al. [51]. This indicates that soil-based CLSMs with PCE are self-compacting materials from the perspective of the pore diameter distribution.
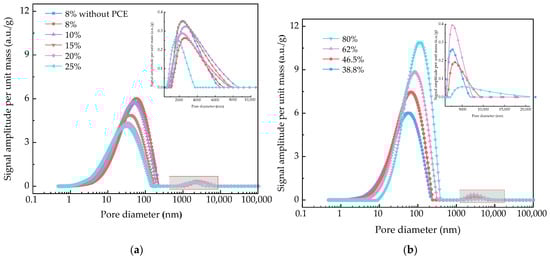
Figure 12.
Pore size distribution under different (a) cement contents and (b) initial water contents.
Figure 13 shows the distribution of the pore volume percentage in soil-based CLSMs under different cement contents and initial water contents. The pores in soil-based CLSMs are categorized into small pores (D ≤ 10 nm), mesopores (10 nm < D ≤ 50 nm), macropores (50 nm < D ≤ 100 nm), and extra-large pores (D > 100 nm) [50]. The 10 nm threshold distinguishes intra-aggregate and inter-aggregate pores in cement solidified clay [52]. Small pores represent intra-aggregate pores, while mesopores, macropores, and extra-large pores signify different sizes of intra-aggregate pores [50]. As is seen in Figure 13a, an increase in the cement content led to a rise in the volume percentages of small and mesopores, while the volume percentages of extra-large pores and macropores gradually decreased. This reveals the micro-mechanisms underlying the strength increase with the higher cement content. The addition of PCE has little effect on the pore volume percentage distribution. The mesopores consistently dominated in volume for the soil-based CLSM. As the cement content increased from 8% to 25%, the volume percentage of the mesopores rose from 46% to 58.7%. This phenomenon is primarily attributed to the bonding and filling effects of cement hydration products, including C-S-H, C-A-H, and C-A-S-H, resulting in a gradual reduction in the mixture pore size and an increase in strength [36].
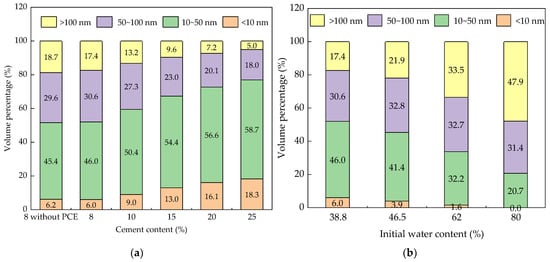
Figure 13.
Pore volume percentage distribution under different (a) cement contents and (b) initial water contents.
Figure 13b demonstrates that a rise in the initial water content resulted in a notable increase in the volume percentage of extra-large pores, accompanied by a significant decrease in the volume percentages of small pores and mesopores. The volume percentage of macropores showed slight variation. This indicates that an increase in the volume percentage of extra-large pores and mesopores results in a decrease in the strength of soil-based CLSMs. Notably, at initial water contents of 62% and 80%, extra-large pores dominated. The volume percentages of extra-large pores at initial water contents of 80% and 38.8% were 47.9% and 17.4%, respectively. The former had 2.75 times more volume percentages of extra-large pores than the latter. The volume percentages of small pores at an initial water content of 80% were zero. According to Bian, et al. [53], the presence of numerous large pores in the sample is attributed to water being trapped within the pores, and the high initial water content inhibiting the formation of soil clusters.
3.3.3. Porosity
Figure 14 illustrates the influence of the cement content, initial water content, and curing time on the porosity η of soil-based CLSMs. Porosity exhibited a decrease with the increasing cement content and curing time, as shown in Figure 14a. Specifically, for samples with cement contents of 10%, 15%, 20%, and 25%, the porosities decreased by 2.1%, 17.7%, 23.7%, and 25.8%, respectively, compared to those with 8% cement content after 7 days of curing. The increase in the cement content and curing time led to more hydration products, filling the pores between clusters, thereby causing a reduction in porosity [52]. The porosity increased notably with a higher initial water content, as shown in Figure 14b. For samples with initial water contents of 46.5%, 62%, and 80%, the porosities increased by 18.6%, 22.2%, and 49.3%, respectively, compared to those with an initial water content of 38.8% after 7 days of curing. This increase in porosity may be attributed to a large amount of water being trapped in the soil particles of soil-based CLSMs. This reveals the mechanism of strength decrease from the perspective of porosity, resulting from an increase in the initial water content. The overall variation in the porosity of the soil-based CLSMs was minimal with the increasing curing time periods. This observation aligns with the findings for Metakaolin-cemented silty clay, where the porosity experienced a slight reduction, ranging from 0.66% to 1.13%, as the curing time period extended from 7 to 28 days [54].
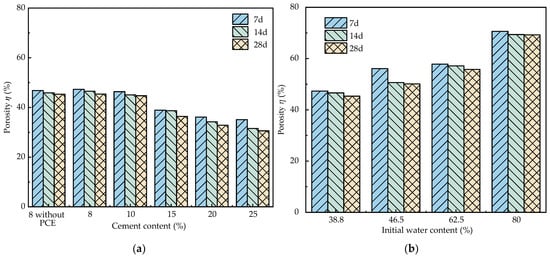
Figure 14.
Porosity under different curing times, (a) cement contents and (b) initial water contents.
Additionally, in Figure 14a, the porosity of the sample without PCE with an 8% cement content (T1) decreased by 1.0% compared to the porosity of the sample incorporating PCE with an 8% cement content (T2). This reduction could be attributed to compaction effects during the preparation of the sample without PCE (T1). Consequently, soil-based CLSMs with PCE fulfill flow requirements without compromising density.
Figure 15 illustrates the correlation between the unconfined compressive strength qu and the porosity η of soil-based CLSMs under different curing time periods. The unconfined compressive strength of the soil-based CLSM consistently decreased with the increasing porosity under different curing time periods. This trend aligns with the observed decline in the unconfined compressive strength with the increasing porosity in cemented silty soil [55]. The qu values for the samples without PCE (T1) are not represented in Figure 15. This is because the sample preparation method of T1 cannot be consistent with other samples containing PCE. The unconfined compressive strength qu decreased exponentially with the rise in porosity η across various curing time periods, namely 7 days, 14 days, and 28 days. The best-fit curves demonstrated reasonable correlations. A clear exponential relationship is established between the porosity and unconfined compressive strength of soil-based CLSMs.
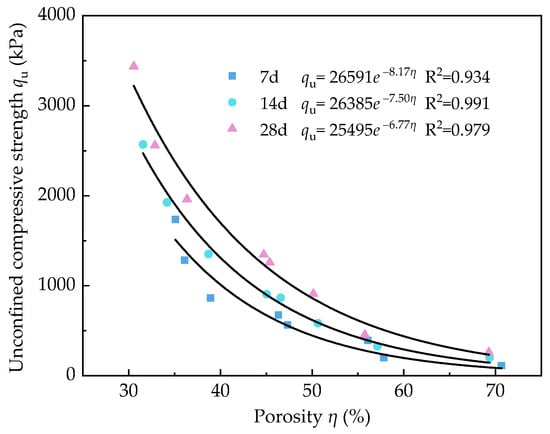
Figure 15.
Variation in strength qu with porosity η under different curing times.
3.4. Corrosivity and Water Content
Figure 16 shows the effects of the cement content, initial water content, and curing time on the water content and pH value. As is seen in Figure 16a, there was a slight decrease in the water content with the increasing cement content, attributed to the consumption during the hydration reaction of cement. Notably, the water content increased significantly with the higher initial water content, as shown in Figure 16b. The addition of PCE had a minimal impact on the water content. The incorporation of cement and PCE initially led to a significant reduction in the water content of the soil-based CLSM. As the curing period advanced, the water content continued to decrease gradually. This trend aligns with the observed variation in the water content for cement-stabilized dredged soil, indicating an initial rapid decrease followed by a gradual decline with the increasing curing time, according to Zeng, et al. [56].
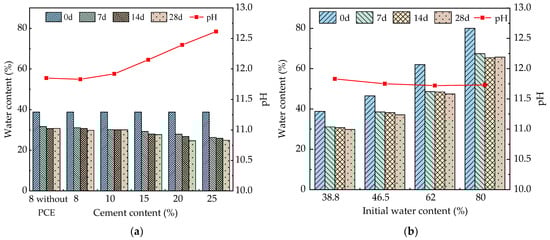
Figure 16.
Variation in water content and pH under different (a) cement contents and (b) initial water contents.
In Figure 16, the pH value exhibited a noticeable rise with the increasing cement content and a slight decrease with the higher initial water content. The addition of PCE had little effect on the pH value. The higher cement content contributed to increased hydration products, particularly calcium hydroxide, leading to an overall elevation in the pH value. A pH below 2.5 or above 12.5 indicates corrosiveness [57]. Consequently, the soil-based CLSM was non-corrosive and posed no harm to the environment when the cement content did not exceed 20%. It is an environmentally friendly and sustainable construction material.
4. Conclusions
This study investigated the feasibility of utilizing excavated soil exclusively as a fine aggregate for the production of soil-based CLSMs. PCE was introduced to soil-based CLSMs to mitigate the water requirements and enhance flowability. The effects of different cement contents, initial water contents and curing times on the mechanical properties and microscopic pore structure distribution of soil-based CLSMs were systematically studied. Based on the experimental findings, the following conclusions can be drawn:
- (1)
- PCE could effectively disperse cement particles and clay minerals, improving the flowability of soil-based CLSMs. With an increase in the cement content, the unconfined compressive strength rises due to a decrease in the volume percentages of extra-large pores and macropores, accompanied by an increase in the volume percentages of small and mesopores. Conversely, as the initial water content increases, the rise in the volume percentages of extra-large pores and mesopores leads to a decrease in the unconfined compressive strength.
- (2)
- The qu of the soil-based CLSM without PCE (T1) exceeded that of the CLSM with PCE (T2) under different curing time periods. The T2 distribution curves of the soil-based CLSM show bimodal distribution. These curves shifted to smaller transverse relaxation time values with the increasing cement content, while gradually shifting to larger transverse relaxation time values with the increasing initial water content. The addition of PCE had little effect on the T2 distribution curve and the T2peak.
- (3)
- An exponential relationship between the porosity and unconfined compressive strength of soil-based CLSMs was established under different curing time periods.
These findings contribute valuable insights into the potential applications of soil-based CLSMs. Future research could explore the addition of sacrificial agents to minimize PCE adsorption by clay minerals, ensuring a more economical and efficient application of soil-based CLSMs in geotechnical engineering.
Author Contributions
Conceptualization, Q.G.; Methodology, Q.G.; Resources, Y.C.; Writing—original draft preparation, Q.G.; Writing—review and editing, Q.G., J.X. and B.L. All authors have read and agreed to the published version of the manuscript.
Funding
This research was funded by the National Natural Science Foundation of China (No. 52178327), the Central University Basic Research Fund of China (No. B200203083), and Graduate Research and Innovation Projects of Jiangsu Province (No. KYCX20_0438).
Institutional Review Board Statement
Not applicable.
Informed Consent Statement
Not applicable.
Data Availability Statement
Data are contained within the article.
Conflicts of Interest
The authors declare no conflicts of interest.
References
- American Concrete Institute. Controlled Low-Strength Materials ACI 229R-99; Technical Documents; American Concrete Institute: Farmington Hills, MI, USA, 1999; 15p. [Google Scholar]
- Turkel, S. Strength properties of fly ash based controlled low strength materials. J. Hazard. Mater. 2007, 147, 1015–1019. [Google Scholar] [CrossRef] [PubMed]
- Ling, T.C.; Kaliyavaradhan, S.K.; Poon, C.S. Global perspective on application of controlled low-strength material (CLSM) for trench backfilling—An overview. Constr. Build. Mater. 2018, 158, 535–548. [Google Scholar] [CrossRef]
- Qian, J.S.; Hu, Y.Y.; Zhang, J.K.; Xiao, W.X.; Ling, J.M. Evaluation the performance of controlled low strength material made of excess excavated soil. J. Clean. Prod. 2019, 214, 79–88. [Google Scholar] [CrossRef]
- Chang, C.F.; Chen, J.W. Development and production of ready-mixed soil material. J. Mater. Civ. Eng. 2006, 18, 792–799. [Google Scholar] [CrossRef]
- Puppala, A.J.; Chittoori, B.; Raavi, A. Flowability and density characteristics of controlled low-strength material using native high-plasticity clay. J. Mater. Civ. Eng. 2015, 27, 06014026. [Google Scholar] [CrossRef]
- Rosman, M.; Johan, S.; Rahman, N.A.; Chan, C. Influence of water content on the flow consistency of dredged marine soils. In Proceedings of the 2nd International Conference on Green Design and Manufacture 2016, Phuket, Thailand, 1–2 May 2016; p. 01094. [Google Scholar]
- Chittoori, B.; Puppala, A.J.; Raavi, A. Strength and stiffness characterization of controlled low-strength material using native high-plasticity clay. J. Mater. Civ. Eng. 2014, 26, 04014007-1–04014007-8. [Google Scholar] [CrossRef]
- Kim, Y.S.; Do, T.M.; Kim, H.K.; Kang, G. Utilization of excavated soil in coal ash-based controlled low strength material (CLSM). Constr. Build. Mater. 2016, 124, 598–605. [Google Scholar] [CrossRef]
- Wu, J.Y.; Lee, M.Z. Beneficial reuse of construction surplus clay in CLSM. Int. J. Pavement Res. Technol. 2011, 4, 293–300. [Google Scholar] [CrossRef]
- Ng, P.G.; Cheah, C.B.; Ng, E.P.; Oo, C.W.; Leow, K.H. The influence of main and side chain densities of PCE superplasticizer on engineering properties and microstructure development of slag and fly ash ternary blended cement concrete. Constr. Build. Mater. 2020, 242, 118103. [Google Scholar] [CrossRef]
- Kaliyavaradhan, S.K.; Ling, T.C.; Guo, M.Z.; Mo, K.H. Waste resources recycling in controlled low-strength material (CLSM): A critical review on plastic properties. J. Environ. Manag. 2019, 241, 383–396. [Google Scholar] [CrossRef]
- Tan, Z.R.; Tan, H.B.; Lv, Z.L.; Kong, X.H.; Jian, S.W.; Ma, B.G. Effect of plasticizer type on properties of construction spoil based high-fluid backfill materials. Bull. Chin. Ceram. Soc. 2022, 41, 3227–3233. [Google Scholar]
- Li, X.; Zheng, D.; Zheng, T.; Lin, X.; Lou, H.; Qiu, X. Enhancement clay tolerance of PCE by lignin-based polyoxyethylene ether in montmorillonite-contained paste. J. Ind. Eng. Chem. 2017, 49, 168–175. [Google Scholar] [CrossRef]
- Pujadas, P.; Blanco, A.; Cavalaro, S.; Aguado, A. Performance-based procedure for the definition of controlled low-strength mixtures. J. Mater. Civ. Eng. 2015, 27, 06015003. [Google Scholar] [CrossRef]
- Jian, S.W.; Cheng, C.; Wang, J.; Lv, Y.; Li, B.D.; Wang, D.F.; Wang, C.F.; Tan, H.B.; Ma, B.G. Effect of sulfonated acetone formaldehyde on the properties of high-fluid backfill materials. Constr. Build. Mater. 2022, 327, 126795. [Google Scholar] [CrossRef]
- Lei, L.; Plank, J. A concept for a polycarboxylate superplasticizer possessing enhanced clay tolerance. Cem. Concr. Res. 2012, 42, 1299–1306. [Google Scholar] [CrossRef]
- Wen, D.J.; Shun, H.Z.; Yu, L.S. Microstructure study of flow-solidified soil of dredged clays by mercury intrusion porosimetry. Rock Soil Mech. 2011, 32, 3591–3596+3603. [Google Scholar] [CrossRef]
- Zong, Y.T.; Yu, X.L.; Zhu, M.X.; Lu, S.G. Characterizing soil pore structure using nitrogen adsorption, mercury intrusion porosimetry, and synchrotron-radiation-based X-ray computed microtomography techniques. J. Soils Sediments 2015, 15, 302–312. [Google Scholar] [CrossRef]
- Zhang, Y.R.; Xu, S.X.; Gao, Y.H.; Guo, J.; Cao, Y.H.; Zhang, J.Z. Correlation of chloride diffusion coefficient and microstructure parameters in concrete: A comparative analysis using NMR, MIP, and X-CT. Front. Struct. Civ. Eng 2020, 14, 1509–1519. [Google Scholar] [CrossRef]
- She, A.M.; Yao, W.; Yuan, W.C. Evolution of distribution and content of water in cement paste by low field nuclear magnetic resonance. J. Cent. South Univ. 2013, 20, 1109–1114. [Google Scholar] [CrossRef]
- Yao, Y.B.; Liu, D.M.; Che, Y.; Tang, D.Z.; Tang, S.H.; Huang, W.H. Petrophysical characterization of coals by low-field nuclear magnetic resonance (NMR). Fuel 2010, 89, 1371–1380. [Google Scholar] [CrossRef]
- Zhang, P.F.; Lu, S.F.; Li, J.Q.; Chen, C.; Xue, H.T.; Zhang, J.J.M.; Geology, P. Petrophysical characterization of oil-bearing shales by low-field nuclear magnetic resonance (NMR). Mar. Pet. Geol. 2018, 89, 775–785. [Google Scholar] [CrossRef]
- GB/T 50123-2019; Standard for Geotechnical Testing Method. Standards Press of China: Beijing, China, 2019.
- ASTM D2487; Standard Practice for Classification of Soils for Engineering Purposes (Unified Soil Classification System). ASTM International: West Conshohocken, PA, USA, 2020.
- ISO 14001; Environmental Management Systems: Requirements with Guidance for Use. Intenational Organization for Standardization: Genewa, Switzerland, 2015; p. 35.
- ASTM D6103; Standard test method for flow consistency of controlled low strength material (CLSM). ASTM International: West Conshohocken, PA, USA, 2021.
- Du, Y.J.; Wei, M.L.; Jin, F.; Liu, Z.B. Stress–strain relation and strength characteristics of cement treated zinc-contaminated clay. Eng. Geol. 2013, 167, 20–26. [Google Scholar] [CrossRef]
- Kleinberg, R.L. Utility of NMR T2 distributions, connection with capillary pressure, clay effect, and determination of the surface relaxivity parameter ρ2. Magn. Reson. Imaging 1996, 14, 761–767. [Google Scholar] [CrossRef] [PubMed]
- Saride, S.; Puppala, A.J.; Chikyala, S.R. Swell-shrink and strength behaviors of lime and cement stabilized expansive organic clays. Appl. Clay Sci. 2013, 85, 39–45. [Google Scholar] [CrossRef]
- Lee, K.H.; Kim, J.D. Performance evaluation of modified marine dredged soil and recycled in-situ soil as controlled low strength materials for underground pipe. KSCE J. Civ. Eng. 2013, 17, 674–680. [Google Scholar] [CrossRef]
- Parhi, S.K.; Dwibedy, S.; Panda, S.; Panigrahi, S.K. A comprehensive study on Controlled Low Strength Material. J. Build. Eng. 2023, 76, 107086. [Google Scholar] [CrossRef]
- Zingg, A.; Holzer, L.; Kaech, A.; Winnefeld, F.; Pakusch, J.; Becker, S.; Gauckler, L. The microstructure of dispersed and non-dispersed fresh cement pastes—New insight by cryo-microscopy. Cem. Concr. Res. 2008, 38, 522–529. [Google Scholar] [CrossRef]
- Tan, H.; Gu, B.; Guo, Y.; Ma, B.; Huang, J.; Ren, J.; Zou, F.; Guo, Y. Improvement in compatibility of polycarboxylate superplasticizer with poor-quality aggregate containing montmorillonite by incorporating polymeric ferric sulfate. Constr. Build. Mater. 2018, 162, 566–575. [Google Scholar] [CrossRef]
- Li, Y.; Duan, C.; Meng, M.; Zhang, J.; Huang, H.; Wang, H.; Yan, M.; Tang, X.; Huang, X. Effect of clay minerals on polycarboxylate superplasticizer and methods to improve the performance of concrete containing clay: A review. J. Mater. Sci. 2023, 58, 15294–15313. [Google Scholar] [CrossRef]
- Wang, C.; Li, Y.; Wen, P.; Zeng, W.; Wang, X. A comprehensive review on mechanical properties of green controlled low strength materials. Constr. Build. Mater. 2022, 363, 129611. [Google Scholar] [CrossRef]
- Horpibulsuk, S.; Miura, N.; Nagaraj, T.S. Assessment of strength development in cement-admixed high water content clays with Abrams’ law as a basis. Geotechnique 2003, 53, 439–444. [Google Scholar] [CrossRef]
- Kuo, W.T.; Wang, H.Y.; Shu, C.Y.; Su, D.S. Engineering properties of controlled low-strength materials containing waste oyster shells. Constr. Build. Mater. 2013, 46, 128–133. [Google Scholar] [CrossRef]
- Zhang, S.; Jiao, N.; Ding, J.; Guo, C.; Gao, P.; Wei, X. Utilization of waste marine dredged clay in preparing controlled low strength materials with polycarboxylate superplasticizer and ground granulated blast furnace slag. J. Build. Eng. 2023, 76, 107351. [Google Scholar] [CrossRef]
- Anagnostopoulos, C.A. Effect of different superplasticisers on the physical and mechanical properties of cement grouts. Constr. Build. Mater. 2014, 50, 162–168. [Google Scholar] [CrossRef]
- Huang, Z.; Tong, T.; Liu, H.; Qi, W. Properties of soil-based flowable fill under drying–wetting and freeze–thaw actions. Sustainability 2023, 15, 2390. [Google Scholar] [CrossRef]
- Wang, D.X.; Abriak, N.E.; Zentar, R. Strength and deformation properties of Dunkirk marine sediments solidified with cement, lime and fly ash. Eng. Geol. 2013, 166, 90–99. [Google Scholar] [CrossRef]
- Huang, Y.H.; Zhu, W.; Qian, X.D.; Zhang, N.; Zhou, X.Z. Change of mechanical behavior between solidified and remolded solidified dredged materials. Eng. Geol. 2011, 119, 112–119. [Google Scholar] [CrossRef]
- Wang, D.X.; Wang, H.W.; Di, S.J. Mechanical properties and microstructure of magnesia–fly ash pastes. Road Mater. Pavement Des. 2019, 20, 1243–1254. [Google Scholar] [CrossRef]
- Ma, C.; Chen, L.; Chen, B. Analysis of strength development in soft clay stabilized with cement-based stabilizer. Constr. Build. Mater. 2014, 71, 354–362. [Google Scholar] [CrossRef]
- Salimi, M.; Ghorbani, A. Mechanical and compressibility characteristics of a soft clay stabilized by slag-based mixtures and geopolymers. Appl. Clay Sci. 2020, 184, 105390. [Google Scholar] [CrossRef]
- Zhao, G.; Zhu, Z.; Ren, G.; Wu, T.; Ju, P.; Ding, S.; Shi, M.; Fan, H. Utilization of recycled concrete powder in modification of the dispersive soil: A potential way to improve the engineering properties. Constr. Build. Mater. 2023, 389, 131626. [Google Scholar] [CrossRef]
- Tsuchida, T.; Porbaha, A.; Yamane, N. Development of a geomaterial from dredged bay mud. J. Mater. Civ. Eng. 2001, 13, 152–160. [Google Scholar] [CrossRef]
- Liu, W.; Yu, H.; Wang, S.; Wei, M.; Wang, X.; Tao, T.; Song, X. Evolution mechanism of mechanical properties of cemented tailings backfill with partial replacement of cement by rice straw ash at different binder content. Powder Technol. 2023, 419, 118344. [Google Scholar] [CrossRef]
- Lin, M.; Chen, G.; Chen, Y.; Han, D.; Xu, J. Hydrothermal solidification of alkali-activated clay-slaked lime mixtures. Constr. Build. Mater. 2022, 325, 126660. [Google Scholar] [CrossRef]
- Deng, Y.; Yue, X.; Liu, S.; Chen, Y.; Zhang, D. Hydraulic conductivity of cement-stabilized marine clay with metakaolin and its correlation with pore size distribution. Eng. Geol. 2015, 193, 146–152. [Google Scholar] [CrossRef]
- Horpibulsuk, S.; Rachan, R.; Raksachon, Y. Role of fly ash on strength and microstructure development in blended cement stabilized silty clay. Soils Found. 2009, 49, 85–98. [Google Scholar] [CrossRef]
- Bian, X.; Zeng, L.L.; Deng, Y.F.; Li, X.Z. The role of superabsorbent polymer on strength and microstructure development in cemented dredged clay with high water content. Polymers 2018, 10, 1069. [Google Scholar] [CrossRef]
- Zhang, R.; Ma, D. Effects of curing time on the mechanical property and microstructure characteristics of metakaolin-Based Geopolymer cement-stabilized silty clay. Adv. Mater. Sci. Eng. 2020, 2020, 9605941. [Google Scholar] [CrossRef]
- Consoli, N.C.; Rosa, D.A.; Cruz, R.C.; Dalla Rosa, A. Water content, porosity and cement content as parameters controlling strength of artificially cemented silty soil. Eng. Geol. 2011, 122, 328–333. [Google Scholar] [CrossRef]
- Zeng, L.; Bian, X.; Zhao, L.; Wang, Y.; Hong, Z. Effect of phosphogypsum on physiochemical and mechanical behaviour of cement stabilized dredged soil from Fuzhou, China. Geomech. Energy Environ. 2021, 25, 100195. [Google Scholar] [CrossRef]
- Do, T.M.; Kim, Y.S. Engineering properties of controlled low strength material (CLSM) incorporating red mud. Int. J. Geo-Eng. 2016, 7, 7. [Google Scholar] [CrossRef]
Disclaimer/Publisher’s Note: The statements, opinions and data contained in all publications are solely those of the individual author(s) and contributor(s) and not of MDPI and/or the editor(s). MDPI and/or the editor(s) disclaim responsibility for any injury to people or property resulting from any ideas, methods, instructions or products referred to in the content. |
© 2024 by the authors. Licensee MDPI, Basel, Switzerland. This article is an open access article distributed under the terms and conditions of the Creative Commons Attribution (CC BY) license (https://creativecommons.org/licenses/by/4.0/).