Communication

Can Kernel Uniformity Indices Be Used as Criteria for Variability Assessment of Wheat Breeding Lines?

by
Ioanna M. Protasova
1,
Tatiana S. Aniskina
1,
Alexander A. Gulevich
2,
Olga A. Shchuklina
1 and
Ekaterina N. Baranova
1,2,*
1
N.V. Tsitsin Main Botanical Garden of Russian Academy of Sciences, Botanicheskaya 4, 127276 Moscow, Russia
2
Plant Cell Engineering Laboratory, All-Russia Research Institute of Agricultural Biotechnology, Timiryazevskaya 42, 127550 Moscow, Russia
*
Author to whom correspondence should be addressed.
Appl. Sci. 2024, 14(24), 11885; https://doi.org/10.3390/app142411885
Submission received: 20 November 2024 / Revised: 10 December 2024 / Accepted: 12 December 2024 / Published: 19 December 2024

Abstract

:
Wheat is one of the main food crops, the value of which lies in the high content of protein and carbohydrates in the kernel. To improve the quality of kernel processing, it is desirable that all kernels are uniform in shape and quantitative parameters. However, the kernel technological properties are affected by agricultural technology, environmental conditions and genetic characteristics, for example, even within one ear; kernels vary in size and the degree of ripening. Therefore, the aim of this work is to test the relationship between the coefficients (indices) of kernel shape variability in winter wheat lines that were pre-selected in long-term competitive variety trials and to select the best variety accession for further targeted selection to improve the uniformity of kernels. This work examined seven lines and a control variety of winter wheat grown during 2022–2023. Sampling in the field experiment was carried out randomly. The variability of quantitative traits was assessed by the analysis of variance method. It is noted that symmetrical kernels are mainly characteristic of 188h, the intermediate position is occupied by Moskovskaya 56, 150h, 152h, 171h, 184h, 187h and variety sample 151h has clearly expressed asymmetry. Index 5 of the kernel cut has a strong correlation with gluten content (r = 0.74, p = 0.05), index 4 with kernel test weight (r = 0.84, p = 0.01), index 3 with a tillering coefficient (r = 0.83, p = 0.05) and index 1 with plant height (r = 0.81, p = 0.05). An inverse relationship was found for index 2 with kernel vitreousness (r = −0.74, p = 0.05). The kernel test weight has an inverse relationship with the grain area (r = −0.71, p = 0.05). Predictive regression equations on the relationship of plant height, tillering ratio, gluten content and indices are given. While limited by its one-year duration, this study reveals intriguing correlations between grain shape parameters and economically valuable traits in wheat, offering valuable insights for high-throughput phenotyping applications in rapidly advancing agricultural technologies. This article will be useful for breeding for kernel uniformity and, consequently, for increasing the kernels in the ear and the weight of 1000 seeds.

1. Introduction

Wheat is an essential crop for global food security [1,2]. Given the fact that the world population tends to increase in size, there is a need to ensure its high productivity and availability to a wide range of people [1,2,3,4,5]. Also, the availability of grain for food purposes in the future may be influenced by the demand for wheat as a biofuel [6,7]. With the changing climate, challenges for wheat cultivation, such as increasing temperature, decreasing water availability and increasing atmospheric carbon dioxide levels, are emerging [5,8,9]. To offset these challenges, it is necessary to focus on increasing yields not by increasing acreage but by developing new varieties, improving crop management practices and grain processing efficiency [10,11].
It is known that wheat ears show heterogeneity in the number of grains in an ear, as well as in the size of grains, for example, the first-order grains in a simple ear are often larger than the upper-order grains [12,13]. The degree and rate of grain filling in each simple spikelet also depend on its location in the ear [14]. These features of wheat ear development affect the total grain weight in the ear, potential yield, and protein content of the grains [11,15,16].
To improve wheat quality and processing efficiency, it is necessary to carry out selection that also focuses on uniformity and a more rounded grain shape [17,18]. This can be achieved by developing and implementing shape analysis indices. Accordingly, the purpose of our work is to evaluate promising lines (six years of cultivation) of Triticum aestivum L. for grain shape uniformity, to check the relationship of grain morphological identification indices with economically valuable traits of wheat.

2. Materials and Methods

2.1. Agrotechnical Conditions

Plants for this study were obtained from the Field Experimental Station of the Russian State Agrarian University—Moscow Agricultural Academy named after K.A. Timiryazev (55°50′ N, 37°33′ E).
The soils are loamy and sandy loam sod-podzolic. The humus content in the arable layer averages 2.4–2.5%, K2O—8.1–10.7 mg and P2O5—16.3–17.3 mg per 100 g of soil. These growing conditions are considered suitable for winter wheat. The comparative evaluation of the samples was carried out on a high agricultural background. The predecessor was a vetch–oat mixture.
There was no additional watering since 2023 was characterized by a sufficient amount of precipitation. The experiment was cleared of weeds manually.

2.2. Plant Material

The objects of research were 8 genotypes of soft winter wheat (Triticum aestivum L.). Seven genotypes were obtained as a result of hybridization with Russian and German wheat varieties (Table 1). Further, individual selection from F2 was carried out to obtain constant genotypes. Further generations were obtained as a result of self-pollination. Representatives of the F6 generation of these crosses, which were sown in autumn 2022 and harvested in 2023, are considered in this paper (Table 1).

2.3. Assessment of Material for Analysis

At the stage of tube emergence (stage 4 on the BBCH-scale (Zadoks scale)), vegetation indices visible atmospherically resistant index (VARI), visible atmospherically resistant indices green (VIgreen), and the green leaf index (GLI) [19] were assessed on the selected plots (Figure S1).
The yield structure elements were determined by randomly selecting plots. For selection, a plot section with the most typical plants was selected, where a 50 cm long and 2 row-wide plot was laid, excluding the outer rows. The experiments were carried out in three replicates. The plant height (cm), number of plants (pcs/m2), number of stems (pcs/m2), tillering coefficient, sheaf weight (g), grain weight per plant (g), grain weight per ear (g), economic utilization coefficient, weight of 1000 grains (g), test weight (g/L), and yield (t/ha) were determined. The 1000-grain weight was determined using the standard method.
The assessment of plant resistance to powdery mildew and brown rust at the end of earing phase (stage 5 on the BBCH scale (Zadox scale)) was on a 9-point scale. In this scale, 1 means severe plant damage, 3 means more than 50% of plants are affected, 5 means intermediate position, 7 means good resistance, 9 means the highest resistance. The plant resistance to snow mold and winter hardiness were assessed in spring after snow melt and the beginning of plant growth on a 5-point scale. On this scale: 1 point—only an insignificant number of plants survived in the plot; 2 points—more than half of the plants died; 3 points—approximately half of the plants survived; 4 points—at least 70–80% of the plants survived; and 5 points—death of plants in the plot is unnoticeable.
Vitreousness, protein, and gluten were determined in percentage. The vitreousness of grain was determined on the electronic diaphanoscope Yantar-Blik (Moscow, Russia). The determination of the test weight was carried out in three replicates using a microchondrometer (OmskTechMash, Omsk, Russia): grain was poured into a graduated cylinder, then part of it was cut off with a blade, and the grain remaining inside was weighed. Grain quality analysis, including the determination of protein and gluten content, was performed using spectrophotometer Spectran IT (Inari-Technologies CJSC, St. Petersburg, Russia), and its operating principle is based on infrared spectrometry. Before starting work, a grain sample (60 g) was ground in an LMT-1 mill. Then, the resulting sample (meal) was thoroughly mixed and poured into the cell of the device, then compacted with a plunger. After starting the device, grain quality parameters were measured for 1.5 min. Each sample was analyzed in triplicate.
The kernels were selected as a sample taken randomly after threshing the ear, and a total of 360 kernels were examined. The ImageJ software (Version 1.51, National Institutes of Health, Bethesda, MD, USA) was used to determine the kernel grain parameters, and the length, width, area and perimeter were estimated. The weight of the kernels was determined on an analytical scale with an accuracy of 0.0001 g. Then, the kernel was cut in the middle part, and the distances from the edges of the kernel to the symmetry axis were measured with an accuracy of 0.001 mm, where index 1 corresponded to the ratio of the length of the perpendicular from the tops of the endosperm to the axis of symmetry to the total length of the perpendiculars from the tops of the left and right sides of the endosperm. Indices 2–5 were calculated in a similar manner and were specified in more detail in the methods performed by Aniskina and Baranova [20,21]. According to the above method, the value of the asymmetry of the kernels was calculated as the mean of the indices of the relative asymmetry of the kernels along the above-mentioned perpendiculars.

2.4. Statistical Analysis

Statistical analysis was performed in SPSS Statistics 25. The normality of data distribution was checked using the Kolmogorov–Smirnov method. Descriptive statistics include arithmetic means with standard deviations, as well as the coefficients of variation in features. To assess the influence of line genotypes and the location of grains, dispersion analysis with Duncan’s a posteriori criterion was used. The tightness of the relationship was assessed after Spearman’s correlation analysis (p = 0.05). For traits with high correlation coefficients, regression equations were constructed with quality control by the coefficient of determination and the standard error of the estimate. The criterion for including a predictor in the equation was the probability F ≤ 0.05.

3. Results

The vegetation indices were used for preliminary assessment of the plant samples at the booting stage. This method was previously proposed by researchers for the monitoring of vegetation stages using RGB data and drones [22]. The VARI provides an estimate of the proportion of vegetation that minimally responds to atmospheric factors, which can greatly affect crop yield [23]. Compared with the standard Moskovskaya 56, variety 187 turned out to be the most unstable and responsive to external factors, and varieties 150× and 184× were the least responsive. The VIgreen vegetation index, which uses an RGB indicator to analyze and classify vegetation canopy, can identify phenological changes during a distinct period. Compared to the standard, the variety sample 187 was the most diverse in three replicates according to this index, and the variety sample 184h was the least diverse. The GLI was developed to assess the impact of cereals on grazing, as well as to establish the amount of chlorophyll in rice leaves and to detect tree diseases. Compared with the standard, variety 187 was maximally resistant to grazing and contained the maximum amount of chlorophyll according to this index, while variety 184h had the minimum index value (Figure S3).
Analysis of the kernel weight showed that the control variety Moskovskaya 56 (average weight 0.0562 ± 0.0099 g) and lines 187h (0.0582 ± 0.0113 g), 188h (0.0561 ± 0.0089 g) and 184h (0.0553 ± 0.0090 g) united into a group of samples with the highest grain weight (Figure 1A), area and perimeter. Line 150h occupies an intermediate position between the groups of lines with medium- and high-weight values. And lines 151h and 152h differed from others as samples with low grain weight (0.0464 and 0.0463 g, respectively). The coefficient of variation in grain weight is in the range of 16–19% for all samples in this study.
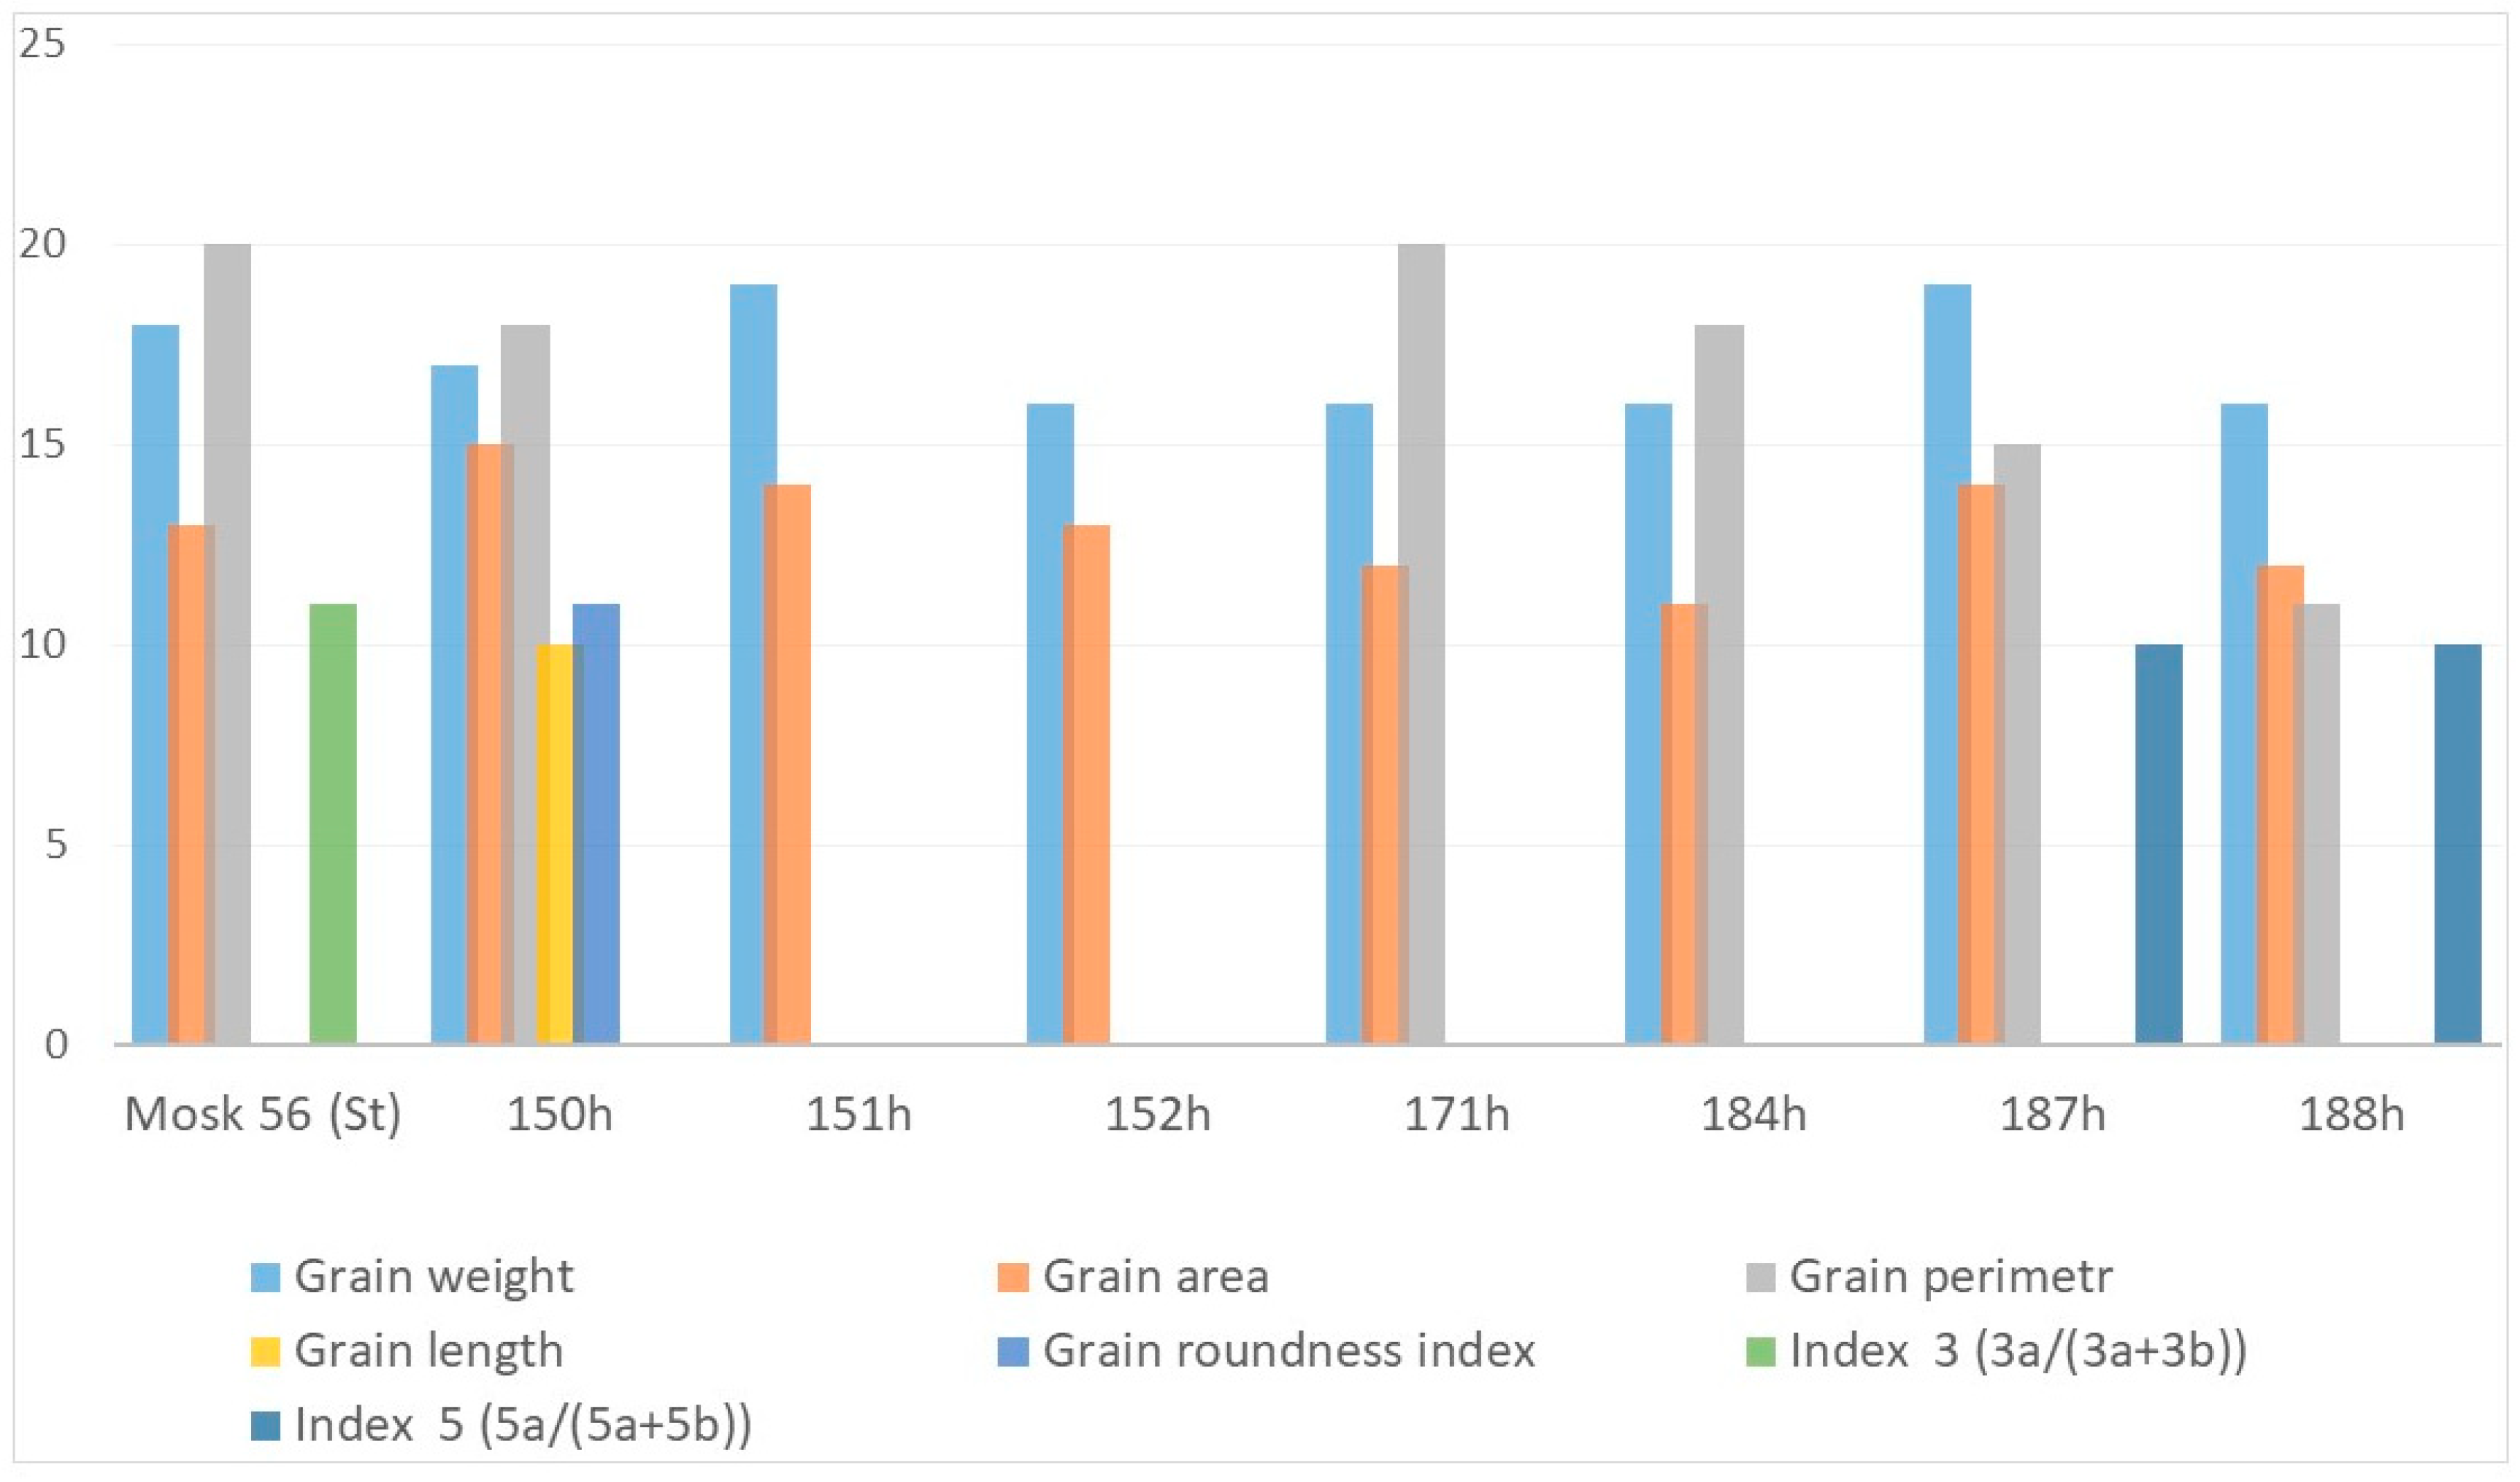
To calculate the kernel roundness indices, length and width measurements were used, which were specific characteristics for the samples studied (Figure 1C,D). The closer the roundness index is to 1, the more pronounced the roundness of the grain shape, and vice versa; the distance from 1 leads to a more elongated shape (Figure S2). Since the ideal shape for kernel processing is round, among our samples, the best index is at 150h (0.61), then at the group 152h, 151h, 171h (0.57, 0.58 and 0.58, respectively). The most elongated shape is at 188h, 187h and Moskovskaya 56 (0.51, 0.51 and 0.52, respectively). The variation coefficient of this feature is at the level of 8–11% (Figure 2). Accordingly, the range of variability of the kernel length is from 6.6 mm for 150h to 7.91 mm for 188h, and the kernel width is from 3.77 mm for Moskovskaya 56 to 4.11 mm for 152h. The coefficient of variation in the kernel length and width does not exceed 10%.
The average index of transverse cut asymmetry in kernel shows that the kernels of line 188h are the most symmetrical (Figure S2). The average index of the ratio of the left and right sides of kernel in this line is close to the ratio of 50:50% and is 0.514, i.e., the ratio of the left and right sides is 51:49% (Figure 1).
When breeders plan schemes of crossings to obtain greater splitting by a specific trait, it is necessary to select samples with a higher value of the coefficient of variation in the trait. Accordingly, if it is necessary to conduct targeted selection for a specific value of the trait, then variety samples with low variation are selected. In our case, to obtain the next generations with the most symmetrical kernels for breeding schemes of crossings, all the studied samples are suitable, since only 4–5% of their kernels deviate from the average value (Figure 2).
The analysis of correlation links between kernel characteristics and yield components showed that index 5 was associated with gluten content (r = 0.74, p = 0.05), index 4 with test weight (r = 0.84, p = 0.01) and plant height (r = 0.76, p = 0.05), index 3 with a tillering coefficient (r = 0.83, p = 0.05) and index 1 with plant height (r = 0.81, p = 0.05). An inverse relationship was found between index 2 and kernel vitreousness (r = −0.74, p = 0.05). The weight of 1000 kernels (grains) correlated with the kernel perimeter (r = 0.79, p = 0.05) and the average kernel weight (r = 0.83, p = 0.05). The kernel size has an inverse relationship with the cross-sectional area of the kernel (r = −0.71, p = 0.05).
The presence of reliable correlations allows us to make predictive equation models (Table 2). It was found that measuring even only two indices allows us to predict plant height by 77.6% (indices 1 and 3) and the tillering coefficient by 84% (indices 2 and 3).
Spearman’s correlation analysis did not reveal any reliable relationships between the characteristics of kernel (average weight of kernels, perimeter and cross-sectional area, length and width of the kernel, indices of the ratio of distances 1–5, average index of asymmetry, index of roundness of the kernel) and such components of yield as the number of plants per m2, the number of stems per m2, sheaf weight, grain weight in a sheaf, grain weight per plant, grain weight per ear, the coefficient of economic use, winter hardiness, resistance to snow mold and brown rust, the yield of variety accessions (t/ha) and protein content.

4. Discussion

This work demonstrates, for the first time, the relationship between asymmetry indices in winter wheat grain cuts and yield components. Index 2 is inversely related to grain vitreousness, i.e., with an increase in index 2, the endosperm loses strong bonds of starch grains with protein and becomes starchier, which means that the flour will no longer be of first-class quality. A change in index 5, which is responsible for the lower part of the grain cut, is associated with a direct strong change in gluten. However, for Spearman’s correlation analysis we used the averaged data of eight and up to one value for each feature, so a two-sided test of the reliability of the correlation coefficients showed significant relationships mainly at the 0.05 level (95% probability). It is recommended to increase the number of replicates of feature measurements describing yield components in order to check for reliable relationships at the 0.01 significance level.
This study showed that our closely related accessions differed significantly in the length and width of the kernel. This could be explained by the differential expression of the GS3 gene, which significantly affects the length and weight of caryopsis (kernel), and to a lesser extent, their width [24,25]. The GW2 gene was found to alter the width and weight of caryopsis, and, to a lesser extent, increase their length by changing the width of the glume [26]. Similarly, the SW5 gene was reported to affect the width of caryopsis by regulating the size of the outer glume [27]. Our accessions also significantly differed in the parameters associated with yield components, which can be assumed to involve genes that are divided into several groups: transcription factors regulating spike development, inflorescence structure, and grain number; genes involved in the metabolism and signaling of growth regulators that affect plant structure; genes involved in carbohydrate metabolism that affect plant structure and grain yield [28,29].
Our study, although limited to a single growing season, uncovered significant correlations between kernel shape parameters and economically valuable traits in wheat. The indices showed low coefficients of variation (up to 10%), so it can be assumed that these traits are stable in resistant lines and cultivars [20,21]. We assume that the application of these traits will be useful for variety identification (variety passport). The creation of such a card index of kernel shape indices would probably reduce the cost of variety identification by means of grain protein electrophoresis. Also, the ability to predict plant height by grain shape indices will allow the early adjustment of seeding rate and selection of the optimal site for placement (placement of tall grain crops on a windy slope leads to lodging). These findings contribute valuable insights to the field of plant phenotyping, particularly as high-throughput technologies continue to advance rapidly. Future research spanning multiple seasons could further validate and expand upon these observations, potentially leading to more robust predictive models for wheat breeding programs.

5. Conclusions

This study provides new knowledge about the relationship between the parameters of kernel cut, kernel length, width, area, perimeter and depth, kernel morphology and kernel quality in bread wheat, which may help to improve the kernel (grain) weight performance of wheat in further research. We recommend repeating this study under different growing conditions and over several years.

Supplementary Materials

The following supporting information can be downloaded at https://www.mdpi.com/article/10.3390/app142411885/s1, Table S1: Average values of elements of wheat yield structure; Figure S1: Studied accessions (varieties) of winter wheat in the tillering phase; Figure S2: Symmetrical, asymmetrical, rounded and non-rounded wheat kernels; and Figure S3: Vegetation Index formulas.

Author Contributions

Conceptualization, T.S.A. and E.N.B.; methodology, I.M.P., T.S.A. and E.N.B.; validation, T.S.A., O.A.S. and A.A.G.; formal analysis, I.M.P., T.S.A. and A.A.G.; investigation, I.M.P., T.S.A. and O.A.S.; data curation, I.M.P., T.S.A. and O.A.S.; writing—original draft preparation, I.M.P. and T.S.A.; writing—review and editing, T.S.A., E.N.B. and A.A.G.; visualization, T.S.A. and O.A.S.; supervision, T.S.A. and E.N.B.; project administration, T.S.A. and E.N.B. All authors have read and agreed to the published version of the manuscript.

Funding

This article was written according to assignment No. 0431-2022-0003 (ARRIAB), 122042700002-6 and 123120600005-2 (MBG RAS), which funded this research under projects of the Ministry of Science and Higher Education of the Russian Federation. APC for open access is paid from the personal funds of the authors.

Institutional Review Board Statement

Not applicable.

Informed Consent Statement

Not applicable.

Data Availability Statement

The original contributions presented in this study are included in the article. Further inquiries can be directed to the corresponding author.

Conflicts of Interest

The authors declare no conflicts of interest.

References

  1. FAO. Food Outlook—Biannual Report on Global Food Markets; FAO: Rome, Italy, 2024. [Google Scholar] [CrossRef]
  2. Guo, J.; Mao, K.; Yuan, Z.; Qin, Z.; Xu, T.; Bateni, S.M.; Zhao, Y.; Ye, C. Global food security assessment during 1961–2019. Sustainability 2021, 13, 14005. [Google Scholar] [CrossRef]
  3. Grote, U.; Fasse, A.; Nguyen, T.T.; Erenstein, O. Food security and dynamics of wheat and maize value chains in Africa and Asia. Front. Sustain. Food Syst. 2021, 4, 617009. [Google Scholar] [CrossRef]
  4. Chand, R. Challenges to ensuring food security through wheat. CABI Rev. 2009, 4, 1–13. [Google Scholar] [CrossRef]
  5. Long, S.P.; Ort, D.R. More than taking the heat: Crops and global change. Curr. Opin. Plant Biol. 2010, 13, 240–247. [Google Scholar] [CrossRef] [PubMed]
  6. Taghizadeh-Alisaraei, A.; Tatari, A.; Khanali, M.; Keshavarzi, M. Potential of biofuels production from wheat straw biomass, current achievements and perspectives: A review. Biofuels 2023, 14, 79–92. [Google Scholar] [CrossRef]
  7. Wang, H.; He, Y.; Qian, B.; McConkey, B.; Cutforth, H.; McCaig, T.; Hoogenboom, G.; McLeod, G.; Zentner, R.; DePauw, R.; et al. Climate change and biofuel wheat: A case study of southern Saskatchewan. Can. J. Plant Sci. 2012, 92, 421–425. [Google Scholar] [CrossRef]
  8. Yadav, M.R.; Choudhary, M.; Singh, J.; Lal, M.K.; Jha, P.K.; Udawat, P.; Gupta, N.K.; Rajput, V.D.; Garg, N.K.; Maheshwari, C.; et al. Impacts, tolerance, adaptation, and mitigation of heat stress on wheat under changing climates. Int. J. Mol. Sci. 2022, 23, 2838. [Google Scholar] [CrossRef]
  9. Hossain, A.; Skalicky, M.; Brestic, M.; Maitra, S.; Ashraful, A.M.; Syed, M.A.; Islam, T. Consequences and mitigation strategies of abiotic stresses in wheat (Triticum aestivum L.) under the changing climate. Agronomy 2021, 11, 241. [Google Scholar] [CrossRef]
  10. Li, Y.; Cui, Z.; Ni, Y.; Zheng, M.; Yang, D.; Jin, M.; Chen, J.; Wang, Z.; Yin, Y. Plant density effect on grain number and weight of two winter wheat cultivars at different spikelet and grain positions. PLoS ONE 2016, 11, e0155351. [Google Scholar] [CrossRef] [PubMed]
  11. Feng, F.; Han, Y.; Wang, S.; Yin, S.; Peng, Z.; Zhou, M.; Gao, W.; Wen, X.; Qin, X.; Siddique, K.H.M. The effect of grain position on genetic improvement of grain number and thousand grain weight in winter wheat in north China. Front. Plant Sci. 2018, 9, 129. [Google Scholar] [CrossRef] [PubMed]
  12. Ferrante, A.; Savin, R.; Slafer, G.A. Relationship between fruiting efficiency and grain weight in durum wheat. Field Crops Res. 2015, 177, 109–116. [Google Scholar] [CrossRef]
  13. Philipp, N.; Weichert, H.; Bohra, U.; Weschke, W.; Schulthess, A.W.; Weber, H. Grain number and grain yield distribution along the spike remain stable despite breeding for high yield in winter wheat. PLoS ONE 2018, 13, e0205452. [Google Scholar] [CrossRef] [PubMed]
  14. Boz, H.; Gercekaslan, K.E.; Karaoglu, M.M.; Kotancilar, H.I.G. Differences in some physical and chemical properties of wheat grains from different parts within the spike. Turk. J. Agric. For. 2012, 36, 309–316. [Google Scholar] [CrossRef]
  15. Li, H.S.; Cao, X.Y.; Song, J.M.; Liu, P.; Cheng, D.G.; Liu, A.F.; Wang, C.G.; Liu, J.J.; Sun, Z.J. Effects of spikelet and grain positions on grain weight and protein content of different wheat varieties. Acta Agron. Sin. 2017, 43, 238–252. (In Chinese) [Google Scholar] [CrossRef]
  16. Slavin, J.; Tucker, M.; Harriman, C.; Jonnalagadda, S.S. Whole grains: Definition, dietary recommendations, and health benefits. Cereal Foods World 2013, 58, 191–198. [Google Scholar] [CrossRef]
  17. Abdipour, M.; Ebrahimi, M.; Izadi-Darbandi, A.; Mastrangelo, A.M.; Najafian, G.; Arshad, Y.; Mirniyam, G. Association between grain size and shape and quality traits, and path analysis of thousand grain weight in Iranian bread wheat landraces from different geographic regions. Not. Bot. Horti Agrobot. Cluj-Napoca 2016, 44, 228–236. [Google Scholar] [CrossRef]
  18. Armstrong, B.G.; Weiss, M.; Grieg, R.I.; Dines, J.; Gooden, J.; Aldred, G.P. Determining screening fractions and kernel roundness with digital image analysis. In Proceedings of the 11th Australian Barley Technical Symposium, Glenelg, Australia, 7–10 September 2003. [Google Scholar]
  19. Louhaichi, M.; Borman, M.M.; Johnson, D.E. Spatially located platform and aerial photography for documentation of grazing impacts on wheat. Geocarto Int. 2001, 16, 65–70. [Google Scholar] [CrossRef]
  20. Aniskina, T.S.; Baranova, E.N.; Lebedev, S.V.; Reger, N.S.; Besaliev, I.N.; Panfilov, A.A.; Kryuchkova, V.A.; Gulevich, A.A. Unexpected effects of sulfate and sodium chloride application on yield qualitative characteristics and symmetry indicators of hard and soft wheat kernels. Plants 2023, 12, 980. [Google Scholar] [CrossRef]
  21. Aniskina, T.S.; Sudarikov, K.A.; Levinskikh, M.A.; Gulevich, A.A.; Baranova, E.N. Bread wheat in space flight: Is there a difference in kernel quality? Plants 2023, 13, 73. [Google Scholar] [CrossRef] [PubMed]
  22. Barbosa, B.D.S.; Ferraz, G.A.S.; Goncalves, L.M.; Marin, D.B.; Maciel, D.T.; Ferraz, P.F.P.; Rossi, G. RGB vegetation indices applied to grass monitoring: A qualitative analysis. Agron. Res. 2019, 17, 349–357. [Google Scholar]
  23. Gitelson, A.A.; Kaufman, Y.J.; Stark, R.; Rundquist, D. Novel algorithms for remote estimation of vegetation fraction. Remote Sens. Environ. 2002, 80, 76–87. [Google Scholar] [CrossRef]
  24. Fan, C.; Xing, Y.; Mao, H.; Lu, T.; Han, B.; Xu, C.; Li, X.; Zhang, Q. GS3, a major QTL for grain length and weight and minor QTL for grain width and thickness in rice, encodes a putative transmembrane protein. Theor. Appl. Genet. 2006, 112, 1164–1171. [Google Scholar] [CrossRef]
  25. Takano-Kai, N.; Jiang, H.; Kubo, T.; Sweeney, M.; Matsumoto, T.; Kanamori, H.; Padhukasahasram, B.; Bustamante, C.; Yoshimura, A.; Doi, K.; et al. Evolutionary history of GS3, a gene conferring grain length in rice. Genetics 2009, 182, 1323–1334. [Google Scholar] [CrossRef]
  26. Song, X.-J.; Huang, W.; Shi, M.; Zhu, M.-Z.; Lin, H.-X. A QTL for rice grain width and weight encodes a previously unknown RING-type E3 ubiquitin ligase. Nat. Genet. 2007, 39, 623–630. [Google Scholar] [CrossRef] [PubMed]
  27. Shomura, A.; Izawa, T.; Ebana, K.; Ebitani, T.; Kanegae, H.; Konishi, S.; Yano, M. Deletion in a gene associated with grain size increased yields during rice domestication. Nat. Genet. 2008, 40, 1023–1028. [Google Scholar] [CrossRef] [PubMed]
  28. Nadolska-Orczyk, A.; Rajchel, I.K.; Orczyk, W.; Gasparis, S. Major genes determining yield-related traits in wheat and barley. Theor. Appl. Genet. 2017, 130, 1081–1098. [Google Scholar] [CrossRef]
  29. Mangini, G.; Blanco, A.; Nigro, D.; Signorile, M.A.; Simeone, R. Candidate genes and quantitative trait loci for grain yield and seed size in durum wheat. Plants 2021, 10, 312. [Google Scholar] [CrossRef] [PubMed]
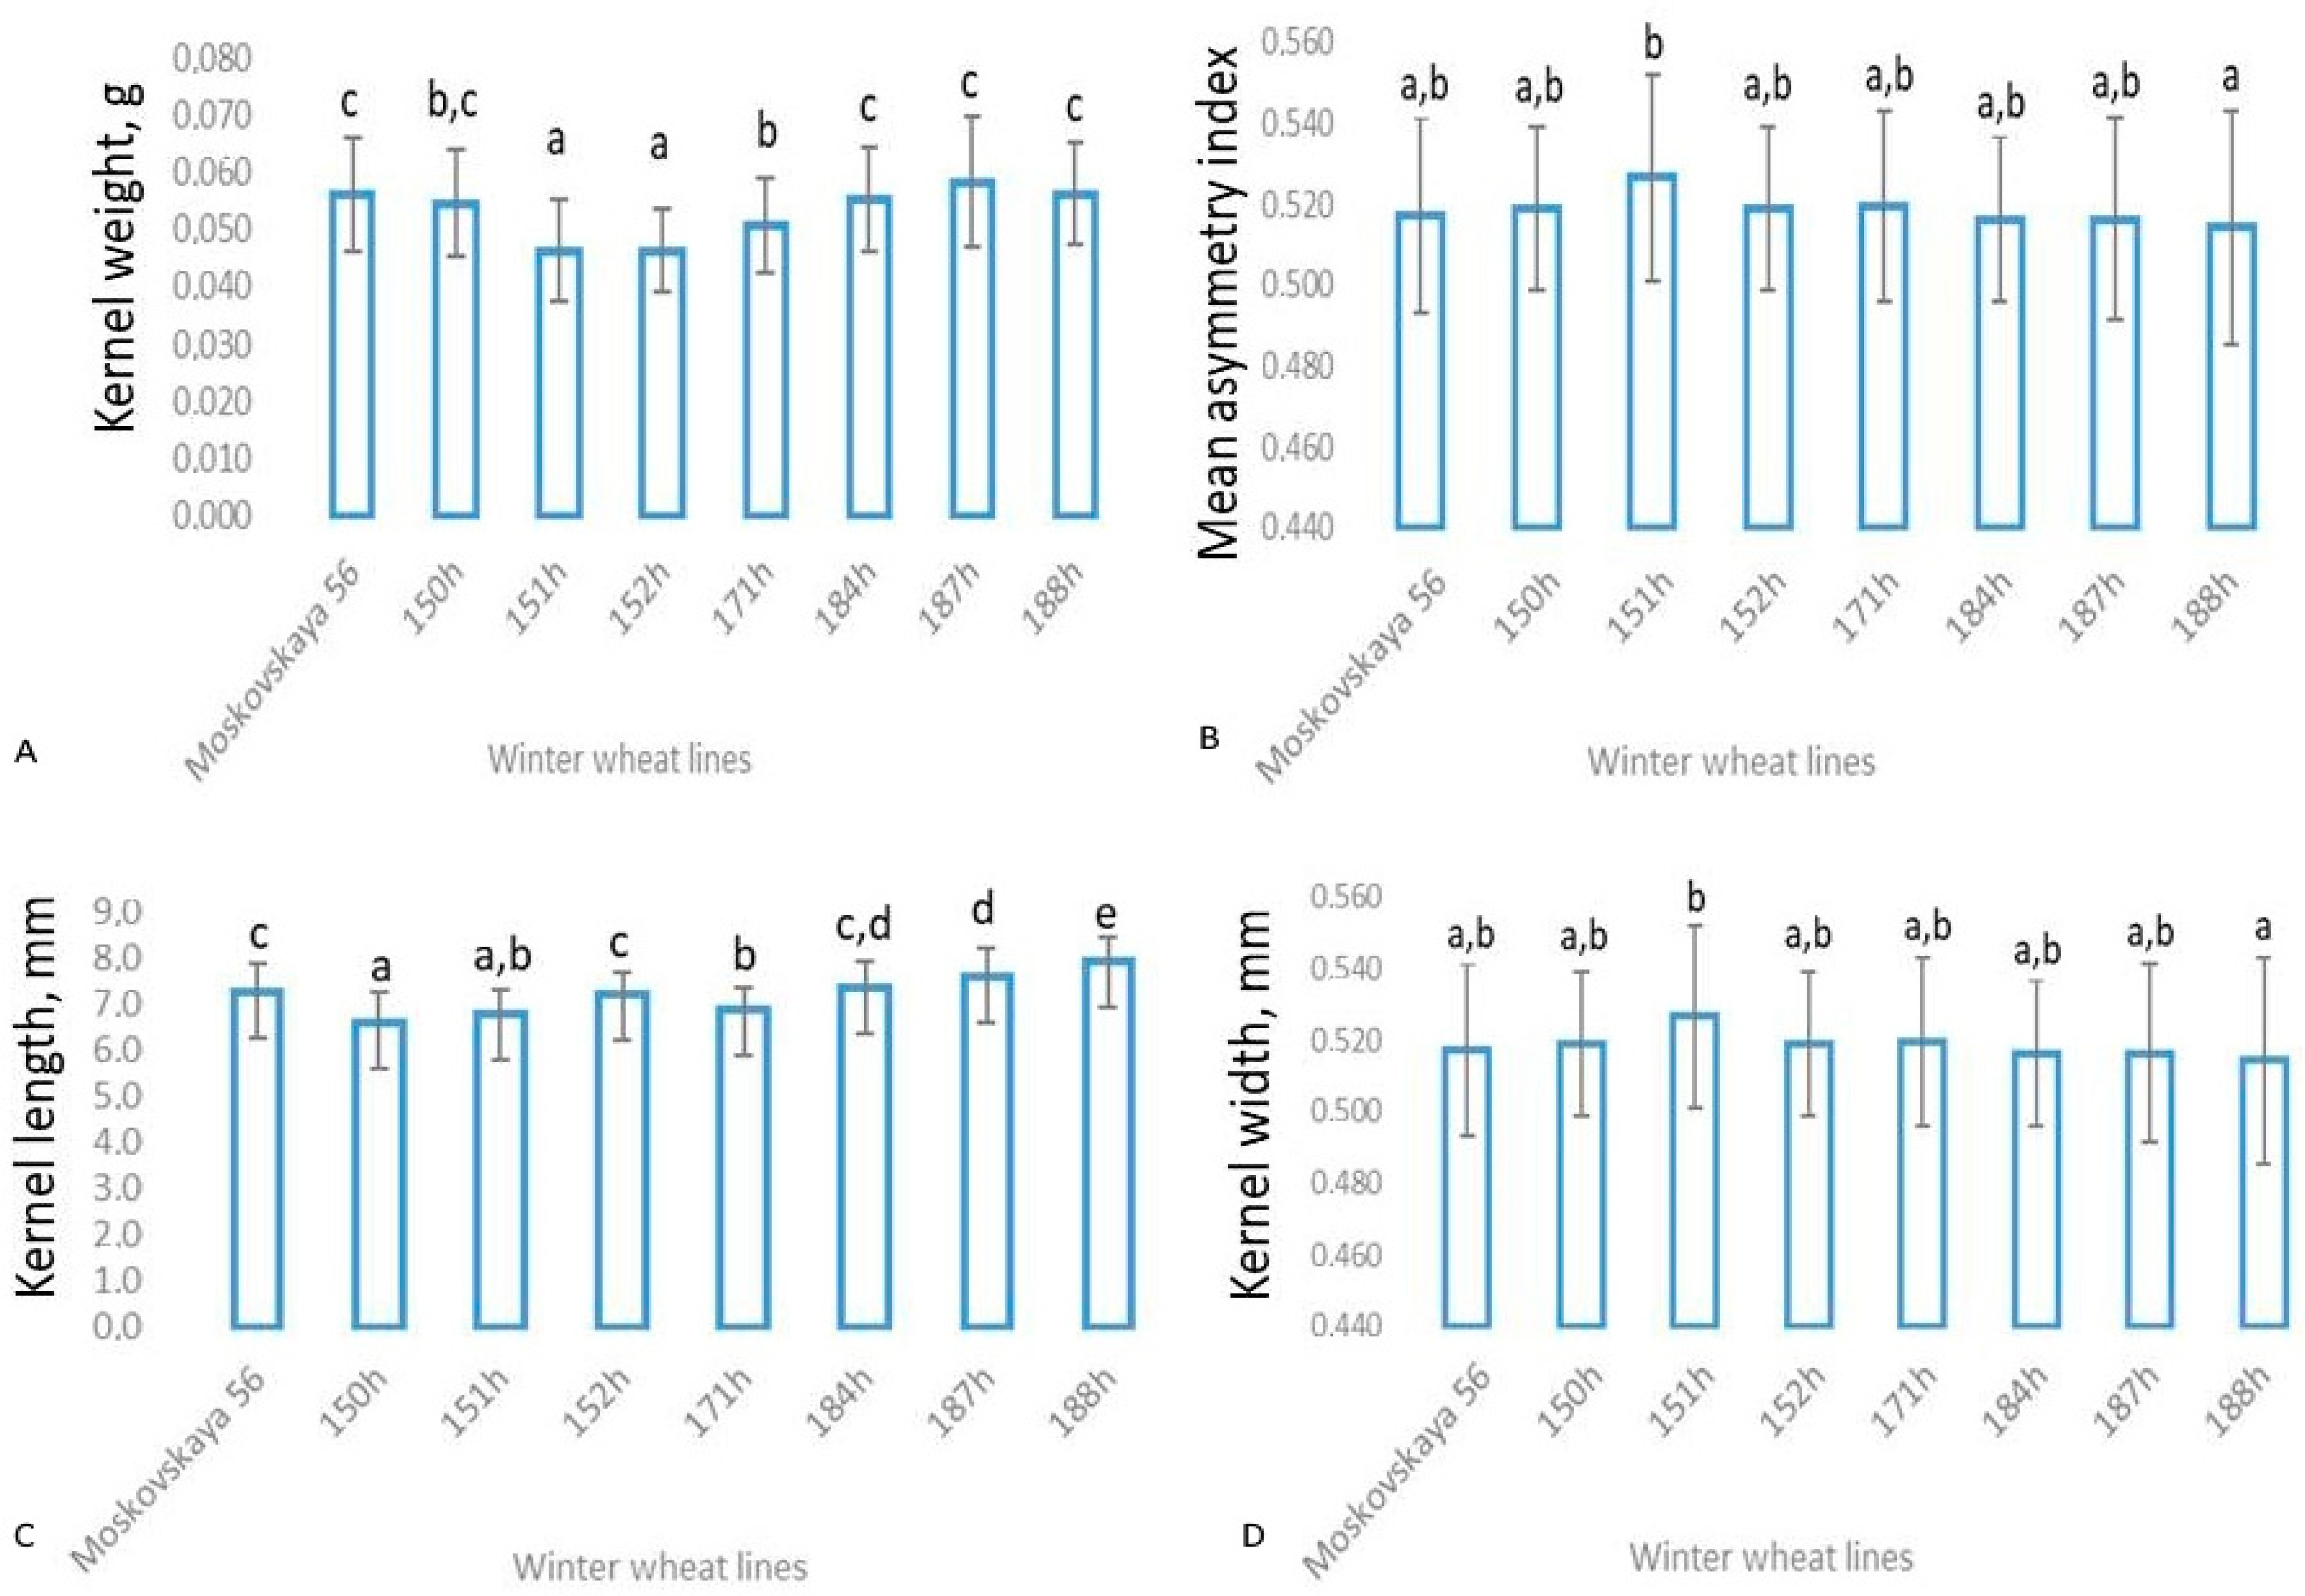
Figure 1. Distribution frequencies of the evaluated traits in winter soft wheat of the Moskovskaya 56 variety and some promising lines. Legend: (A)—kernel weight; (B)—mean asymmetry index; (C)—kernel length; (D)—kernel width. Letters show the comparison of arithmetic means by the one-way analysis of variance with Duncan’s post hoc test (p = 0.05).
Applsci 14 11885 g001
Figure 2. The most variable variation coefficients (exceeding 10%) of the assessed characteristics and indices obtained on their basis for comparative evaluation of winter wheat samples, %.
Applsci 14 11885 g002
Table 1. Winter wheat genotypes included in the 2022/2023 field experiment.
No.Genotypes
1Moskovskaya 56 st ((Mironovskaya Semi-intensive × Inna) × Moskovskaya 39)Control
2150h (L-1 × Lutescens N4 (Germany))F6 generation
3151h (L-1 × Lutescens N2 (Germany))F6 generation
4152h (L-1 × Lutescens N5 (Germany))F6 generation
5171h (Nemchinovskaya 24 × Lutescens N20 (Germany))F6 generation
6184h (Grom × Lutescens N19 (Germany))F6 generation
7187h (Bagrat × Lutescens N19 (Germany))F6 generation
8188h (Bagrat × Lutescens N24 (Germany))F6 generation
Table 2. Regression equations for predicting some wheat traits by 1–5: grain cut index, roundness index and grain asymmetry index. The quality of the equation is shown by the coefficient of determination (R2) and the standard error of estimation (SEE), and the criterion for including the index in the equation at F < 0.05 are indicated.
Plant TraitEquation Quality R2; SEELinear Regression EquationDeciphering the Terms of the Equation
Plant height0.776; 3.6y = 926.745a − 920.030b + 72.919y—plant height, a—index 1, b—index 3, constant
Plant height0.840; 3.2y = 1156.286a − 737.155b − 577.281c + 154.056y—plant height, a—index 1, b—index 3, c—index 2, constant
Tillering rate0.843; 0.077y = 39.467a − 20.247b − 8.738y—tillering rate, a—index 3, b—index 2, constant
Tillering rate0.923; 0.056y = 43.665a − 40.681b + 2.714c − 1.892y—tillering rate, a—index 3, b—index 2, c—roundness index, constant
Gluten content0.795; 0.658y = 256.846a − 157.628b − 380.710c + 155.778y—gluten content, a—index 1, b—index 4, c—asymmetry index, constant
Disclaimer/Publisher’s Note: The statements, opinions and data contained in all publications are solely those of the individual author(s) and contributor(s) and not of MDPI and/or the editor(s). MDPI and/or the editor(s) disclaim responsibility for any injury to people or property resulting from any ideas, methods, instructions or products referred to in the content.