Article

Measuring Electromagnetic Properties of Vegetal Soil for Wireless Underground Sensor Networks in Precision Agriculture

by
Maroua Said
1,
Jaouhar Fattahi
2,*,
Said Ghnimi
1,
Ridha Ghayoula
3,* and
Noureddine Boulejfen
4
1
Microwave Electronics Research Laboratory (MERLAB), Faculty of Sciences of Tunis, University of Tunis El Manar, Tunis 2092, Tunisia
2
Department of Computer Science and Software Engineering, Laval University, 2325, Rue de l’Université, Quebec, QC G1V 0A6, Canada
3
Faculty of Engineering, Moncton University, Moncton, NB E1A 3E9, Canada
4
Centre for Research on Microelectronics and Nanotechnology, Technopole of Sousse, Sousse 4050, Tunisia
*
Authors to whom correspondence should be addressed.
Appl. Sci. 2024, 14(24), 11884; https://doi.org/10.3390/app142411884
Submission received: 22 October 2024 / Revised: 20 November 2024 / Accepted: 11 December 2024 / Published: 19 December 2024

Abstract

:
This research examines and analyzes the measured electromagnetic characteristics of vegetal soil for Wireless Underground Sensor Networks applied to precision agriculture. For this, we used Wireless Underground Sensor Network (WUSN) technology, which consists of sensors that communicate through the soil to collect data on irrigation, such as temperature and humidity, for good plant growth. However, underground communication channels and signal transmission are required to travel through a dense and heterogeneous soil mixture. For the measurement results of the vegetal soil dielectric parameters, a precision domain sensing probe operating at 433 Mhz was used. Moreover, the different choices of capacitance, inductance, and varactor were included, with a reasonable estimation of the dielectric permittivity, ranging from 2 to 15, and an unlimited range of conductivities. Despite promising results in predicting the dielectric permittivities, several improvements were made to the mode for low permittivity values, and it was designed to accommodate a wide range of dielectric permittivities.

1. Introduction

In the last decade, the evolution of embedded and distributed systems has led to the development of a new type of network, which is known as a Wireless Sensor Network (WSN) [1]. This architecture has been established in several fields, such as telemedicine, home automation, precision agriculture, and many other potential applications. A WSN deploys numerous small devices called intelligent sensors, which collect detailed environmental information.
Recently, WSNs have become increasingly important in precision agriculture. This field involves processing features that can optimize crop yields, provide information for better management decisions, and reduce chemical and fertilizer consumption.
A natural extension of the Wireless Sensor Network is the Wireless Underground Sensor Network (WUSN) [2,3,4,5,6], consisting of a group of buried nodes that communicate through an underground channel. The evolution of WUSNs has shown promising applications in precision agriculture. As a result, WUSNs have transformed agriculture from traditional methods to modern practices through the concept of the “Internet of Things” (IoT). WUSNs enable continuous monitoring of biochemical soil parameters, with well-targeted nodes observing regions or phenomena of interest. The captured data are routed via multi-hop routing to a node designated as a “collection point”, called a sink node or base station. These sensors can connect users to the network via the internet or satellite. This technology offers numerous advantages, such as ease of deployment, timely data collection, reliability, coverage density, communication techniques, and underground wireless networking, leading to potential applications in precision agriculture [7,8].
The flexibility of their interface makes WUSNs ideal candidates for providing efficient and economically viable solutions in precision agriculture. Despite their potential advantages, several significant challenges remain, with regard to improving the performance of underground networks.
The WUSN [9,10] was the main element of this research. Depending on the data required for precision agriculture, various types of sensors can be envisaged, such as humidity, temperature, salinity, and pH sensors. These sensors are deployed in a network of equidistant nodes at depths of up to 70 cm. Further research was needed, to ensure their accuracy for different soil types and to evaluate their performance under subsoil moisture and pressure conditions.
An intelligent communication system needed to be implemented, to route the data collected by the various sensors to the base station responsible for aggregating all the data. In this network, communication occurs by using multi-hop methods, where a node can transmit its data to neighboring nodes.
Thus, the communication protocol had to seek the optimal path between the concerned node and the base station while considering the nodes to be used to optimize energy consumption at each node. To minimize the network’s cost, communication between the various nodes would be wireless, using the underground as the communication channel instead of air. Different soil types had to be characterized, to determine the best frequencies to minimize attenuation. Additionally, a study of the propagation of electromagnetic waves in the subsoil had to be conducted, accounting for the scattering of waves from buried objects that may be present along the path between the nodes. Finally, particular importance needed to be attached to bidirectional communication between the sink node(s) and the base station on the surface. Due to the subsurface/air interface, reflections occur at this boundary, further reducing communication quality.
This article aimed to characterize the soil itself, to study underground communication, and to examine the propagation characteristics of electromagnetic waves in the soil, considering factors such as moisture content, temperature, general geological structure, and the frequency of the incident electromagnetic radiation. This characterization plays a pivotal role in determining the dielectric constant.
Measuring complex dielectric properties has gained significant interest in precision agriculture, particularly as applied to Wireless Underground Sensor Networks (WUSNs). The dielectric constant is a critical parameter that characterizes the behavior of the soil. The electromagnetic properties of the soil significantly influence the performance of underground penetration and the propagation of waves that transmit and collect data through the soil. When the transmitted signal reaches the soil, it propagates back toward the surface. Factors such as temperature, salinity, and mineral content affect connectivity and communication success. The waves experience attenuation, due to the high density and complex mixture of minerals, water, air, and organic matter in the soil.
Many agronomic and hydrological studies rely on precise measurements of soil dielectric permittivity. Current systems use sensors based on reflectometry, a diagnostic method where a signal is sent into the medium being assessed. This signal propagates according to established laws, and part of its energy is reflected when it encounters an impedance mismatch. The reflected signal (reflection coefficient) can provide valuable information about the system. In regard to achieving our goals, numerous studies have shown that MHz frequency bands can effectively operate for underground communications, employing techniques such as Time Domain Reflectometry (TDR) or Frequency Domain Reflectometry (FDR) [11,12,13]. These techniques offer precise instrumentation for estimating the complex dielectric permittivity of various soil types. Other probes commonly used in TDR and FDR agriculture serve to calculate the complex dielectric permittivity of different soil types.
It is important to note that the current measurement methods do not fully meet the technological demands of the market. The limitations stem from the high costs associated with TDR and the need for calibration in FDR systems. Therefore, there is a need for better calibration than current FDR sensors provide, as well as a more affordable solution, compared to the available TDR meters. Consequently, applying FDR sensors in the 433 MHz frequency range appears promising, particularly for achieving a more universal calibration than existing FDR sensors and at a lower cost than current TDR meters.
This article presents the design of an underground probe that addresses the challenges of underground channel communications. It represents an initial step toward developing an efficient prototype for measuring dielectric soil permittivity in a Wireless Sensor Network. The proposed probe measures complex dielectric permittivity at a frequency of 433 MHz, suitable for low-power transceivers such as those using LoRa technology. This paper is organized into several sections. The first part, titled “Introduction”, presents the context and objectives of the study. Next, the “Materials and Methods” section describes the materials used and the experimental methods employed to conduct the research. The third part, “Results and Discussion”, presents the findings and analyzes them in comparison to the existing literature. Finally, the “Conclusions” section summarizes the key insights from the study and suggests directions for future research.

2. Materials and Methods

The system is composed of several key components, each contributing to the overall functionality of measuring soil dielectric permittivity:
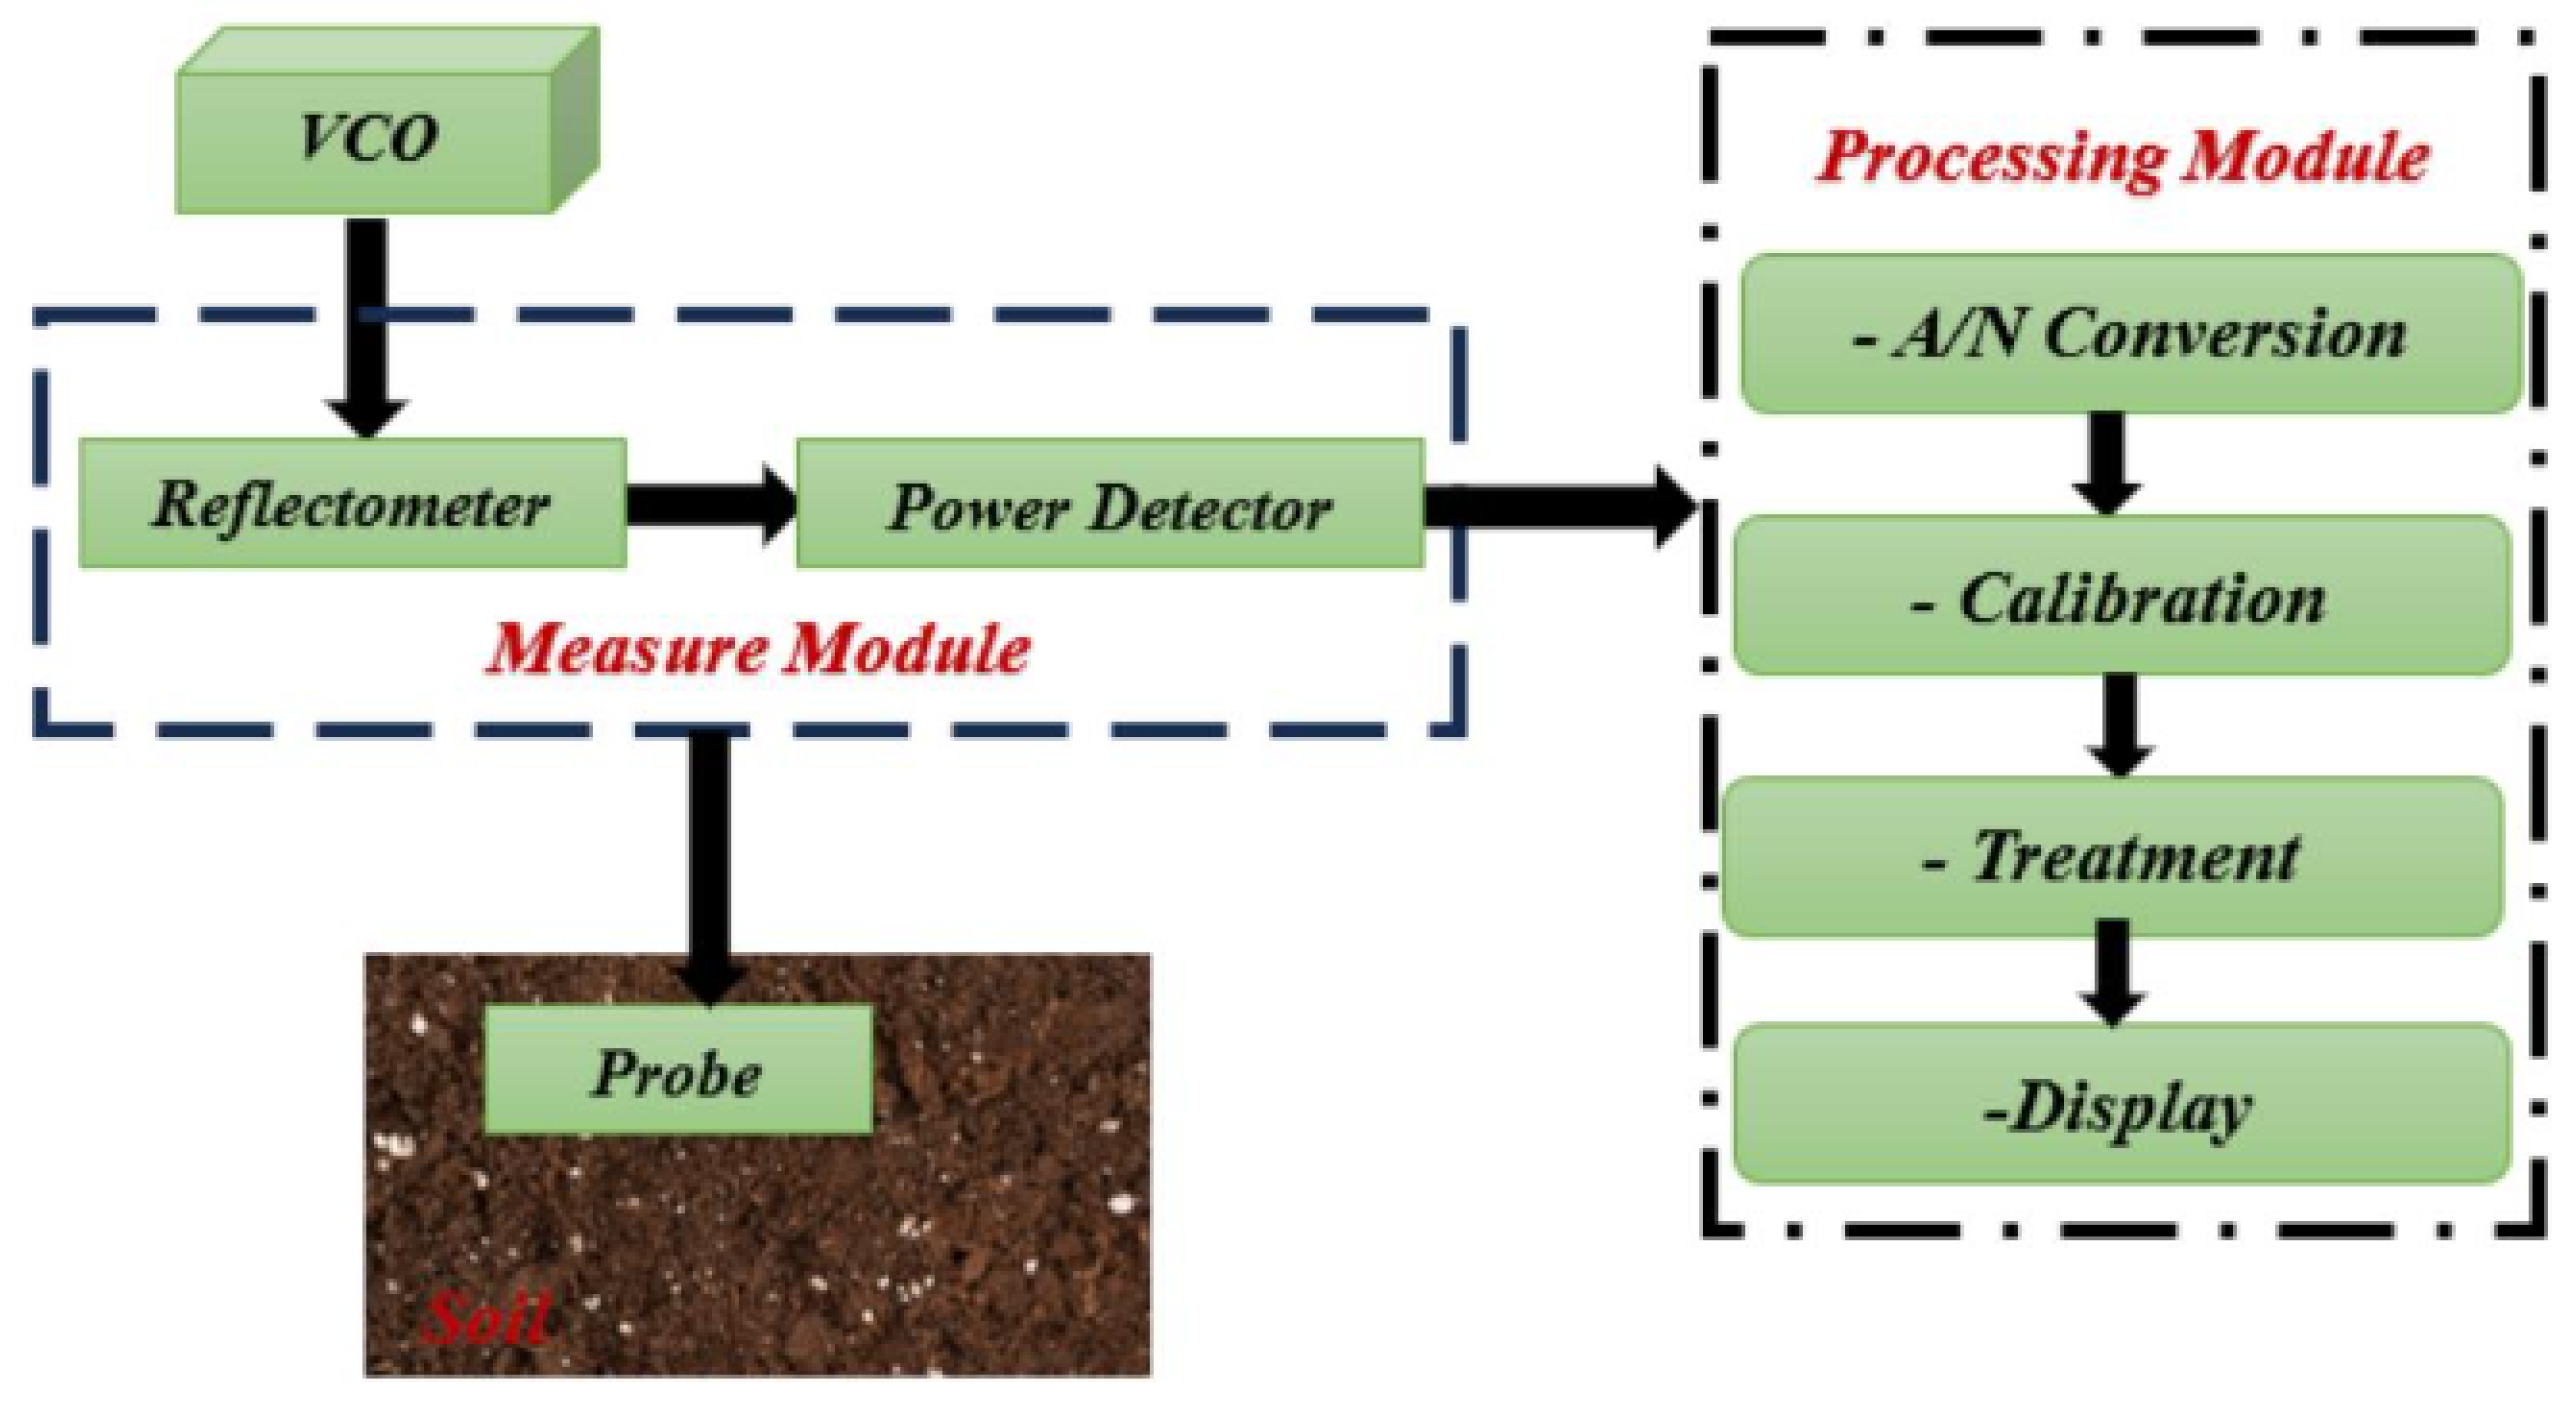
  • Voltage-Controlled Oscillator (VCO): This device generates a Continuous Wave (CW) signal, which is essential for the measurement process.
  • Measurement Module: This module includes the following components:
    Power Detector: Measures the power levels of the signals.
    Reflectometer: Performs reflectometry measurements in the frequency domain, enabling precise determination of reflection coefficients.
  • Processing Module: Driven by an Analog-to-Digital Converter (ADC), this module orchestrates the calibration process and displays the data collected from the measurement module. It ensures accurate interpretation and visualization of the data.
  • Probe: The probe is employed to measure the dielectric properties of the soil. It integrates various components to harmonize with the soil environment, ensuring accurate and reliable measurements.
This paper focused on the design of the probe and addressed the various challenges associated with its development, as shown in Figure 1 [14]:

2.1. Frequency Band Selection

The choice of the operating underground frequency was crucial, as attenuation caused by the soil increases with frequency. Investigating signal propagation through the soil as a transmission channel under challenging conditions and analyzing the quality of the electromagnetic waves were among the most complex aspects of this study. Many studies have indicated that the UHF frequency band is promising for underground communications.
To validate this, we meticulously designed an experiment involving LoRa modules [15]. The experiment entailed burying LoRa modules, as shown in Figure 2, in holes 70 cm deep and spaced 2 m apart. We set up six holes with a total distance of 12 m between the first and last hole, ensuring comprehensive coverage. The LoRa modules were configured to send messages from the LoRa transmitter to the LoRa receiver over the 433 MHz Radio Frequency. The goal of this experiment was to determine the suitability of the 433 MHz frequency for underground communication.
Figure 3 illustrates the thoroughness of our experimental setup:
The settings for the LoRa modules, chosen to achieve underground communication, are shown in Table 1 and Table 2:
The soil characterization was intended for buried sensor communication; we selected the lower frequency (433 MHz) for reduced propagation loss. We successively tested these outdoor nodes for underground-to-underground data transmissions under various operating conditions and radio parameters, as shown in Table 2. The results show stable packet reception between the RX (receiver) and TX (transmitter) nodes operating at 433 MHz, with no packet losses.
The wireless transmission in the LoRa standard (ITU-T Y.4480) [16] was carried out on specific ISM frequency bands, including 433 MHz, 865 MHz, and 915 MHz, on a default bandwidth of 125 KHz. This selection determined the time required to modulate the data packet using Cyclic Redundancy Check (CRC), Spreading Factor (SF), and RSSI value Figure 4. The radiated transmission power was limited, since LoRa operates within the ISM frequency bands. To achieve a broader radio range than conventional modulation types, such as Frequency Shift Keying (FSK), the sensitivity of the LoRa receiver was significantly improved, so as to successfully receive and decode a useful LoRa signal even up to 20 dB below the noise level.
Higher frequencies result in shorter wavelengths; however, 433 MHz and 868 MHz can exhibit similar Radio Frequency (RF) transmission performance, because many factors influence this performance.
  • 433 MHz LoRaWAN Network: This network operates in the 433 MHz frequency band, commonly used for short-range, low-power communications worldwide. It offers good underground penetration through obstacles and is suitable for remote control Wireless Underground Sensor Networks (WUSNs) and IoT applications.
  • 868 MHz LoRaWAN Network: This network operates in the 868 MHz frequency band, allocated for short-range, low-power communications in Europe and certain other regions. It offers an extended range compared to the 433 MHz network, making it a preferred choice for IoT, smart city applications, and industrial monitoring.
LoRa transmits over license-free Megahertz Radio Frequency bands: 169 MHz, 433 MHz (Asia), 868 MHz (Europe), and 915 MHz (North America). LoRa enables very Long-Range wireless data transmission, with communications reaching ten miles or more in rural areas using low power. In Tunisia, both 433 MHz and 868 MHz are permitted. Since the soil characterization was intended for buried sensor communication, we selected the lower frequency (433 MHz) for reduced propagation loss. We successively tested these outdoor nodes for underground-to-underground data transmissions under various operating conditions and radio parameters. The results showed stable packet reception between the RX (receiver) and TX (transmitter) nodes operating at 433 MHz, with no packet losses.

2.2. The Probe

Frequency Domain Reflectometry (FDR) was used to determine moisture content in the soil. The proposed FDR probe measures the capacitance based on the change in frequency of reflected radio waves at the resonance frequency of 433 MHz. The probe primarily comprises a pair of circular plate capacitors, with the soil acting as the dielectric. The sensor capacitance is proportional to the polarization between the measured dielectric constant and the medium.
The probe was designed to accommodate a wide range of dielectric permittivity from 2 to 15, allowing it to measure soil moisture and the electromagnetic wave propagation properties at a target depth. This adaptability ensures that the probe can be used in various soil conditions. It operates in a frequency domain within the range of 433 MHz. A key advantage of the Frequency Domain Reflectometry approach is that it allows for the detection of changes in salt concentration, which significantly reduce the real part of the dielectric constant ( ε ), compared to traditional Time Domain Reflectometry (TDR), which measures apparent permittivity [17,18].
The soil volumetric water content could be measured using the sensor capacitance and the corresponding relationship with soil moisture. FDR, with its faster response time compared to TDR, ensured efficient soil moisture measurement. The design of the probe required careful selection of the capacitor’s form, size, and the distance between the rods, to optimize performance.

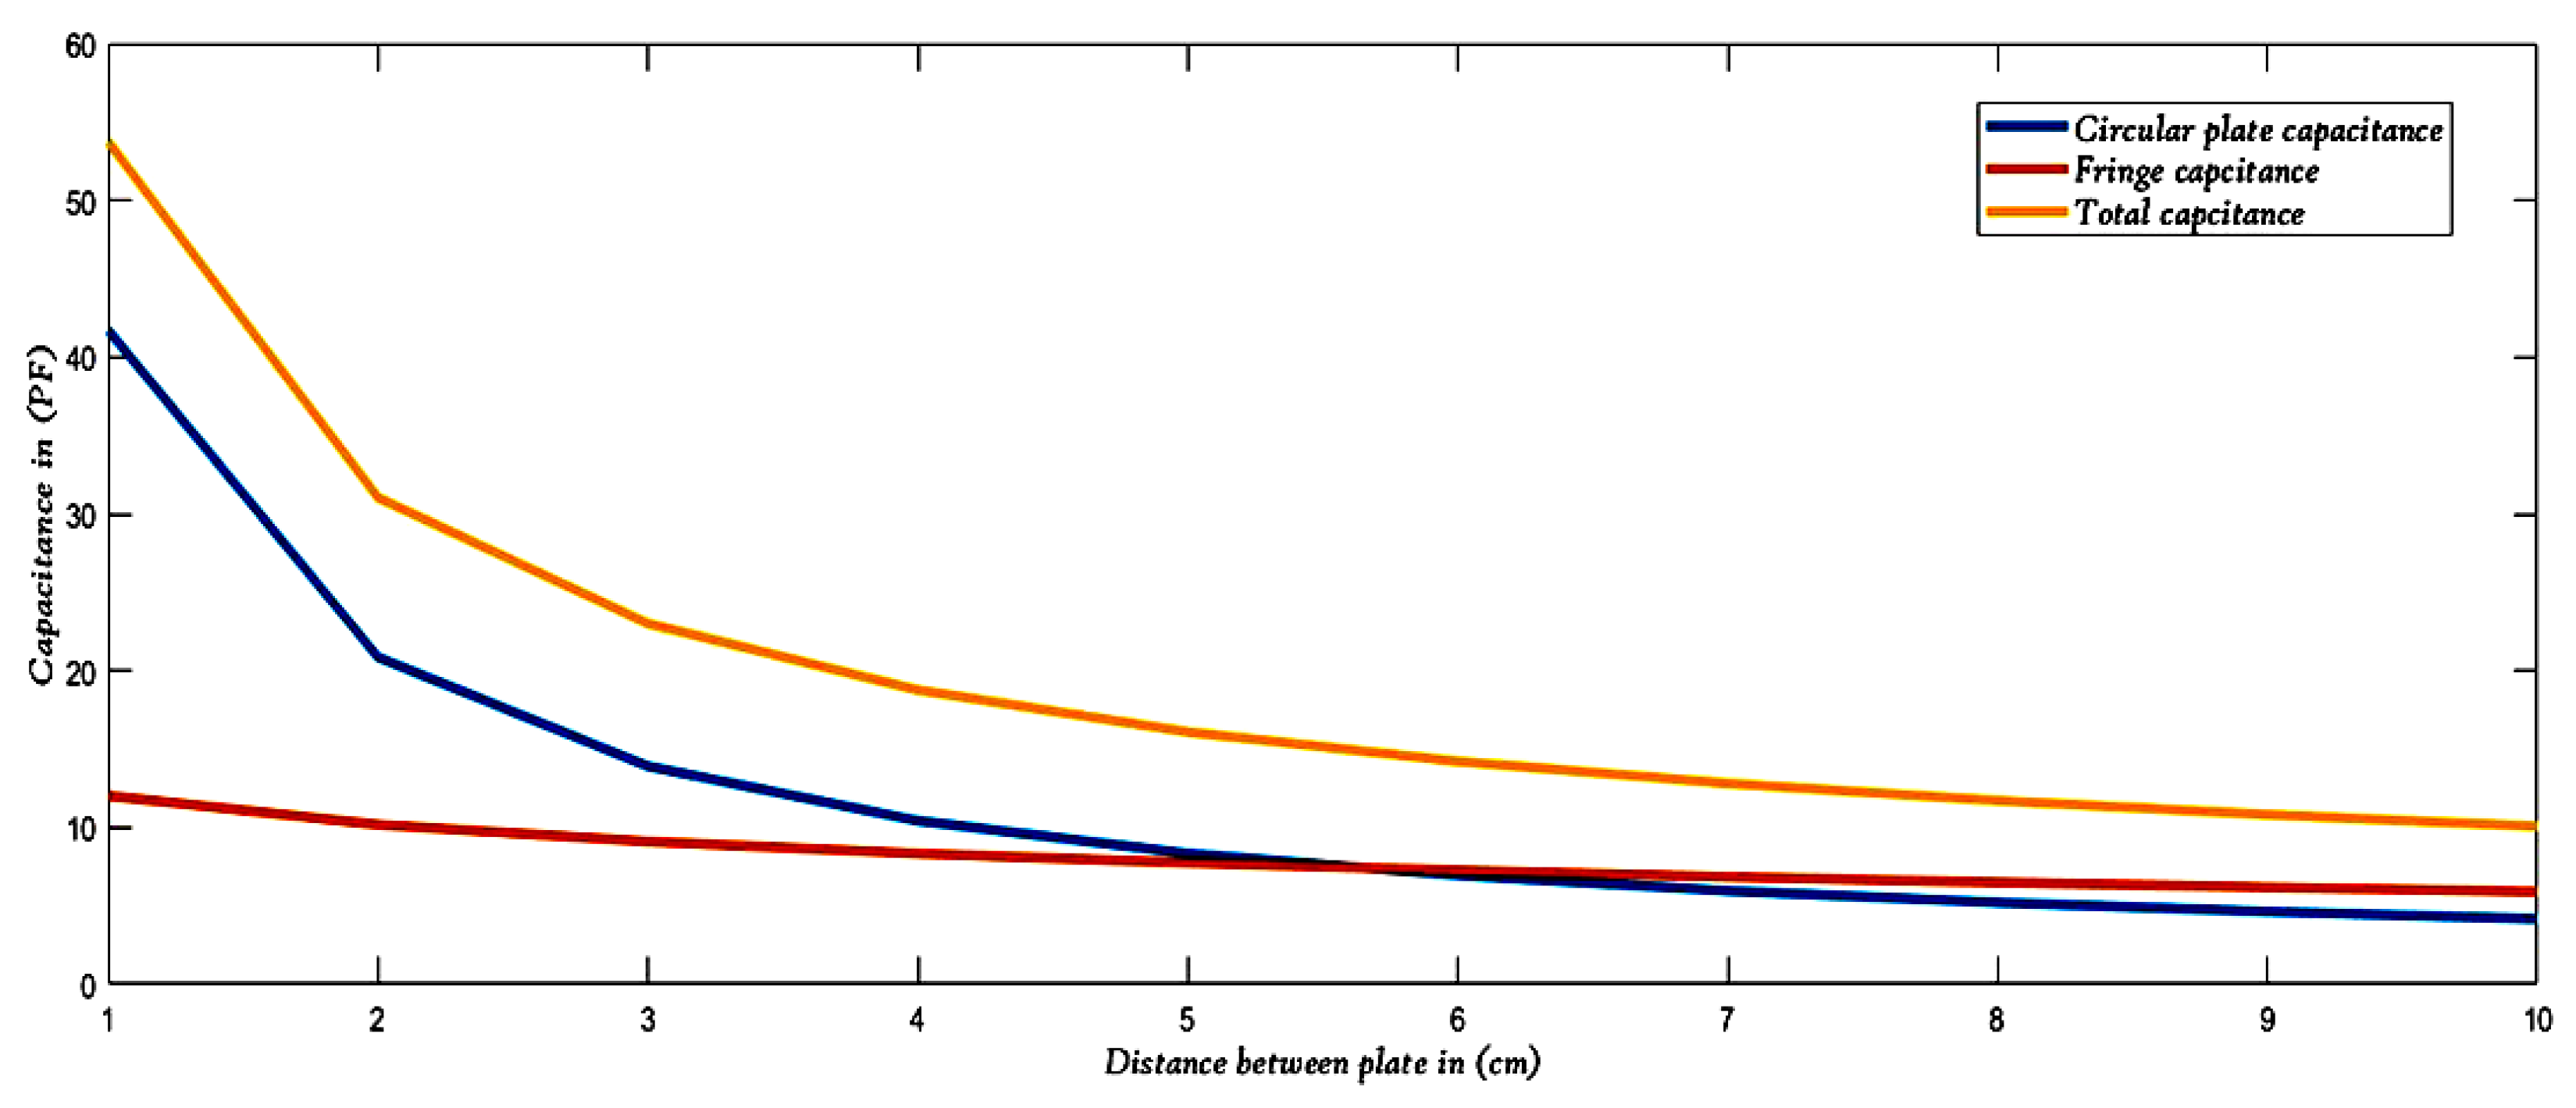
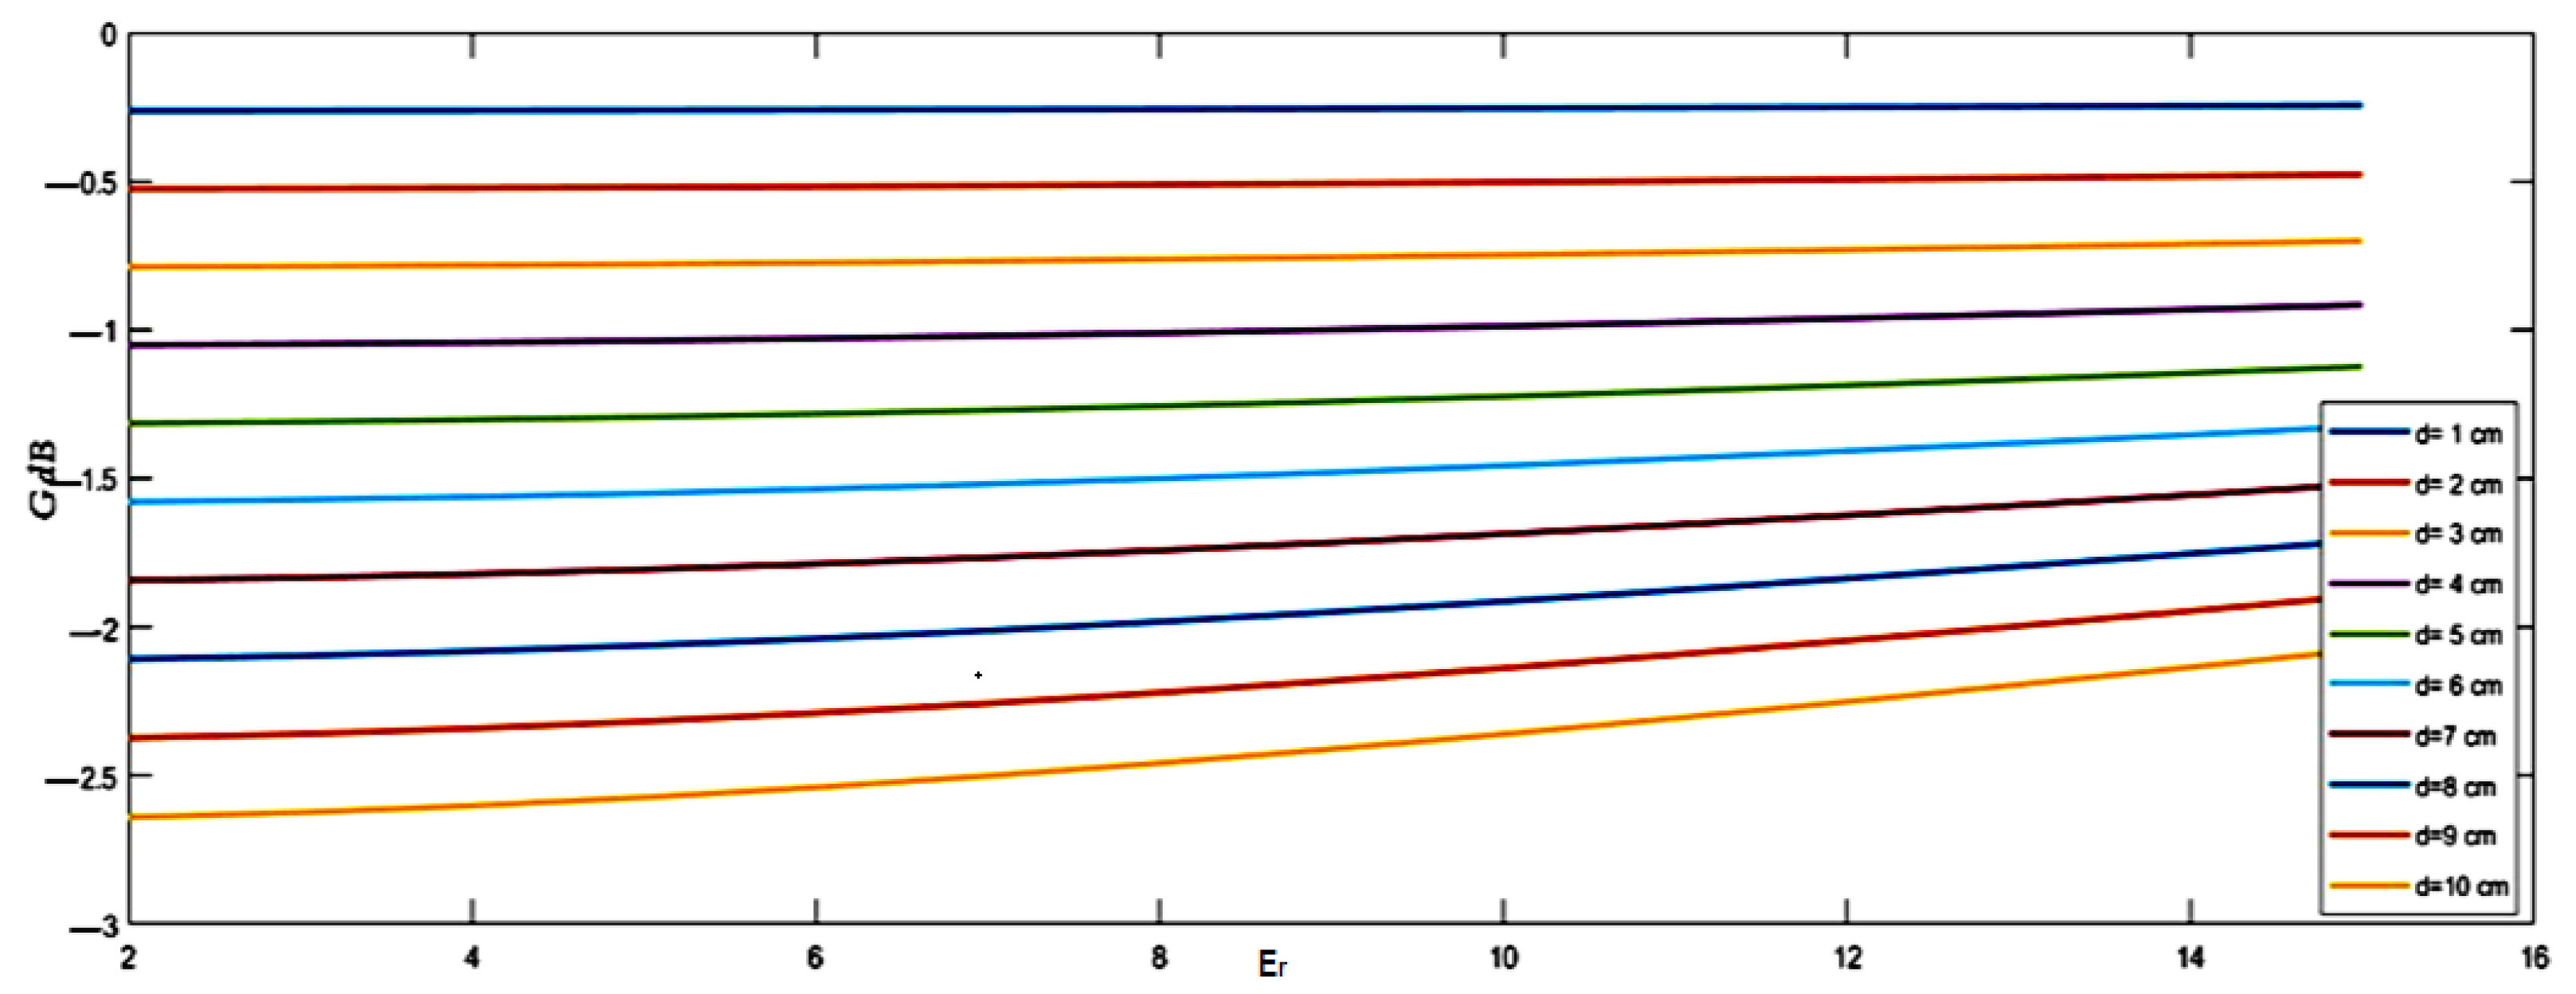
2.2.1. Capacitor Sizing

The electrical soil model was used at the center frequency of 433 MHz. A critical step was sizing the capacitor, which was essential for enhancing the quality of information transfer and measurement accuracy. This task was particularly challenging, due to the conductive nature of the soil, which added a layer of complexity to our work.
There are two types of parallel plate capacitors to consider: those with circular plates and those with rectangular plates. To size the capacitor, we conducted a study of capacitance parameters, to determine the optimal values for the designed capacitor probe. The outcomes of these tests are presented in Figure 5 and Figure 6 below.
The simulated results in Figure 7 and Figure 8 highlight the impact of the distance between the parallel plates. Notably, as the separation distance between the plates increased, the total capacitance of the circular parallel plates diminished. This phenomenon can be attributed to the reduction in the edge effect associated with fringe capacitance. Furthermore, it is observed that the fringe effect in the circular parallel plate capacitors was significantly reduced compared to that in the rectangular parallel plate capacitors.
The capacitance of parallel plate capacitors is directly proportional to the area a of the plates. For circular parallel plate capacitors, the capacitance is also proportional to the radius r. Therefore, the capacitance will vary directly with any increase or decrease in the area or radius of the plates, respectively.
In this context, let r represent the radius of the plates, ε r denote the relative permittivity of the dielectric material situated between the plates, and d indicate the thickness of the dielectric material or the separation distance between the plates.
For fixed values of ε r and r, any alteration in the thickness d of the dielectric medium will result in changes to the capacitance of the capacitor, as illustrated in Figure 9. Specifically, increasing the separation distance d between the two plates leads to a decrease in capacitance. This is because a larger separation reduces the electric field strength between the plates, thereby diminishing the capacitor’s ability to store charge.
Conversely, reducing the separation distance d enhances the capacitance, as the electric field strength increases, allowing the capacitor to store more charge for a given voltage.
In addition, the radius of the plates plays a crucial role in determining the capacitance. Increasing the radius r of the plates expands the area available for charge storage, resulting in an increase in capacitance. This relationship is due to the fact that capacitance is directly proportional to the plate area.
On the other hand, reducing the area of the plates, which occurs when the radius r is decreased, results in a lower capacitance. Thus, both the thickness of the dielectric medium and the size of the plates significantly influence the performance characteristics of the capacitor.

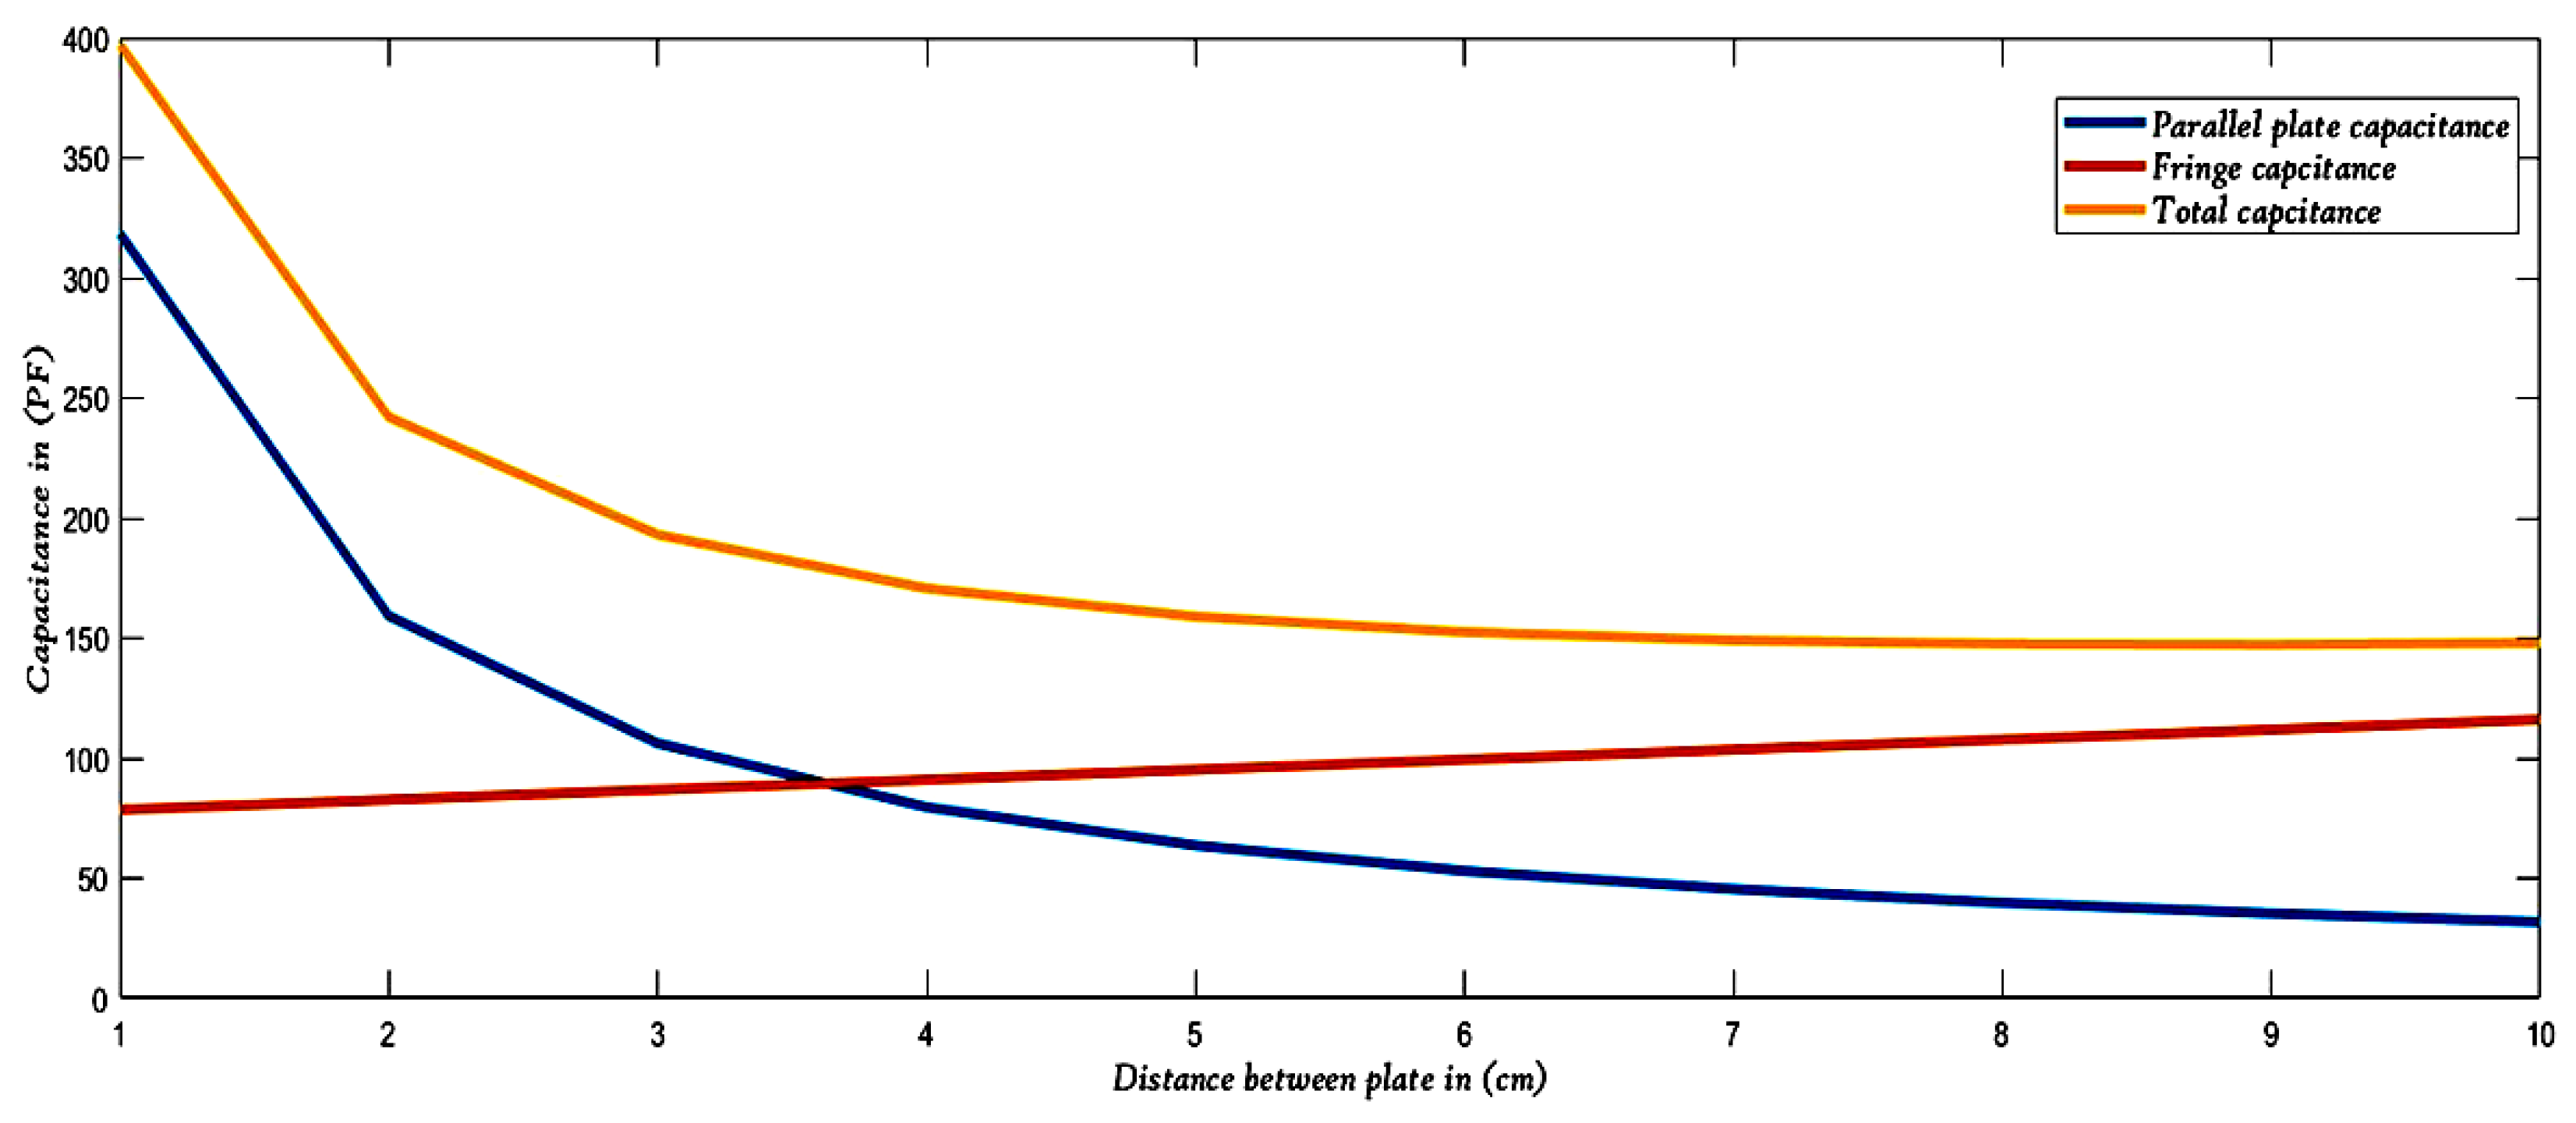
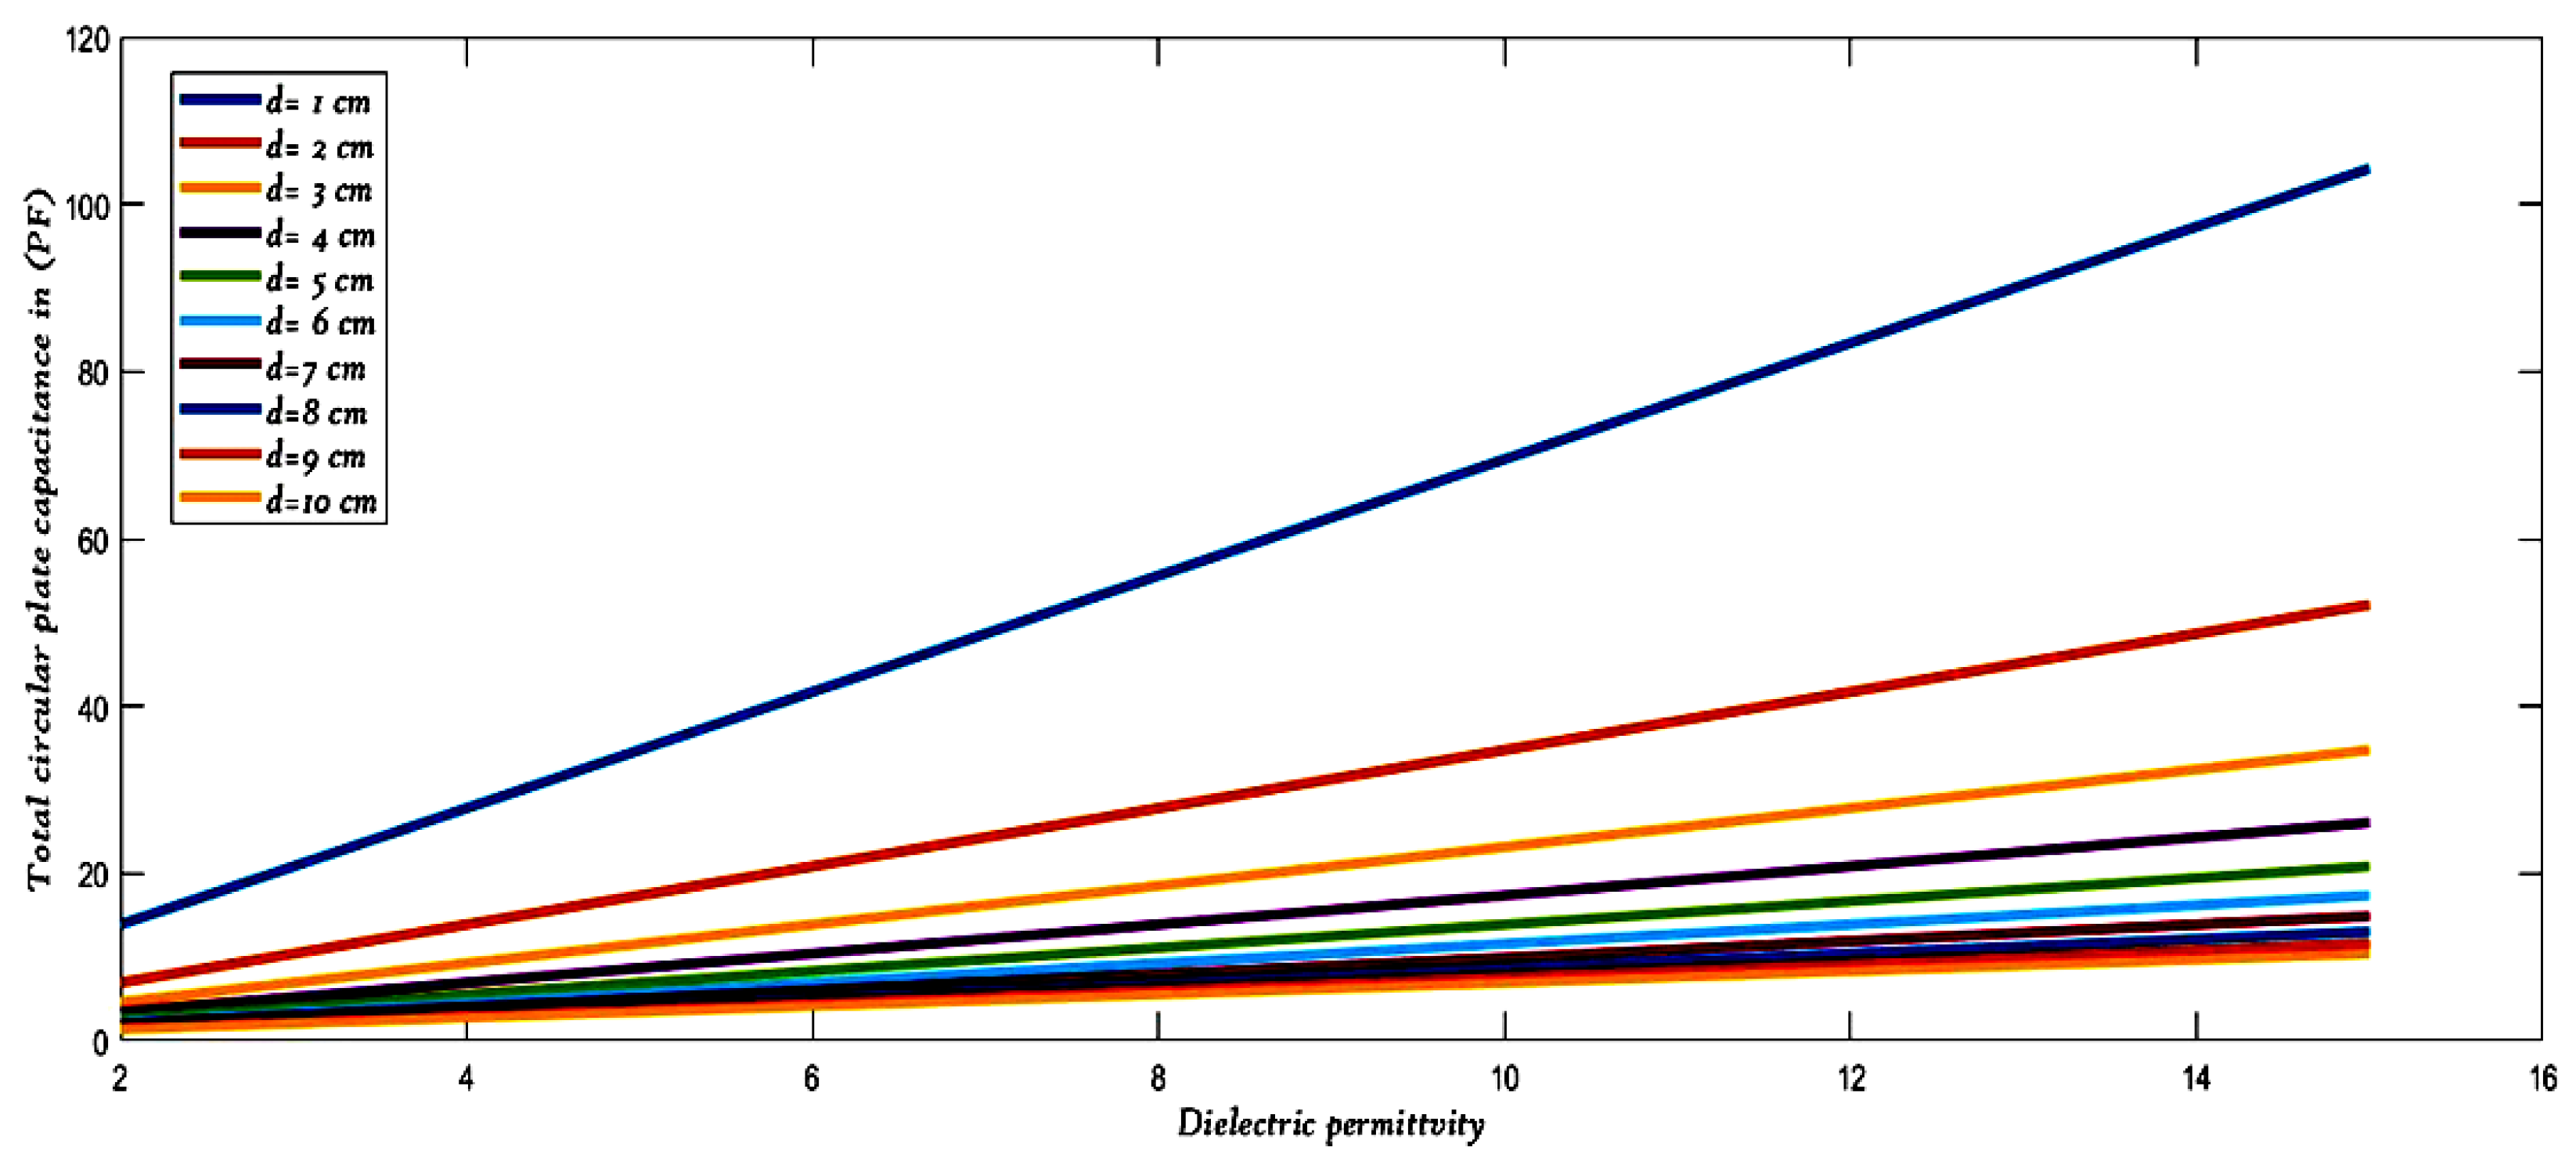
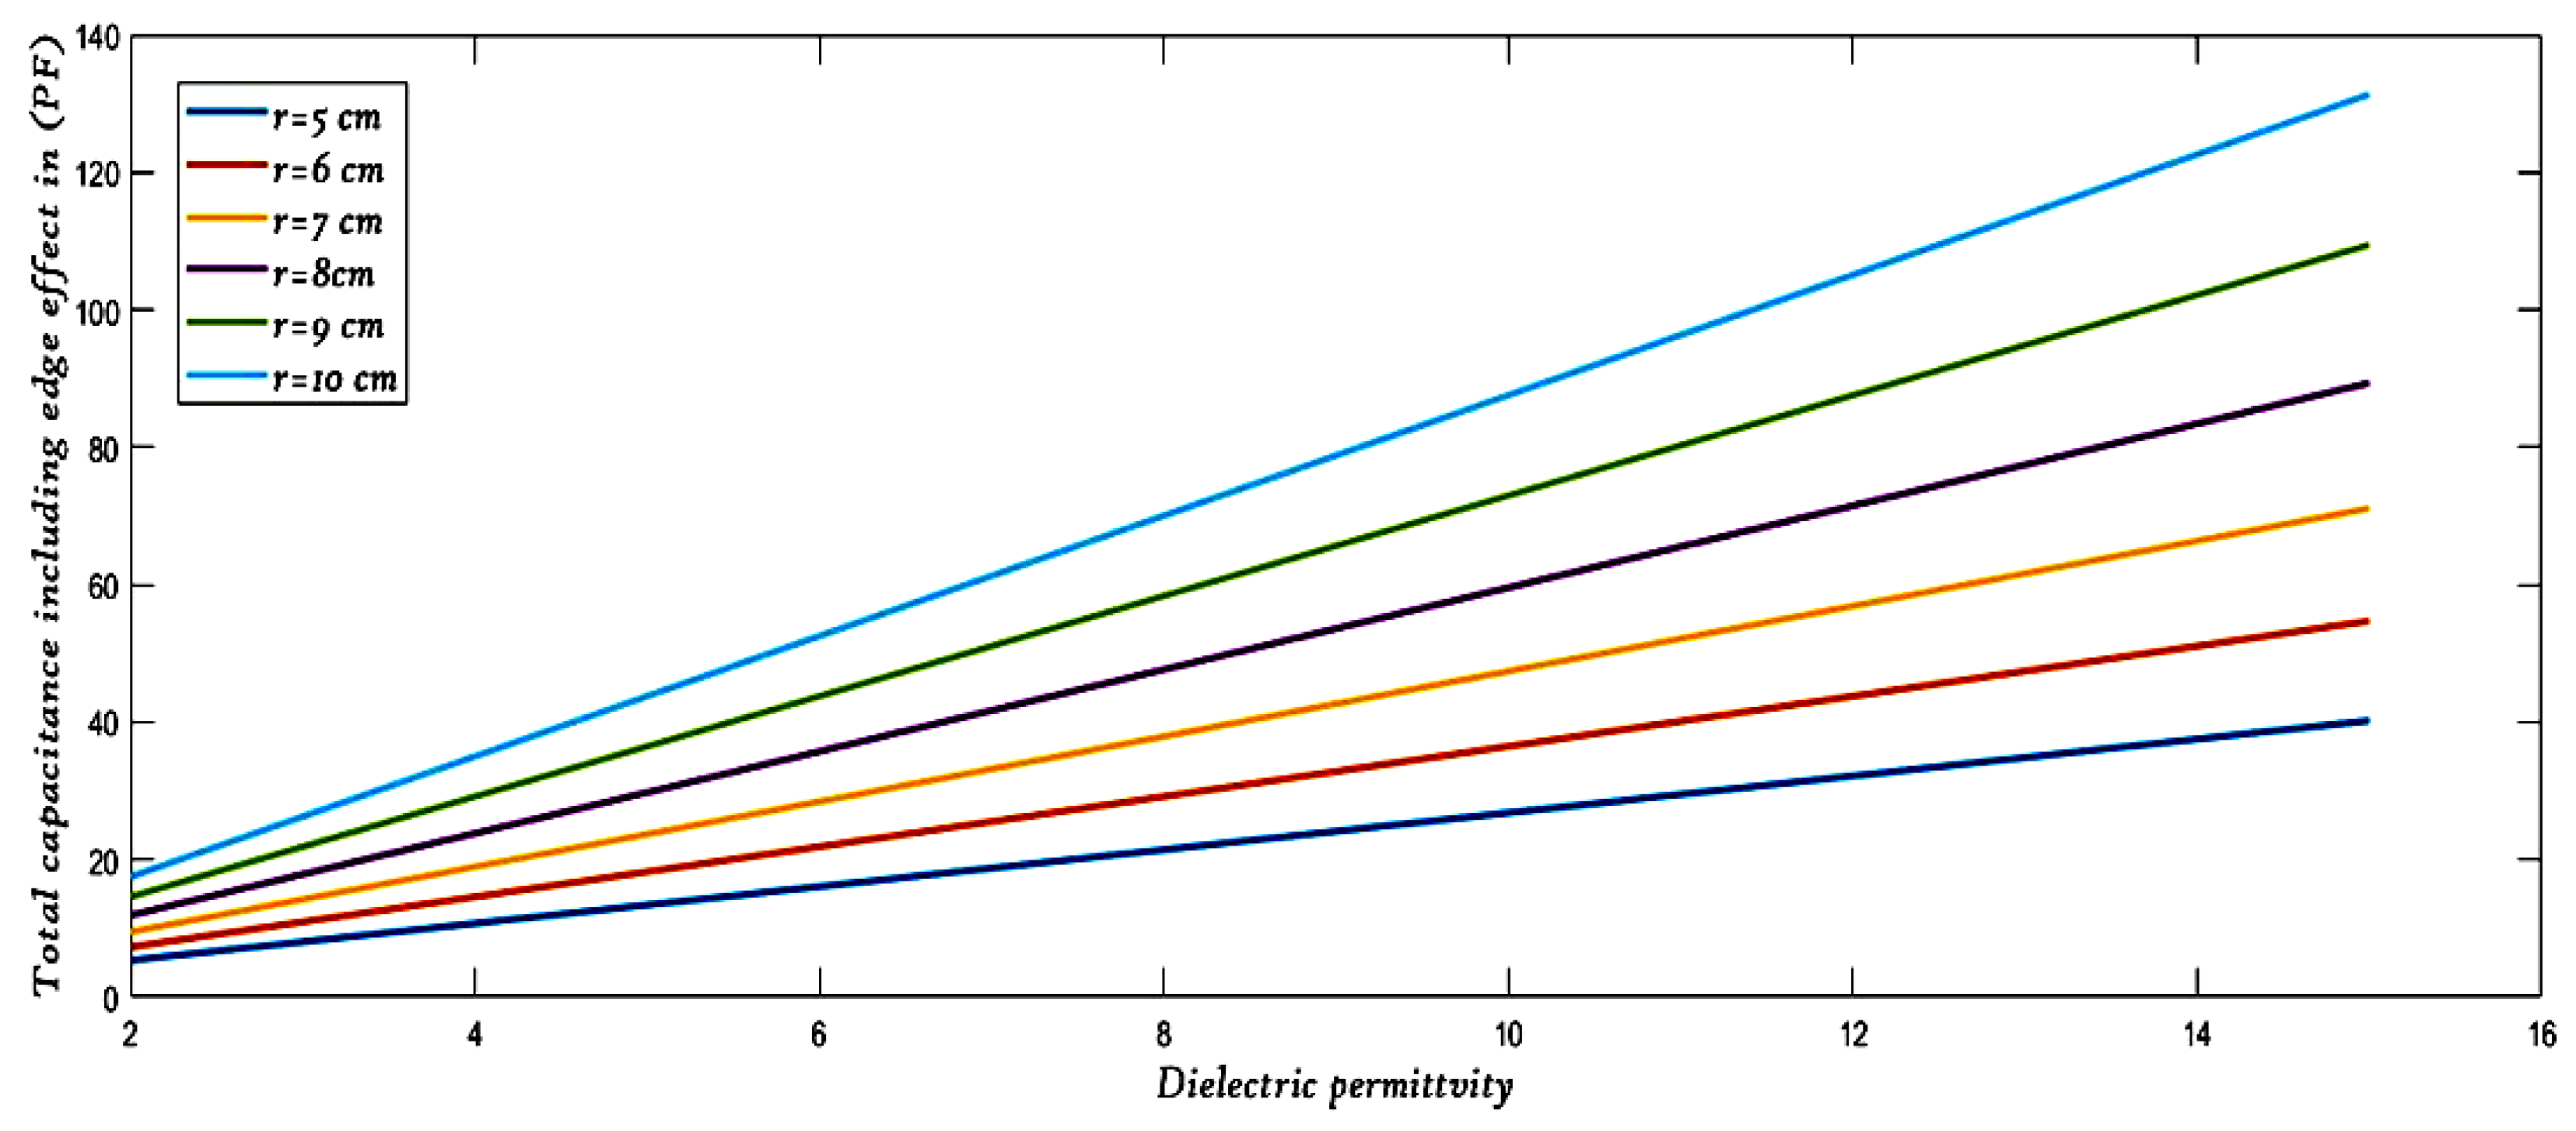
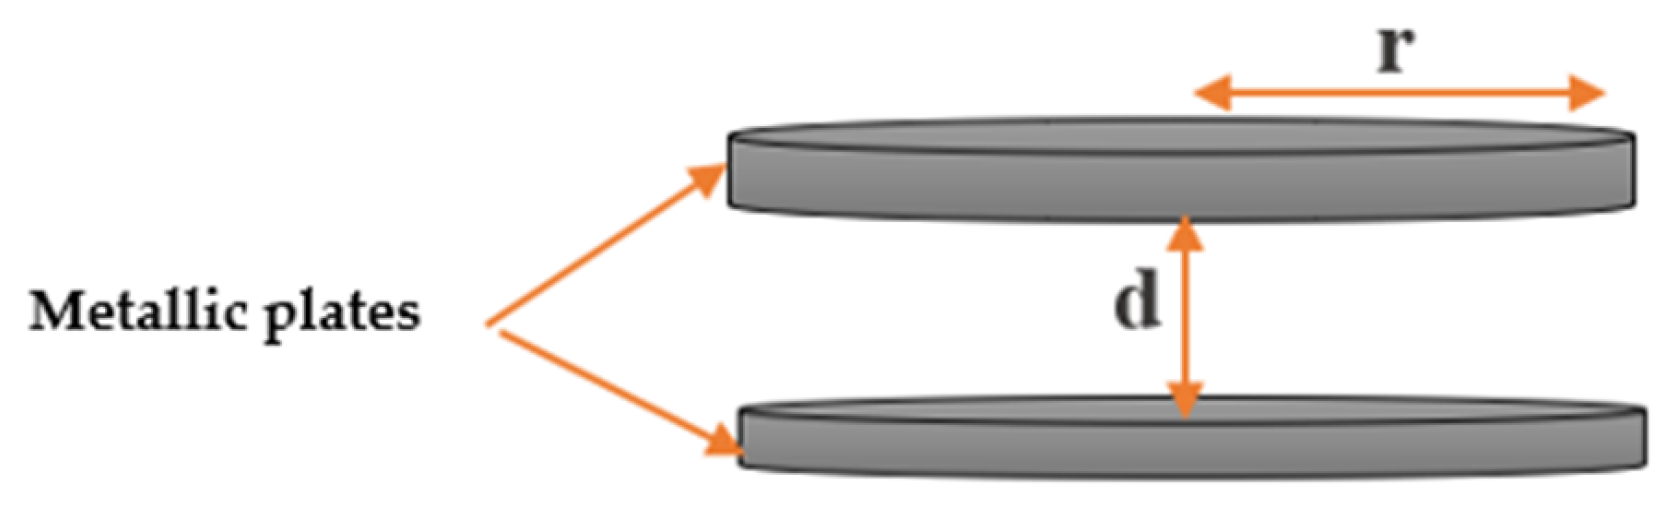
2.2.2. Capacitance Selection

Our research led us to select the circular parallel plate capacitor, a choice specifically tailored to meet the demands of the soil model, operational frequency response, environmental considerations, and low voltage requirements.
The circular parallel plate capacitor, illustrated in Figure 10, is characterized by two key parameters: the radius r and the separation distance d between the plates.
The radius r influences the capacitor’s effective area, directly impacting its ability to store electric charge. A larger radius allows for a greater surface area, which enhances capacitance, thereby improving the capacitor’s performance in measuring dielectric properties.
The separation distance d plays a crucial role in determining the electric field strength between the plates. As this distance increases, the capacitance decreases, due to the reduced electric field. Conversely, a smaller separation distance increases capacitance, allowing for more effective charge storage.
These characteristics make the circular parallel plate capacitor particularly suitable for applications in soil sensing, where precise measurements of dielectric permittivity are essential. By optimizing both r and d, we can enhance the capacitor’s performance in diverse soil conditions and ensure accurate readings in various environmental scenarios.
The total capacitance, including the edge effect, is represented by the following equation:
C = ε 0 ε r π r 2 d + ε 0 ε r r ln ( 16 π r ) d 1 .
In the above equation, the terms are defined as follows:
  • ε 0 : vacuum permittivity;
  • ε r : soil permittivity;
  • r: radius of the circular parallel plate capacitor;
  • d: separation between capacitor plates.

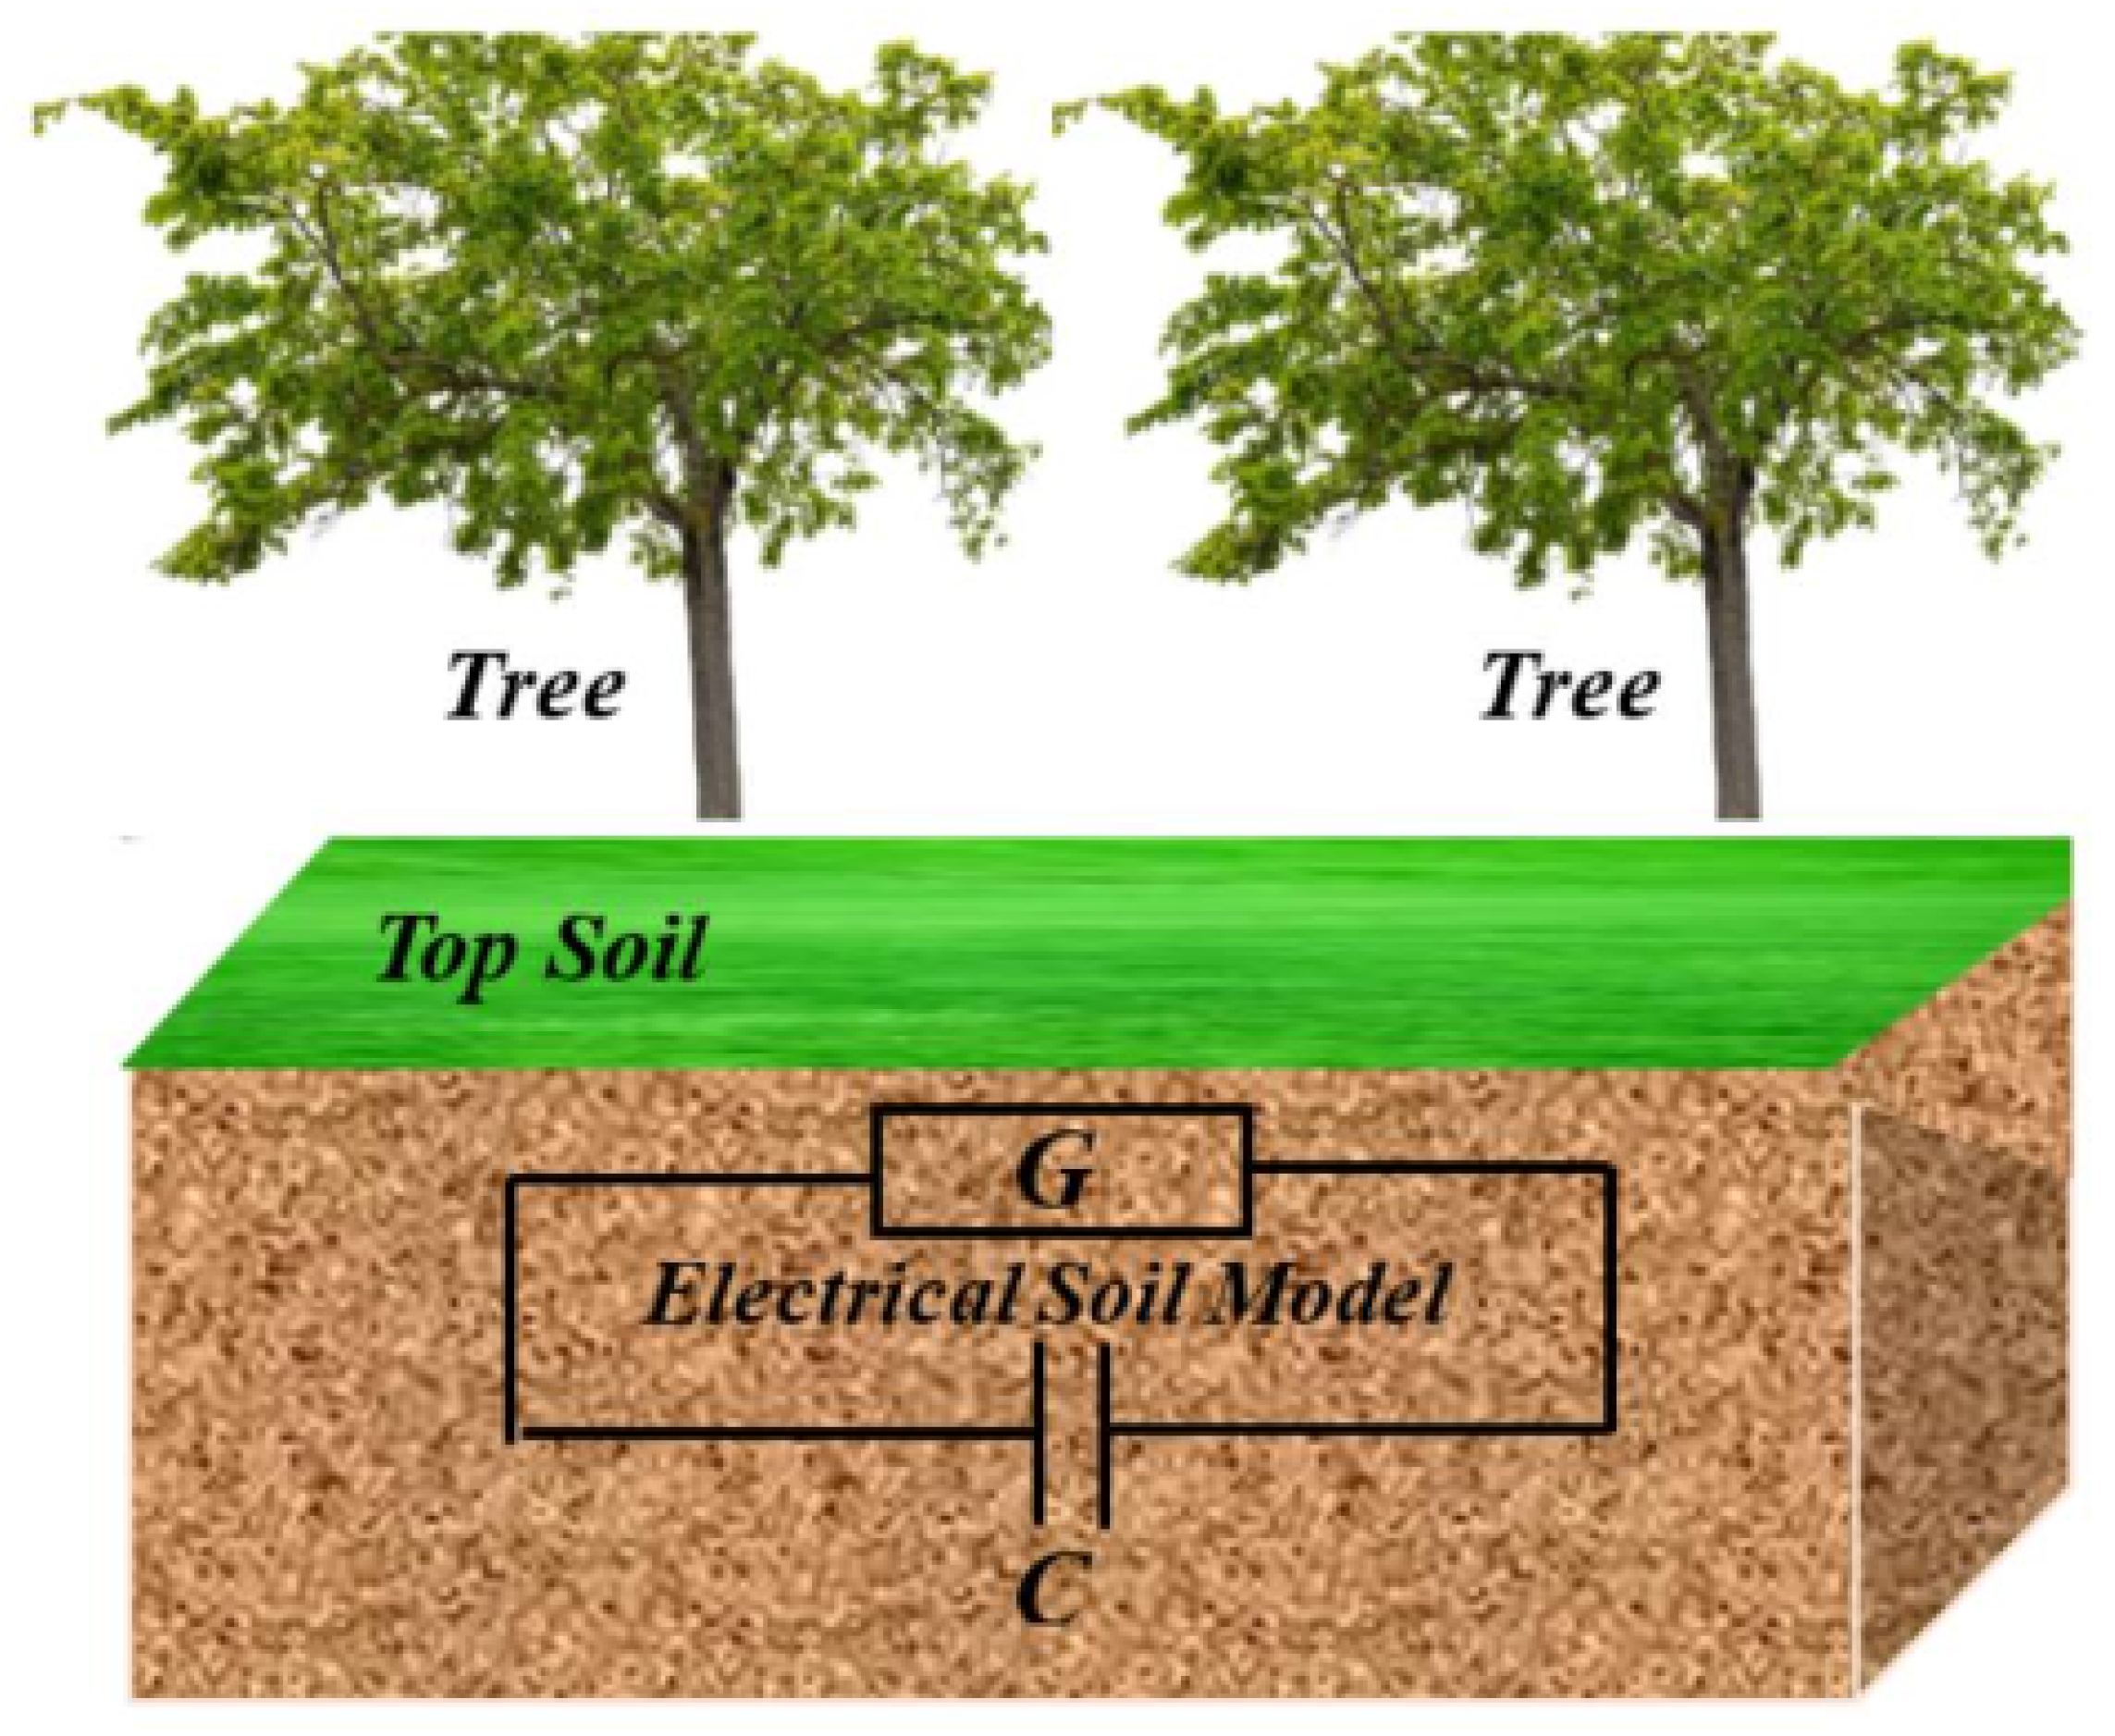
2.3. Electrical Soil Model

The electrical soil model is represented as a parallel combination of capacitance C and conductance G. This relationship is visually depicted in Figure 11 below.
The expression for the input admittance Y 0 ( ω ) in free space is given, where G 0 and C 0 represent the conductance and capacitance in free space, respectively [14]:
Y 0 ( ω ) = G 0 + j ω C 0
The capacitance C 0 is defined as
C 0 = ε 0 π r 2 d + ε 0 ε r r ln ( 16 π r ) d 1
The conductance G 0 is given by
G 0 = π r 2 d .
In the above equation, the terms are defined as follows:
  • σ : conductivity in Siemens;
  • a: area of electrical plates in cm2;
  • d: distance between capacitor plates in cm;
  • r: radius of the section in cm.
Then, we can express the total admittance Y for the medium:
Y ( ω , ε 0 , ε r ) = G 0 + j ω C 0 ε r
where ε r is the relative permittivity of the material in which the probe is immersed.
Exploring the relationship between admittance and the reflection coefficient, we conducted simulations at 433 MHz to demonstrate attenuation caused by the reflection and absorption of electromagnetic waves, as illustrated in Figure 12 and Figure 13. Accurate soil modeling was essential for analyzing the underground transmission channel, given its considerable influence on the system’s reflection coefficient and admittance.

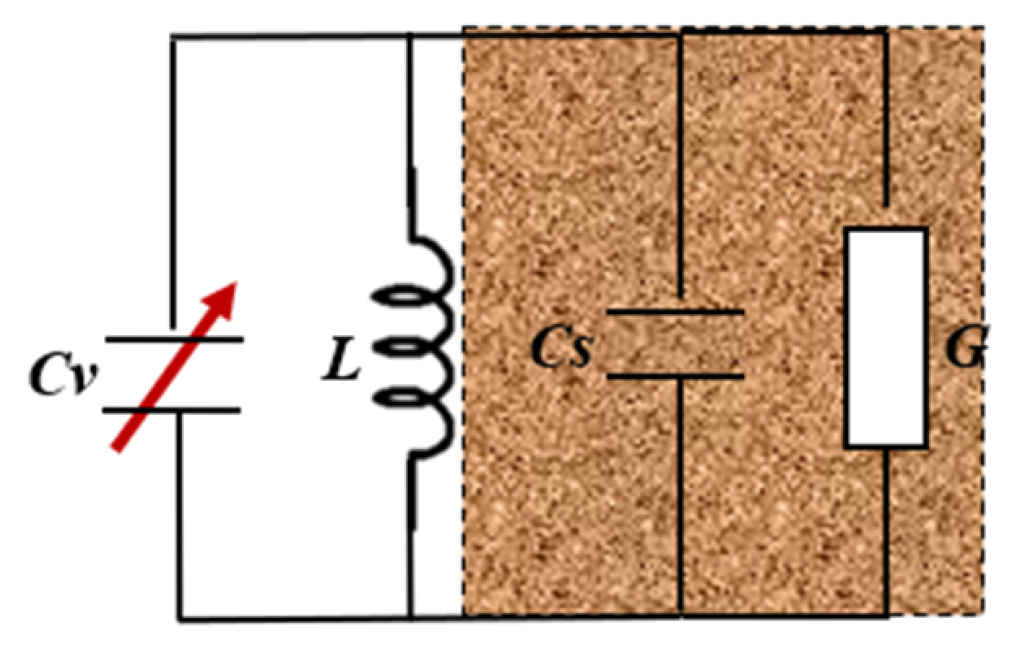
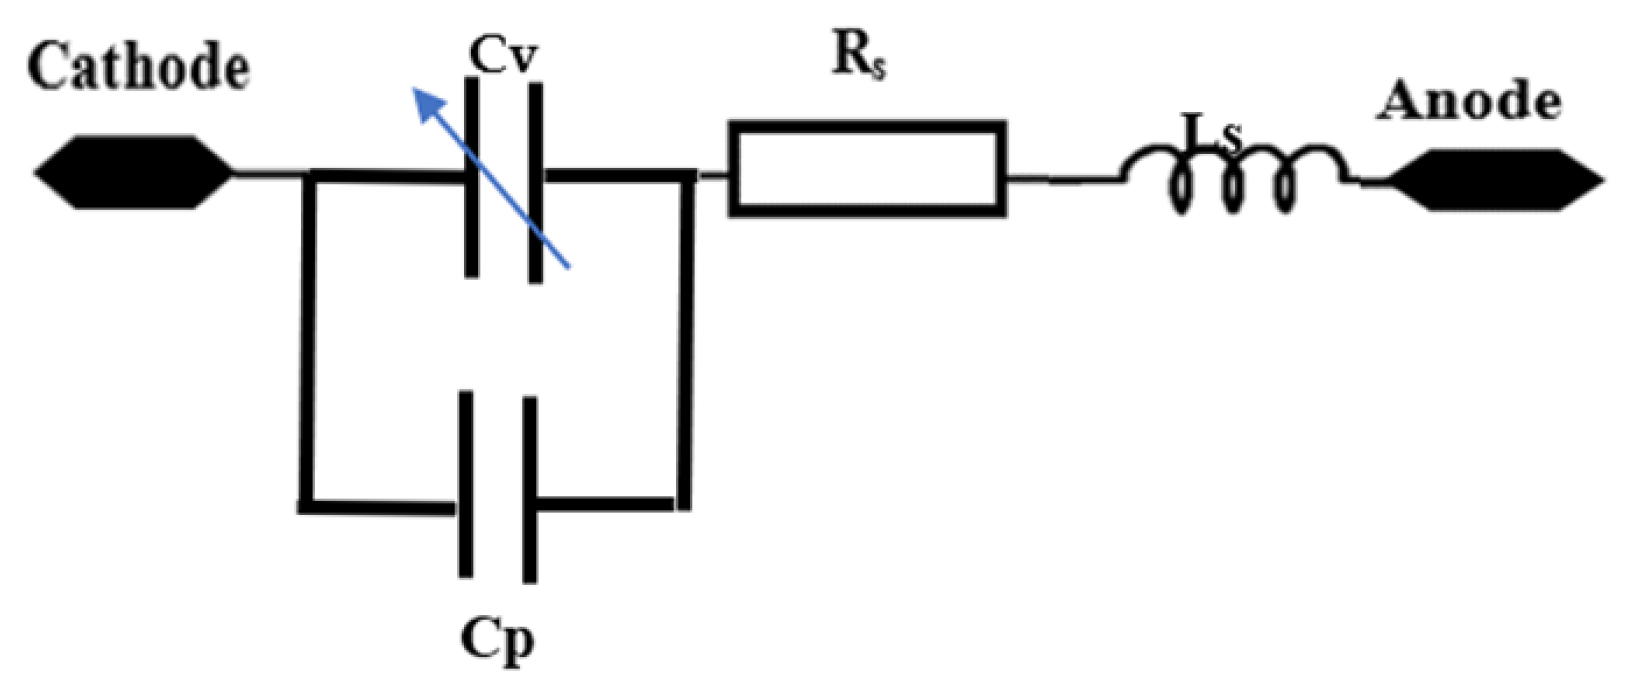
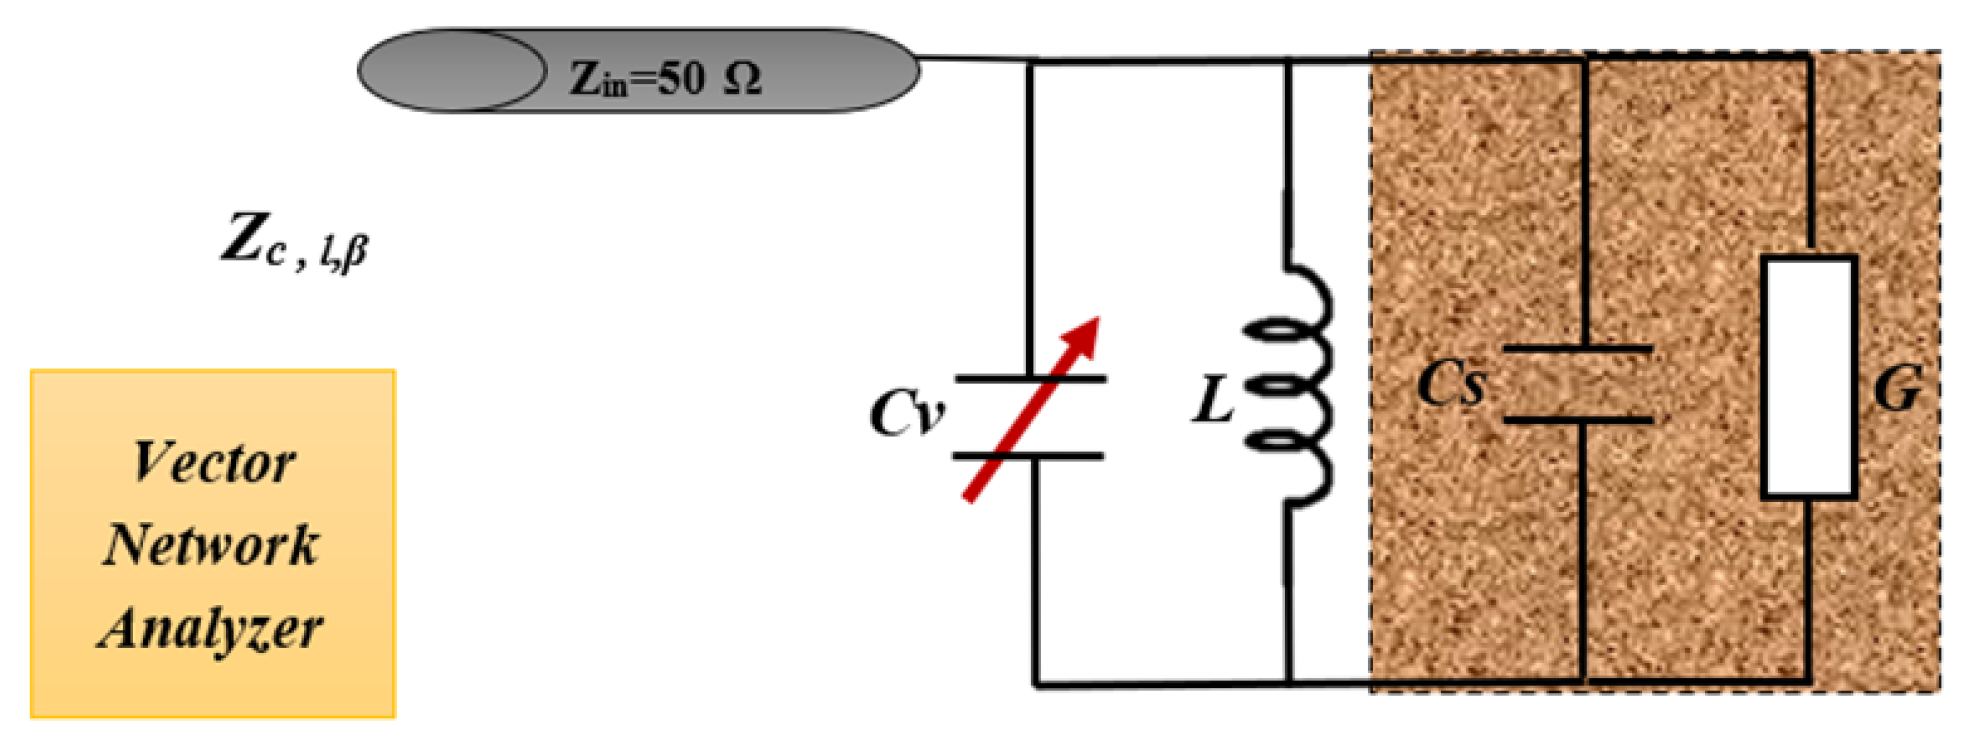
2.4. Underground Probe Design

The goal of this research was to create a precise probe model to forecast the dielectric characteristics of soil, as shown in Figure 14. The model uses Frequency Domain Reflectometry (FDR) techniques to determine how these properties affect signal attenuation. We offer a solid technical solution that takes into account the limitations and specifications of electrical soil models, in order to create a probe suitable for overcoming the problem of low signal amplitudes. This solution seeks to significantly amplify signal amplitudes, ensuring that electromagnetic signals propagate effectively through the soil, which enables precise extraction of complex dielectric permittivity.
The proposed probe design primarily consists of a pair of circular parallel plates configured as a capacitor, along with a coil, a varactor, and an oscillator, with the soil serving as the dielectric medium. The varactor is employed to tune the resonant frequency of the overall circuit to 433 MHz. As demonstrated later, this configuration aids in extracting soil parameters from the measured data [19,20].
The dielectric permittivity of soil can be measured using a variety of techniques, such as the coaxial probe, the transmission line, and the parallel plate capacitance; however, as Table 3 illustrates, each technique has limitations of its own. The ideal approach depends on a number of factors, including price, size, accuracy, and ease. Temperature, material type, and frequency range are some factors to take into account. We employed the parallel plate capacitance method, to save on production costs, because it is easy to build a parallel plate capacitor, which is just two parallel metal plates, and because the uniform electric field between the plates facilitates computation and analysis. The primary benefits of employing parallel plate capacitance are its suitability for high-loss materials and its comparatively simpler measurements; additionally, it functions well at low frequencies compared to transmission lines, while the coaxial probe method is better suited for high frequencies and the measurement of dielectric permittivity for both solids and liquids. For high-loss materials, the coaxial probe delivers great accuracy. The coaxial probe method’s primary disadvantages, however, are the need for repeated calibrations each time a permittivity measurement is desired and the potential for mistakes due to air gaps forming between the probe and the liquid being tested [21,22].
The Table 4 provides a detailed comparison between the TDR (Time Domain Reflectometry) and FDR (Frequency Domain Reflectometry) methods. It highlights their operating principles, analysis domains, main applications, advantages, disadvantages, and the contexts in which each method is best suited. The aim is to offer a clearer understanding of the key differences between these two techniques used for analyzing and detecting faults in electrical systems and transmission lines.

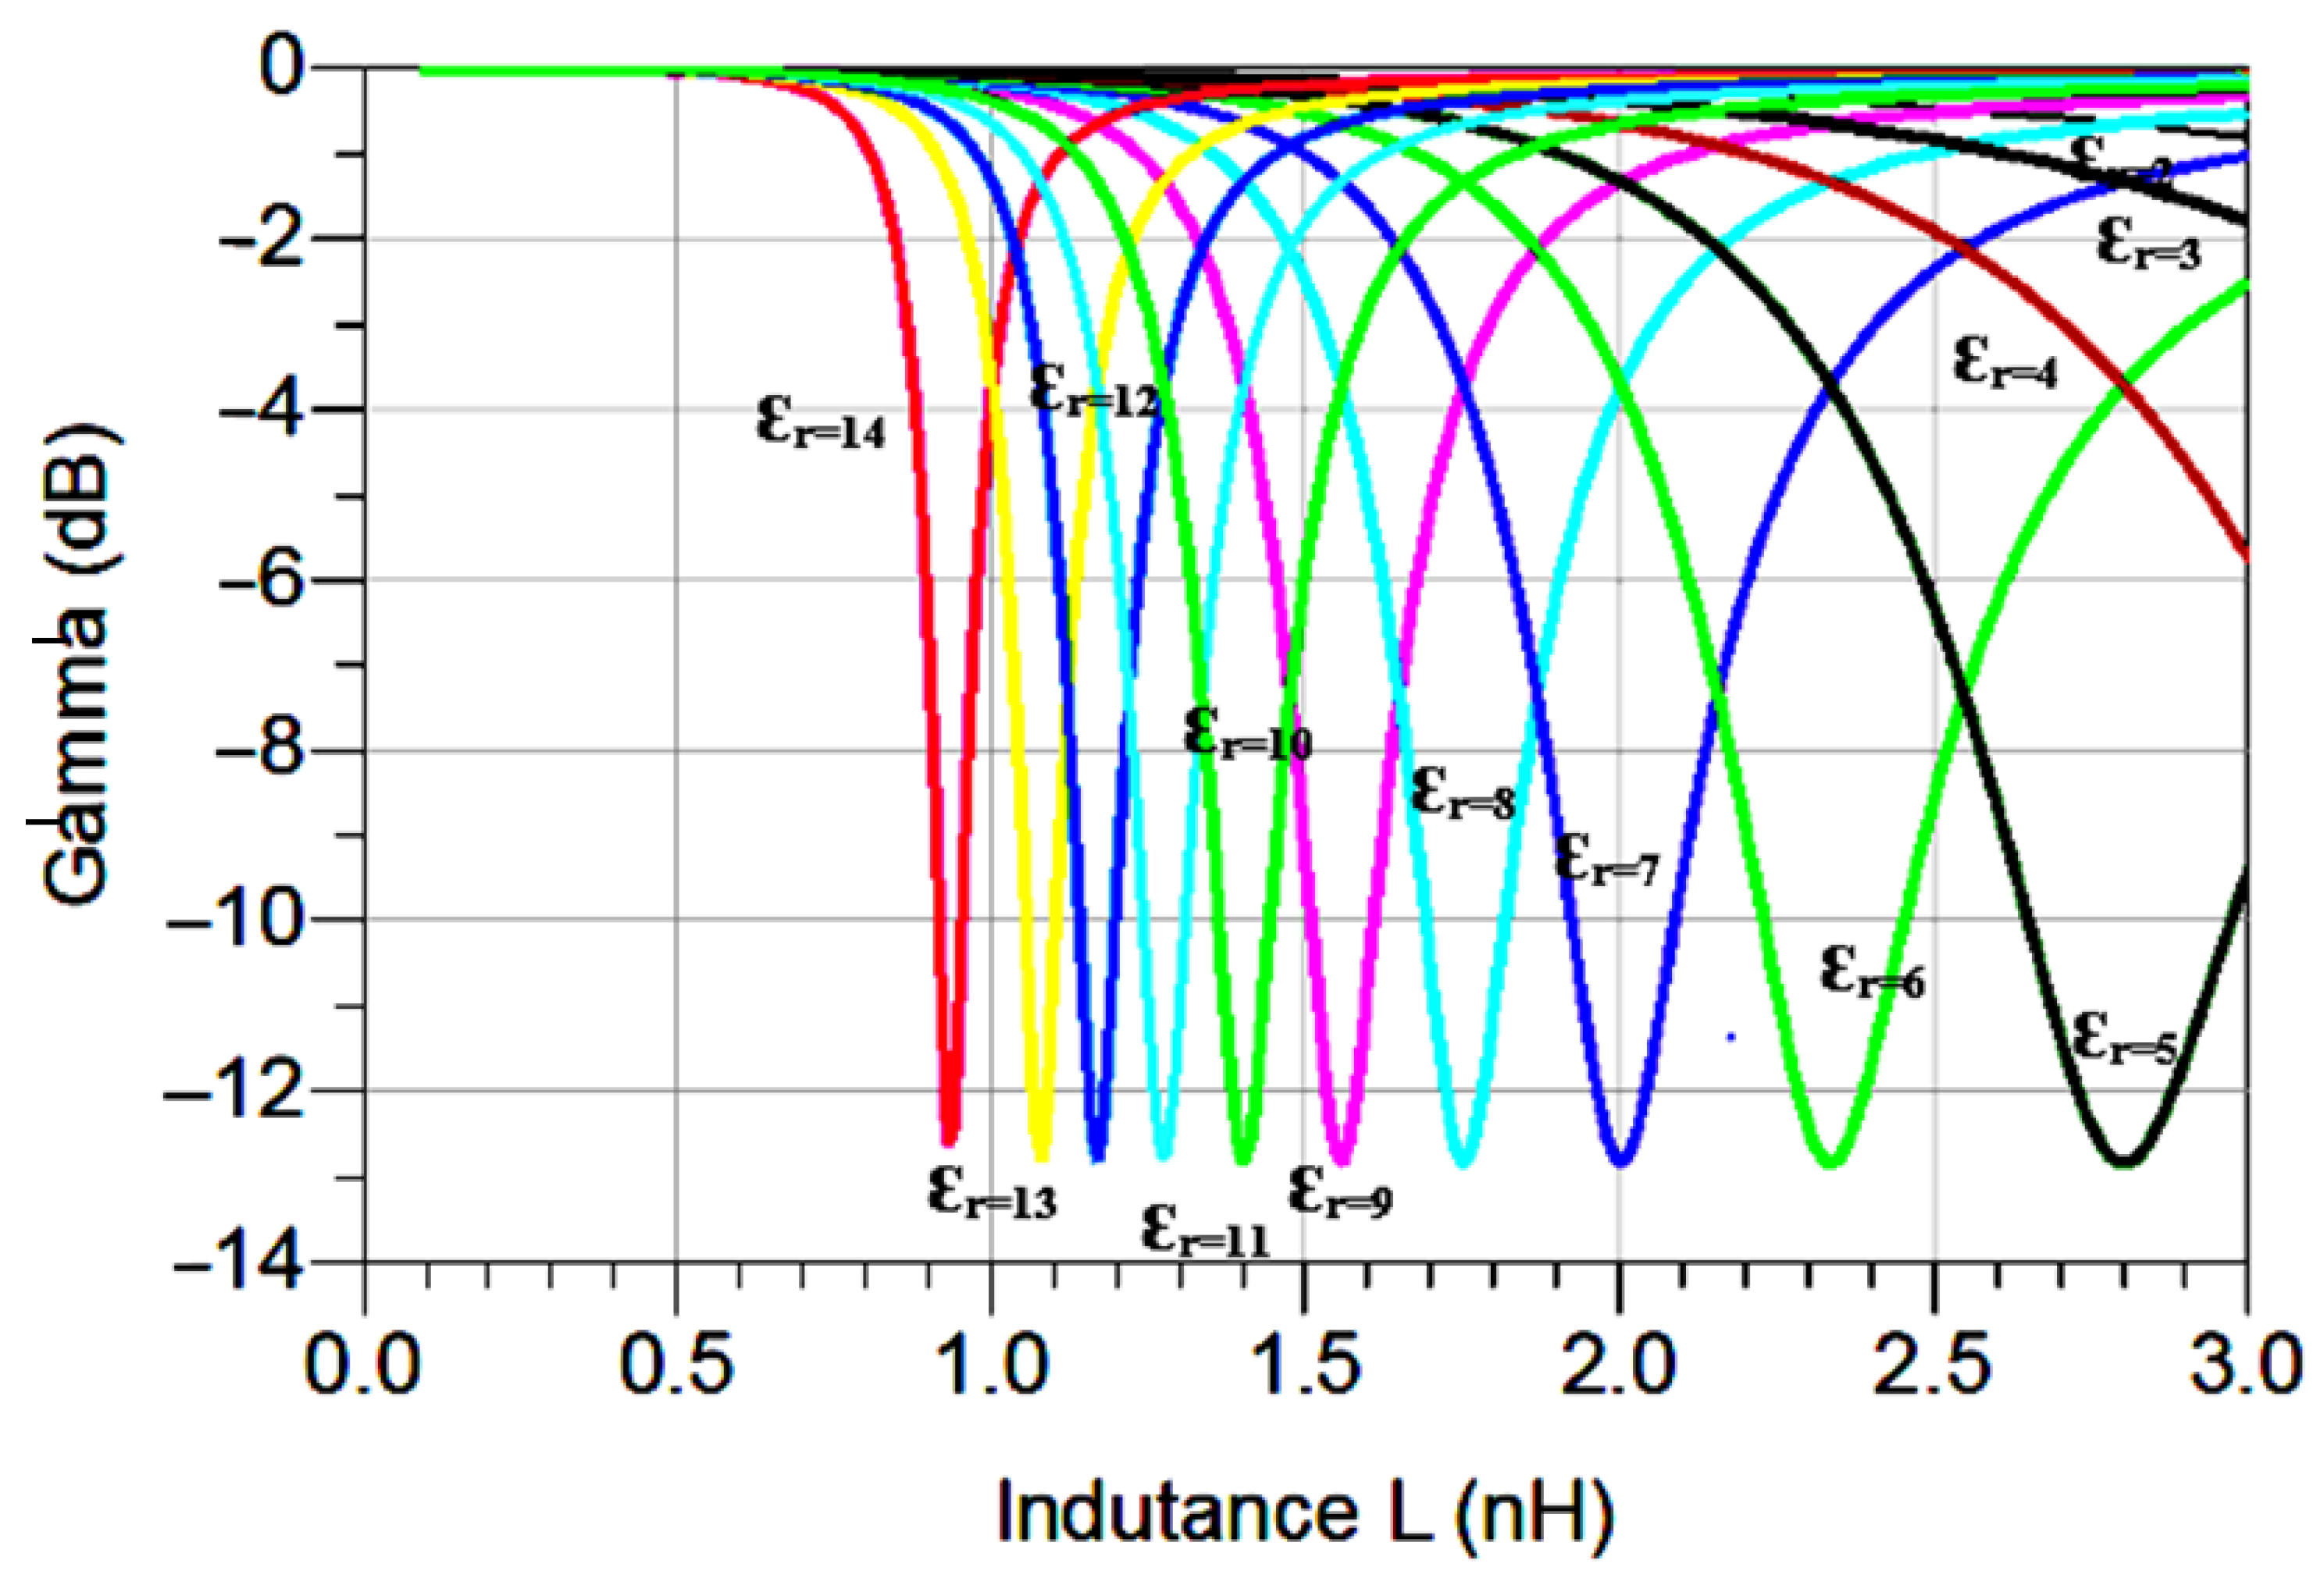
2.4.1. Coil Inductance Selection

The selection of proper coil inductance is crucial for optimizing gamma variation in a parallel resonant probe across various soil permittivities. A key parameter is achieving self-resonance at 433 MHz, which requires a balance between capacitance and soil permittivity. Our simulation and testing indicated that dielectric constants ranging from 2 to 15 require this resonance to achieve the maximum reflection coefficient. The figure illustrates the ideal inductance needed to obtain this reflection coefficient.
The relationship between the self-resonance frequency and the inductance and capacitance values is given by the following equations:
ω r = 2 π f r
f r = 1 2 π L r C .
In the above equations, the terms are defined as follows:
  • ω r : angular frequency;
  • f r : resonance frequency;
  • L r : coil inductance;
  • C: total capacitance of the probe capacitor filled with soil.
From Equation (7), it is evident that increasing either inductance or capacitance will reduce the measured self-resonant frequency. Figure 15 illustrates how the reflection coefficient varied with different dielectric permittivities for a range of series inductances from 0.1 nH to 3 nH, centered around the resonance frequency of 433 MHz. To determine the appropriate inductance, the reflection coefficients were tested by varying the reverse DC bias ( V r ) of the varactor diode SMV1801 (Skyworks Solutions, Inc., Irvine, CA, USA) across different dielectric permittivities. The results indicate that an inductance of 1 nH demonstrated resonance across various dielectric permittivities, achieving a gamma of −25 dB for ε r = 13 .

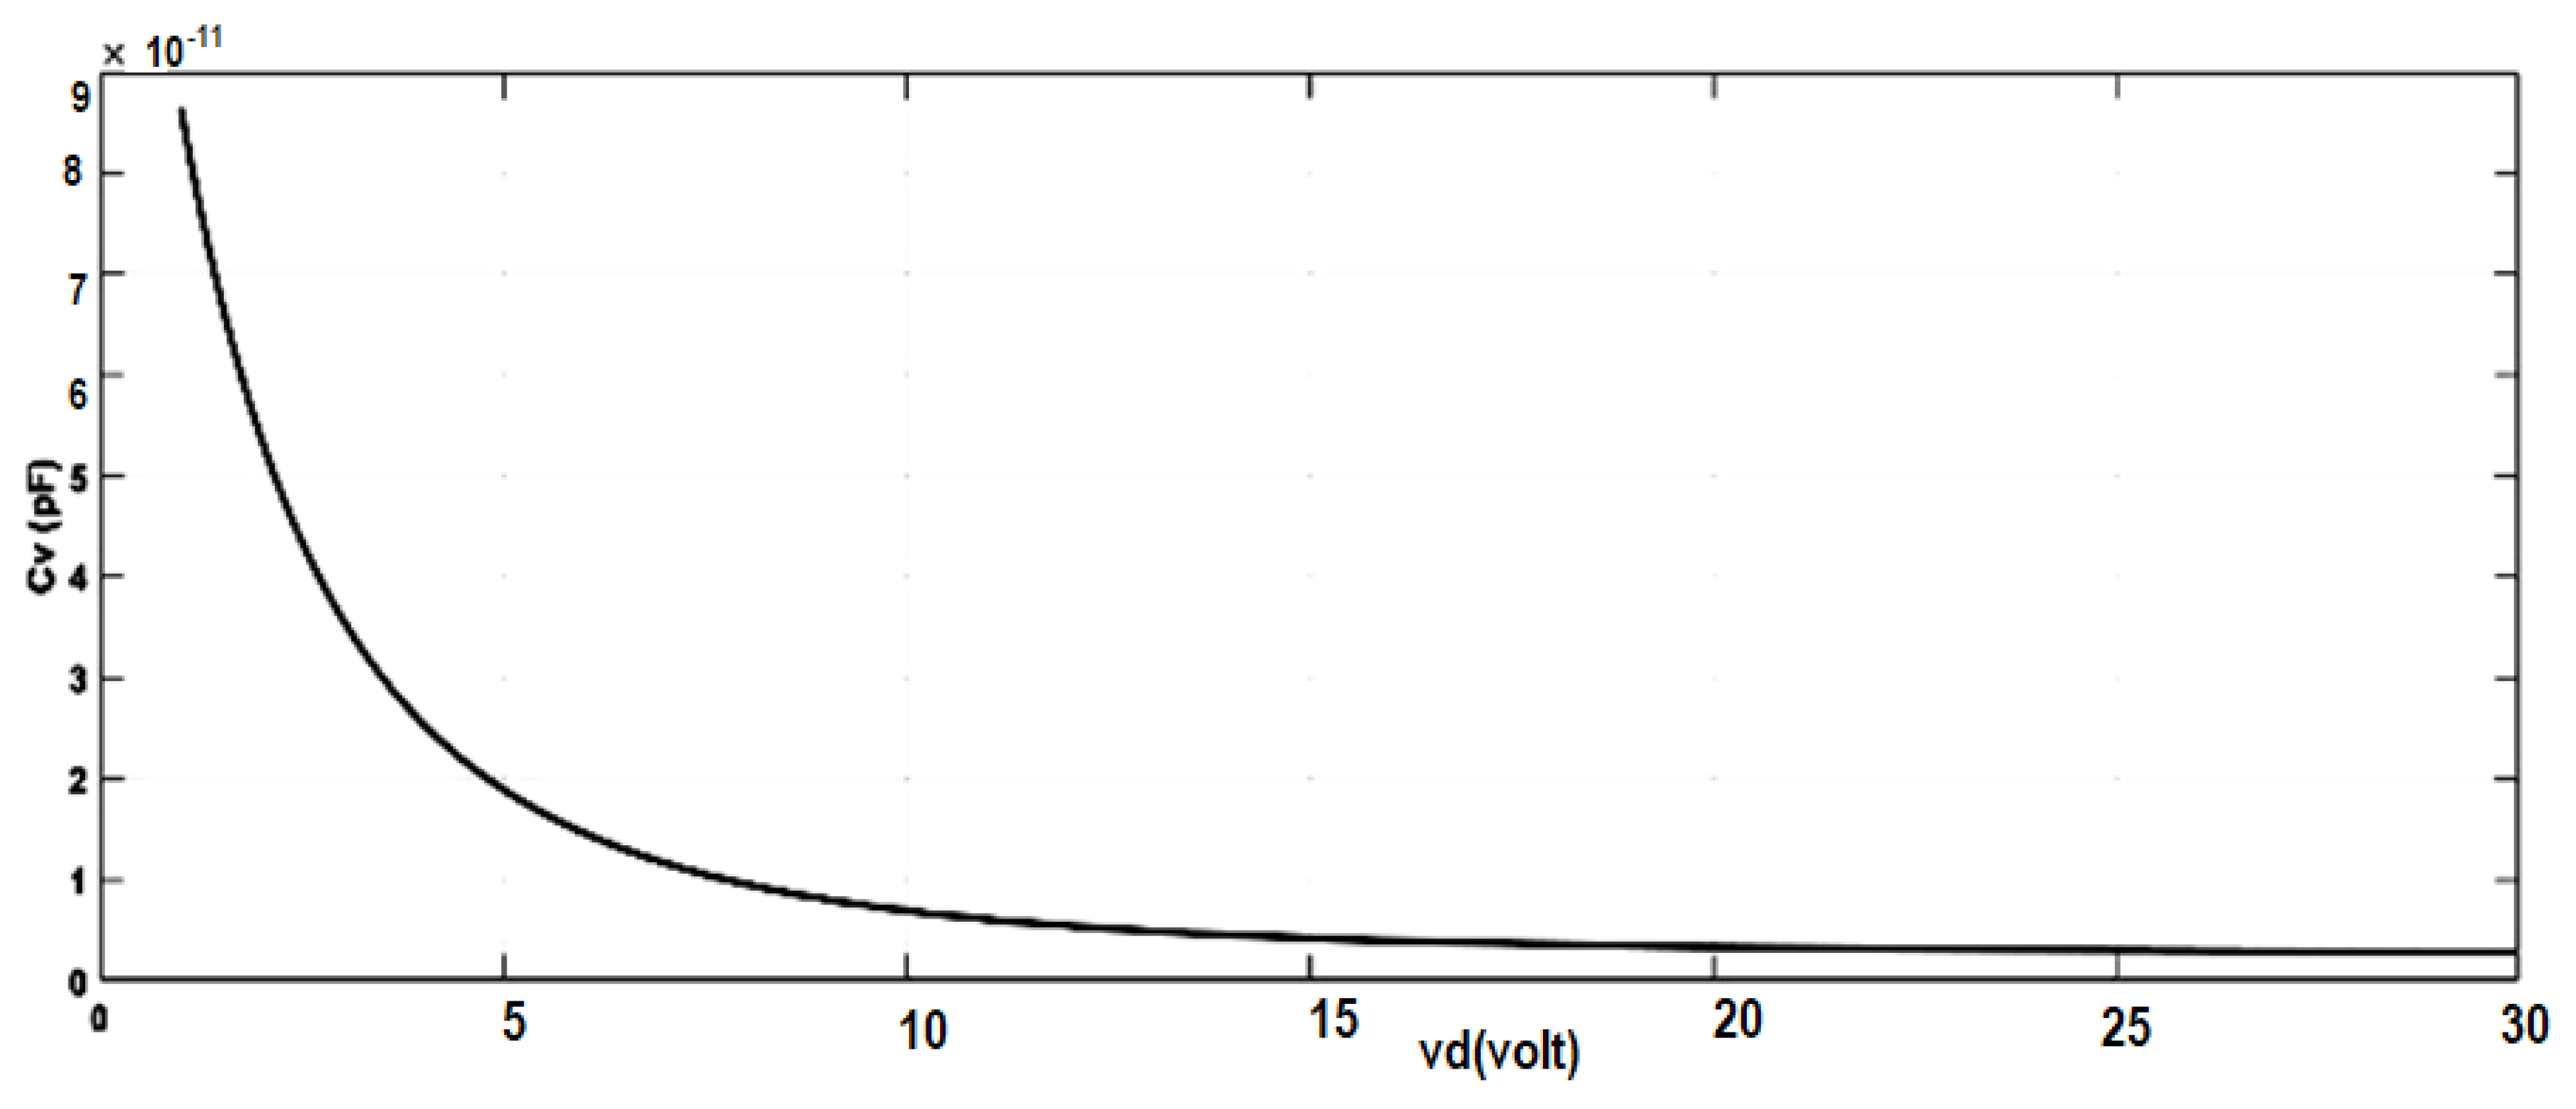
2.4.2. Varactor Selection

Varactor diodes are utilized to create voltage-controlled variable capacitance in Radio Frequency circuits, providing cost-effectiveness and reliability advantages. The equivalent model of the SMV1801 varactor diode is illustrated in Figure 16, where C represents the capacitance of the varactor diode junction. Additionally, R and L s denote the parasitic series resistance and inductance of the diode, respectively, while C p represents the parasitic parallel capacitance [14,23,24,25].
The total capacitance of the varactor diode, C v ( V d ) , is expressed as follows:
C v ( V d ) = C j 1 + V r V j M
where V d is the applied reverse DC voltage, V r is the zero-bias junction capacitance, V j is the junction potential, and M is the grading coefficient. The parameters of the SMV1801 varactor diode model are presented in Table 5 below.
Figure 17 depicts the equivalent circuit model of the varactor diode.
Figure 18 illustrates the behavior of the SMV1801 varactor diode under reverse DC bias. The varactor capacitance, C v , varied from 0.4 pF to 85 pF, as the reverse voltage, V d , ranged from 0 to 30 V.

2.4.3. Dielectric Permittivity Estimation

The following flowchart describes how to extract the dielectric permittivity (Figure 19):
Based on Figure 14, the complex admittance expressions for the three branches can be deduced as follows:
Y 1 = 1 R
Y 2 = j C tot ω
Y 3 = 1 j ω L
The total complex admittance of the probe is given by their summation:
Y = Y 1 + Y 2 + Y 3
Y = G + j ω C tot + 1 j ω L
Y = G + j ω C tot 1 ω L
where C tot = C s + C v .
The conductance G and susceptance H, therefore, have the following expressions:
G = 1 R
H = j ω C tot 1 ω L
To determine ε r at resonant frequency,
ω = ω r
Y ( ω r ) = G + ω r ( C s + C v ) 1 ω r L 2
From this, we can deduce
ω r ( C s + C v ) 1 ω r L 2 = 0
Y ( ω r ) = G
From the conductance, we can deduce
σ = ω ε 0 ε r
We can characterize the electrical properties of the soil using the complex relative permittivity, denoted as ε r , which can be expressed as
ε r = ε r j ε r .
In the above equation, the terms are defined as follows:
  • ε r : energy storage of the dielectric permittivity;
  • ε r : dielectric losses.
ε r = 1 ω C 0 Y 2 G 2 + 1 ω L C v C 0
Γ = Y 0 Y Y 0 + Y Y = 1 Z 0 1 Γ 1 + Γ
Following the methodology outlined below, we developed an algorithm in MATLAB to calculate the estimated conductance from resonance and the dielectric permittivity based on the measured gamma as a function of the applied voltage on the diode. By evaluating symmetric points around the resonance, as depicted in the graph below, we confirmed that the estimation of the dielectric permittivity was accurate and closely aligned with the actual value.
From Figure 20, at the resonance frequency of 433 MHz and for a dielectric constant of 10, the reflection coefficient reached −15 dB at a diode voltage of approximately 4 volts. The tables below present the results of the dielectric permittivity obtained using the two methodologies described.
The previous figure shows (Figure 21) the results of the estimation of the dielectric permittivity; with the two methodologies, we, despite this table, have a reasonable estimation of the dielectric permittivity between 6 and 15. Hence, we explain the bad estimation of the dielectric permittivity from 2 to 5 as being due to the low value of the reflection coefficient, which did not allow information to be extracted properly.

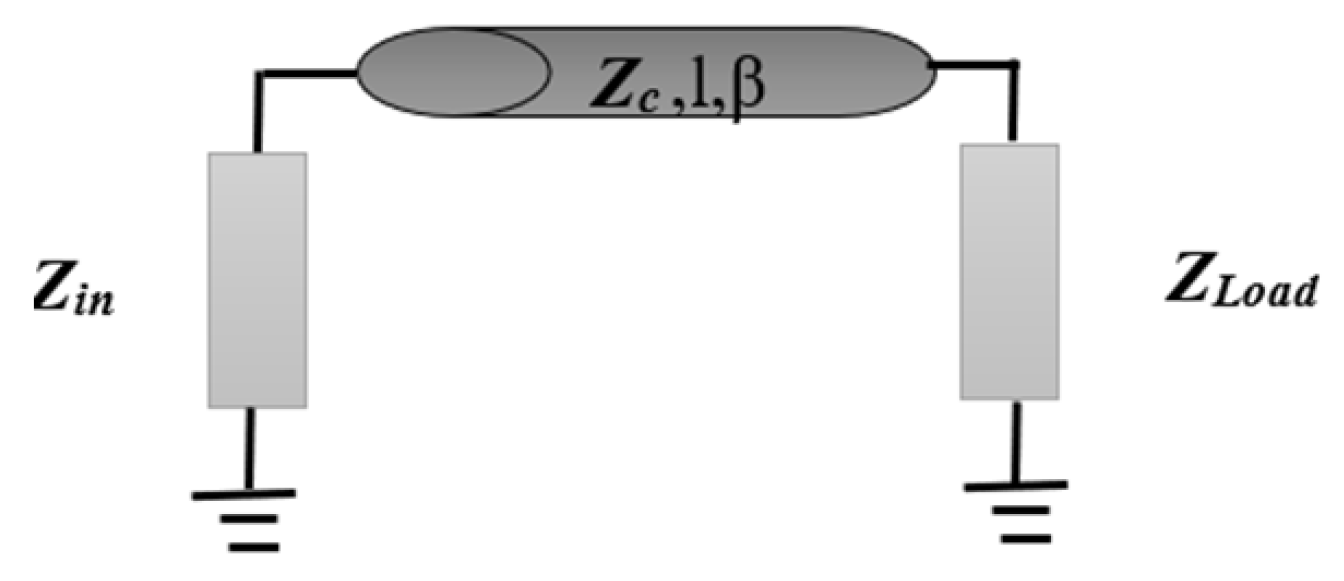
2.4.4. Transmission Line

When coupling an RF signal source to a buried probe for measuring the reflection coefficient, the selection of the transmission line is crucial. Its primary function is to transport signals from the source to the buried probe. The environmental conditions of the soil significantly influence the choice of transmission line, taking into account factors such as the allowable range in the medium, rating, wave attenuation sensitivity, and cost.
Various types of transmission lines can be considered, including parallel lines such as coaxial cables, planar lines, and twisted lines. However, due to its low attenuation for UHF frequencies, coaxial cable is often the preferred choice. The established connection utilizes a coaxial cable, where the signal propagates as a voltage difference between the signal and the ground (shield) conductors, allowing for the observation of power reflection during underground communication.
The impedance, denoted by Z i n , is expressed as follows:
Z i n = Z L o a d + Z C j tan ( β l ) Z c + Z L o a d j tan ( β l ) Z c
where β is defined as
β = 2 π λ
The electrical length l of the transmission line is given by
l = λ 4
And the wavelength λ can be expressed as
λ = c ϵ r .
In the above equations, the terms are defined as follows:
  • Z L o a d : load impedance;
  • l: electrical length of the transmission line;
  • β : propagation constant of the transmission line;
  • Z c : characteristic impedance of the transmission line.
Figure 22 illustrates the equivalent circuit of the transmission line, while Figure 23 presents the probe configuration with the transmission line:
The results presented in Figure 24 indicate that, for an inductance of 1 nH , resonance could be observed for various dielectric permittivities, achieving a reflection coefficient of 26 dB at ϵ r = 12 .
Figure 25 and Figure 26 illustrate the results of the estimated dielectric permittivities for a transmission line with an electrical length of E = π 2 :
Figure 27 illustrates the quantified error between the theoretical dielectric permittivity and the estimated values for the proposed probe. The error ranged from 270% to 4% for dielectric permittivity values between 2 and 15, using transmission lines of lengths equal to π 2 and π . Notably, the error for low dielectric permittivity values was minimized to 93% with a transmission line of electrical length equal to π 2 . This limitation arose from the varicap diode; thus, a new varicap model could provide greater variation in capacitance. The model without a transmission line could successfully determine high values of dielectric permittivity, reaching up to 6, which can be attributed to the high reflection coefficient at the resonance frequency. Conversely, the poor estimation of dielectric permittivity for low values was linked to the limited reflection coefficient at the resonance frequency, influenced by inductance values that fail to achieve optimal resonance. The model using a transmission line of length π 2 yielded better estimates of permittivity values.

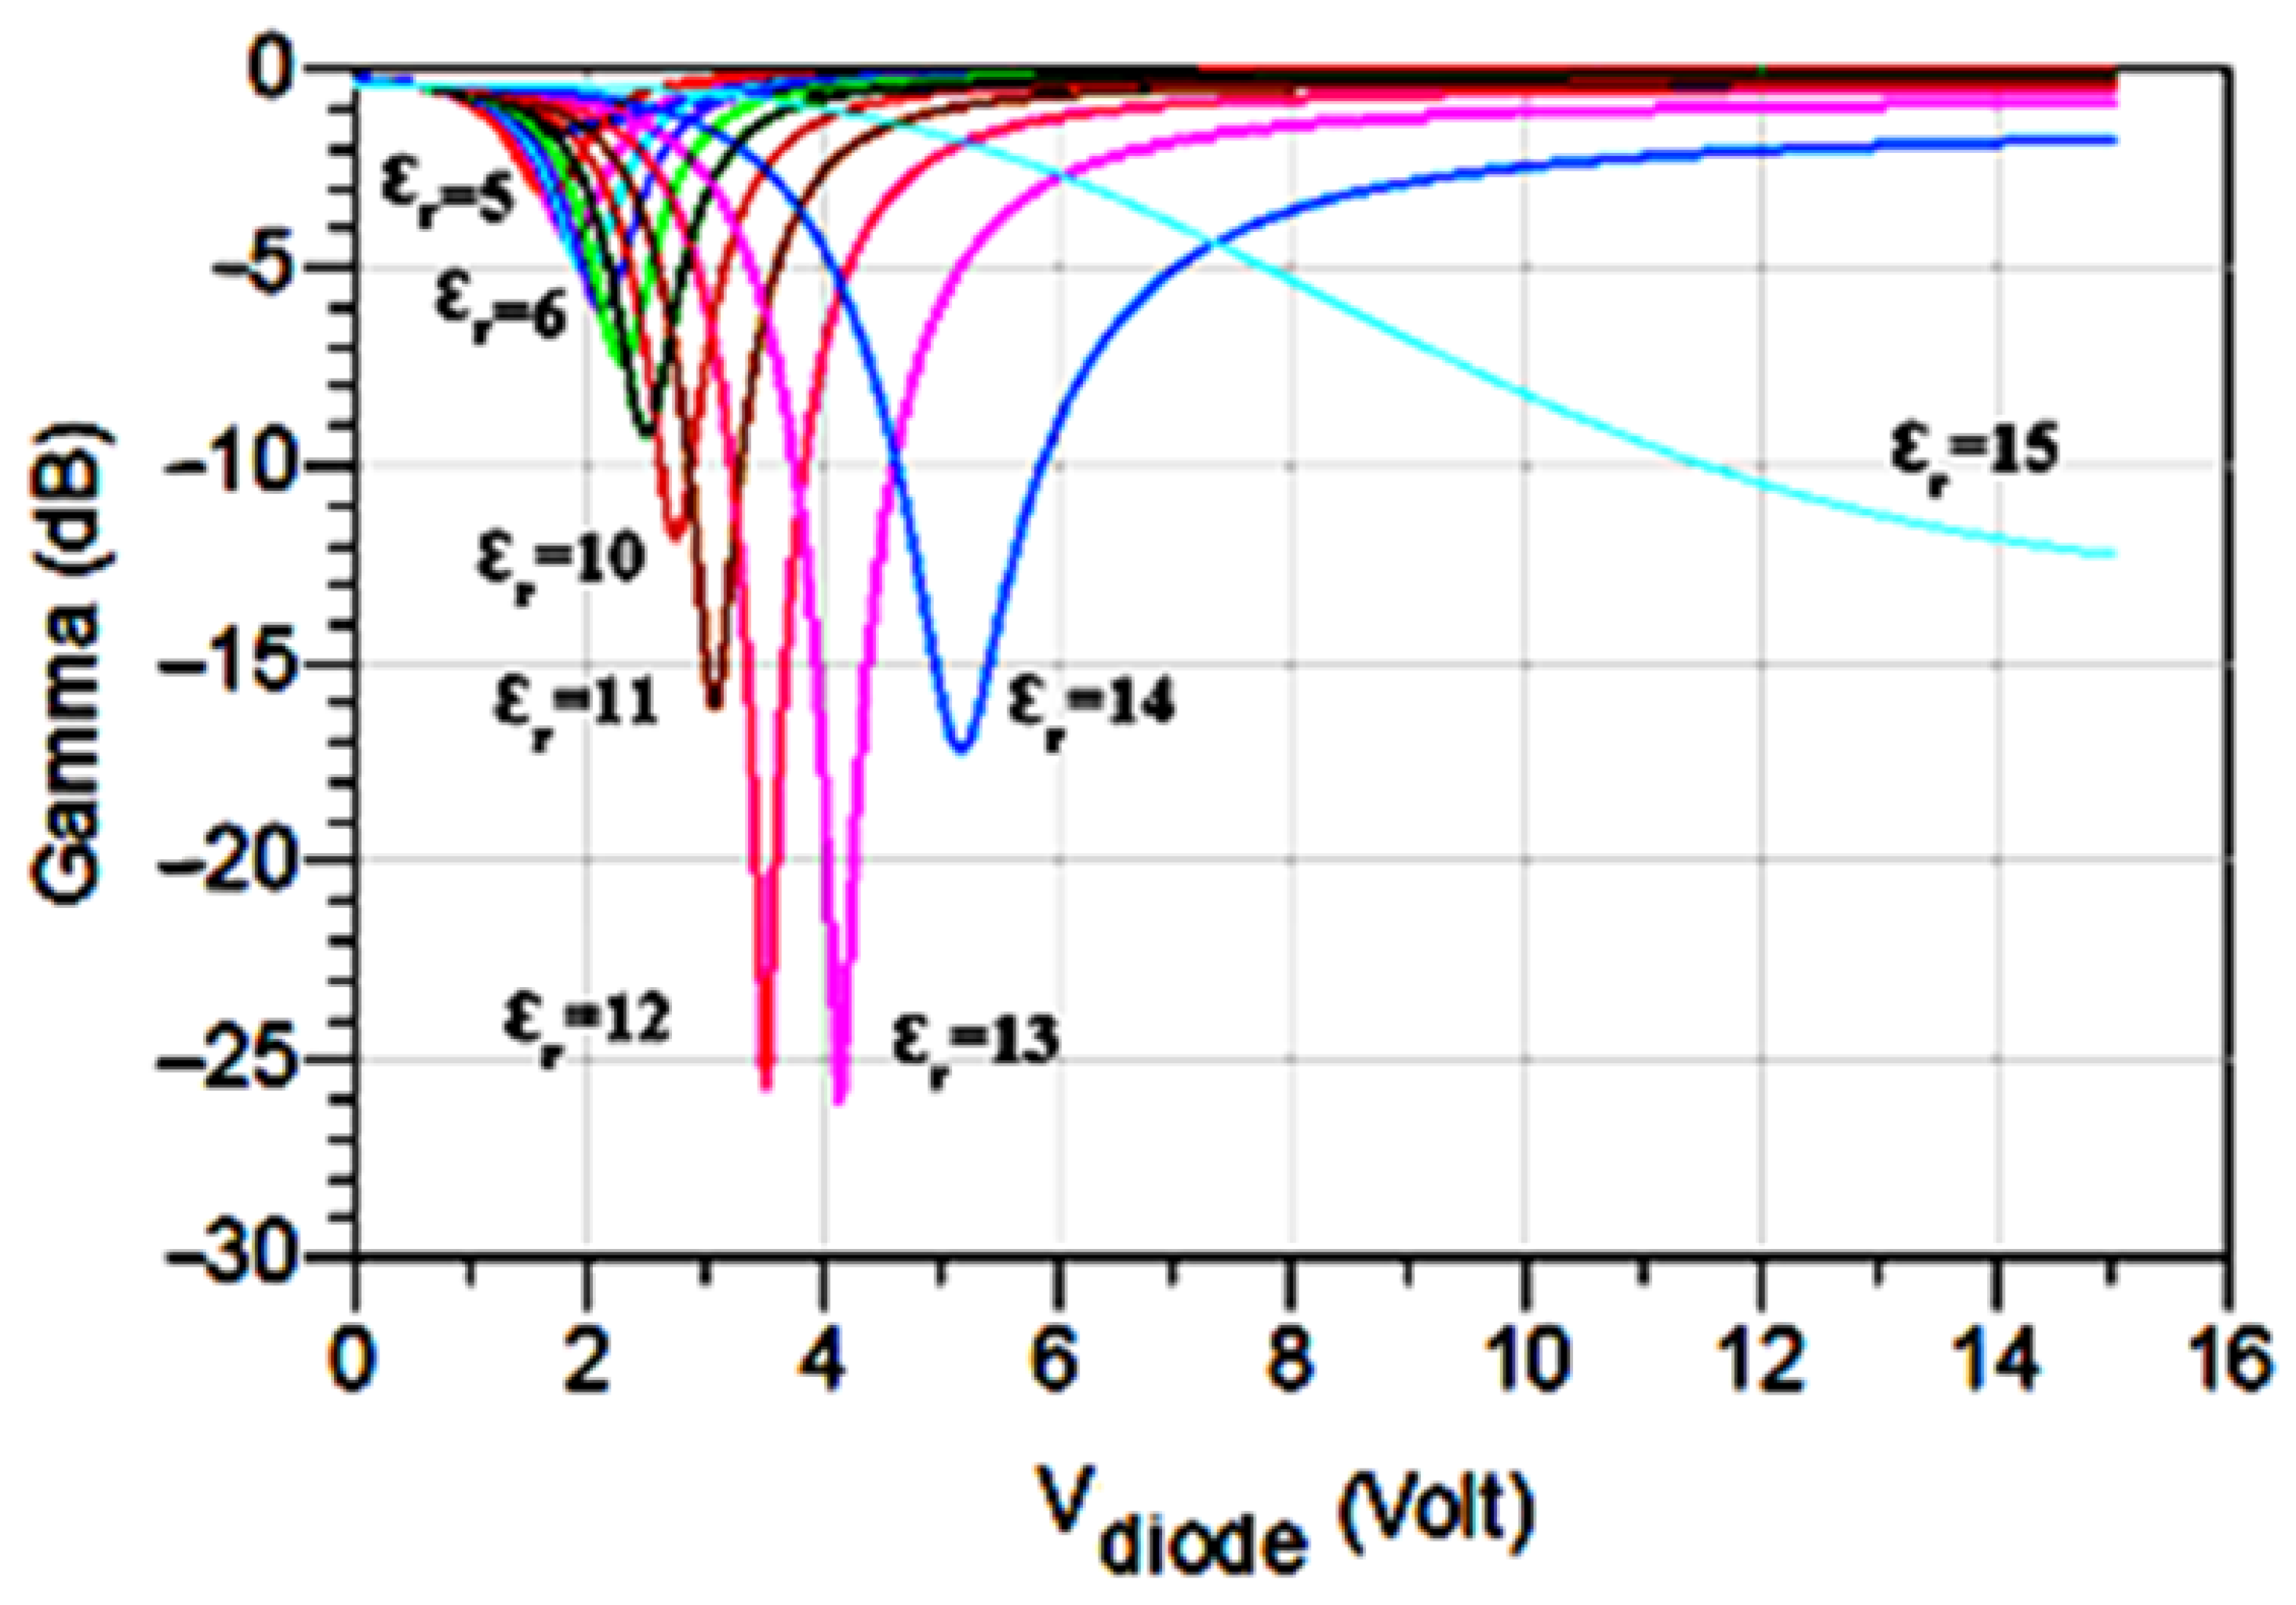
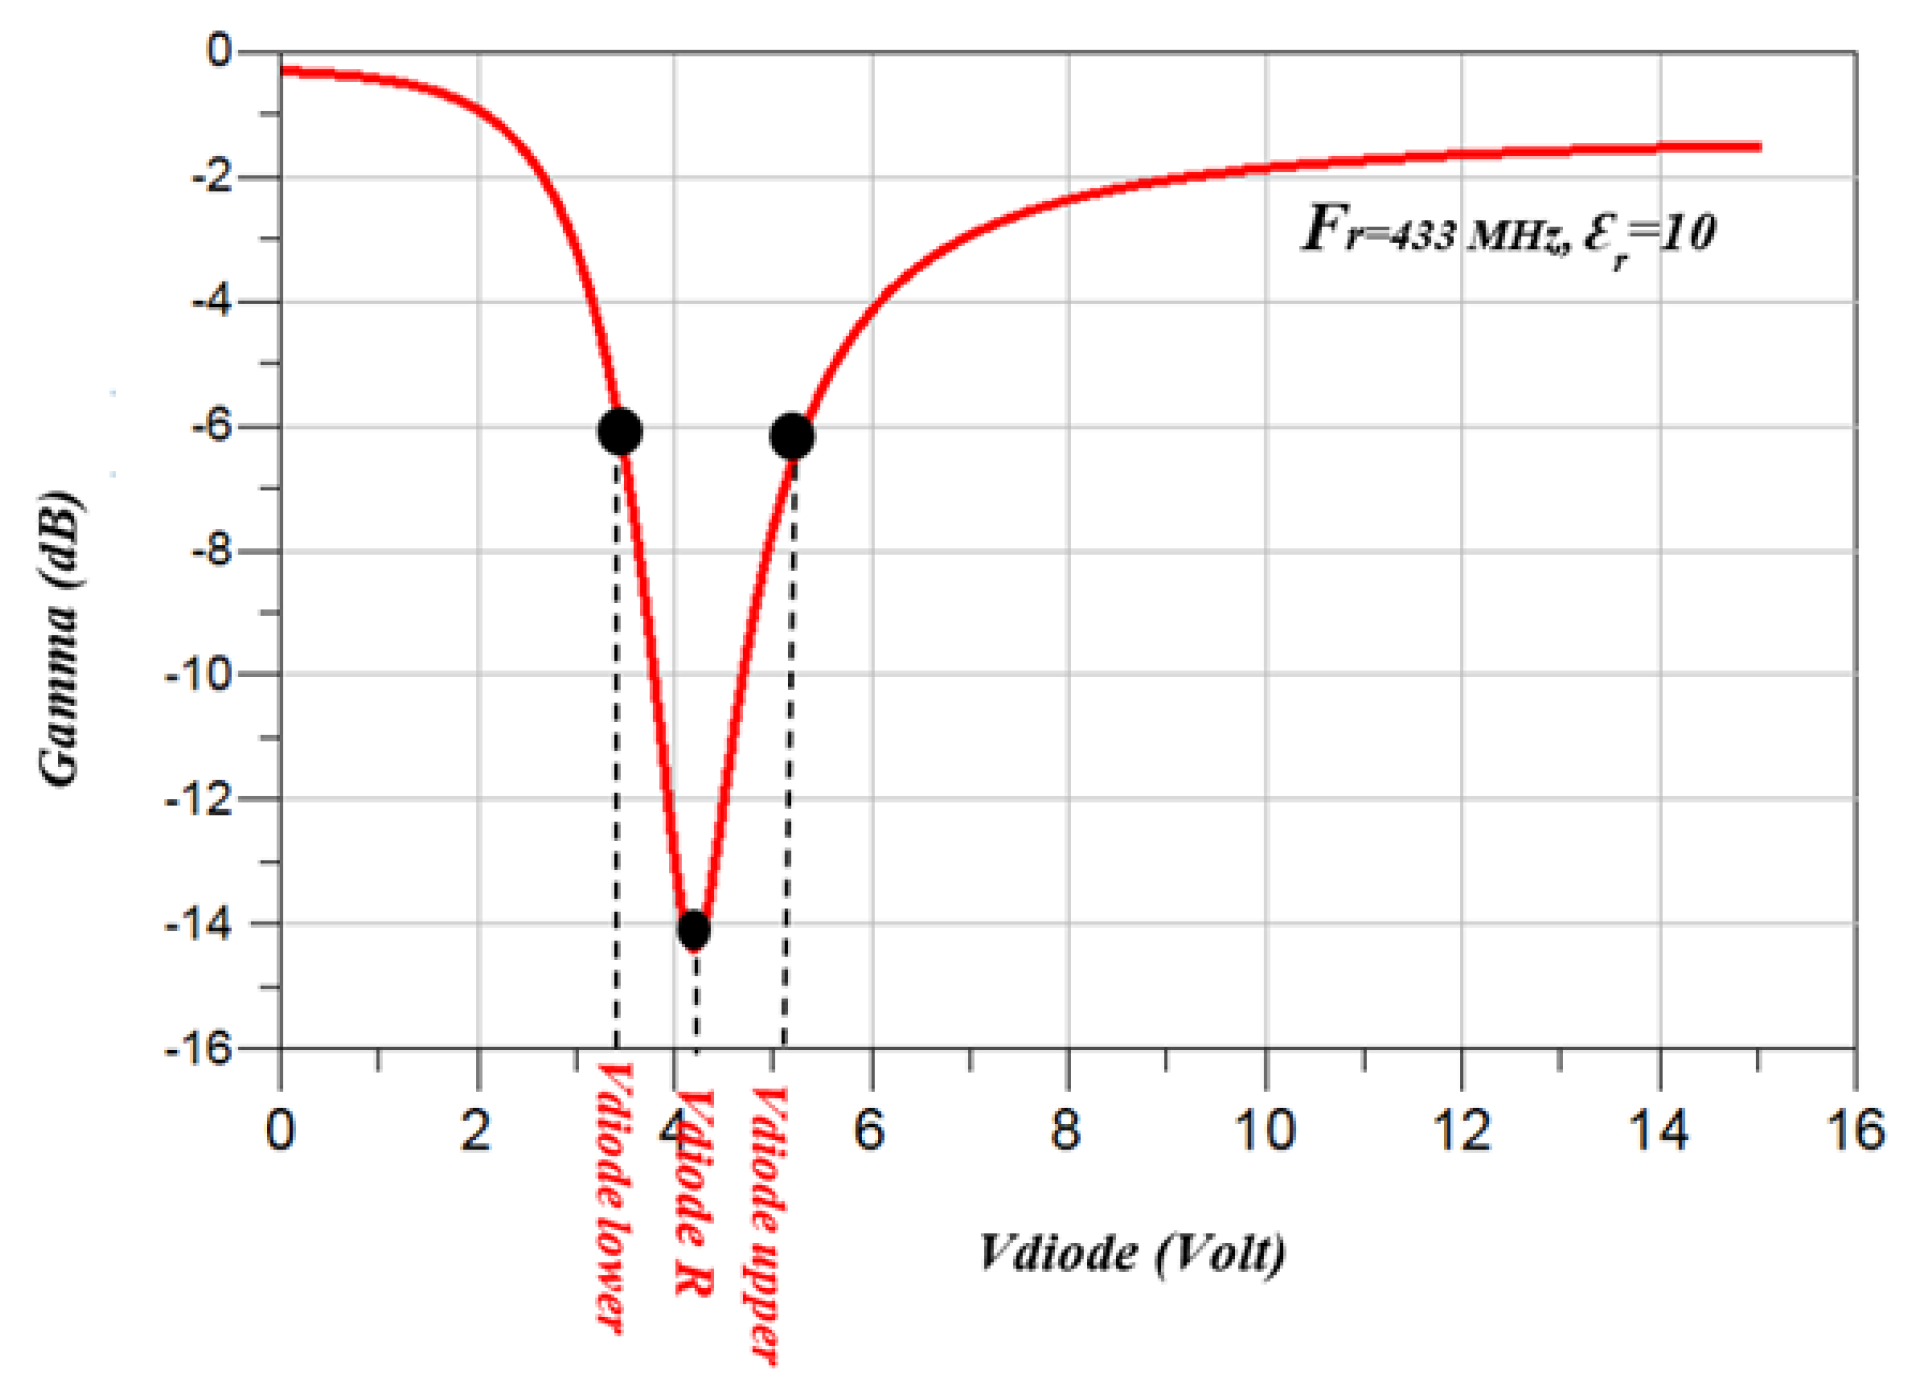
3. Results and Discussion

The comparison of the complex dielectric permittivity estimation values calculated from the three models described in the earlier sections demonstrated that dielectric soil properties using the Frequency Domain Reflectometry (FDR) sensing method offered significant advantages over traditional methods. However, challenges related to the underground transmission channel were addressed by achieving a self-resonant frequency of 433 MHz.
A crucial aspect was the selection of inductance, as at the resonance frequency the inductive reactance of the inductor and the capacitive reactance of the capacitor canceled each other out: they possessed equal magnitudes but opposite signs. This cancellation occurred because, at resonance, the inductive and capacitive components of the circuit were in phase opposition, leading to their effective cancellation. Consequently, the variation in the capacitance of the soil mixture influenced the inductance value at the self-resonant frequency, resulting in changes in output impedance that affected the dielectric permittivity estimation.
The main criterion for selecting the inductance was to accommodate a wide range of dielectric permittivities at the self-resonant frequency of 433 MHz. The graphs in Figure 15 and Figure 16 indicate effective gamma detection for a permittivity range of up to 5, particularly when utilizing a varicap to broaden the range for accurate permittivity estimation. The calculated dielectric permittivity of the proposed buried probe enabled effective determination of soil moisture content, with the best performance observed for the model using lossy impedance. Moreover, accurate estimation of dielectric permittivity was noted for shorter electrical lengths.
Several key conclusions and limitations of the proposed probe can be outlined:
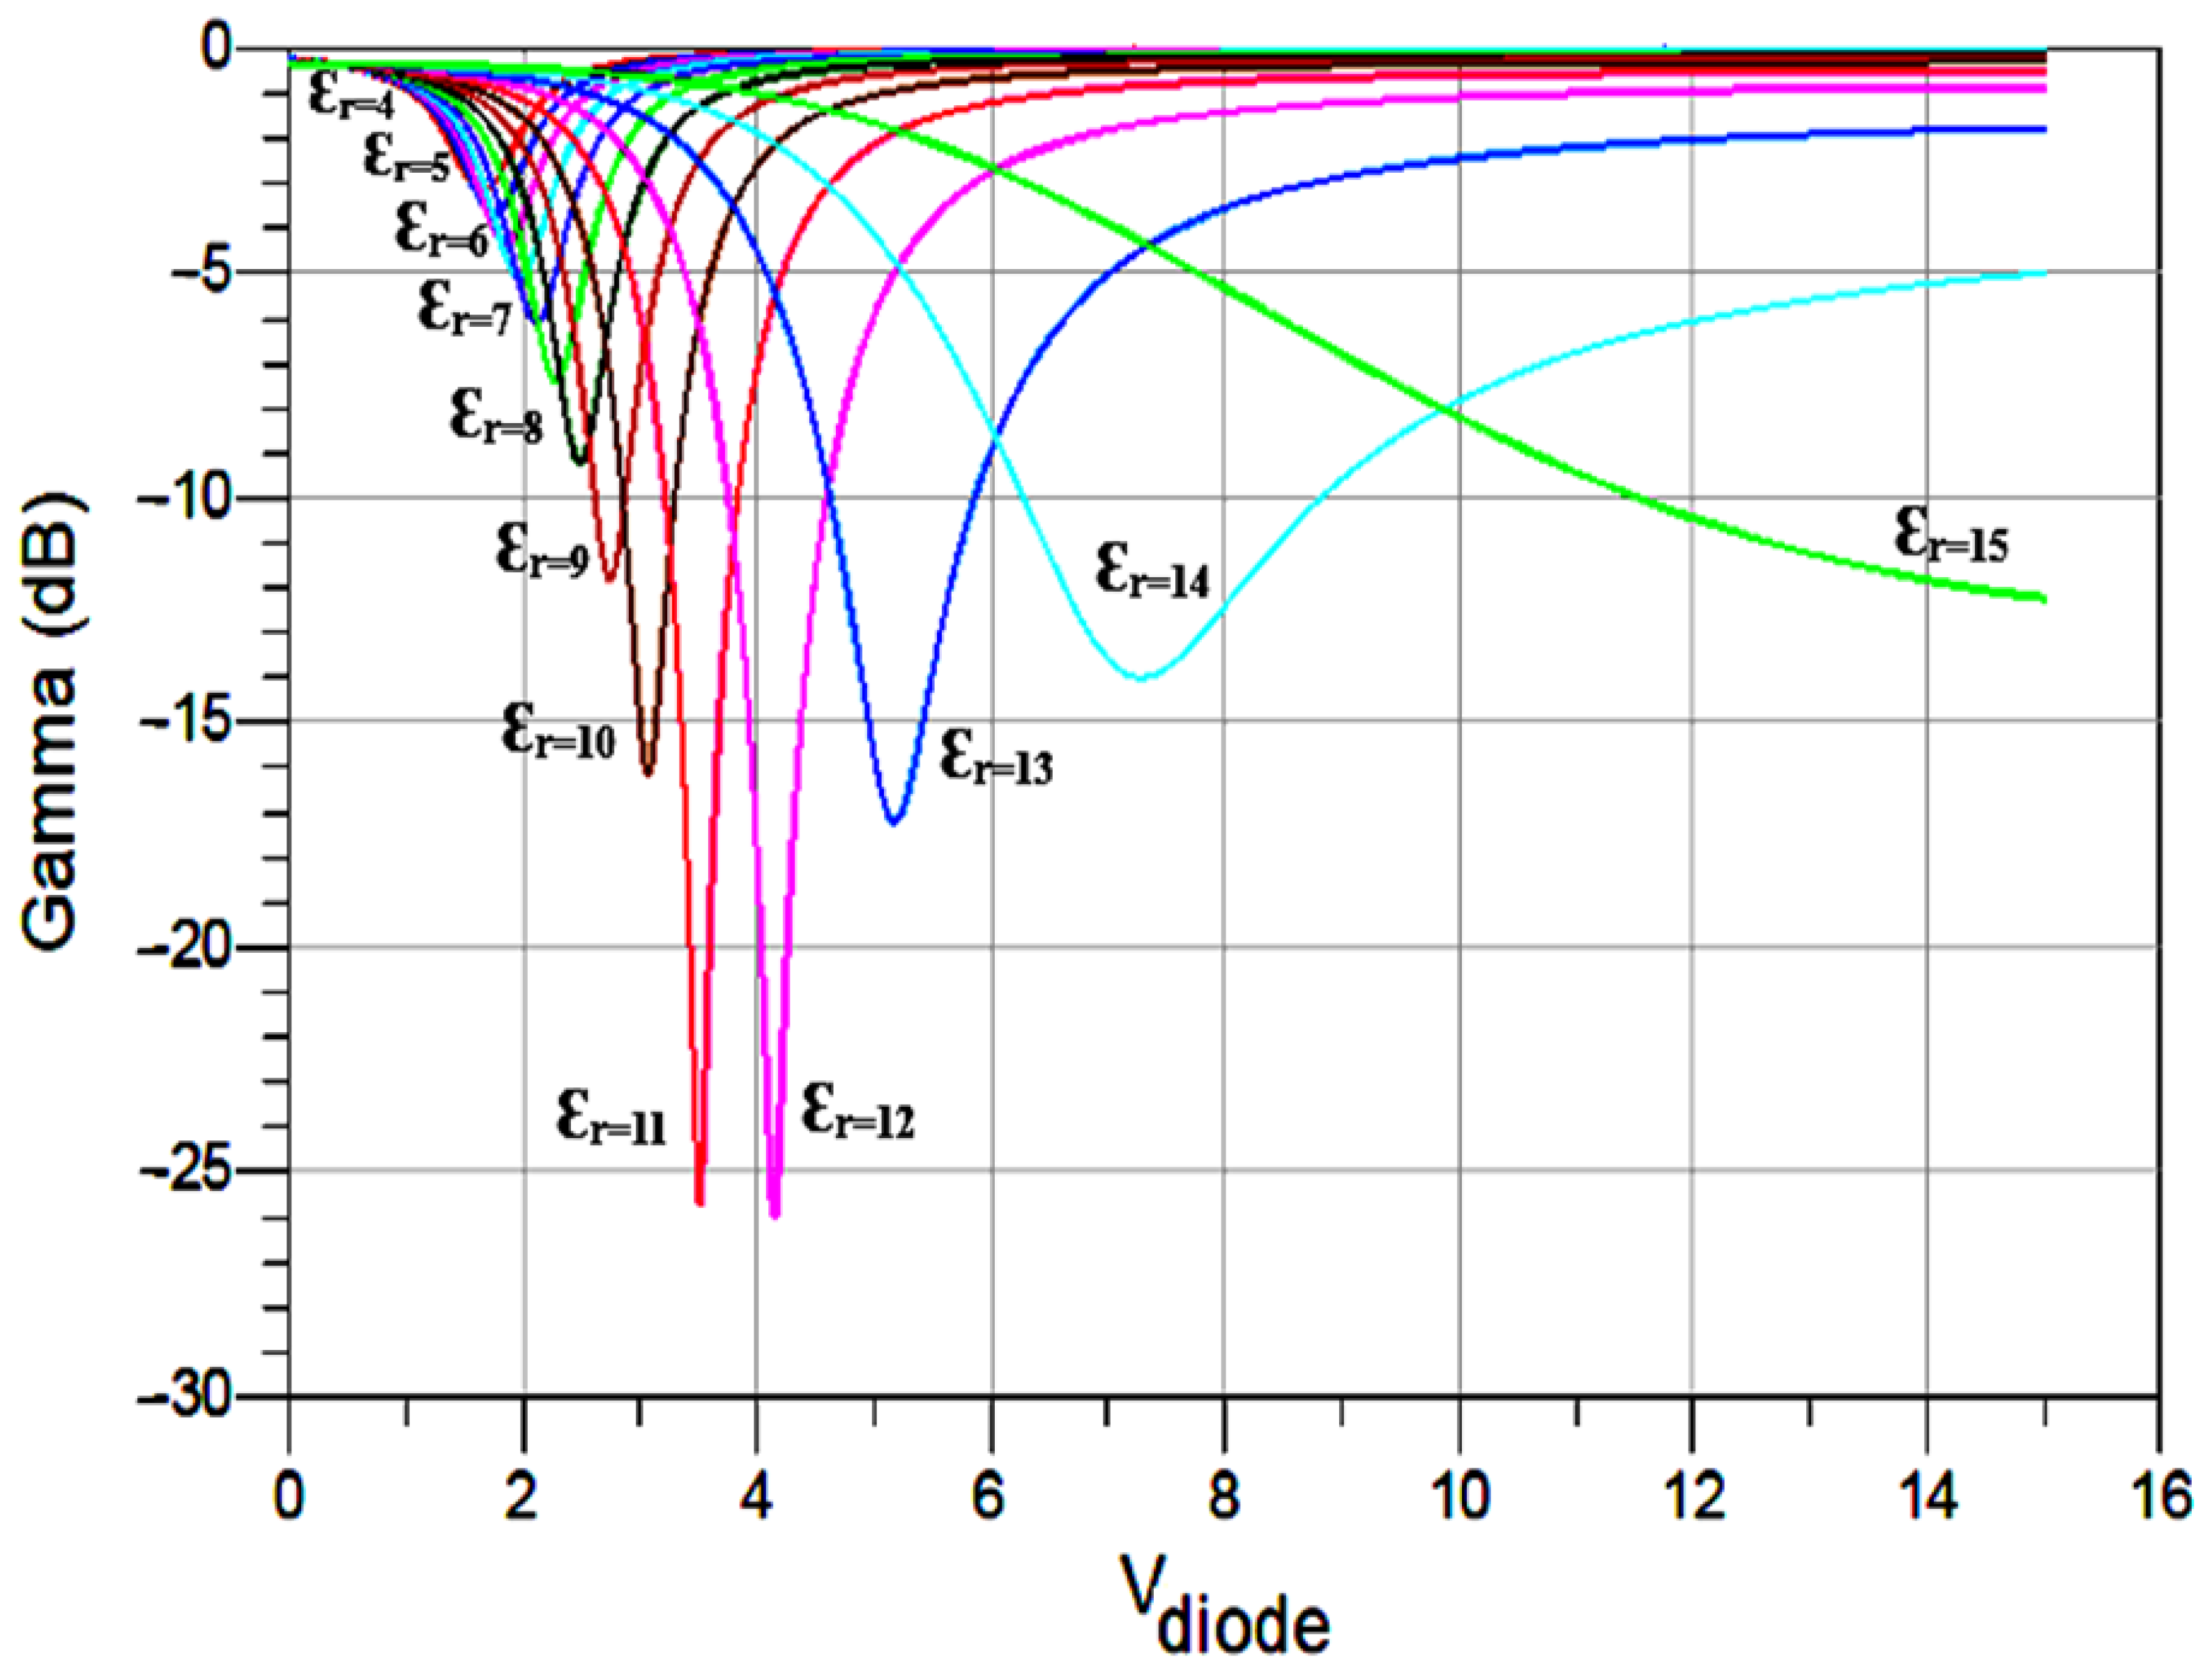
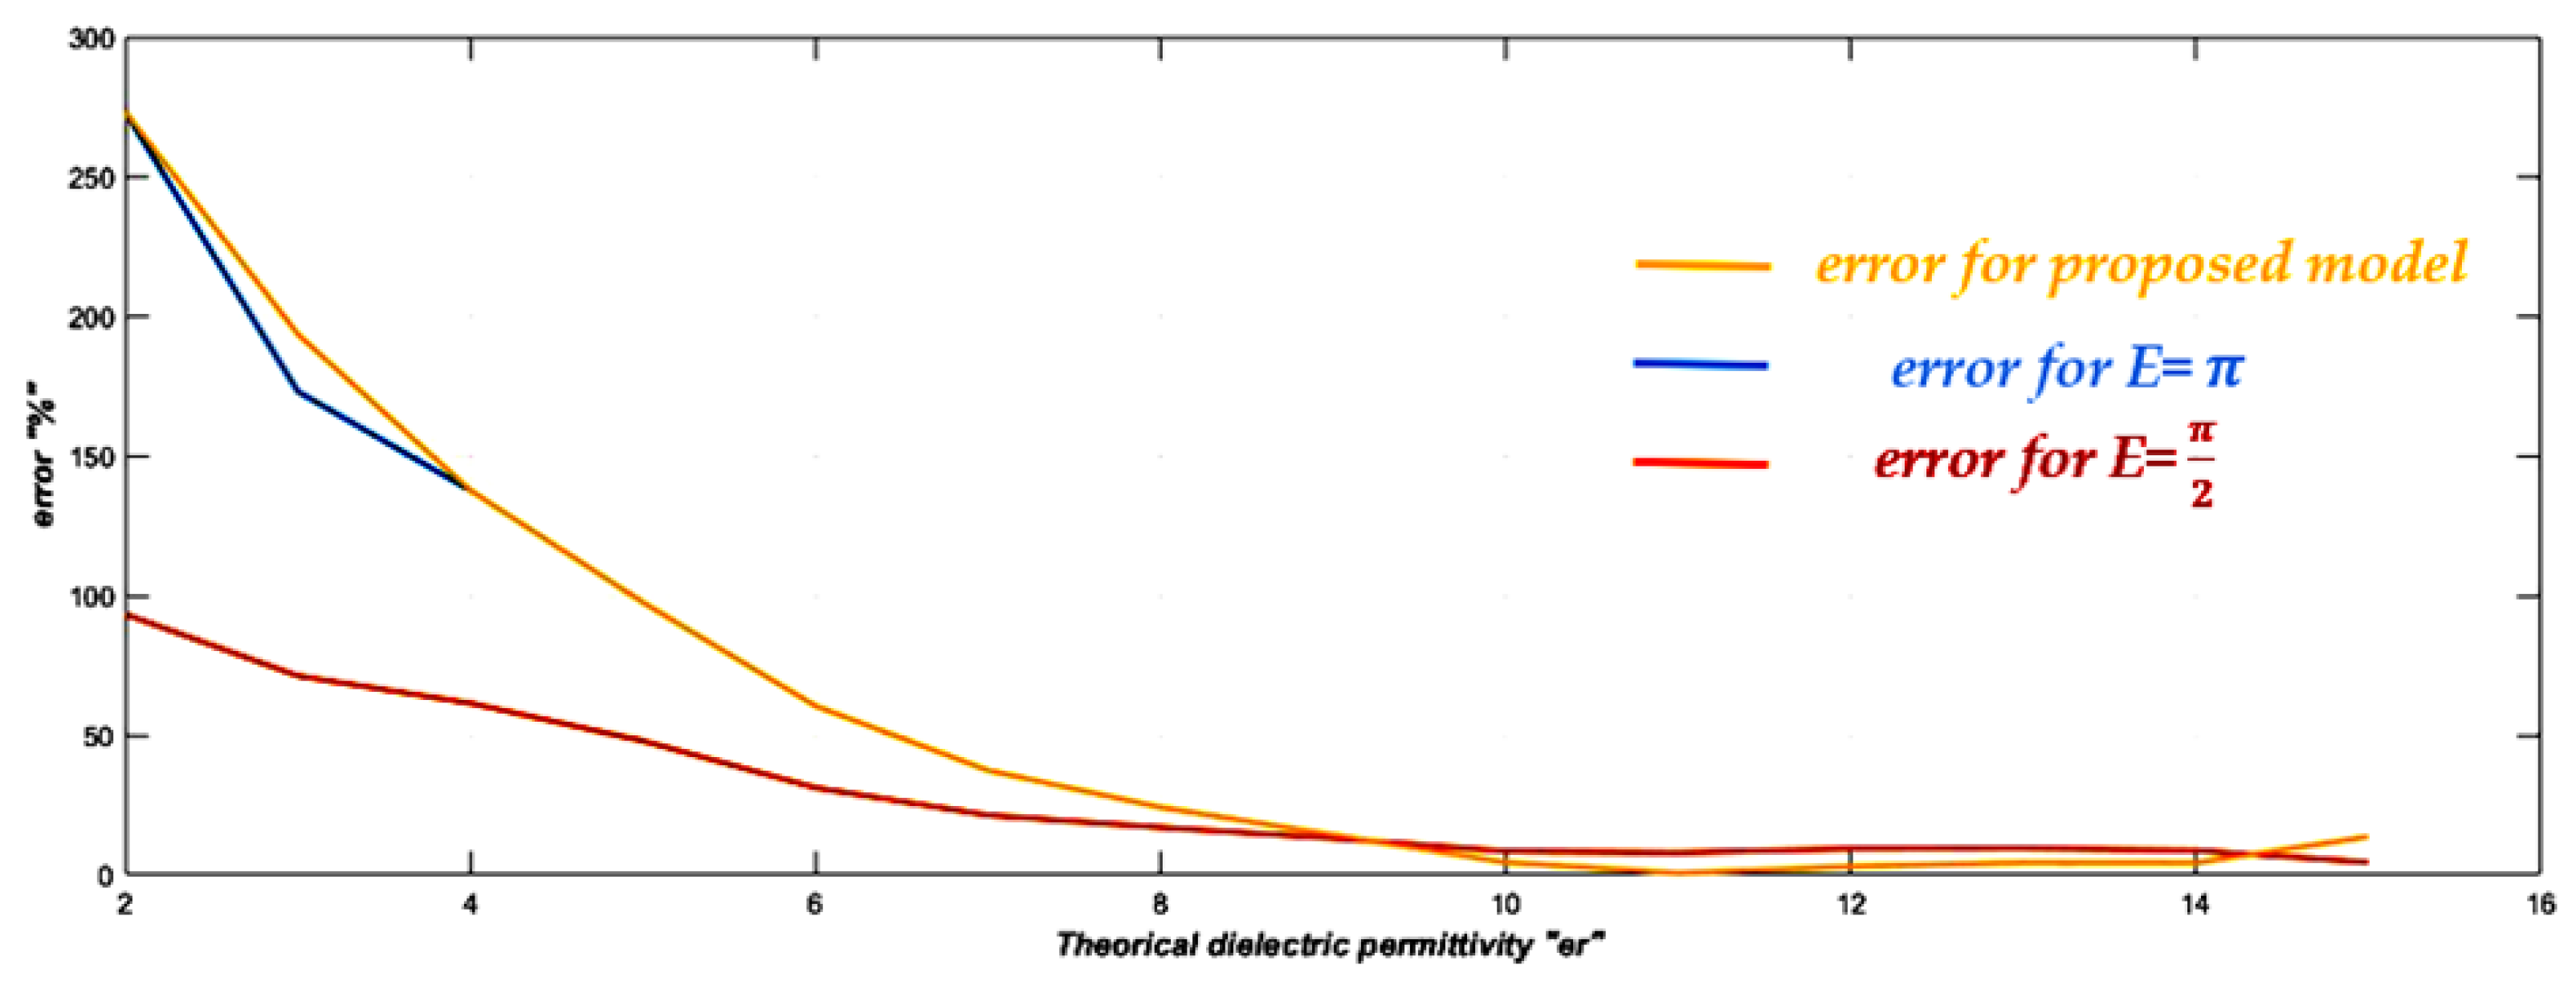
  • In the region of the measured self-resonance frequency at 433 MHz, even a minor difference in fixture design and calibration can significantly impact the readings, leading to either a large positive inductance or a large negative capacitance.
  • The effect of residual fixture capacitance is more pronounced with lower-value inductors, while it is often negligible for higher values.
  • Slight differences in fixture design and calibration can have substantial effects on the calculated dielectric permittivity.
  • The poor estimation of dielectric permittivity for low values can be attributed to the limited reflection coefficient at the resonance frequency, restricting it to the self-resonance frequency.
Maintaining and improving soil resources requires accurate and exact information on soils, especially when tackling major environmental issues, including agricultural abandonment, organic carbon loss, and declining soil health.
Numerous methods have been developed for measuring the dielectric permittivity of soil, including the coaxial probe [26,27,28], transmission line [29,30], and parallel plate capacitance [18,31]. Each method, as summarized in Table 6, has its own limitations and constraints. Key factors such as cost, size, accuracy, and convenience influence the selection of the most suitable method. Additionally, considerations such as frequency range, material characteristics, and temperature play a significant role in the decision-making process.
To minimize production costs, we opted for the parallel plate capacitance method, which is straightforward to construct, using two parallel metal plates. The uniform electric field established between these plates simplifies calculations and analysis. The main advantages of using parallel plate capacitance include its suitability for high-loss materials and the relative ease of measurement. This method is particularly effective at low frequencies, whereas transmission line and coaxial probe methods are better suited for high frequencies and for measuring dielectric permittivity in solids and liquids.
The coaxial probe, on the other hand, offers high accuracy for high-loss materials. However, it has notable drawbacks, including the necessity for repetitive calibrations before each permittivity measurement. Additionally, errors may arise due to air gaps that form between the probe and the liquid being tested.
Accurate and precise information about soils is essential for maintaining and improving soil resources, particularly in addressing significant environmental challenges such as agricultural abandonment, loss of organic carbon, and soil health deterioration. Fertilizer inputs must be tailored to meet the needs of trees, restoring, at least, the annual losses experienced by orchards. Any excess or deficiency in fertilization directly impacts the trees, reducing their production potential in both quantity and quality. Furthermore, excessive fertilization can lead to groundwater pollution.
In many Mediterranean countries, including Tunisia, water has become a limiting factor in agricultural development. With increasing demand, effective water management has gained importance, placing significant pressure on water resources. Despite considerable efforts to mobilize water resources, Tunisia has faced water shortages in recent years.
Water management in Tunisian agriculture poses significant challenges, especially given the excessive quantity of water currently used. Thus, accurately determining the water volume required for irrigation is crucial to achieving high-quality harvests without wasting water. This underscores the importance of this project in irrigation management and in establishing a program to supply trees with the necessary water. Tunisia, classified as a water-stressed country, has two thirds of its territory characterized as nearly desert-like. This critical situation has significantly impacted Tunisian agriculture, prompting the Ministry of Agriculture to undertake urgent water and soil retention projects. However, despite these efforts, such systems still need further development and expansion. But, even with these initiatives, these systems still require improvement and expansion. To detect soil moisture, salinity, compaction, temperature, and oxygen levels, Tunisia’s solutions now rely on sensors and probes. Growers, farmers, agronomy technicians, and other agricultural professionals use these measuring tools. Nevertheless, a large number of these sensors have low sensitivity, slow response times, and are hard-wired.
Currently, solutions in Tunisia rely on sensors and probes to measure soil moisture, salinity, compaction, temperature, and oxygen levels. These measuring instruments are utilized by agronomy technicians, growers, farmers, and other agricultural professionals. However, many of these sensors are hard-wired, exhibit slow response times, and have low sensitivity. They cannot operate autonomously and require human intervention, measurement boxes, and adjustments, with data stored and read via connection cables on PCs.
Additionally, automatic watering programmers control the operation of solenoid valves, enabling automated irrigation at predetermined frequencies and durations. While sprinkler systems offer various advantages for water management, pollution problems due to the irrational use of fertilizers persist.
Consequently, the existing solutions need improvement, compared to the new technologies that provide more efficient and economically viable approaches. Thus, modernizing agriculture in Tunisia is an economic and social necessity for the country’s future. The concept of precision agriculture involves comprehensive diagnostics of soil nature, humidity levels, fertilization, and plant growth, allowing for the adjustment of fertilizer inputs and nutrient absorption in fruit trees, alongside precise control of the water needed, based on the soil’s moisture content.
These systems represent a focal point for specialists and entrepreneurs in Tunisia, who are concentrating on several research themes, particularly in developing Wireless Sensor Networks to address these challenges. This project embraces this technology and, leveraging the skills of partner teams, aims to provide solutions that enhance the competitiveness of Tunisian agriculture and improve natural resource management. Further research is needed, to ensure their accuracy for different soil types and to evaluate their performance under subsoil moisture and pressure conditions.
Our future research will focus on creating a map of soil resources representative of Tunisia’s main natural regions, which will inform the development of methodologies adaptable across the territory. This effort will promote the use of buried Wireless Sensor Networks in precision agriculture and facilitate the adoption of best agricultural practices for improved natural resource management and enhanced production in Tunisia.
Table 7 below summarizes the probe specifications:

4. Conclusions

This article presents the design and implementation of a buried probe for a Wireless Underground Sensor Network (WUSN). Initially, we conducted a comprehensive analysis of the soil’s electrical properties, highlighting the challenges associated with underground communication as a primary consideration in the probe’s design.
We discussed the various constraints encountered during the design process, including the selection of capacitance, inductance, and the type of varactor used. These components are critical in optimizing the probe’s performance and ensuring effective signal transmission through the soil medium.
Additionally, we proposed an advanced underground probe specifically tuned to resonate at a frequency of 433 MHz. Our findings indicate a reasonable estimation of the dielectric permittivity, ranging from 2 to 15, which is essential for understanding the soil’s electromagnetic behavior.
While the results demonstrate the probe’s efficacy in predicting dielectric permittivity, we acknowledge that further enhancements are required, particularly for low permittivity values. These improvements could enhance the probe’s performance and broaden its applicability in various soil conditions.

Author Contributions

Conceptualization, M.S. and N.B.; methodology, S.G.; software, M.S.; validation, R.G. and J.F.; formal analysis, R.G.; investigation, S.G.; resources, N.B.; data curation, M.S.; writing—original draft preparation, M.S.; writing—review and editing, R.G.; visualization, J.F.; supervision, N.B.; project administration, N.B. All authors have read and agreed to the published version of the manuscript.

Funding

This research received no external funding.

Institutional Review Board Statement

Not applicable.

Informed Consent Statement

Not applicable.

Data Availability Statement

The original contributions presented in the study are included in the article, further inquiries can be directed to the corresponding authors.

Acknowledgments

The authors would like to express their gratitude to the University of Tunis El Manar for its support throughout this research project.

Conflicts of Interest

The authors declare no conflicts of interest.

Abbreviations

The following abbreviations are used in this manuscript:
VCOVoltage-Controlled Oscillator
MHzMegahertz
WSNsWireless Sensor Networks
WUSNWireless Underground Sensor Network
IoTInternet of Things
TDRTime Domain Reflectometry
FDRFrequency Domain Reflectometry
CWContinuous Wave
ADCAnalog-to-Digital Converter
UHFUltra-High Frequency
LoRaLong-Range
KHzKilohertz
CRCCyclic Redundancy Check
RSSIReceived Signal Strength Indicator
RFRadio Frequency
ISMIndustrial, Scientific, and Medical frequency bands.

References

  1. Musa, P.; Sugeru, H.; Wibowo, E.P. Wireless Sensor Networks for Precision Agriculture: A Review of NPK Sensor Implementations. Sensors 2024, 24, 51. [Google Scholar] [CrossRef] [PubMed]
  2. Salam, A.; Vuran, M.C.; Irmak, S. Di-Sense: In-situ real-time permittivity estimation and soil moisture sensing using wireless underground communications. Comput. Netw. 2019, 151, 3141. [Google Scholar] [CrossRef]
  3. Hardie, M.; Hoyle, D. Underground Wireless Data Transmission Using 433-MHz LoRa For Agriculture. Sensors 2019, 19, 4232. [Google Scholar] [CrossRef] [PubMed]
  4. Salam, A.; Raza, U. Electromagnetic Characteristics of the Soil; Springer: Berlin/Heidelberg, Germany, 2020. [Google Scholar]
  5. Abdorahimi, D.; Sadeghioon, A.M. Comparison of Radio Frequency Path Loss Models in Soil for Wireless Underground Sensor Networks. J. Sens. Actuator Netw. 2019, 8, 35. [Google Scholar] [CrossRef]
  6. Disale, A.S.; Chavan, D.P.; Alameen, A.S.; Undre, P.B. Soil Characterization Using Physical and Chemical Properties. J. Phys. Conf. Ser. 2020, 1644, 012026. [Google Scholar] [CrossRef]
  7. Wohwe Sambo, D.; Forster, A.; Yenke, B.O.; Sarr, I.; Gueye, B.; Dayang, P. Wireless Underground Sensor Networks Path Loss Model for Precision Agriculture (WUSN-PLM). IEEE Sens. J. 2020, 20, 5298–5313. [Google Scholar] [CrossRef]
  8. Zhou, Q.; Yao, X.; Hu, J. Study on the propagation characteristic of electromagnetic waves based on WUSN. J. Electromagn. Waves Appl. 2021, 35, 1708–1718. [Google Scholar] [CrossRef]
  9. Attard, G.; Rossier, Y.; Winiarski, T.; Eisenlohr, L. Urban underground development confronted by the challenges of groundwater resources: Guidelines dedicated to the construction of underground structures in urban aquifers. Land Use Policy 2017, 64, 461–469. [Google Scholar] [CrossRef]
  10. Wang, J.; Lim, E.G.; Leach, M.P.; Wang, Z.; Man, K.L. Open-Ended Coaxial Cable Selection for Measurement of Liquid Dielectric Properties via the Reflection Method. Math. Probl. Eng. 2020, 2020, 8942096. [Google Scholar]
  11. He, H.; Turner, N.C.; Aogu, K.; Dyck, M.; Feng, H.; Si, B.; Wang, J.; Lv, J. Time and frequency domain reflectometry for the measurement of tree stem water content: A review, evaluation, and future perspectives. Agric. For. Meteorol. 2021, 306, 108442. [Google Scholar] [CrossRef]
  12. Cheng, J.; Zhang, Y.; Yun, H.; Wang, L.; Taylor, N. A Study of Frequency Domain Reflectometry Technique for High-Voltage Rotating Machine Winding Condition Assessment. Machines 2023, 11, 883. [Google Scholar] [CrossRef]
  13. Liang, C.; Bai, Q.; Yan, M.; Wang, Y.; Zhang, H.; Jin, B. A Comprehensive Study of Optical Frequency Domain Reflectometry. IEEE Access 2022, 9, 41647–41668. [Google Scholar] [CrossRef]
  14. Said, M.; Boulejfen, N. Study Soil as an Electrical Model for Vegetal Characterization System. In Proceedings of the 2023 22nd Mediterranean Microwave Symposium (MMS), Sousse, Tunisia, 30 October–1 November 2023. [Google Scholar]
  15. Moiroux-Arvis, L.; Cariou, C.; Chanet, J.P. Evaluation of LoRa technology in 433-MHz and 868-MHz for underground to above ground data transmission. Comput. Electron. Agric. 2022, 194, 106770. [Google Scholar] [CrossRef]
  16. ITU-T. Low Power Protocol for Wide Area Wireless Networks; ITU: Geneva, Switzerland, 2021; Available online: https://standards.globalspec.com/std/14487600/y-4480 (accessed on 10 December 2024).
  17. Šarolić, A.; Matković, A. Dielectric Permittivity Measurement Using Open-Ended Coaxial Probe—Modeling and Simulation Based on the Simple Capacitive-Load Model. Sensors 2022, 22, 6024. [Google Scholar] [CrossRef]
  18. Mandrić Radivojević, V.; Rupčić, S.; Srnović, M.; Benšić, G. Measuring the Dielectric Constant of Paper Using a Parallel Plate Capacitor. Int. J. Electr. Comput. Eng. Syst. 2018, 9, 1–10. [Google Scholar] [CrossRef]
  19. Aljoumani, B.; Sanchez, J.; Wessolek, G. A Stochastic Linear Model to Evaluate the Dielectric Constant—Electrical Conductivity Relation of a Sandy Soil Using TDR Records; European Union: Luxembourg, 2018. [Google Scholar]
  20. Bertocco, M.; Parrino, S.; Peruzzi, G.; Pozzebon, A. Estimating volumetric water content in soil for IoT contexts by exploiting RSSI-based augmented sensors via machine learning. Sensors 2023, 23, 2033. [Google Scholar] [CrossRef]
  21. Payero, J.O. An Effective and Affordable Internet of Things (IoT) Scale System to Measure Crop Water Use. Agric. Eng. 2024, 6, 823–840. [Google Scholar] [CrossRef]
  22. de Melo, D.A.; Silva, P.C.; da Costa, A.R.; Delmond, J.G.; Ferreira, A.F.A.; de Souza, J.A.; de Oliveira-Júnior, J.F.; da Silva, J.L.B.; da Rosa Ferraz Jardim, A.M.; Giongo, P.R.; et al. Development and Automation of a Photovoltaic Powered Soil Moisture Sensor for Water Management. Hydrology 2023, 10, 166. [Google Scholar] [CrossRef]
  23. Vilenskiy, A.R.; Makurin, M.N.; Poshisholina, E.I.; Lee, C. Design Technique for Varactor Analog Phase Shifters with Equalized Losses. Prog. Electromagn. Res. C 2018, 86, 1–16. [Google Scholar] [CrossRef]
  24. Available online: https://www.skyworksinc.com/en/Products/Diodes/SMV1801-079LF (accessed on 10 December 2024).
  25. Pantoja, J.J.; Gutierrez, S.; Pineda, E.; Martinez, D.; Baer, C.; Vega, F. Modeling and Measurement of Complex Permittivity of Soils in UHF. IEEE Geosci. Remote Sens. Lett. 2019, 17, 1109–1113. [Google Scholar] [CrossRef]
  26. La-Gioia, A.; Porter, E.; Merunka, I.; Shahzad, A.; Salahuddin, S.; Jones, M.; O’Halloran, M. Open-Ended Coaxial Probe Technique for Dielectric Measurement of Biological Tissues: Challenges and Common Practices. Diagnostics 2018, 8, 40. [Google Scholar] [CrossRef] [PubMed]
  27. Guihard, V.; Taillade, F.; Balayssac, J.P.; Steck, B.; Sanahuja, J. Permittivity measurement of cementitious materials and constituents with an open-ended coaxial probe: Combination of experimental data, numerical modelling and a capacitive model. RILEM Tech. Lett. 2019, 4, 39–48. [Google Scholar] [CrossRef]
  28. Zahedi, A.; Boroumand, F.A.; Aliakbrian, H. Analytical transmission line model for complex dielectric constant measurement of thin substrates using T-resonator method. IET Microw. Antennas Propag. 2020, 14, 2027–2034. [Google Scholar] [CrossRef]
  29. Sato, Y.; Ogura, N.; Yamaguchi, Y.; Ju, Y. Development of a sensor for dielectric constant measurements utilizing time-domain measurement with a vector network analyzer. Measurement 2020, 169, 108530. [Google Scholar] [CrossRef]
  30. Stanley, M.; Parker-Jervis, R.; Skinner, J.; DeGraaf, S.; Lindström, T.; Cunningham, J.E.; Ridler, N.M. Determination of the Permittivity of Transmission Lines at Milli-Kelvin Temperatures. IEEE Access 2023, 11, 60626–60634. [Google Scholar] [CrossRef]
  31. Najoji, S.D.; Abubakar, M. Parallel Plate Technique Determination of Dielectric Constant and Strength of Plastic. Int. J. Sci. Eng. Res. 2020, 11, 831–833. [Google Scholar]
Figure 1. Vegetal soil characterization system.
Applsci 14 11884 g001
Figure 2. LoRa receiver and transmitter.
Applsci 14 11884 g002
Figure 3. Test band of (a) a hole 70 cm deep; (b) buried Lora module covered with soil; (c) connected buried Lora module; (d) holes set up over extended distance, 2 m apart.
Applsci 14 11884 g003
Figure 4. LoRa receiver and transmitter response.
Applsci 14 11884 g004
Figure 5. Simulated capacitance for circular plate capacitors.
Applsci 14 11884 g005
Figure 6. Simulated capacitance for rectangular plate capacitors.
Applsci 14 11884 g006
Figure 7. Simulated total capacitance for circular plate capacitors.
Applsci 14 11884 g007
Figure 8. Simulated total capacitance for rectangular plate capacitors for different plate separations.
Applsci 14 11884 g008
Figure 9. Simulated total capacitance for circular plate capacitors for different plate radius.
Applsci 14 11884 g009
Figure 10. Synoptic of circular parallel plate capacitance.
Applsci 14 11884 g010
Figure 11. Equivalent electric circuit of the soil.
Applsci 14 11884 g011
Figure 12. Simulated conductance for different circular plate separations d.
Applsci 14 11884 g012
Figure 13. The simulated imaginary part of the admittance for a different circular plate separation d.
Applsci 14 11884 g013
Figure 14. Schematic of the proposed buried probe.
Applsci 14 11884 g014
Figure 15. Simulated reflection coefficient for different soil permittivities ε r .
Applsci 14 11884 g015
Figure 16. Reflection coefficient as a function of V r for different dielectric permittivities ε r .
Applsci 14 11884 g016
Figure 17. Equivalent model of the varactor diode.
Applsci 14 11884 g017
Figure 18. The capacitance of the SMV1801varactor diode.
Applsci 14 11884 g018
Figure 19. Measured vegetal soil electromagnetic properties.
Applsci 14 11884 g019
Figure 20. Resonance curve for dielectric permittivity ε r = 10 .
Applsci 14 11884 g020
Figure 21. Results of the dielectric permittivity estimation.
Applsci 14 11884 g021
Figure 22. Schematic representation of a transmission line.
Applsci 14 11884 g022
Figure 23. Probe diagram. The red arrow represents a variable capacity.
Applsci 14 11884 g023
Figure 24. Reflection coefficient for different dielectric soil permittivities ϵ r .
Applsci 14 11884 g024
Figure 25. Results of the dielectric permittivity estimation for an electrical length E = π 2 .
Applsci 14 11884 g025
Figure 26. Dielectric permittivity for an electrical line length E = π .
Applsci 14 11884 g026
Figure 27. Dielectric permittivity error vs. estimated dielectric constant.
Applsci 14 11884 g027
Table 1. LoRa module settings.
ParameterValueUnit
Center frequency433MHz
Bandwidth125KHz
Coding rate4/8Bit
Spreading Factor (SF)12
Output power14dBm
Table 2. The Lora transmitter and receiver test radio parameters.
Lora TransmitterLora Receiver
RADIO SET FREQ 433,100,000radio set freq 433,100,000
RADIO SET PWR 14radio set pwr 14
RADIO SET RX BW 125radio set rx bw 125
RADIO SET CR 4/8radio set cr 4/8
RADIO SET SF 12radio set sf 12
RADIO TX FFradio Rx ok
Table 3. Comparison between the measurement methods.
Measurement TechniquesAdvantagesDisadvantages
Coaxial probeHigh accuracy for high-loss materials.
High accuracy for high-loss materials.
Air gaps cause errors.
Repetitive calibrations.
Transmission lineSuitable for high frequency.
Support for both solids and liquids.
Cannot use below a few GHz, due to practical sample length limitation.
Sample preparation is difficult (fills fixture cross-section).
Parallel plate capacitanceMeasurements are easier.
Suitable for high-loss materials.
Support for low frequency (best results).
Electrode polarization effect.
Table 4. Comparison between TDR and FDR methods.
FDRTDR
DefinitionDefinition
The Frequency Domain Reflectometry approach is the foundation of the FDR sensor, a soil sensor. By transmitting a high-frequency signal into the soil and analyzing the properties of the returned signal, it calculates the soil’s moisture content. FDR sensors analyze the frequency response and translate it into a moisture content reading, using sophisticated circuitry and algorithms.Based on the Time Domain Reflectometry technique, the TDR sensor is a soil sensor. By delivering a brief pulse signal into the soil and analyzing the properties of the reflected signal, it ascertains the soil’s moisture content. Based on how quickly the pulse signal passes through the soil, the TDR sensor determines the moisture level.
AdvantagesAdvantages
1. The FDR sensor operates reliably in a variety of salinity and soil types.
2. With comparatively minimal impact on salinity and temperature, it can offer excellent accuracy and stability.
3. Generally speaking, FDR sensors last a long time.
1. The TDR sensor is very stable and accurate.
2. Its impact on soil conductivity and temperature is negligible.
3. TDR sensors monitor moisture quickly and precisely.
LimitationsLimitations
1. FDR sensors are more costly and sophisticated.
2. Specialized knowledge and abilities are needed for installation and operation.
3. Because of the resolution of the frequency response, FDR sensors are comparatively sensitive to variations in the conductivity of the soil material.
1. Installing and using TDR sensors requires specialized knowledge and is costly.
2. In high-salinity soils, TDR sensor accuracy may be hampered.
3. Because TDR sensors require accurate time measurement and data analysis, they can be more susceptible to interference.
Table 5. Model parameters of the SMV1801 varactor diode.
ParameterDescriptionValueUnit
C j Zero-bias junction capacitor85pF
V j Junction potential10V
MGrading coefficient4.4-
R s Series resistance1.1 Ω
L s Series inductance0.8nH
C p Parallel capacitance2.6pF
Table 6. Comparison between the measurement methods.
Measurement TechniquesAdvantagesDisadvantages
Coaxial ProbeHigh accuracy for high-loss materials.
High accuracy for high-loss materials.
Air gaps cause errors.
Repetitive calibrations.
Transmission LineSuitable for high frequency.
Supports both solids and liquids.
Cannot be used below a few GHz.
Sample preparation is difficult (fills fixture cross-section).
Parallel Plate CapacitanceMeasurements are easier.
Suitable for high-loss materials.
Supports low frequency (best results).
Electrode polarization effect.
Table 7. The probe specifications.
SpecificationsValue
Frequency433 MHz
Capacitance typeCircular
Radius of the capacitance10 cm
Thickness of the capacitance5 cm
Inductance0.9 nH
Varactor modelSMV1801
Disclaimer/Publisher’s Note: The statements, opinions and data contained in all publications are solely those of the individual author(s) and contributor(s) and not of MDPI and/or the editor(s). MDPI and/or the editor(s) disclaim responsibility for any injury to people or property resulting from any ideas, methods, instructions or products referred to in the content.

