
Study on Optimization of Rice-Drying Process Parameters and Directional Regulation of Nutrient Quality

 , , ,
, , , 
Abstract
1. Introduction
2. Materials and Methods
2.1. Experimental Materials
2.2. Equipment and Instruments
2.3. Experimental Methods
2.4. Measurement of Experimental Indicators
2.5. Data Analysis
2.6. Experimental Design Scheme
3. Results
3.1. Experimental Results and Analysis of Variance
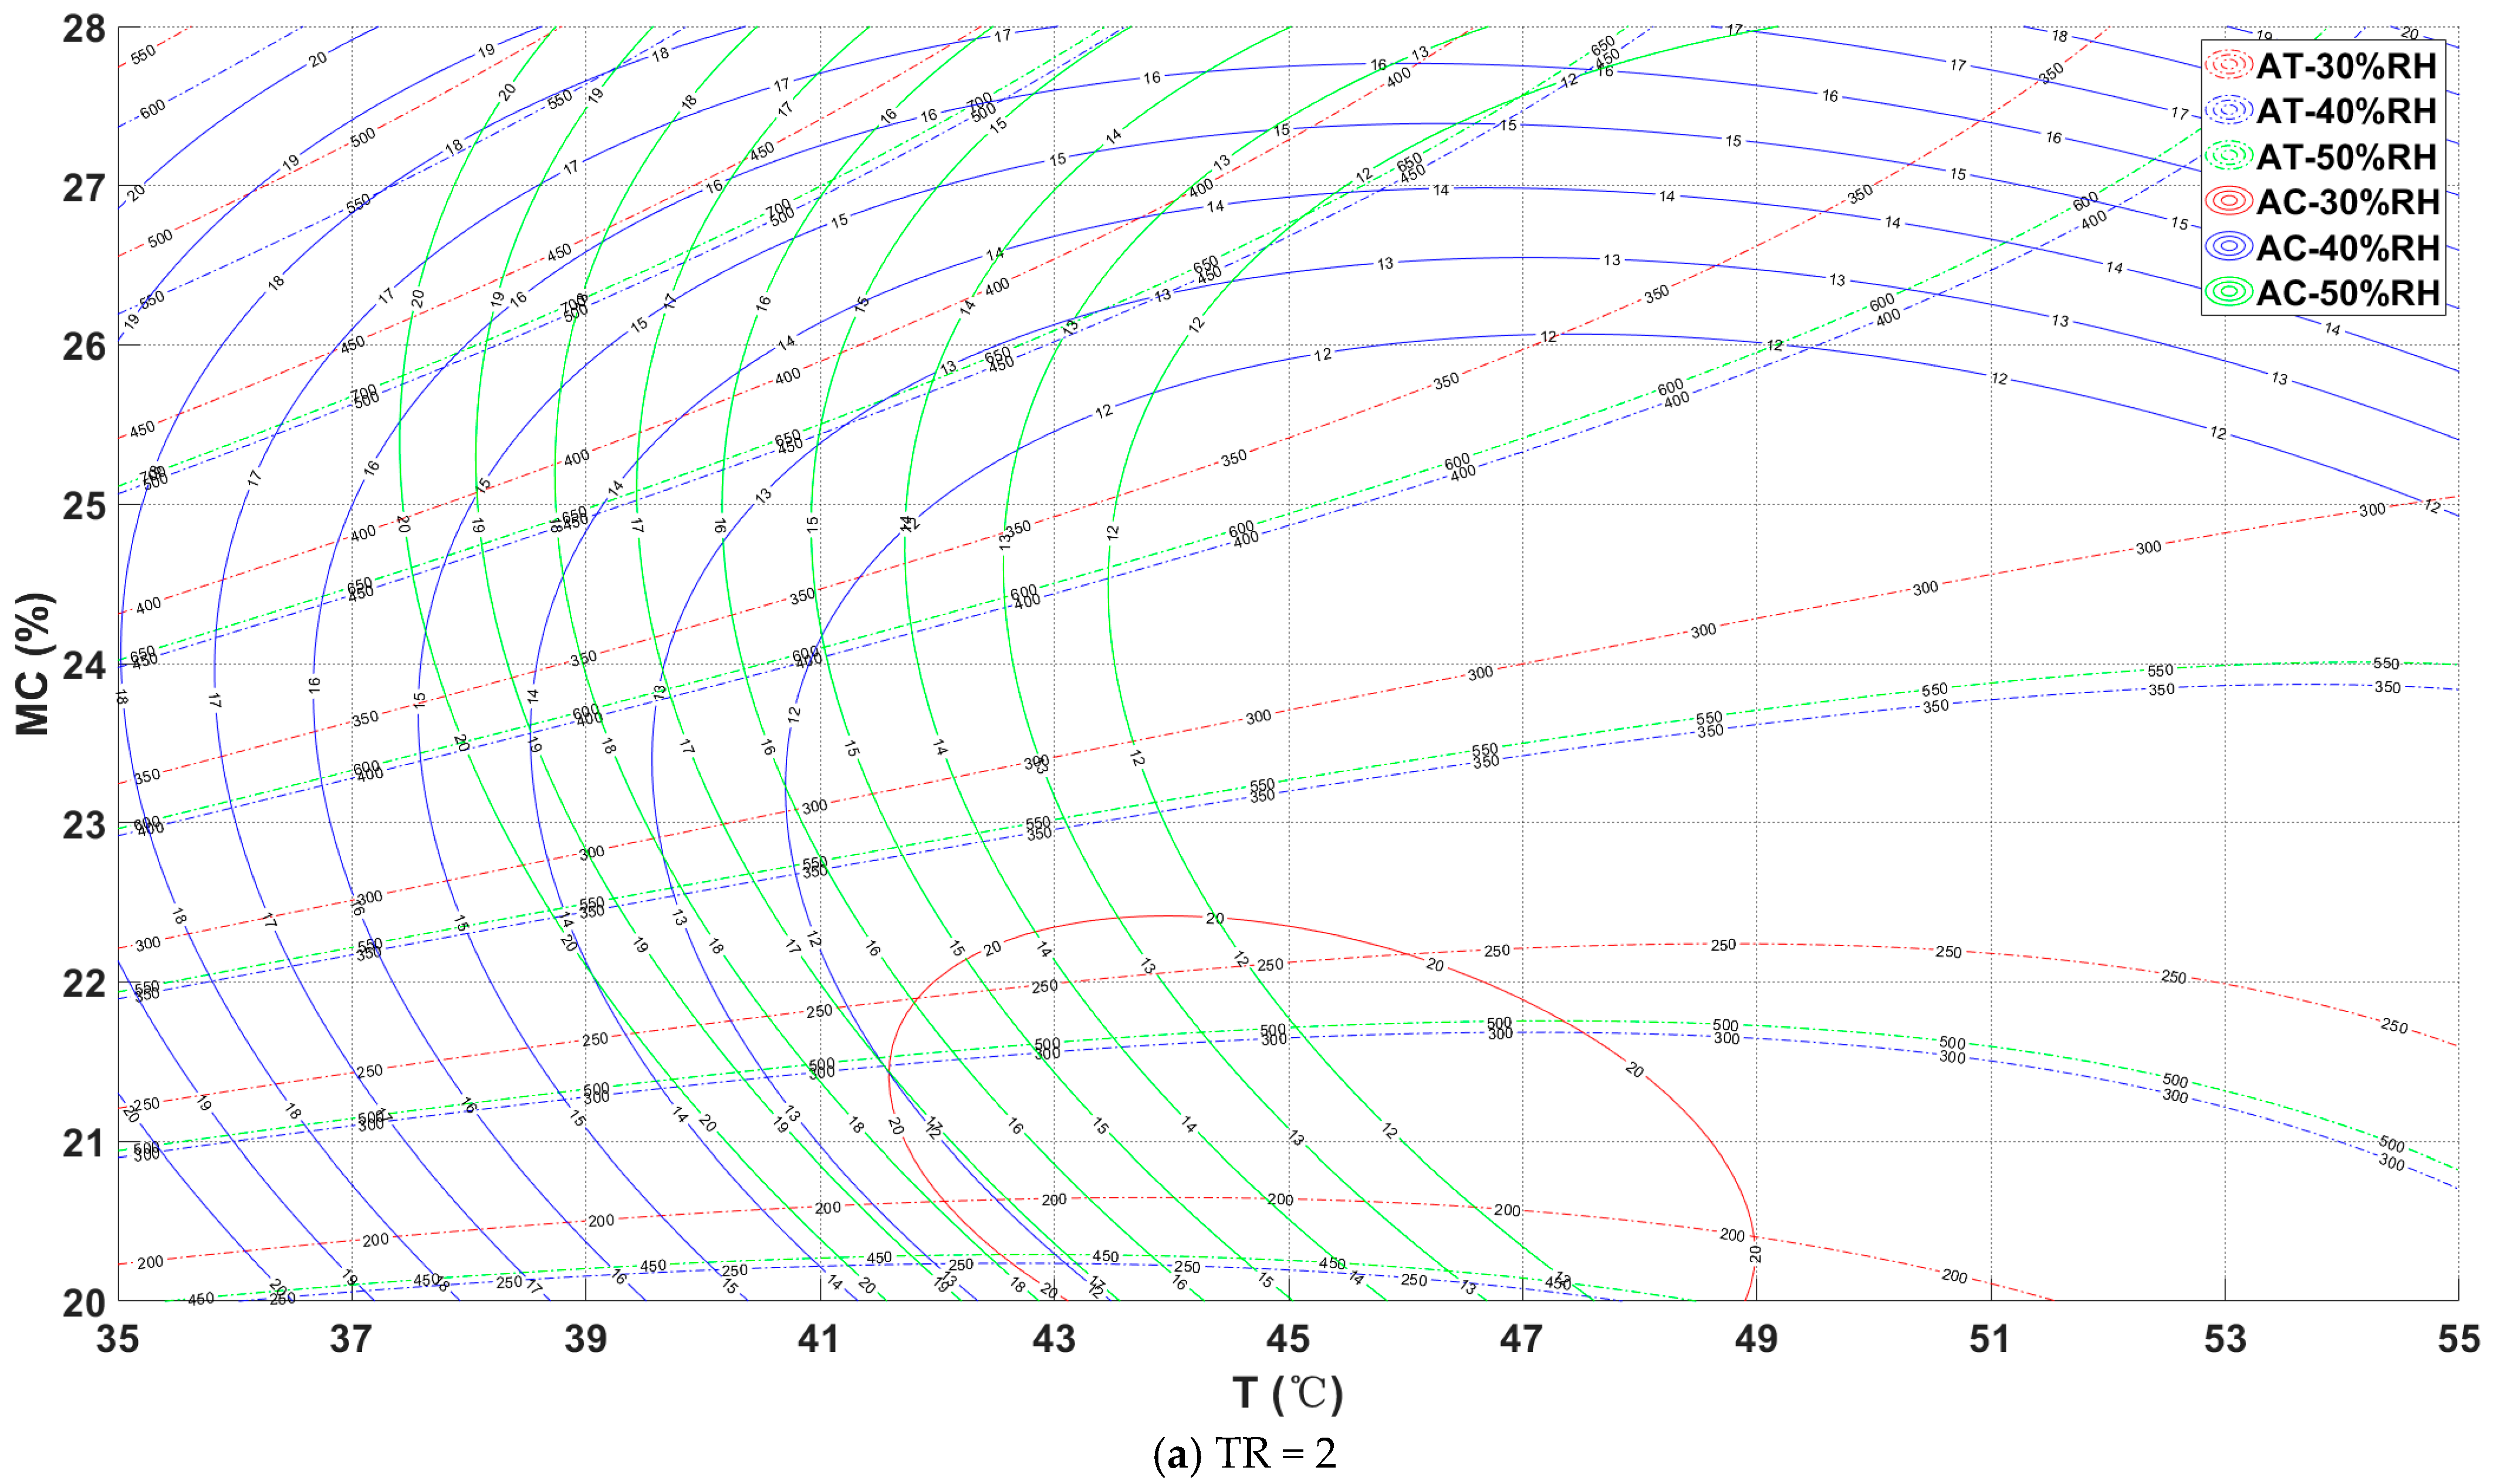
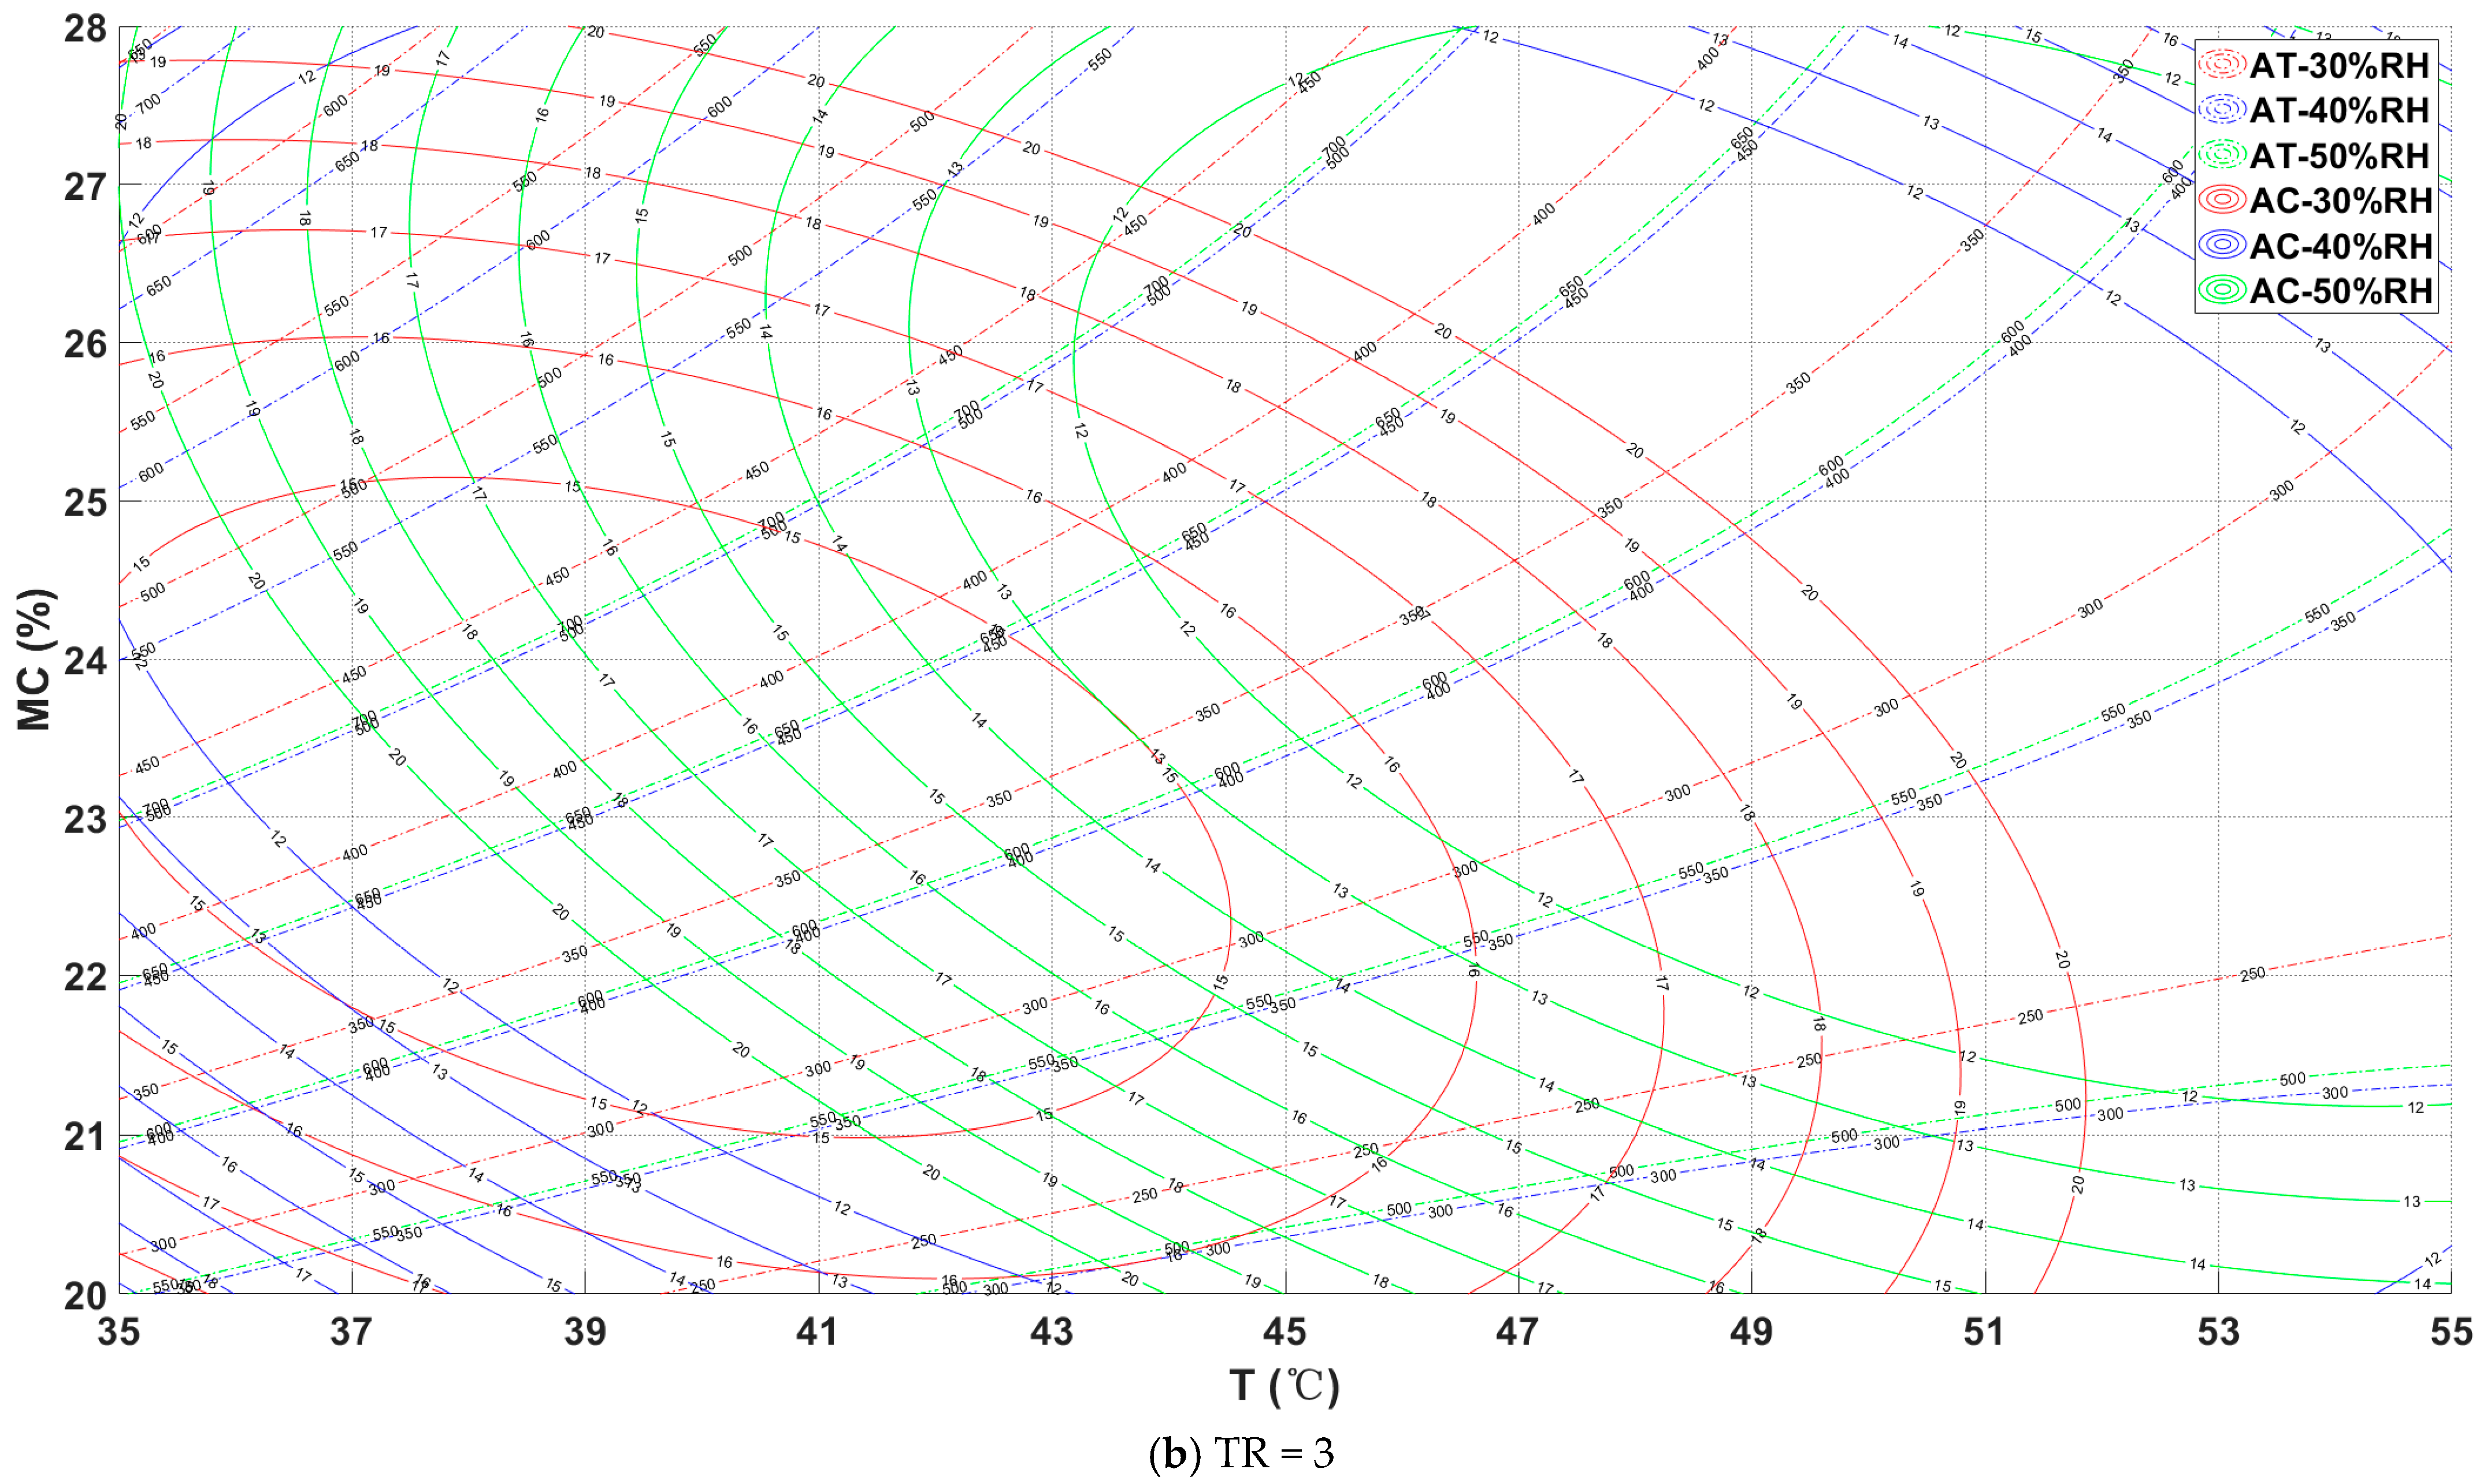
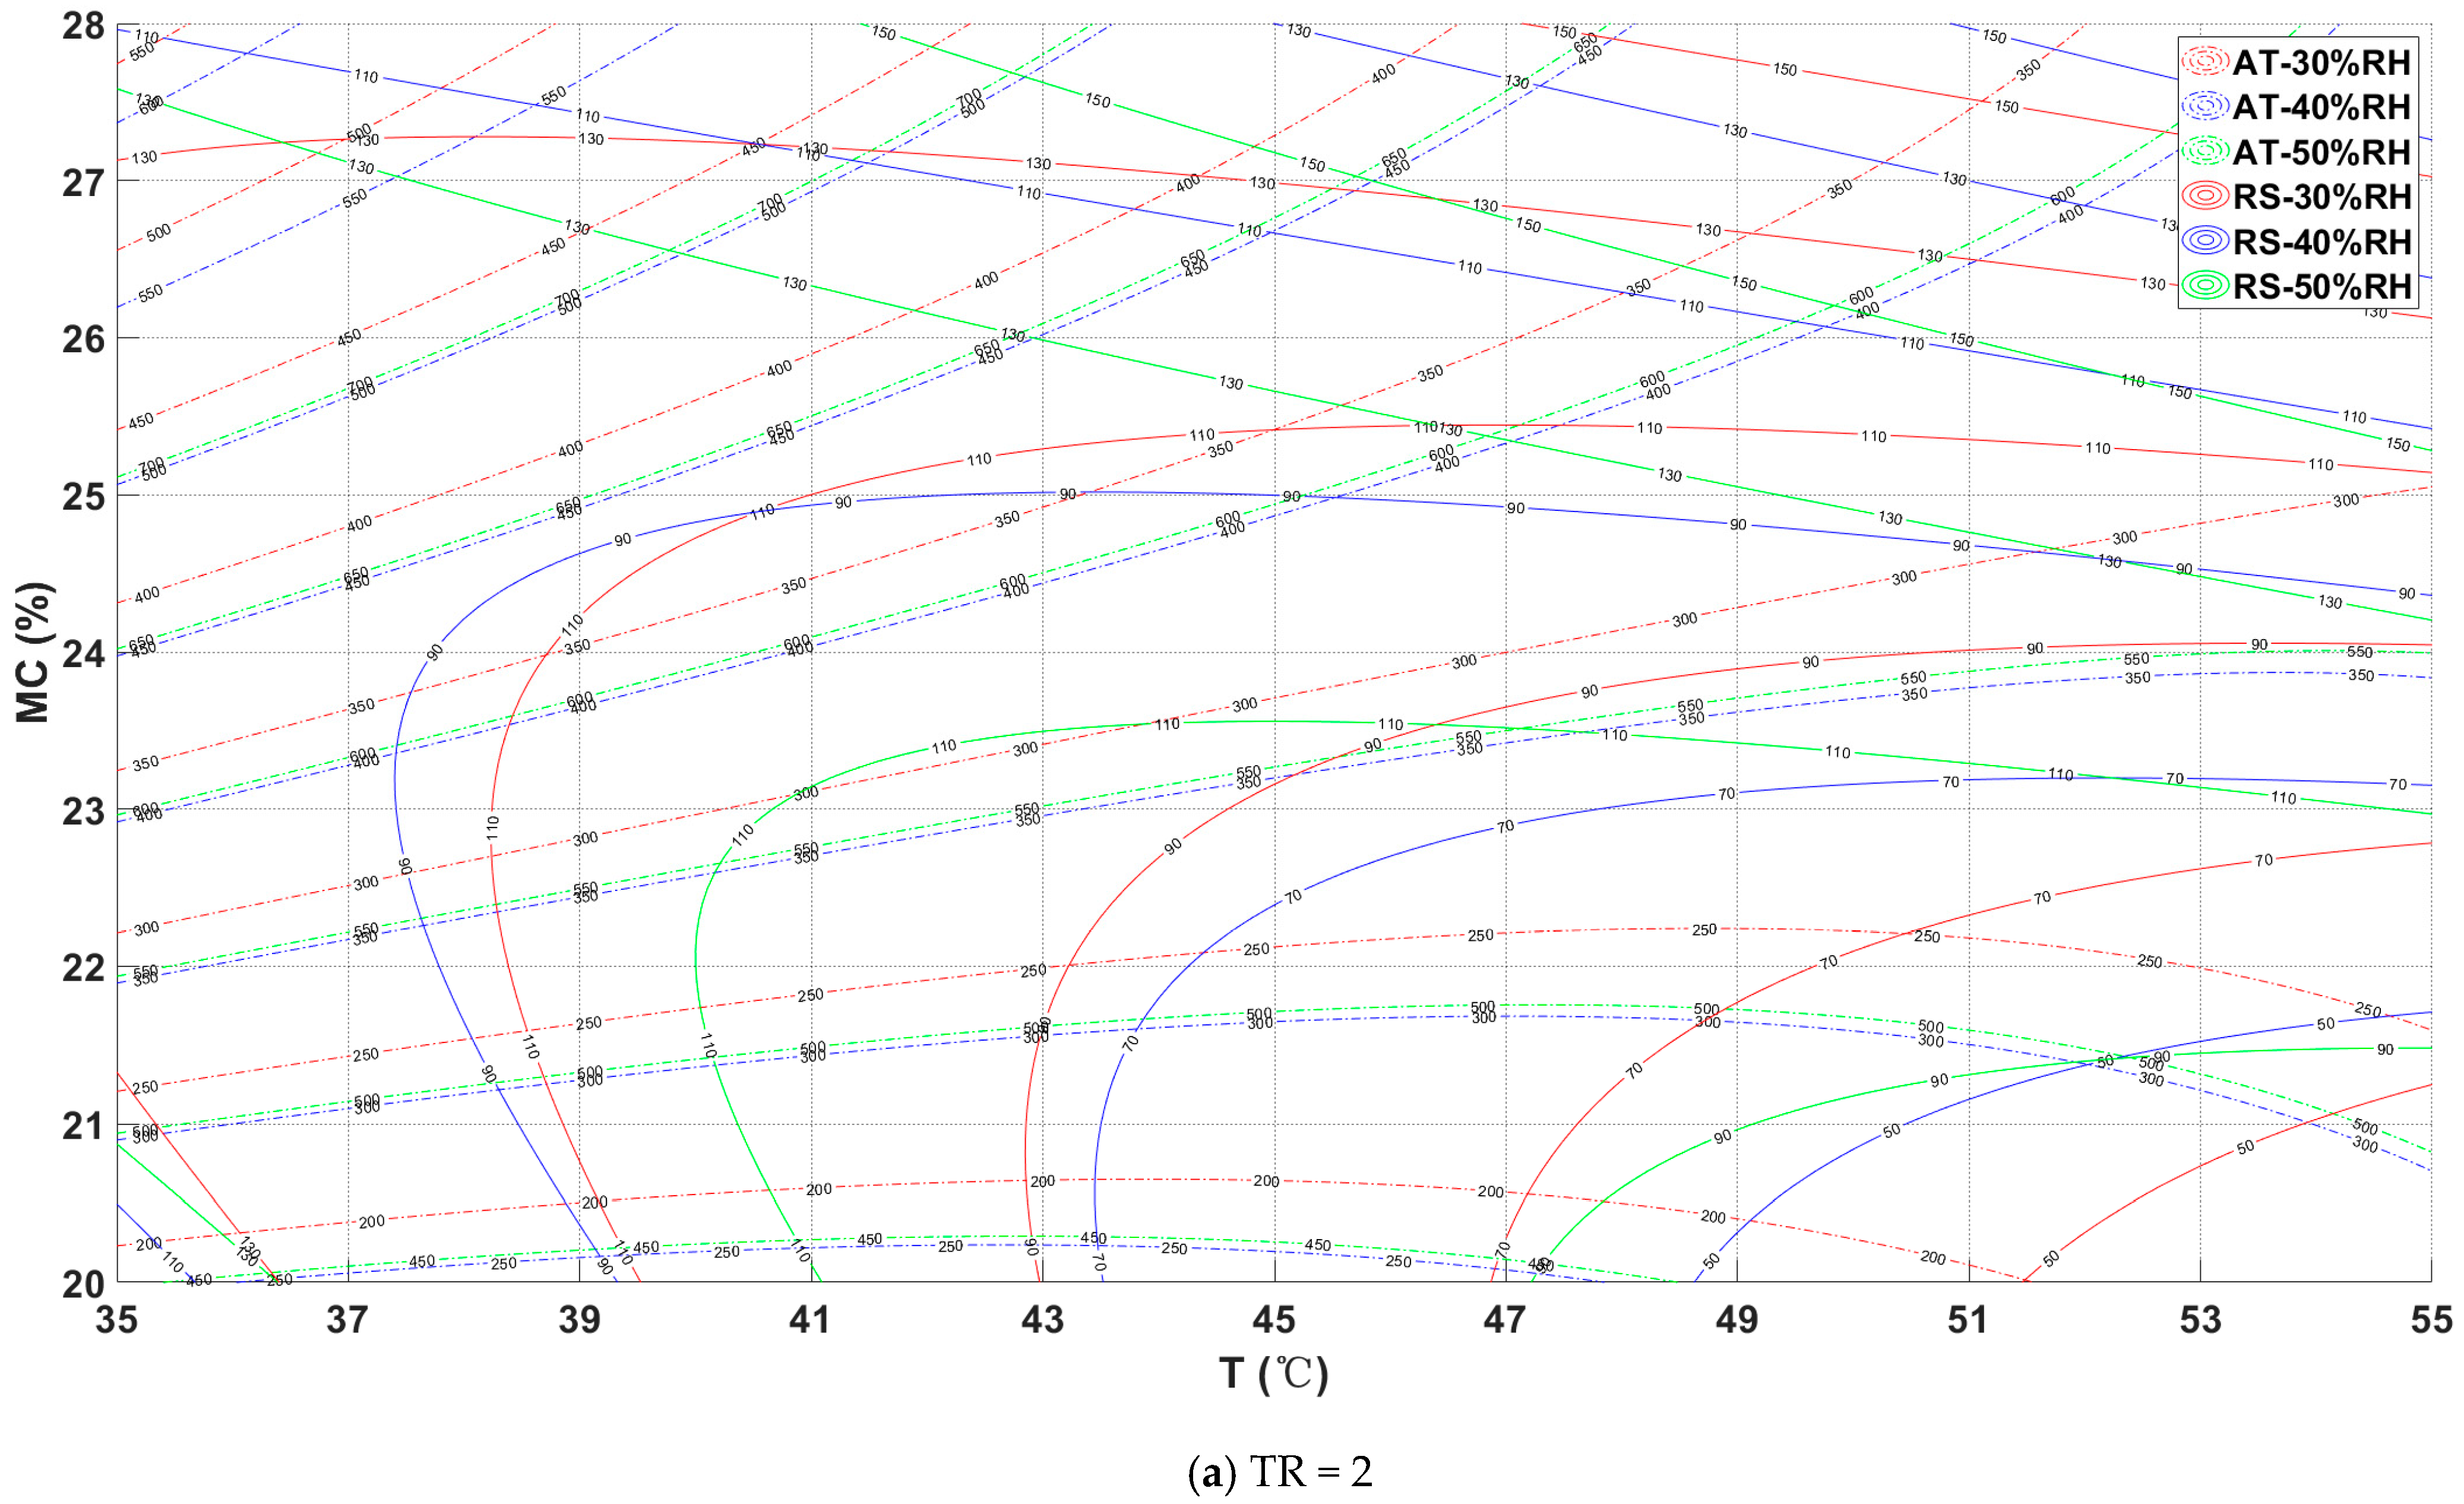
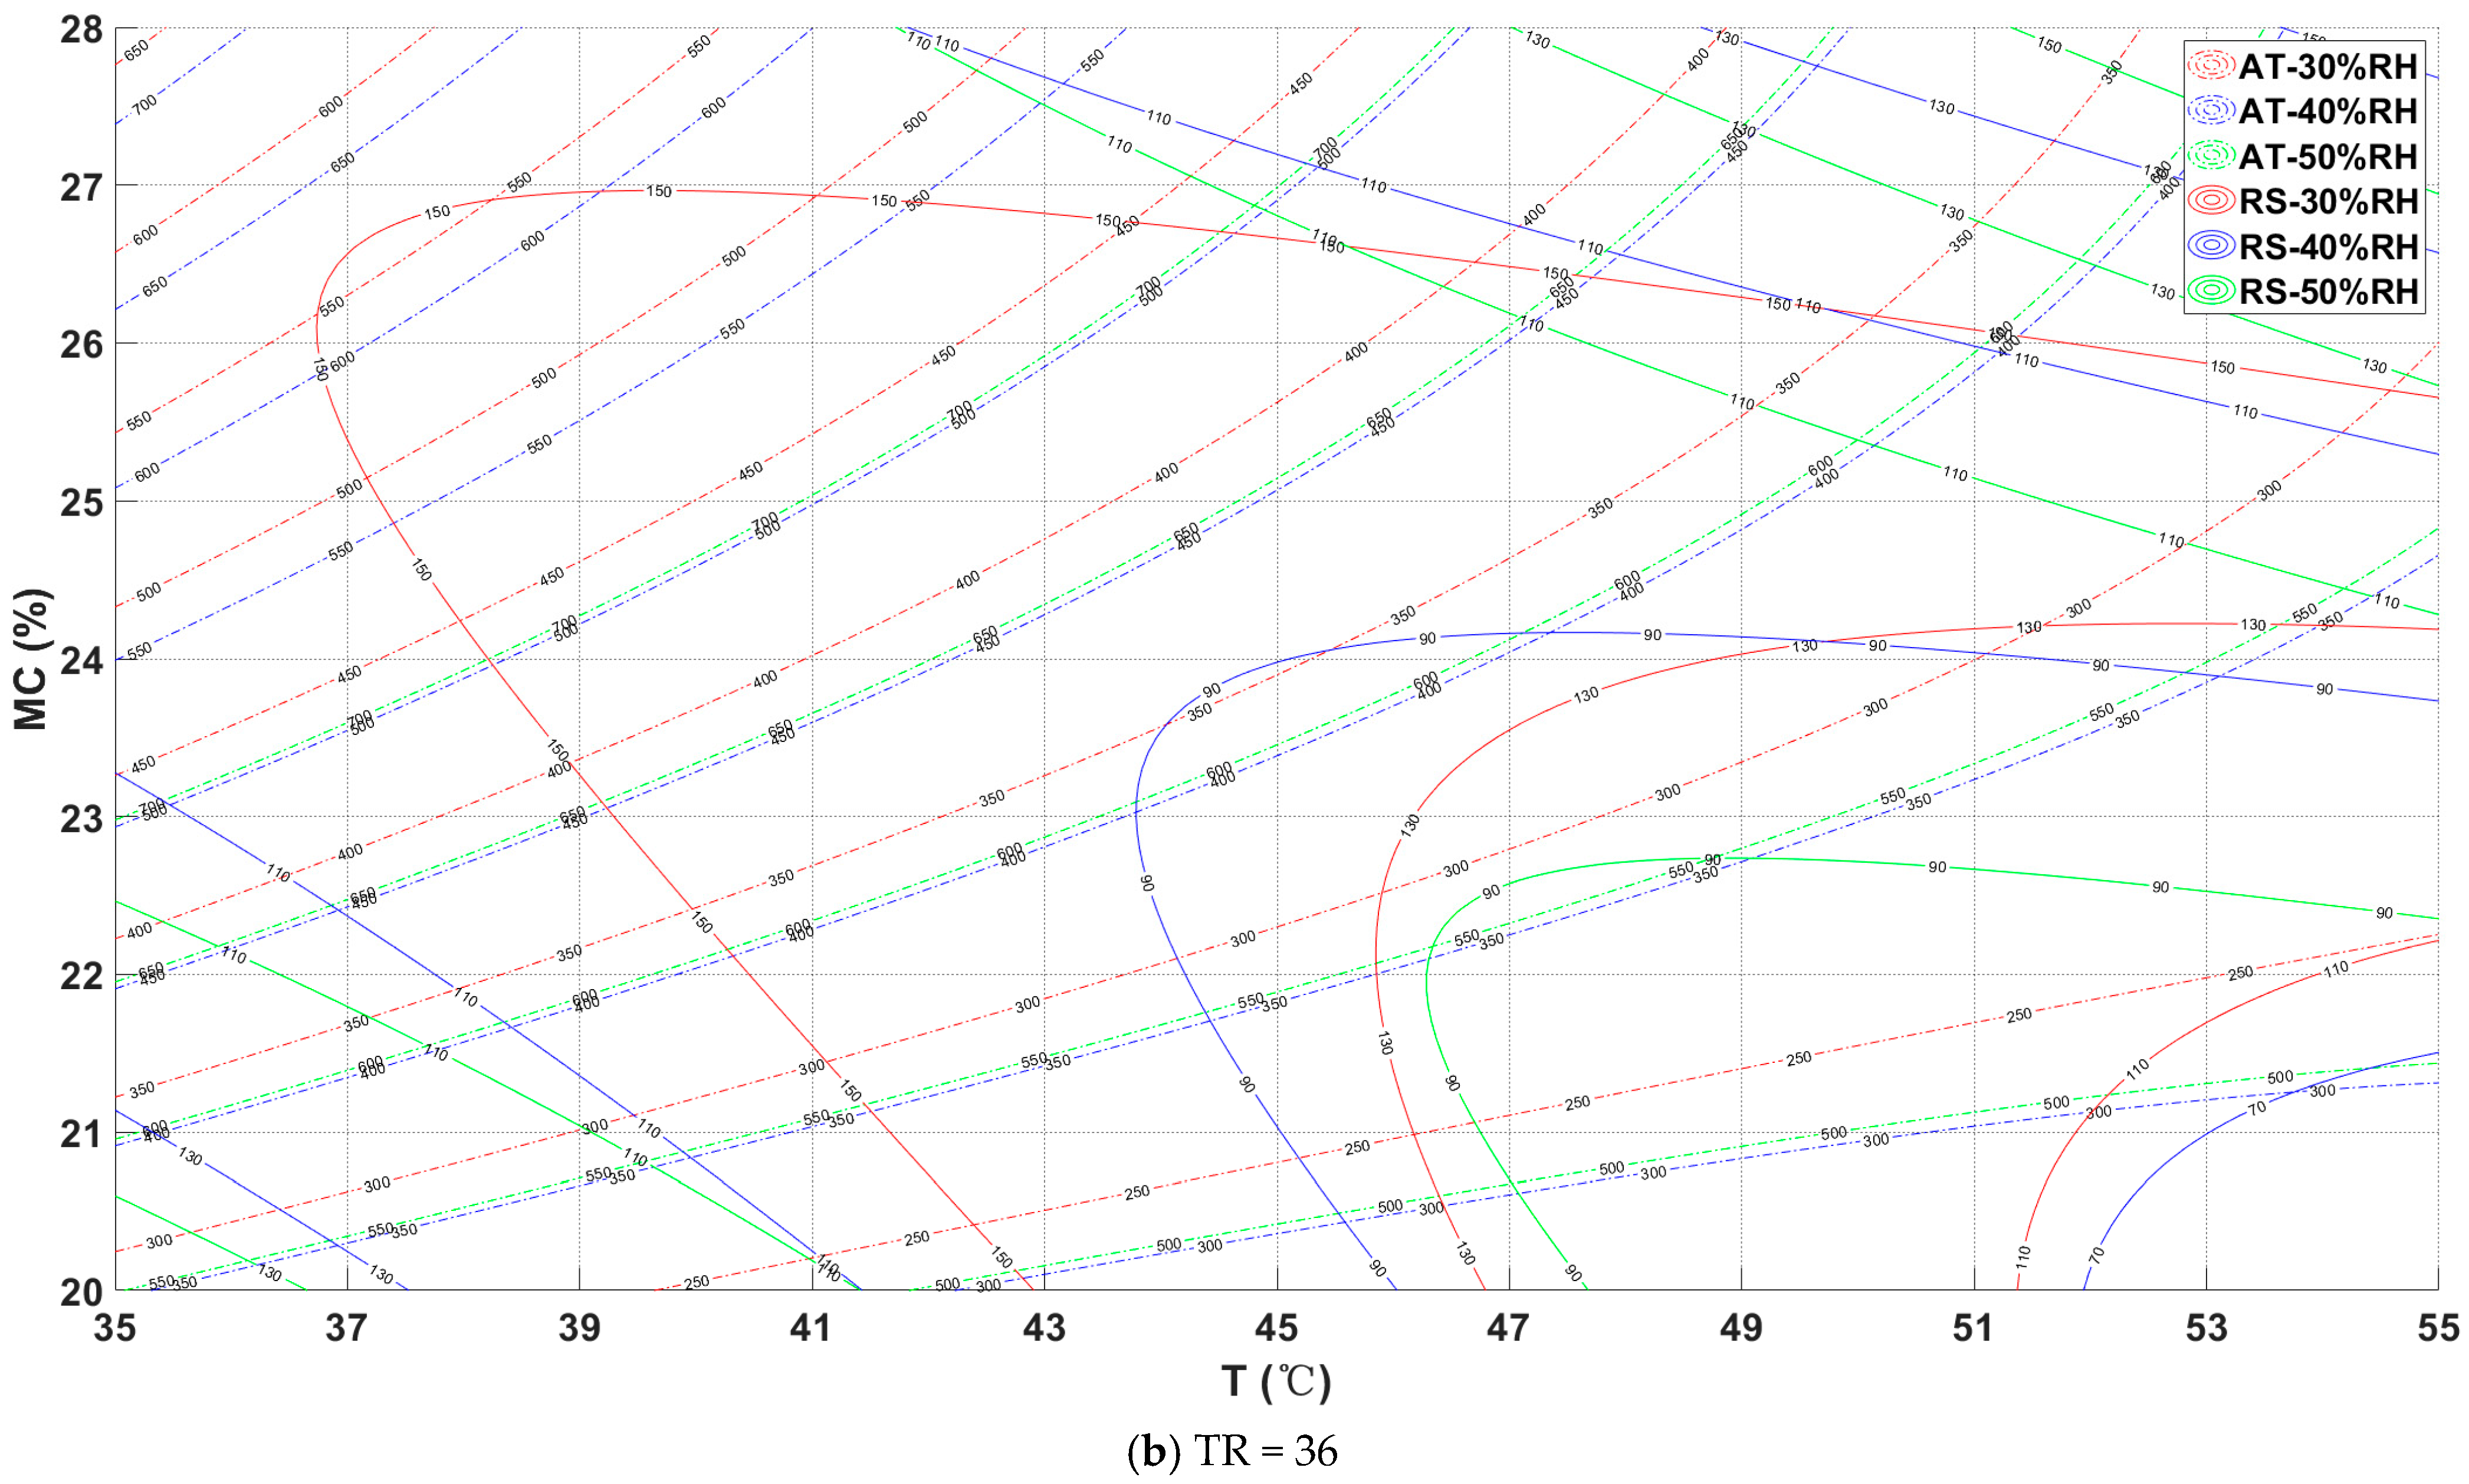
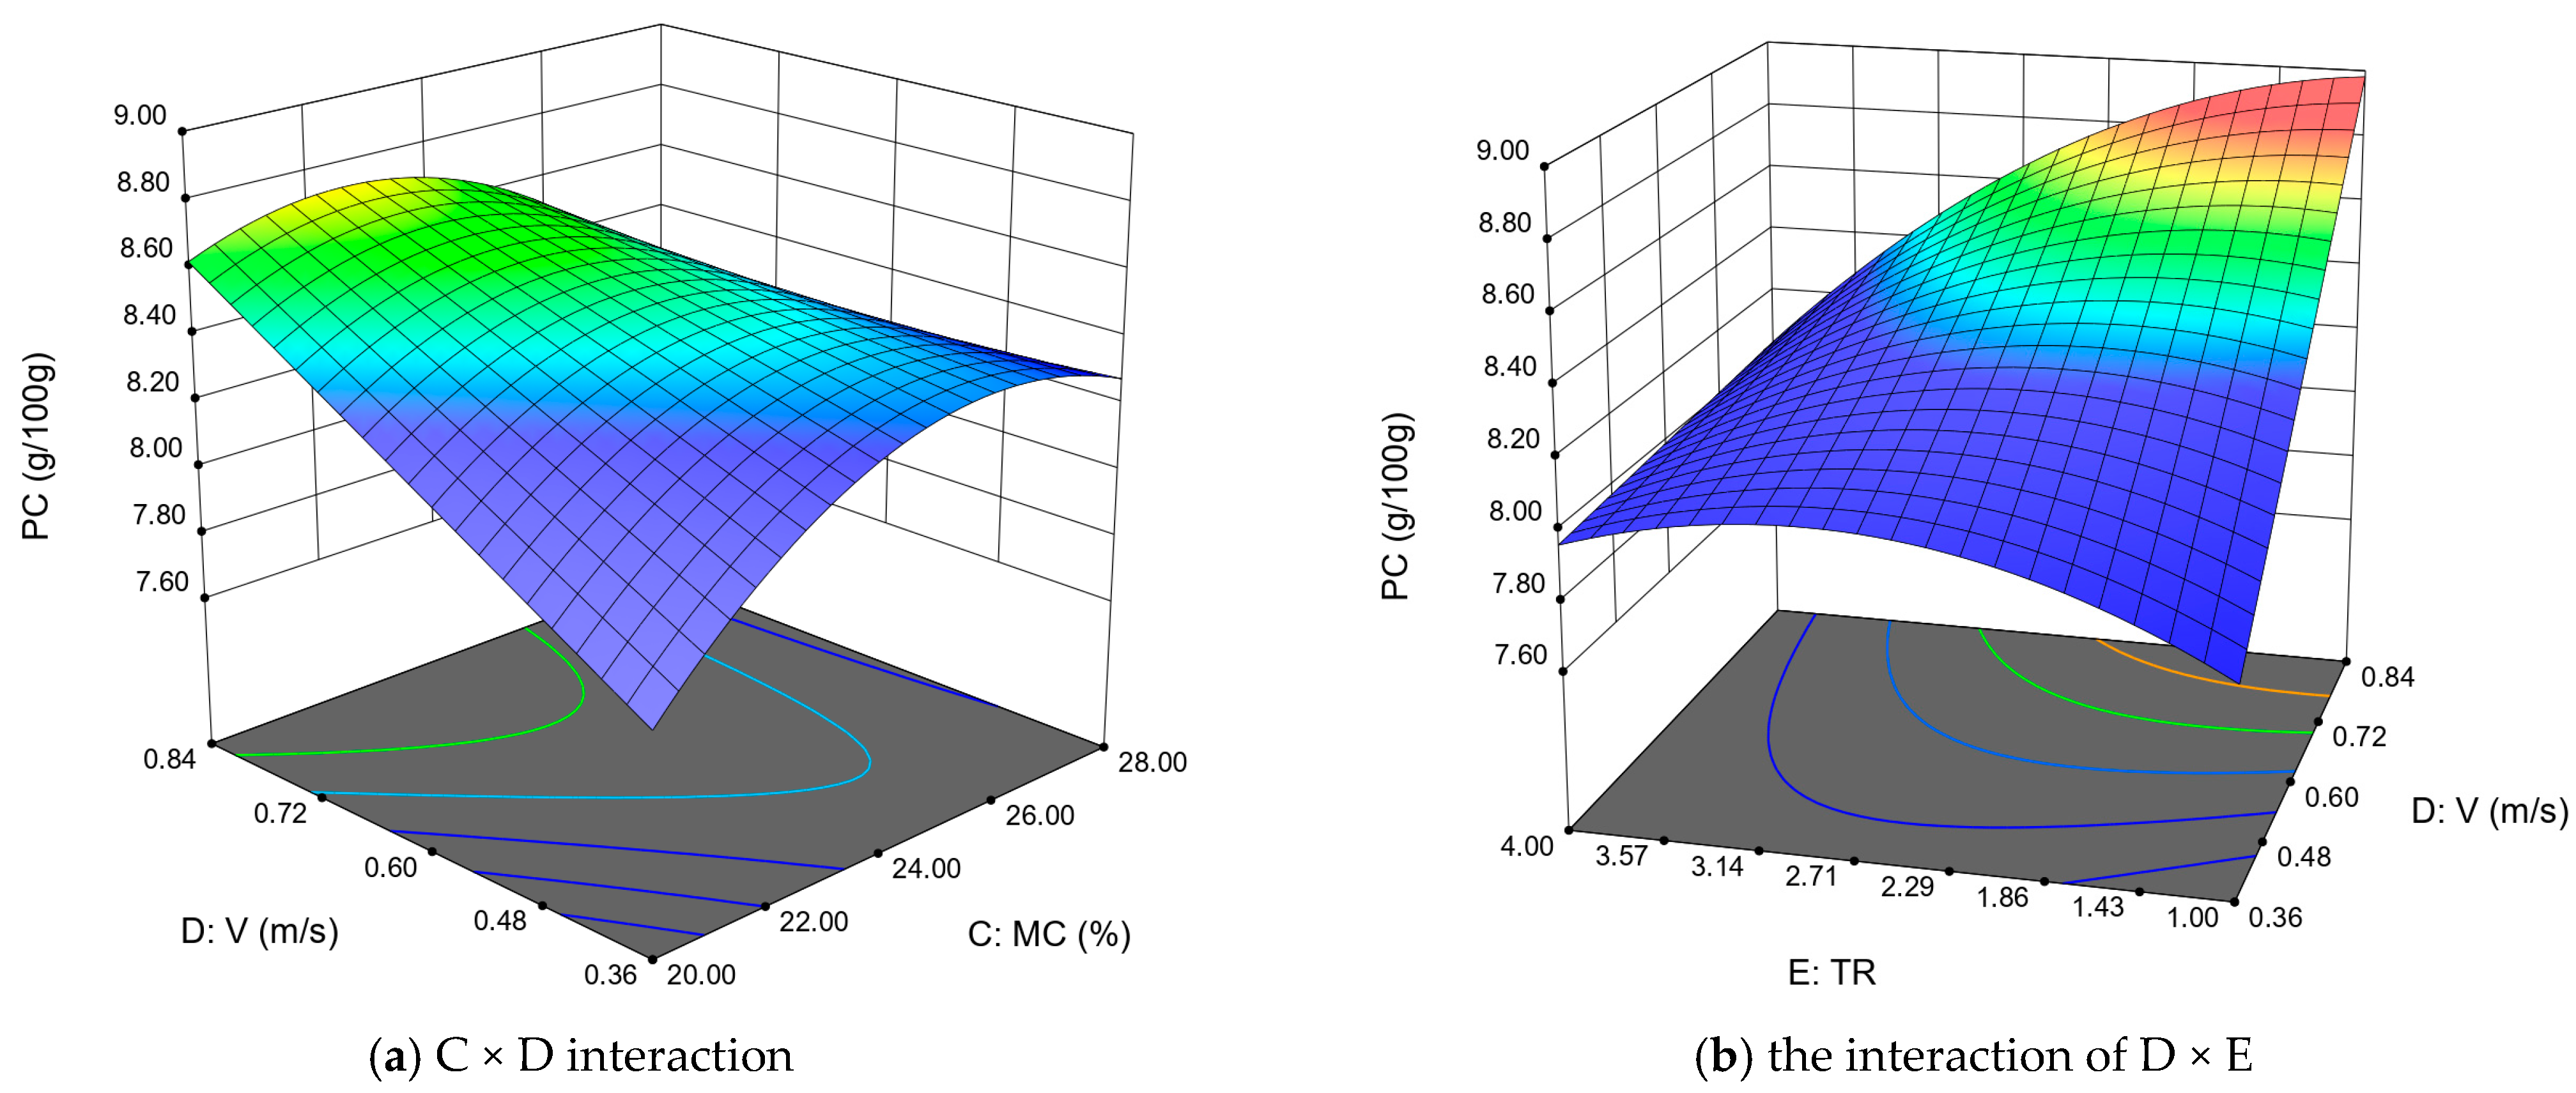
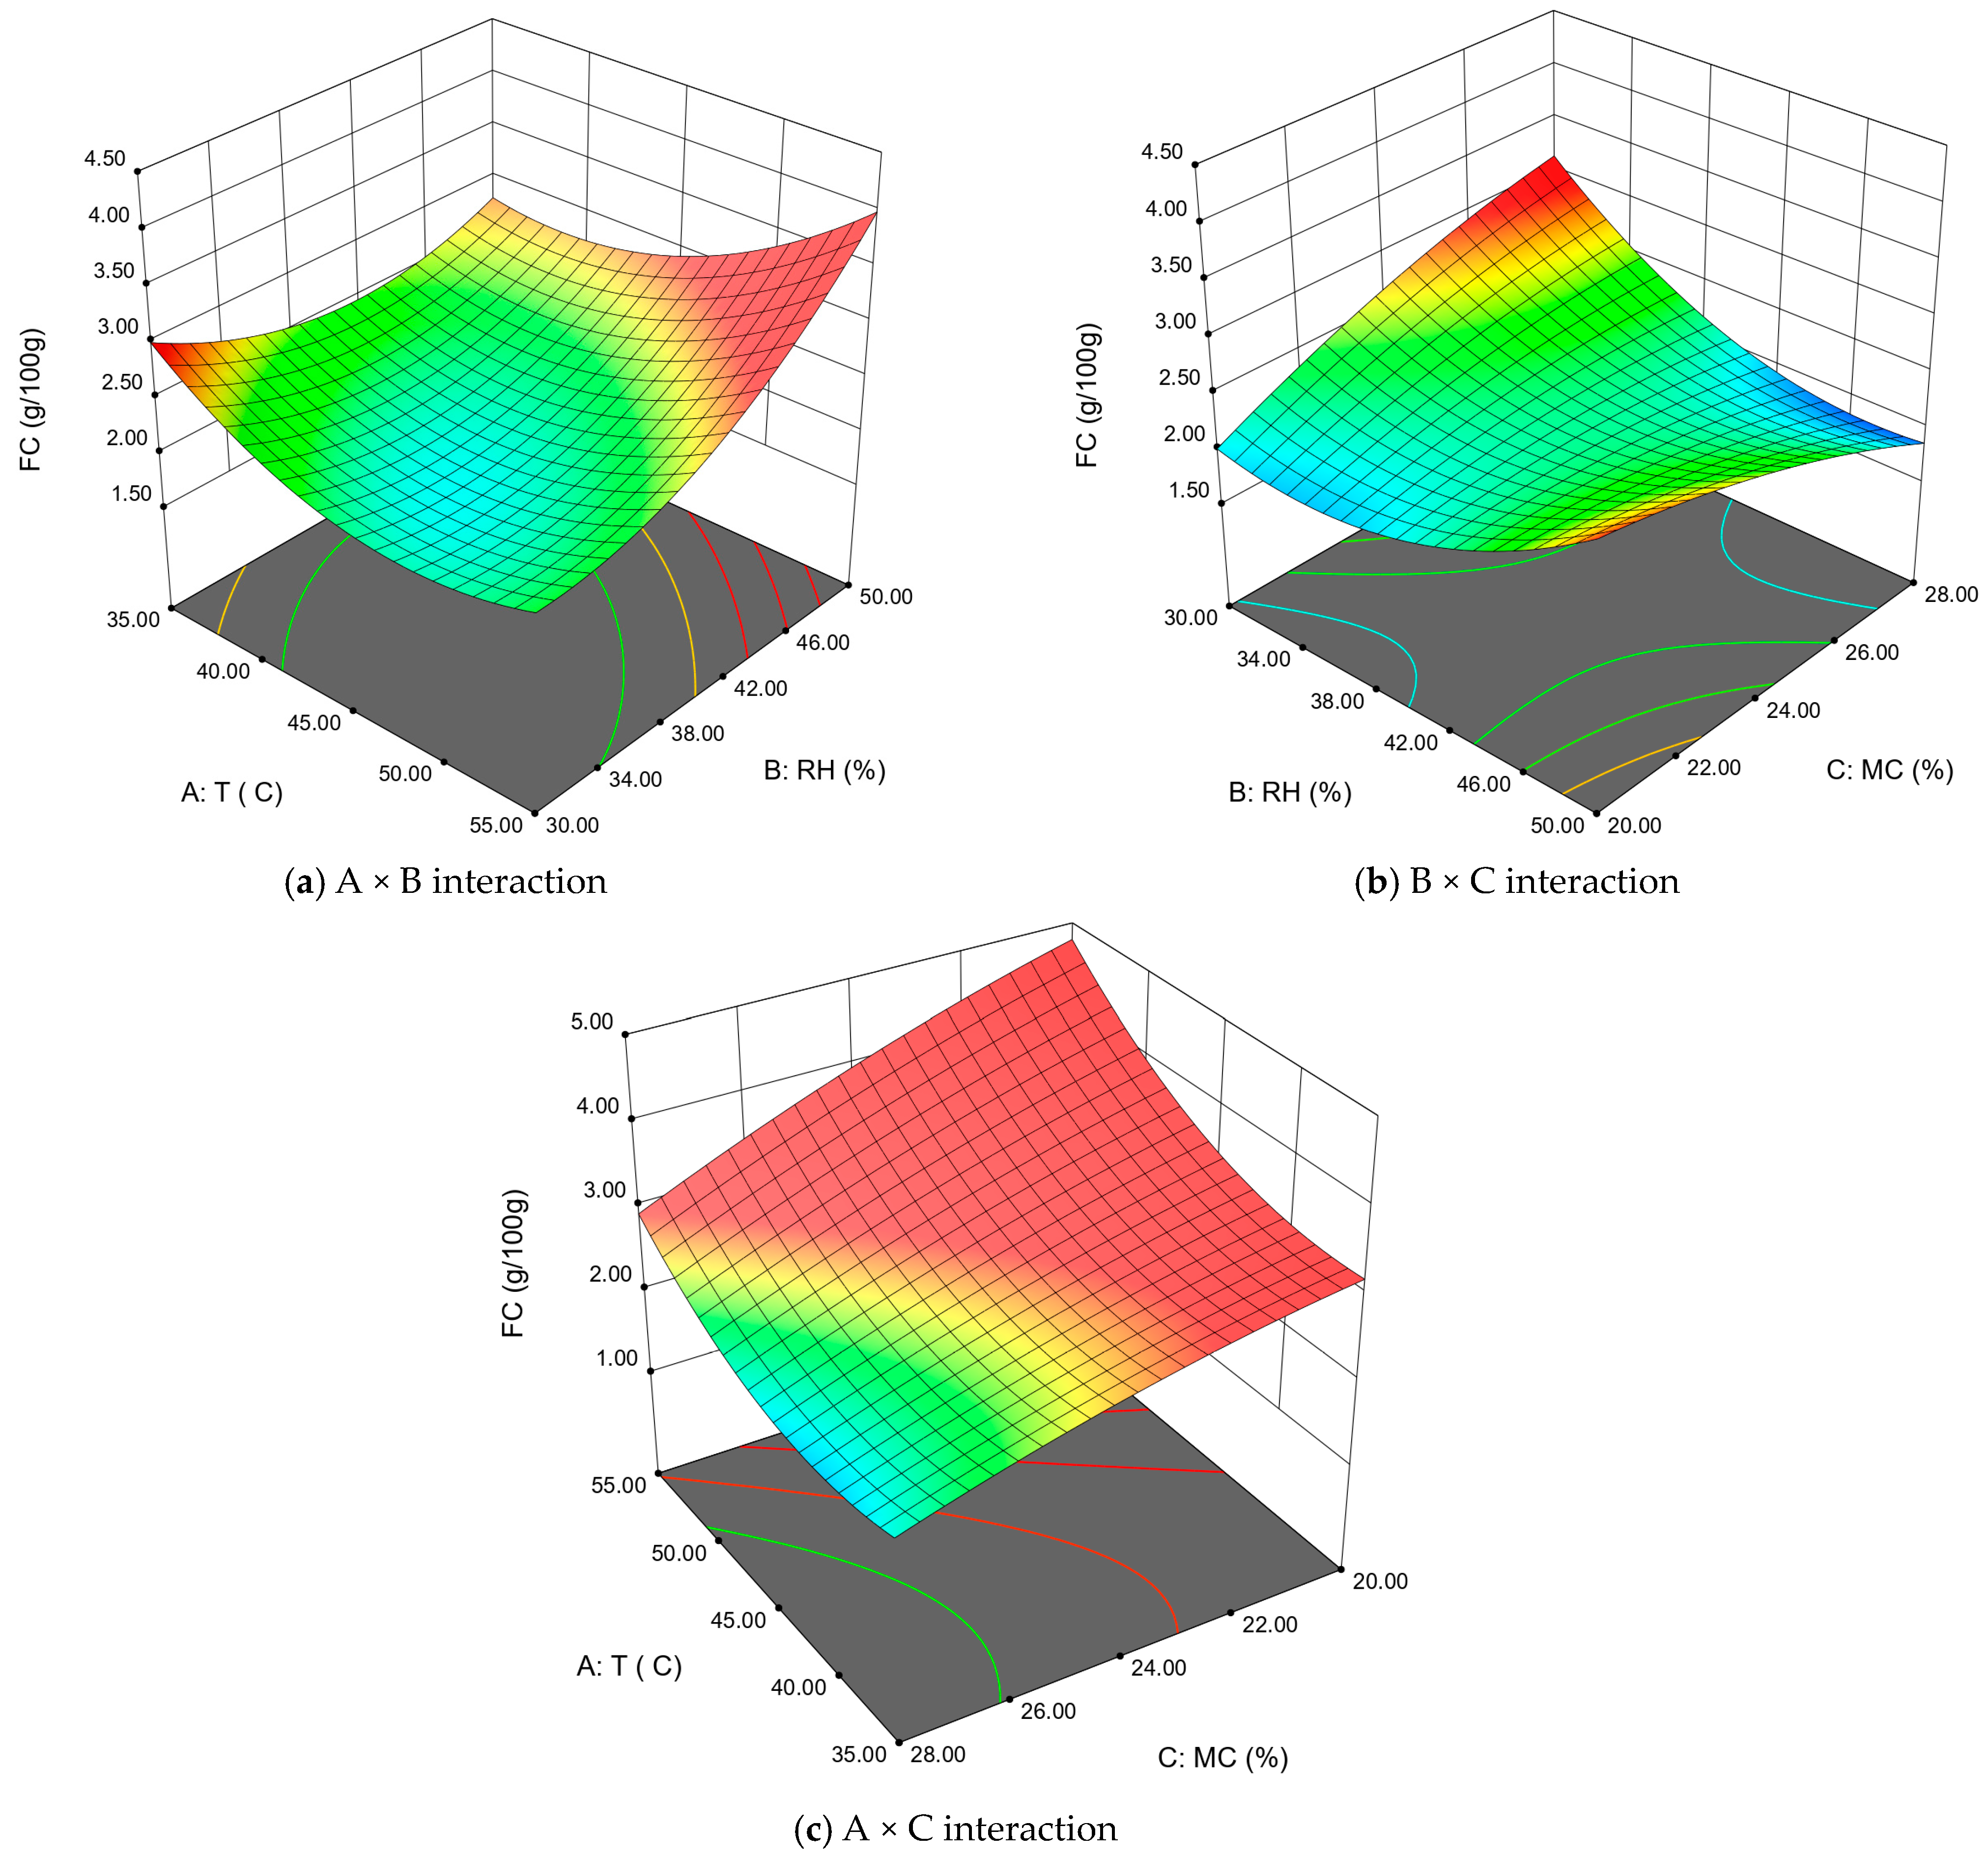
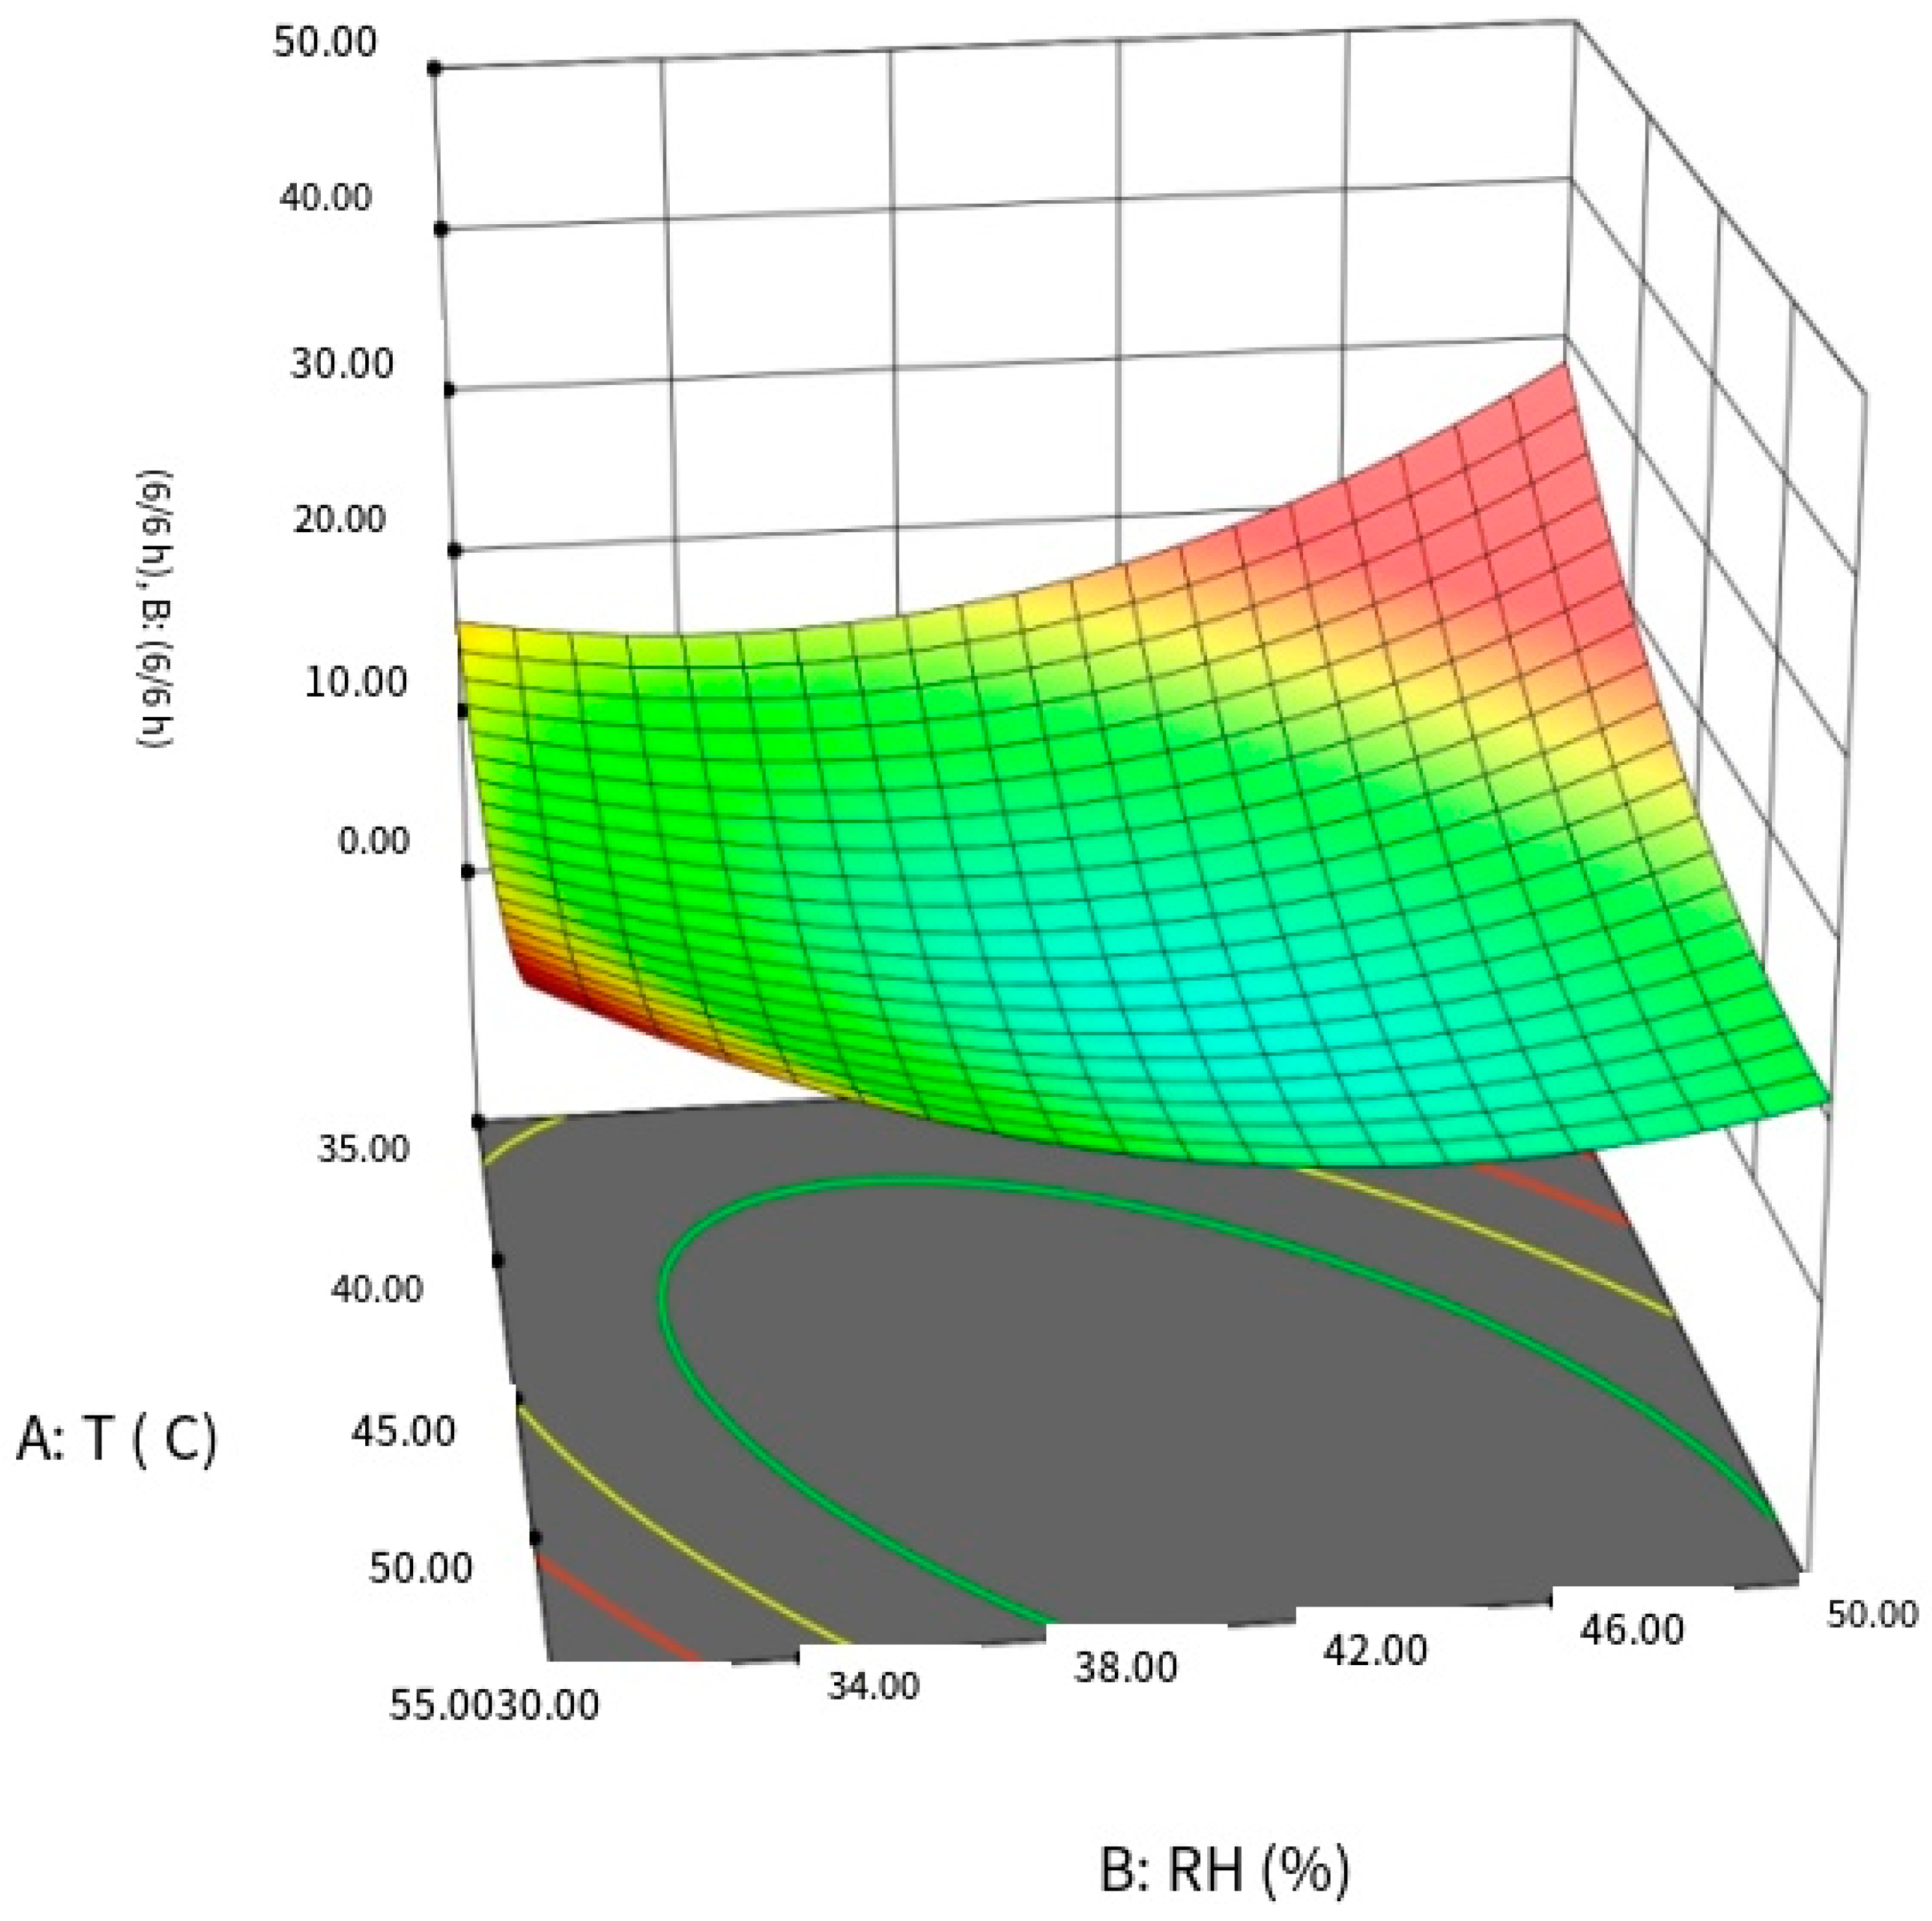
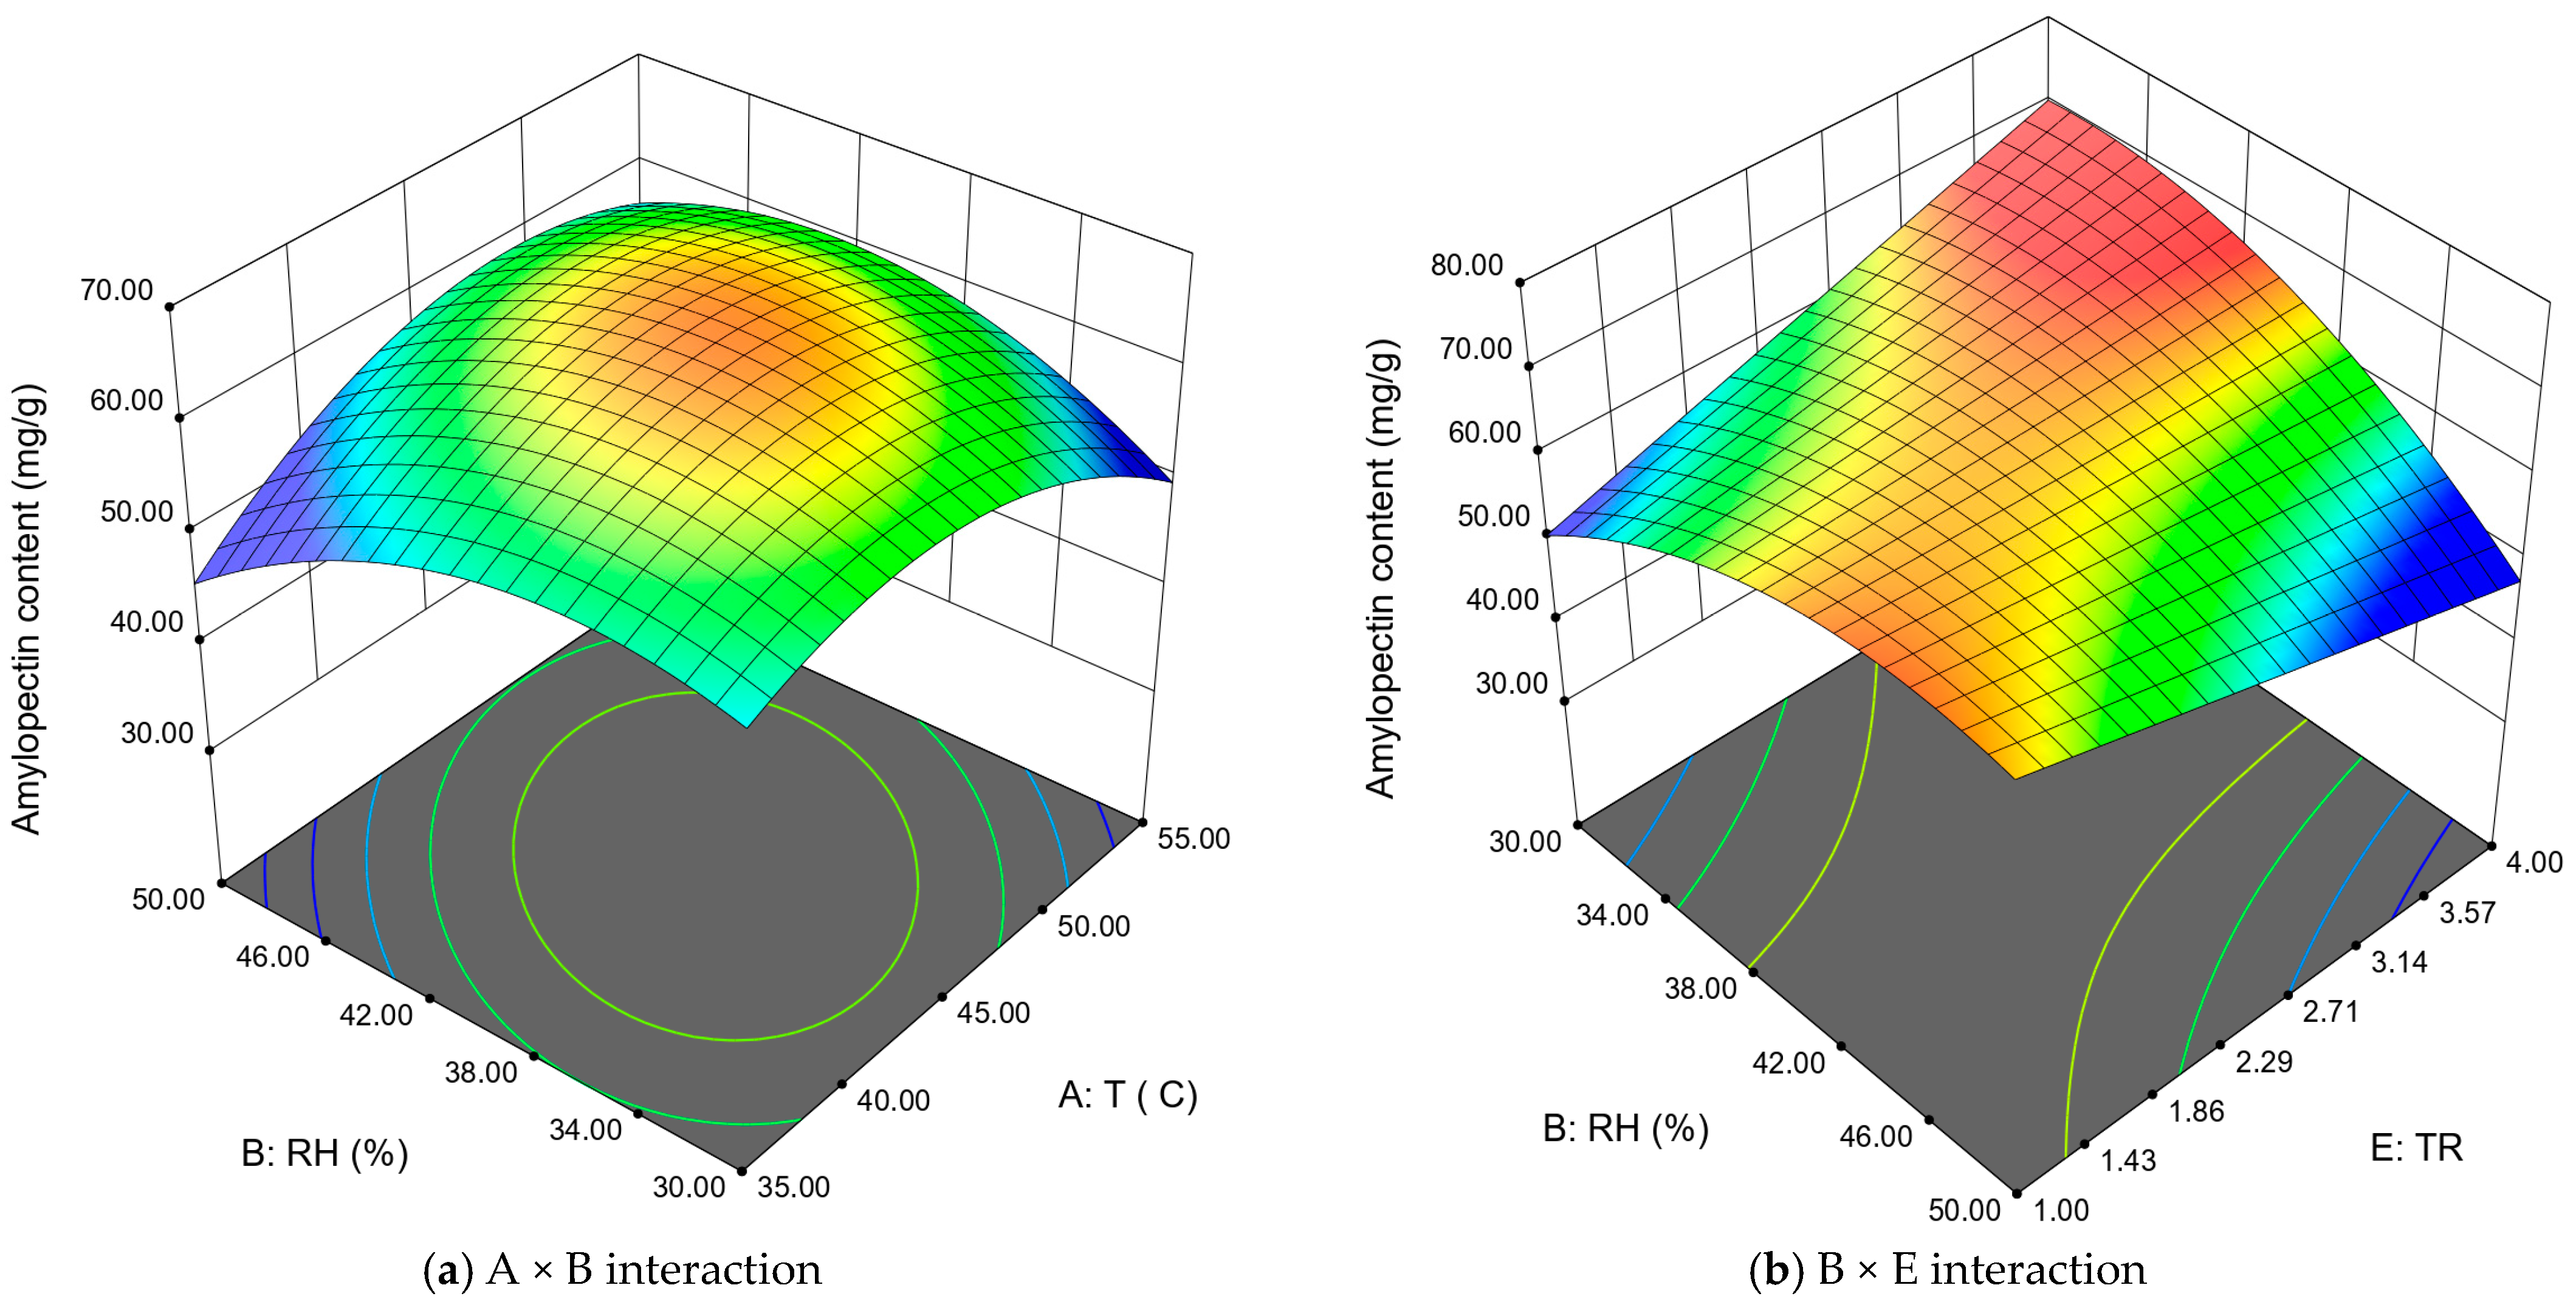
3.2. Response Surface Plot Analysis
3.3. Parameter Optimization and Model Validation
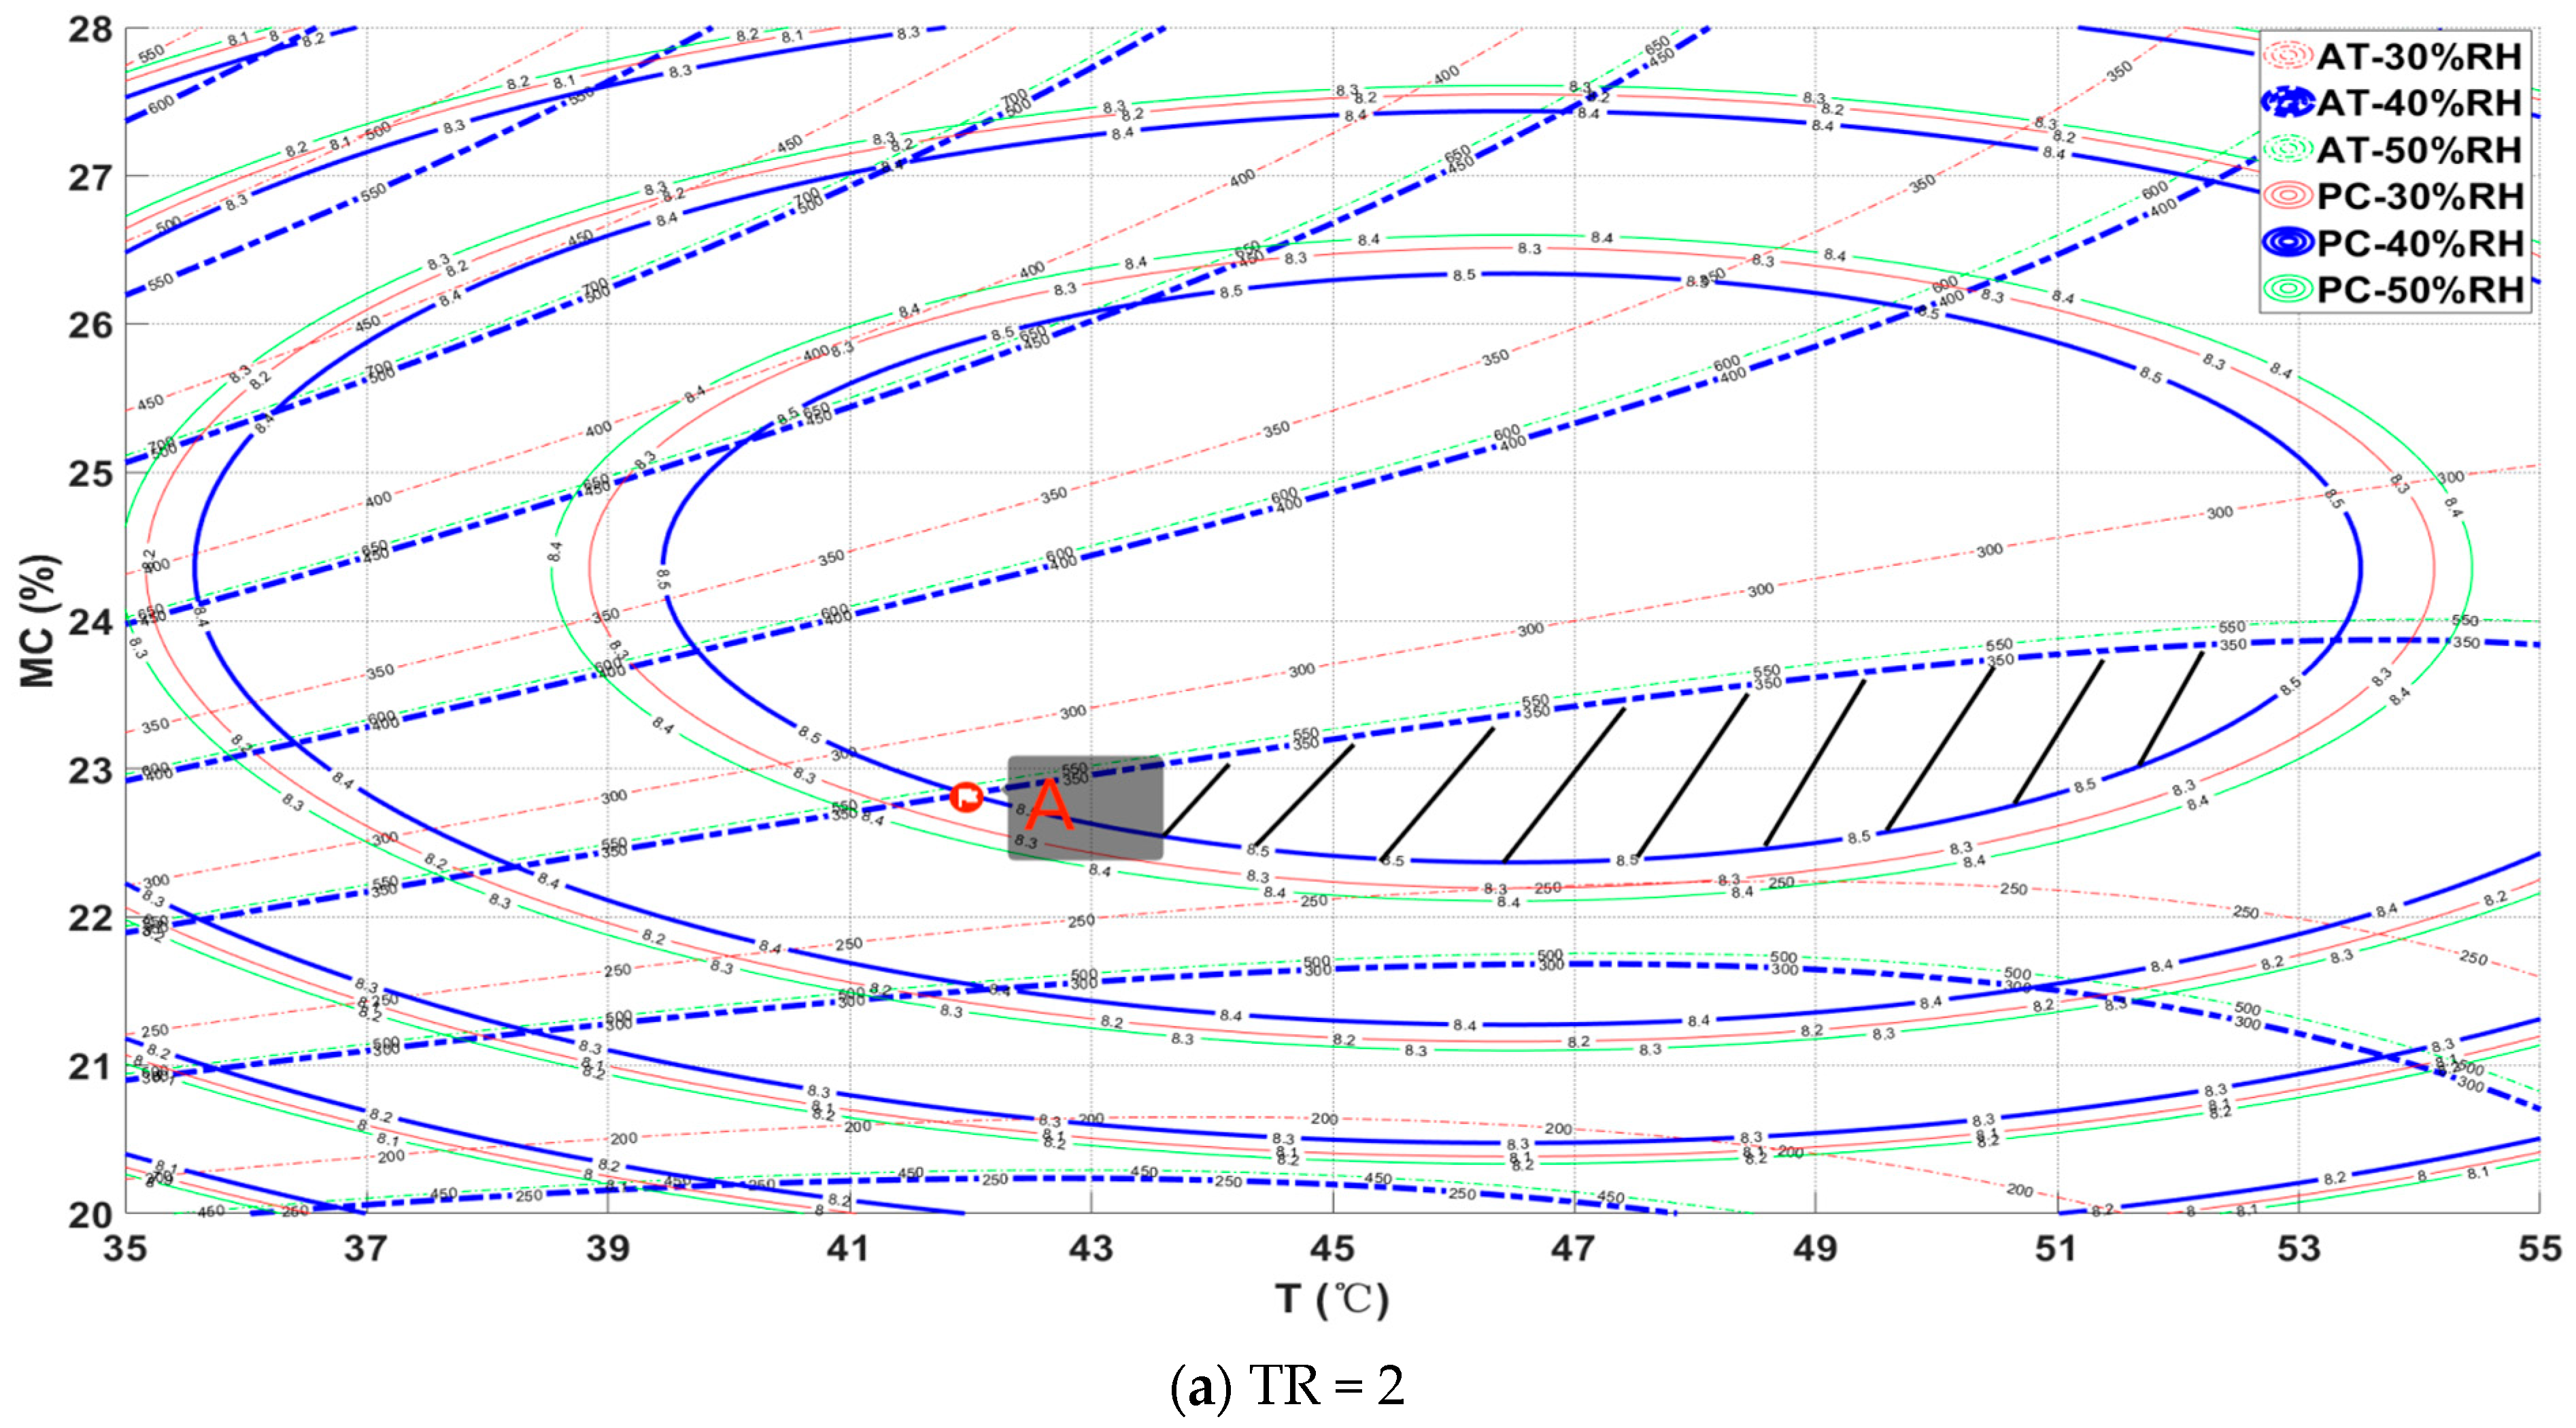
3.4. Process Reference Drawing
4. Conclusions
Author Contributions
Funding
Institutional Review Board Statement
Informed Consent Statement
Data Availability Statement
Acknowledgments
Conflicts of Interest
Appendix A
References
- Chung, H.-J.; Liu, Q.; Lee, L.; Wei, D. Relationship between the structure, physicochemical properties and in vitro digestibility of rice starches with different amylose contents. Food Hydrocoll. 2011, 25, 968–975. [Google Scholar] [CrossRef]
- Ibáñez, A.M.; Wood, D.F.; Yokoyama, W.H.; Park, I.; Tinoco, M.A.; Hudson, C.A.; McKenzie, K.S.; Shoemaker, C.F. Viscoelastic properties of waxy and nonwaxy rice flours, their fat and protein-free starch, and the microstructure of their cooked kernels. J. Agric. Food Chem. 2007, 55, 6761–6771. [Google Scholar] [CrossRef] [PubMed]
- Puncha-arnon, S.; Uttapap, D. Rice starch vs. rice flour: Differences in their properties when modified by heat–moisture treatment. Carbohydr. Polym. 2013, 91, 85–91. [Google Scholar] [CrossRef] [PubMed]
- Zhou, W.; Song, J.; Zhang, B.; Zhao, L.; Hu, Z.; Wang, K. The impacts of particle size on starch structural characteristics and oil-binding ability of rice flour subjected to dry heating treatment. Carbohydr. Polym. 2019, 223, 115053. [Google Scholar] [CrossRef]
- Siddiqui, S.A.; Ucak, İ.l.; Jain, S.; Elsheikh, W.; Ali Redha, A.; Kurt, A.; Toker, O.S. Impact of drying on techno-functional and nutritional properties of food proteins and carbohydrates-A comprehensive review. Dry. Technol. 2024, 42, 592–611. [Google Scholar] [CrossRef]
- Miraji, K.F.; Linnemann, A.R.; Fogliano, V.; Laswai, H.S.; Capuano, E. Dry-heat processing at different conditions impact the nutritional composition and in vitro starch and protein digestibility of immature rice-based products. Food Funct. 2021, 12, 7527–7545. [Google Scholar] [CrossRef]
- Müller, A.; Nunes, M.T.; Maldaner, V.; Coradi, P.C.; Moraes, R.S.D.; Martens, S.; Leal, A.F.; Pereira, V.F.; Marin, C.K. Rice Drying, Storage and Processing: Effects of Post-Harvest Operations on Grain Quality. Rice Sci. 2022, 29, 16–30. [Google Scholar] [CrossRef]
- Li, J.; Xiang, G.; Lin, Q.; Zhang, Y.; Ding, Y.; Guo, X.; Pan, Q.; Liu, Q.; Yang, Y.H.; Han, W. Insight into the Heat-Moisture Treatment Changed the Binding of Starch, Protein and Lipid in Rice Flour to Affect its Hierarchical Structure and Physicochemical Properties. SSRN Electron. J. 2022; preprint. [Google Scholar]
- Ragaee, S.; Guzar, I.; Dhull, N.; Seetharaman, K. Effects of fiber addition on antioxidant capacity and nutritional quality of wheat bread. LWT—Food Sci. Technol. 2011, 44, 2147–2153. [Google Scholar] [CrossRef]
- Tongbin, C.; Qifei, H.; Ding, G.; Zechun, H.; Yuqi, Z.; Yanxia, L. Accumulated temperature as an indicator to predict the stabilizing process in sewage sludge composting. Acta Ecol. Sin. 2002, 22, 911–915. [Google Scholar]
- Dong, J.; Liu, J.; Tao, F.; Xu, X.; Wang, J. Spatio-temporal changes in annual accumulated temperature in China and the effects on cropping systems, 1980s to 2000. Clim. Res. 2009, 40, 37–48. [Google Scholar] [CrossRef]
- Cutforth, H.; Shaykewich, C. Relationship of development rates of corn from planting to silking to air and soil temperature and to accumulated thermal units in a prairie environment. Can. J. Plant Sci. 1989, 69, 121–132. [Google Scholar] [CrossRef]
- Qin, X.; Li, Y.; Han, Y.; Hu, Y.; Li, Y.; Wen, X.; Liao, Y.; Siddique, K.H. Ridge-furrow mulching with black plastic film improves maize yield more than white plastic film in dry areas with adequate accumulated temperature. Agric. For. Meteorol. 2018, 262, 206–214. [Google Scholar] [CrossRef]
- Wu, Y.; Wu, W.; Han, F.; Zhang, Y.; Xu, Y. Intelligent monitoring and control of grain continuous drying process based on multi-parameter corn accumulated temperature model. In Proceedings of the 2017 International Conference on Smart Grid and Electrical Automation (ICSGEA), Changsha, China, 27–28 May 2017; pp. 77–80. [Google Scholar]
- Hu, X.W.; Fan, Y.; Baskin, C.C.; Baskin, J.M.; Wang, Y.R. Comparison of the effects of temperature and water potential on seed germination of Fabaceae species from desert and subalpine grassland. Am. J. Bot. 2015, 102, 649–660. [Google Scholar] [CrossRef]
- Sun, L.; Li-Li, X.; Yuan-Peng, D.; Zhai, H. The relationship of effective accumulated temperature and bud burst in grapevine. Plant Physiol. J. 2016, 52, 1263–1270. [Google Scholar]
- Zhao, D.; Wu, S. Spatial and temporal variability of key bio-temperature indicators on the Qinghai-Tibetan Plateau for the period 1961-2013. Int. J. Climatol. 2016, 36, 2083–2092. [Google Scholar] [CrossRef]
- Jin, Y.; Wong, K.W.; Wu, Z.; Qi, D.; Wang, R.; Han, F.; Wu, W. Relationship between accumulated temperature and quality of paddy. Int. J. Food Prop. 2019, 22, 19–33. [Google Scholar] [CrossRef]
- Li, D.X.; Kang, Z.K.; Wang, J.Y.; Wang, H.W.; Dong, J.F.; Liang, S.L. Threshold temperature and effective accumulated temperature of peach fruit borer, Carposina sasakii. Chin. Bull. Entomol. 2010, 47, 923–926. [Google Scholar]
- Jin, Y.; Yin, J.; Xie, H.; Zhang, Z. Reconstruction of rice drying model and analysis of tempering characteristics based on drying accumulated temperature. Appl. Sci. 2021, 11, 11113. [Google Scholar] [CrossRef]
- Jin, Y.; Yin, J.; Xie, H.; Zhang, Z. Investigation of a Precise Control Scheme for Rice Quality. Appl. Sci. 2023, 13, 7532. [Google Scholar] [CrossRef]
- Li, J.; Yi, X.; Jin, Y. Study of the Targeted Regulation of Rice Drying Characteristics and Quality. Appl. Sci. 2024, 14, 3587. [Google Scholar] [CrossRef]
- Chen, J.; Wu, W.; Cheng, R.; Jin, Y.; Liu, Z. Optimization of hot air drying process of corn using genetic algorithm and response surface methodology. Int. J. Food Prop. 2020, 23, 753–764. [Google Scholar] [CrossRef]
- Liu, Z.; Xu, Y.; Han, F.; Zhang, Y.; Wang, G.; Wu, Z.; Wu, W. Control method for continuous grain drying based on equivalent accumulated temperature mechanism and artificial intelligence. Foods 2022, 11, 834. [Google Scholar] [CrossRef] [PubMed]
- Bertotto, M.M.; Gastón, A.; Sánchez Sarmiento, G.; Gove, B. Effect of drying conditions on the quality of IRGA 424 rice. J. Sci. Food Agric. 2019, 99, 1651–1659. [Google Scholar] [CrossRef] [PubMed]
- Wu, W.; Jin, Y.; Zhang, Y.; Han, F.; Xu, Y.; Chen, L.; Qin, X.; Wu, Y.; Liu, E.; Wang, T.; et al. The Utility Model Relates to a Vertical Moisture Heat Controlled Speed Thin Layer Drying Test Bed. CN Patent CN105486073B, 13 April 2016. [Google Scholar]
- Yi, J. Modeling and Intelligent Control of Grain Drying Process Based on Equivalent Accumulated Temperature. Ph.D. Thesis, Jilin University, Changchun, China, 2019. [Google Scholar]
- GB/T 24897-2010; Determination of Crude Protein Content in Rice. China Standardization Administration: Beijing, China, 2010.
- GB 5009.6-2016; Determination of Fat in Food of National Standard for Food Safety. Standardization Administration of China: Beijing, China, 2016.
- GB/T 15683-2008; Determination of Amylose Content in Rice. Standardization Administration of China: Beijing, China, 2008.
- DB32/T 2265-2012; Determination of Amylose and Amylopectin Content in Fresh Corn. Standardization Administration of China: Beijing, China, 2012.
- GB/T21015-2007; Technical Specifications for Rice Drying. Standardization Administration of China: Beijing, China, 2007.
- Xianzhe, Z.; Xuedu, Z. Study on determination of taste value and drying quality of rice. Trans. Agric. Mach. 2000, 31, 54–56. [Google Scholar]
- Nanvakenari, S.; Movagharnejad, K.; Latifi, A. Multi-objective optimization of hybrid microwave-fluidized bed drying conditions of rice using response surface methodology. J. Stored Prod. Res. 2022, 97, 101956. [Google Scholar] [CrossRef]
- Singh, T.P.; Sogi, D.S. Comparative study of structural and functional characterization of bran protein concentrates from superfine, fine and coarse rice cultivars. Int. J. Biol. Macromol. 2018, 111, 281–288. [Google Scholar] [CrossRef]
- Huiping, Y.; Lu, L.; Wei, S. Study on the relationship between fatty acid value and odor of japonica rice under different storage conditions. Chin. J. Grain Oil 2013, 28, 85–89. [Google Scholar]
- da Silva Timm, N.; Coradi, P.C.; Ferreira, C.D.; Ramos, A.H.; Schwab, M.P.; de Oliveira, M. Effects of drying temperature of corn from the center and extremities of the corncob on drying parameters, protein and starch properties, and carotenoid profile. Food Res. Int. 2023, 163, 112267. [Google Scholar] [CrossRef]
- Hassan, A.B.; Pawelzik, E.; von Hoersten, D. Effect of microwave heating on the physiochemical characteristics, colour and pasting properties of corn (Zea mays L.) grain. LWT—Food Sci. Technol. 2021, 138, 110703. [Google Scholar] [CrossRef]
- Qian, J.-Y.; Gu, Y.-P.; Jiang, W.; Chen, W. Inactivating effect of pulsed electric field on lipase in brown rice. Innov. Food Sci. Emerg. Technol. 2014, 22, 89–94. [Google Scholar] [CrossRef]
- Zhang, C.; Zhao, X.-D.; Li, Q.; Wu, C.-S.; Zhang, L.; Qian, J.-Y. Water absorption characteristics of wheat and inactivating effect of pulsed electric field on lipase. J. Yangzhou Univ. Agric. Life Sci. Ed. 2020, 41, 80–86. [Google Scholar]
- Aruva, S.; Dutta, S.; Moses, J.A. Empirical characterization of hydration behavior of Indian paddy varieties by physicochemical characterization and kinetic studies. J. Food Sci. 2020, 85, 3303–3312. [Google Scholar] [CrossRef] [PubMed]
- Li, C.Y.; Zhang, R.Q.; Fu, K.Y.; Li, C.; Li, C. Effects of high temperature on starch morphology and the expression of genes related to starch biosynthesis and degradation. J. Cereal Sci. 2017, 73, 25–32. [Google Scholar] [CrossRef]
- GB/T 19266; Geographical Indication Product Wuchang Rice. Standardization Administration of China: Beijing, China, 2008.
- Wei, C.; Qin, F.; Zhou, W.; Xu, B.; Chen, C.; Chen, Y.; Wang, Y.; Gu, M.; Liu, Q. Comparison of the crystalline properties and structural changes of starches from high-amylose transgenic rice and its wild type during heating. Food Chem. 2011, 128, 645–652. [Google Scholar] [CrossRef]
- Li, H.; Prakash, S.; Nicholson, T.M.; Fitzgerald, M.A.; Gilbert, R.G. The importance of amylose and amylopectin fine structure for textural properties of cooked rice grains. Food Chem. 2016, 196, 702–711. [Google Scholar] [CrossRef]
- Nanvakenari, S.; Movagharnejad, K.; Latifi, A. Modelling and experimental analysis of rice drying in new fluidized bed assisted hybrid infrared-microwave dryer. Food Res. Int. 2022, 159, 111617. [Google Scholar] [CrossRef]
- Liu, Q.; Tao, Y.; Cheng, S.; Zhou, L.; Tian, J.; Xing, Z.; Liu, G.; Wei, H.; Zhang, H. Relating amylose and protein contents to eating quality in 105 varieties of Japonica rice. Cereal Chem. 2020, 97, 1303–1312. [Google Scholar] [CrossRef]
- Peng, Y.; Mao, B.; Zhang, C.; Shao, Y.; Wu, T.; Hu, L.; Hu, Y.; Tang, L.; Li, Y.; Tang, W. Influence of physicochemical properties and starch fine structure on the eating quality of hybrid rice with similar apparent amylose content. Food Chem. 2021, 353, 129461. [Google Scholar] [CrossRef]
- Zhang, L.; Zhang, C.; Yan, Y.; Hu, Z.; Wang, K.; Zhou, J.; Zhou, Y.; Cao, L.; Wu, S. Influence of starch fine structure and storage proteins on the eating quality of rice varieties with similar amylose contents. J. Sci. Food Agric. 2021, 101, 3811–3818. [Google Scholar] [CrossRef]
- Xiaofeng, Y.; Mingjin, Y.; Guanglin, L.; Xianfeng, Z.; Yuhua, Z.; Ling, Y. Optimization of thin layer hot air drying process of rice and mathematical model fitting. Food Sci. 2017, 038, 198–205. [Google Scholar]
- Sadeghi, E.; Movagharnejad, K.; Haghighi Asl, A. Parameters optimization and quality evaluation of mechanical properties of infrared radiation thin layer drying of pumpkin samples. J. Food Process Eng. 2020, 43, e13309. [Google Scholar] [CrossRef]


| Factors | Symbols | Coded Versus Uncoded Values | ||||
|---|---|---|---|---|---|---|
| −α = 2.378 | −1 | 0 | 1 | α = 2.378 | ||
| Drying temperature (°C) | T | 35 | 40.8 | 45 | 49.2 | 55 |
| Relative humidity (%) | RH | 30 | 35.8 | 40 | 44.2 | 50 |
| Initial moisture content (%) | MC | 20 | 22.3 | 24 | 25.7 | 28 |
| Wind speed (m/s) | V | 0.36 | 0.5 | 0.6 | 0.7 | 0.84 |
| Tempering ratio | TR | 1 | 1.9 | 2.5 | 3.1 | 4 |
| Std | T (°C) | RH (%) | MC (%) | V (m/s) | TR | Dtt (min) | AT (°C·h) | PC (%) | FC (%) | AC (g/100 g) | APC (g/100 g) |
|---|---|---|---|---|---|---|---|---|---|---|---|
| 1 | 40.8 | 35.8 | 22.3 | 0.5 | 1.9 | 7.38 | 301.17 | 8.35 | 2.46 | 15.22 | 58.02 |
| 2 | 49.2 | 35.8 | 22.3 | 0.5 | 1.9 | 5.28 | 259.86 | 8.31 | 2.21 | 11.82 | 61.11 |
| 3 | 40.8 | 44.2 | 22.3 | 0.5 | 1.9 | 9.54 | 389.10 | 8.45 | 2.30 | 11.64 | 62.44 |
| 4 | 49.2 | 44.2 | 22.3 | 0.5 | 1.9 | 8.22 | 404.34 | 8.38 | 2.49 | 7.52 | 66.62 |
| 5 | 40.8 | 35.8 | 25.7 | 0.5 | 1.9 | 9.52 | 388.21 | 8.41 | 2.95 | 19.33 | 53.37 |
| 6 | 49.2 | 35.8 | 25.7 | 0.5 | 1.9 | 6.61 | 325.13 | 8.46 | 2.63 | 16.01 | 55.33 |
| 7 | 40.8 | 44.2 | 25.7 | 0.5 | 1.9 | 12.39 | 505.44 | 8.43 | 2.52 | 13.66 | 60.88 |
| 8 | 49.2 | 44.2 | 25.7 | 0.5 | 1.9 | 9.65 | 474.86 | 8.50 | 2.36 | 9.44 | 64.78 |
| 9 | 40.8 | 35.8 | 22.3 | 0.7 | 1.9 | 5.96 | 243.17 | 8.75 | 2.71 | 9.07 | 63.78 |
| 10 | 49.2 | 35.8 | 22.3 | 0.7 | 1.9 | 4.49 | 220.99 | 8.65 | 2.31 | 11.79 | 63.31 |
| 11 | 40.8 | 44.2 | 22.3 | 0.7 | 1.9 | 7.42 | 302.87 | 8.81 | 2.55 | 11.79 | 61.71 |
| 12 | 49.2 | 44.2 | 22.3 | 0.7 | 1.9 | 7.29 | 358.67 | 8.71 | 2.53 | 6.77 | 66.31 |
| 13 | 40.8 | 35.8 | 25.7 | 0.7 | 1.9 | 9.51 | 388.14 | 8.56 | 2.75 | 17.73 | 55.12 |
| 14 | 49.2 | 35.8 | 25.7 | 0.7 | 1.9 | 5.92 | 291.18 | 8.49 | 2.34 | 18.26 | 55.4 |
| 15 | 40.8 | 44.2 | 25.7 | 0.7 | 1.9 | 12.38 | 504.97 | 8.66 | 2.32 | 18.04 | 56.2 |
| 16 | 49.2 | 44.2 | 25.7 | 0.7 | 1.9 | 8.19 | 403.11 | 8.49 | 2.27 | 15.93 | 59.17 |
| 17 | 40.8 | 35.8 | 22.3 | 0.5 | 3.1 | 9.33 | 380.73 | 8.57 | 2.04 | 8.23 | 65.31 |
| 18 | 49.2 | 35.8 | 22.3 | 0.5 | 3.1 | 6.19 | 304.38 | 8.60 | 2.22 | 10.23 | 63.31 |
| 19 | 40.8 | 44.2 | 22.3 | 0.5 | 3.1 | 12.36 | 504.36 | 8.54 | 2.27 | 12.76 | 62.69 |
| 20 | 49.2 | 44.2 | 22.3 | 0.5 | 3.1 | 7.37 | 362.36 | 8.57 | 2.58 | 7.22 | 64.89 |
| 21 | 40.8 | 35.8 | 25.7 | 0.5 | 3.1 | 12.44 | 507.55 | 8.67 | 2.32 | 9.30 | 62.4 |
| 22 | 49.2 | 35.8 | 25.7 | 0.5 | 3.1 | 8.37 | 411.64 | 8.74 | 2.27 | 12.99 | 61.19 |
| 23 | 40.8 | 44.2 | 25.7 | 0.5 | 3.1 | 15.40 | 628.32 | 8.61 | 2.02 | 7.18 | 65.41 |
| 24 | 49.2 | 44.2 | 25.7 | 0.5 | 3.1 | 10.47 | 514.96 | 8.70 | 2.34 | 8.28 | 64.72 |
| 25 | 40.8 | 35.8 | 22.3 | 0.7 | 3.1 | 8.26 | 337.01 | 8.70 | 2.06 | 6.37 | 67 |
| 26 | 49.2 | 35.8 | 22.3 | 0.7 | 3.1 | 5.16 | 254.04 | 8.63 | 2.02 | 9.53 | 64.81 |
| 27 | 40.8 | 44.2 | 22.3 | 0.7 | 3.1 | 9.31 | 379.78 | 8.68 | 2.23 | 13.88 | 58.56 |
| 28 | 49.2 | 44.2 | 22.3 | 0.7 | 3.1 | 7.23 | 355.55 | 8.56 | 2.78 | 10.36 | 60.63 |
| 29 | 40.8 | 35.8 | 25.7 | 0.7 | 3.1 | 11.31 | 461.31 | 8.69 | 2.10 | 11.68 | 61.8 |
| 30 | 49.2 | 35.8 | 25.7 | 0.7 | 3.1 | 7.21 | 354.57 | 8.71 | 2.03 | 18.23 | 57.55 |
| 31 | 40.8 | 44.2 | 25.7 | 0.7 | 3.1 | 12.30 | 501.84 | 8.66 | 1.98 | 14.74 | 55.06 |
| 32 | 49.2 | 44.2 | 25.7 | 0.7 | 3.1 | 8.43 | 414.59 | 8.64 | 2.16 | 16.37 | 55.6 |
| 33 | 35 | 40 | 24 | 0.6 | 2.5 | 13.20 | 462.06 | 8.62 | 2.60 | 15.20 | 56.81 |
| 34 | 55 | 40 | 24 | 0.6 | 2.5 | 5.44 | 299.11 | 8.61 | 2.61 | 13.52 | 57.19 |
| 35 | 45 | 30 | 24 | 0.6 | 2.5 | 5.49 | 246.83 | 8.64 | 2.53 | 18.49 | 55.78 |
| 36 | 45 | 50 | 24 | 0.6 | 2.5 | 13.16 | 592.13 | 8.61 | 2.58 | 14.15 | 58.72 |
| 37 | 45 | 40 | 20 | 0.6 | 2.5 | 5.32 | 239.25 | 8.46 | 2.02 | 9.93 | 64.33 |
| 38 | 45 | 40 | 28 | 0.6 | 2.5 | 9.87 | 444.30 | 8.48 | 1.97 | 17.87 | 56.69 |
| 39 | 45 | 40 | 24 | 0.36 | 2.5 | 9.70 | 436.58 | 8.68 | 2.47 | 3.78 | 65.63 |
| 40 | 45 | 40 | 24 | 0.84 | 2.5 | 7.19 | 323.63 | 8.86 | 2.40 | 9.22 | 63.14 |
| 41 | 45 | 40 | 24 | 0.6 | 1 | 6.61 | 297.60 | 8.48 | 2.39 | 10.09 | 63.48 |
| 42 | 45 | 40 | 24 | 0.6 | 4 | 9.00 | 405.00 | 8.63 | 1.72 | 10.47 | 64.78 |
| 43 | 45 | 40 | 24 | 0.6 | 2.5 | 8.13 | 365.63 | 8.80 | 2.17 | 12.58 | 62.92 |
| 44 | 45 | 40 | 24 | 0.6 | 2.5 | 8.03 | 361.43 | 8.77 | 2.00 | 8.88 | 64.58 |
| 45 | 45 | 40 | 24 | 0.6 | 2.5 | 8.05 | 362.10 | 8.73 | 2.13 | 8.78 | 64.72 |
| 46 | 45 | 40 | 24 | 0.6 | 2.5 | 8.08 | 363.60 | 8.66 | 2.38 | 10.54 | 63.47 |
| 47 | 45 | 40 | 24 | 0.6 | 2.5 | 8.88 | 399.53 | 8.72 | 2.19 | 9.00 | 64.36 |
| 48 | 45 | 40 | 24 | 0.6 | 2.5 | 7.92 | 356.18 | 8.73 | 2.06 | 10.82 | 63.33 |
| 49 | 45 | 40 | 24 | 0.6 | 2.5 | 8.15 | 366.90 | 8.80 | 2.17 | 12.59 | 62.84 |
| 50 | 45 | 40 | 24 | 0.6 | 2.5 | 7.99 | 359.40 | 8.75 | 2.08 | 8.90 | 64.42 |
| 51 | 45 | 40 | 24 | 0.6 | 2.5 | 7.24 | 325.80 | 8.72 | 2.14 | 8.79 | 64.58 |
| 52 | 45 | 40 | 24 | 0.6 | 2.5 | 8.08 | 363.60 | 8.67 | 2.27 | 10.51 | 63.58 |
| 53 | 45 | 40 | 24 | 0.6 | 2.5 | 8.88 | 399.45 | 8.73 | 2.17 | 9.15 | 64.2 |
| 54 | 45 | 40 | 24 | 0.6 | 2.5 | 8.17 | 367.73 | 8.73 | 2.11 | 10.78 | 63.86 |
| 55 | 45 | 40 | 24 | 0.6 | 2.5 | 7.24 | 325.80 | 8.74 | 2.08 | 8.90 | 64.45 |
| 56 | 45 | 40 | 24 | 0.6 | 2.5 | 8.04 | 361.88 | 8.72 | 2.14 | 8.98 | 64.47 |
| 57 | 45 | 40 | 24 | 0.6 | 2.5 | 8.83 | 397.28 | 8.68 | 2.27 | 10.51 | 63.37 |
| 58 | 45 | 40 | 24 | 0.6 | 2.5 | 8.08 | 363.53 | 8.72 | 2.17 | 9.10 | 63.44 |
| 59 | 45 | 40 | 24 | 0.6 | 2.5 | 7.97 | 358.43 | 8.73 | 2.11 | 10.71 | 63.41 |
| Responses | Polynomial Regression Model Equation | R2 | CV |
|---|---|---|---|
| Dtt | 0.9398 | 7.06 | |
| AT | 0.9190 | 7.07 | |
| PC | 0.8956 | 0.5380 | |
| FC | 0.8974 | 3.96 | |
| AC | 0.9028 | 11.80 | |
| APC | Y6 = −363.404 + 5.3093 × A + 4.7274 × B + 7.12924 × C + 319.431 × D + 33.879 × E + 0.0435091 × A × B − 0.322917 × A × E + 0.0983018 × B × C − 3.56548 × B × D − 0.60119 × B × E − 6.23162 × C × D + 0.599877 × C × E − 14.25 × D × E − 0.0683901 × A2 − 0.0658901 × B2 − 0.207833 × C2 | 0.9625 | 1.32 |
| Indicators | Sources of Variation | Sum of Squares | Degrees of Freedom | Mean Square | F-Measure | p-Value | Significant or Not |
|---|---|---|---|---|---|---|---|
| Dtt | Model | 277.86 | 9 | 30.87 | 84.95 | <0.0001 | Yes |
| Residuals | 17.81 | 49 | 0.3634 | ||||
| Misfitting term | 14.50 | 33 | 0.4395 | 2.13 | 0.0551 | NO | |
| Error | 3.30 | 16 | 0.2065 | ||||
| AT | Model | 3.753 × 10⁵ | 12 | 31,273.03 | 43.49 | <0.0001 | Yes |
| Residuals | 33,074.27 | 46 | 719.01 | ||||
| Misfitting term | 26,382.28 | 30 | 879.41 | 2.10 | 0.0596 | NO | |
| Error | 6691.98 | 16 | 418.25 | ||||
| PC | Model | 0.7948 | 15 | 0.0530 | 24.58 | <0.0001 | Yes |
| Residuals | 0.0927 | 43 | 0.0022 | ||||
| Misfitting term | 0.0709 | 27 | 0.0026 | 1.93 | 0.2879 | NO | |
| Error | 0.0218 | 16 | 0.0014 | ||||
| FC | Model | 3.02 | 16 | 0.1885 | 22.95 | <0.0001 | Yes |
| Residuals | 0.3450 | 42 | 0.0082 | ||||
| Misfitting term | 0.2160 | 26 | 0.0083 | 1.03 | 0.8773 | NO | |
| Error | 0.1290 | 16 | 0.0081 | ||||
| AC | Model | 659.89 | 20 | 32.99 | 17.64 | <0.0001 | Yes |
| Residuals | 71.09 | 38 | 1.87 | ||||
| Misfitting term | 44.89 | 22 | 2.04 | 1.25 | 0.3301 | NO | |
| Error | 26.20 | 16 | 1.64 | ||||
| APC | Model | 15,217.98 | 15 | 1014.53 | 55.19 | <0.0001 | Yes |
| Residuals | 790.48 | 43 | 18.38 | ||||
| Misfitting term | 557.73 | 27 | 20.66 | 1.42 | 0.2341 | NO | |
| Error | 232.74 | 16 | 14.55 |
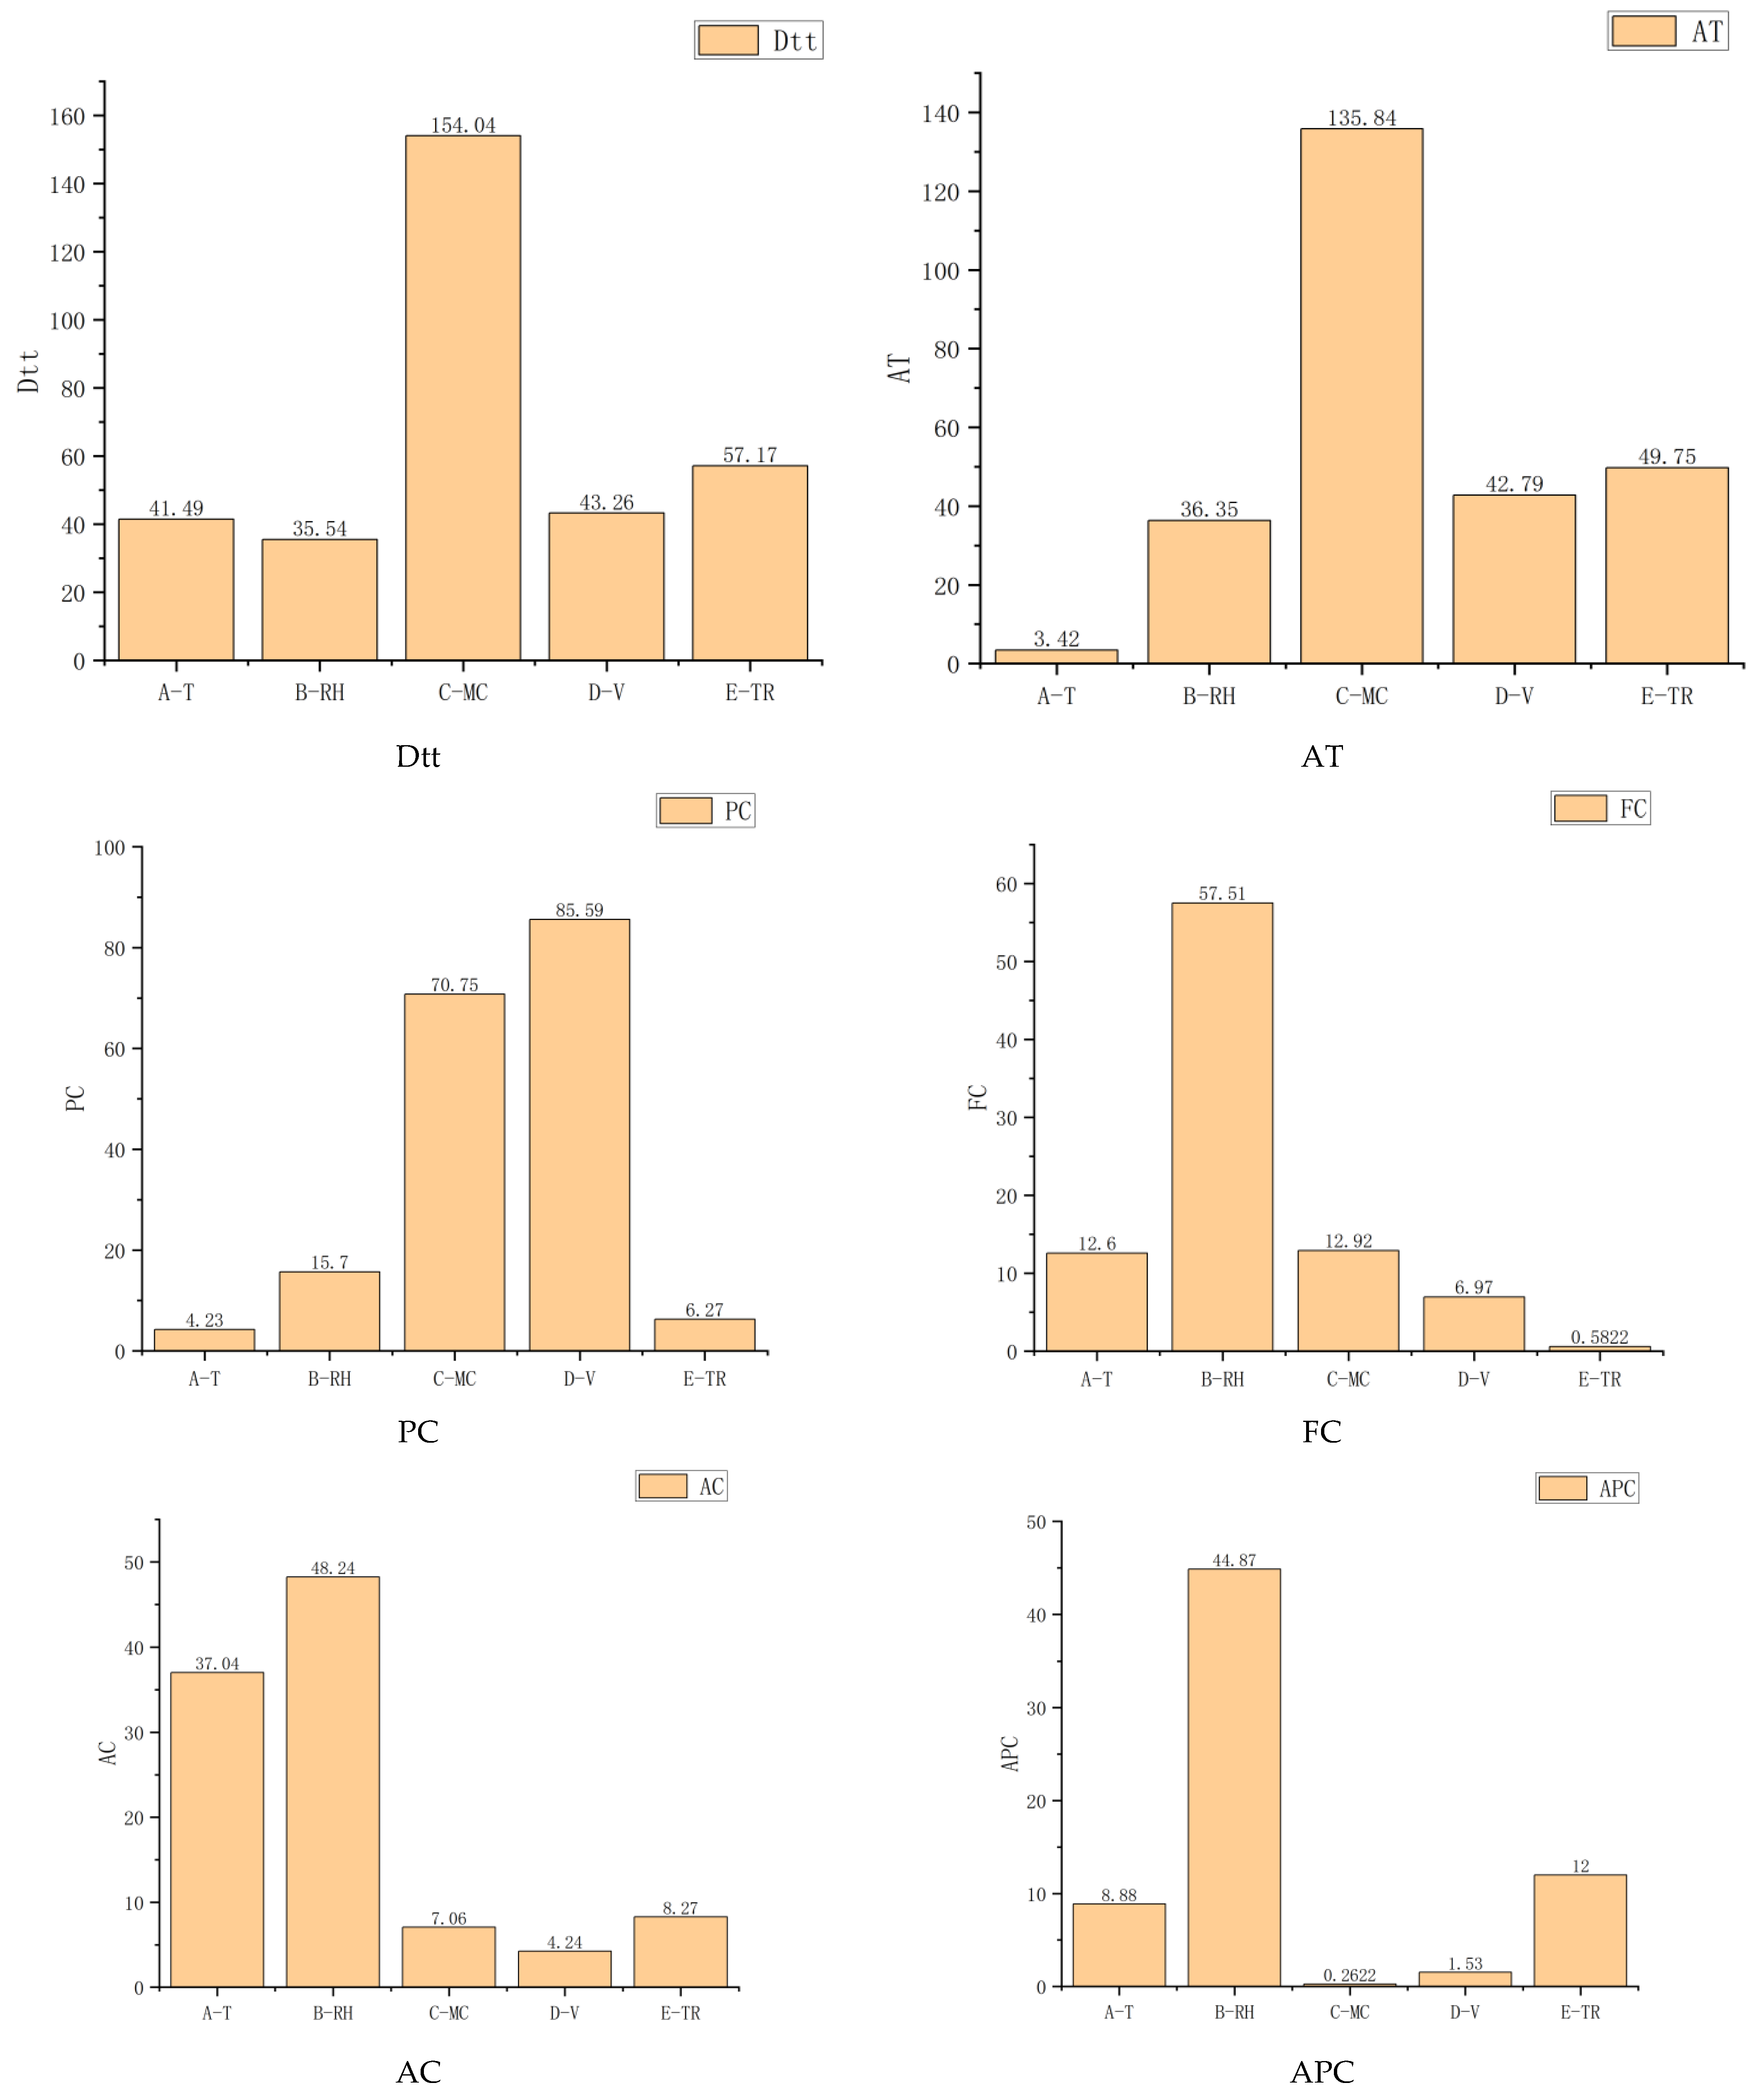
| Factor F-Measure | Dtt | AT | PC | FC | AC | APC |
|---|---|---|---|---|---|---|
| A-T | 41.49 | 3.42 | 4.23 | 12.60 | 37.04 | 8.88 |
| B-RH | 35.54 | 36.35 | 15.70 | 57.51 | 48.24 | 44.87 |
| C-MC | 154.04 | 135.84 | 70.75 | 12.92 | 7.06 | 0.2622 |
| D-V | 43.26 | 42.79 | 85.59 | 6.97 | 4.24 | 1.53 |
| E-TR | 57.17 | 49.75 | 6.27 | 0.5822 | 8.27 | 12.00 |
| T | RH | MC | V | TR | Dtt | AT | PC | FC | AC | APC | Total Error % | ||
|---|---|---|---|---|---|---|---|---|---|---|---|---|---|
| Optimal parameter validation | Optimal parameter prediction value | 48.87 | 30.12 | 21.31 | 0.62 | 2.86 | 4.23 | 214.44 | 8.466 | 1.96 | 15.33 | 60.49 | |
| Experimental Group 1 | 4.18 | 223.15 | 7.92 | 1.98 | 16.49 | 61.07 | |||||||
| Experimental Group 2 | 4.34 | 208.55 | 8.14 | 2.02 | 15.05 | 57.87 | |||||||
| Experimental Group 3 | 4.37 | 224.75 | 7.83 | 1.9 | 15.88 | 64.18 | |||||||
| Average error | 4.73% | 3.87% | 5.94% | 2.38% | 4.33% | 3.80% | 4.17% | ||||||
| Response metric validation | Model predictions | 46.4 | 52.99 | 19.2 | 0.7 | 1.5 | 9.59 | 446.4 | 8.42 | 3.71 | 15.14 | 100.12 | |
| Experimental Group 1 | 9.57 | 453.49 | 8.57 | 3.59 | 15.45 | 100.7 | |||||||
| Error | 0.23% | 1.59% | 1.78% | 3.34% | 2.03% | 0.58% | |||||||
| Model prediction | 41.33 | 49.65 | 20.11 | 0.65 | 1.45 | 8.51 | 365.02 | 8.49 | 2.95 | 16.97 | 98.84 | ||
| Experimental Group 2 | 8.22 | 348.14 | 8.14 | 2.81 | 17.99 | 93.92 | |||||||
| Error | 3.47% | 4.62% | 4.17% | 4.60% | 5.99% | 4.98% | |||||||
| Model predicted value | 40.57 | 48 | 19.49 | 0.7 | 1.99 | 7.75 | 321.92 | 8.53 | 2.91 | 17.22 | 97.04 | ||
| Experimental Group 3 | 7.6 | 308.92 | 7.99 | 2.75 | 16.36 | 87.85 | |||||||
| Error | 2.04% | 4.04% | 6.36% | 5.59% | 5.03% | 9.47% | |||||||
| Average error | 4.79% | 3.25% | 6.89% | 7.35% | 6.57% | 6.68% | 5.92% | ||||||
Disclaimer/Publisher’s Note: The statements, opinions and data contained in all publications are solely those of the individual author(s) and contributor(s) and not of MDPI and/or the editor(s). MDPI and/or the editor(s) disclaim responsibility for any injury to people or property resulting from any ideas, methods, instructions or products referred to in the content. |
© 2024 by the authors. Licensee MDPI, Basel, Switzerland. This article is an open access article distributed under the terms and conditions of the Creative Commons Attribution (CC BY) license (https://creativecommons.org/licenses/by/4.0/).
Share and Cite
Li, J.; Chang, K.; Yin, J.; Jin, Y.; Yi, X.; Zhang, Z.; He, Y.; Yang, Q.; Tang, Z.; Liu, X.; et al. Study on Optimization of Rice-Drying Process Parameters and Directional Regulation of Nutrient Quality. Appl. Sci. 2024, 14, 10825. https://doi.org/10.3390/app142310825
Li J, Chang K, Yin J, Jin Y, Yi X, Zhang Z, He Y, Yang Q, Tang Z, Liu X, et al. Study on Optimization of Rice-Drying Process Parameters and Directional Regulation of Nutrient Quality. Applied Sciences. 2024; 14(23):10825. https://doi.org/10.3390/app142310825
Chicago/Turabian StyleLi, Jinquan, Kezhen Chang, Jun Yin, Yi Jin, Xiaokang Yi, Zhongjie Zhang, Yichuan He, Qiaonan Yang, Zhihui Tang, Xiaoyu Liu, and et al. 2024. "Study on Optimization of Rice-Drying Process Parameters and Directional Regulation of Nutrient Quality" Applied Sciences 14, no. 23: 10825. https://doi.org/10.3390/app142310825
APA StyleLi, J., Chang, K., Yin, J., Jin, Y., Yi, X., Zhang, Z., He, Y., Yang, Q., Tang, Z., Liu, X., & Wu, W. (2024). Study on Optimization of Rice-Drying Process Parameters and Directional Regulation of Nutrient Quality. Applied Sciences, 14(23), 10825. https://doi.org/10.3390/app142310825