Article

Estimating Tetrachloroethene Sorption Coefficients Based on Soil Properties in Organic-Poor Soils

Department of Environmental Chemistry, University of Chemistry and Technology Prague, Technická 5, 16628 Prague, Czech Republic
*
Author to whom correspondence should be addressed.
Appl. Sci. 2024, 14(24), 11761; https://doi.org/10.3390/app142411761
Submission received: 25 October 2024 / Revised: 4 December 2024 / Accepted: 10 December 2024 / Published: 17 December 2024
(This article belongs to the Section Environmental Sciences)

Abstract

:
In the context of contaminated site remediation, the fate of chlorinated solvents in the subsurface and subsequent groundwater contamination is influenced by soil properties governing sorption. The solid–water distribution coefficient (Kd) is a key parameter for modeling contaminant distribution and transport, essential for risk assessment and remediation planning. This study evaluated tetrachloroethene sorption isotherms in 34 low-organic-carbon soils from the Czech Republic, assessing the influence of soil properties on Kd. Soil samples exhibited variability in organic carbon content (˂0.05–0.81%), with clay ranging from 0% to 64.9%, silt 5.1% to 71.2%, and sand 5.2% to 88.9%, specific surface area (0.41–64.39 m2 g−1), particle density (2.05–4.09 g cm−3), and porosity (43.5–67.3%). Batch experiments were conducted using standard procedures, with Kd values ranging from 0.379 to 2.272 L kg−1. Statistical analysis grouped the soils into three textural classes: sandy, clayey fine, and silty loam. The findings reveal that organic carbon content and specific surface area are the primary predictors of Kd, while clay and sand also play a significant role in shaping sorption behavior. Multivariate regression models explained 63.6% to 98.5% of Kd variability with high accuracy, as indicated by low root means square error (0.070–0.329) and mean absolute percentage error (3.8–28.8%) values. These models offer reliable predictions of sorption behavior, providing valuable tools for risk assessment and remediation strategies.

1. Introduction

The fate of nonpolar hydrophobic organic compounds, such as chlorinated solvents and aromatic hydrocarbons, in subsurface environments is predominantly controlled by their sorptive behavior [1]. Accurately characterizing this behavior is essential for predicting the transport, transformation, and ultimate fate of these compounds within the subsurface, which is crucial for conducting rigorous risk assessments and developing effective remediation strategies [2]. The extent to which a compound associates with solid phases at equilibrium is quantified by the solid–water distribution coefficient (Kd), which represents the ratio of the compound’s equilibrium concentration in the solid phase to its concentration in the aqueous phase [3]. Kd is a critical parameter that directly influences the modeling of volatile organic compounds’ (VOCs) transport in soil and groundwater [4].
Given the inherent complexity of soil as a geosorbent, practical constraints often necessitate limiting the assessment of sorption characteristics to fundamental parameters that can provide reasonable estimates of contaminant behavior. Early studies have highlighted the critical role of the quantity and nature of organic matter in soil in influencing sorption [5,6,7], leading to the normalization of sorption coefficients to organic carbon (OC) content [8,9]. However, the assumption that OC has uniform sorption properties has been challenged by observations such as the nonlinear shape of sorption isotherms [10,11] or multiphasic desorption kinetics [12]. The Kd values can be influenced by various factors, including clay mineral content and type [13,14,15,16], moisture levels [17,18,19], particle size distribution [20], porosity [21,22], the specific surface area (SSA) of the soil [23], and the presence of salts in soil solutions [24].
For nonpolar hydrophobic organic compounds, the Kd value is often estimated in practice [25] using the fraction of organic carbon content (fOC) and OC-normalized Kd (KOC, L kg−1) applying the equation Kd = KOC × fOC [3]. This approach allows for efficient predictions, particularly in cases where detailed site-specific data are unavailable [26]. It is especially useful for rapid assessments, as it bypasses the complex and resource-intensive processes involved in fully characterizing contaminated areas. However, empirically estimated Kd values are often lower than the experimentally determined ones; and this approach is more accurate for soils with high OC content, where the correlation between OC content and sorption behavior is strong [27]. Conversely, for soils with low OC content, predictions based on KOC are less reliable [28]. This reduced reliability stems from the increased influence of other soil properties, such as clay content, whose mineral surfaces play a significant role in physical sorption, which is neglected in these models. As a result, these models are less applicable to low-organic-carbon soils. This inaccuracy can lead to underestimating total contaminant levels in the subsurface, potentially resulting in an underassessment of associated risks [29,30]. Direct experimental measurements of Kd values are therefore essential for these soils to manage subsurface contamination precisely [31,32,33,34]. Nevertheless, determining Kd experimentally presents significant challenges due to the volatility of contaminants, their susceptibility to degradation, and competitive interactions among solutes [35]. Therefore, developing a robust and accurate Kd prediction methodology for soils with low OC content based on a wider range of soil characteristics would significantly enhance the precision of risk assessments and improve the effectiveness of remediation efforts [36,37,38].
In this study, we propose novel sorption models for predicting Kd of tetrachloroethene (PCE) in low-OC soils. PCE was selected as the model contaminant due to its widespread occurrence and persistence in subsurface environments. This research was guided by four primary objectives: (1) to collect a statistically representative set of fully characterized low-OC soil samples; (2) to measure and analyze PCE sorption isotherms for these samples; (3) to perform detailed statistical analyses to identify the key soil properties influencing sorption behavior; and (4) to develop and validate new advanced predictive sorption models. In addition to the previous models, we involved soil parameters that are practical for routine environmental assessments and are proven to significantly contribute to the sorption. By integrating a comprehensive suite of soil property measurements into the evaluation, this study provides novel insights into the mechanisms governing sorption of hydrophobic pollutants in low-OC soils. Despite their simple implementation, which facilitates application by the wider professional community, these models enhance the precision of risk assessments and support effective remediation strategies for contaminated sites.

2. Materials and Methods

2.1. Chemicals

A list of all chemicals used is in Text S1 of the Supporting Information (SI).

2.2. Soil Samples

Soil samples were collected from 23 sites in the Czech Republic, targeting various soil horizons and aquifer materials during excavation. Sampling depths ranged from 30 cm to 4 m as part of a geological survey. The collected soil samples were homogenized, dried at 105 °C for 24 h, and subsequently sieved through a 2 mm mesh.
The particle size distribution was determined using two methods: mechanical sieving and sedimentation analysis. These methods were used to quantify the fractions of gravel, sand, silt, and clay. Based on these results, the soils were classified into different soil groups. The dry bulk density (ρb) and the soil particle density (ρs) were measured using the core method and the pycnometer method, respectively. Porosity (ε) was then calculated using the equation ε = (1 − ρb/ρs) × 100. The SSA of the soils was determined using the BET method with a Coulter SA 3100 (Beckman Coulter Life Sciences, Indianapolis, IN, USA).
The OC content was determined in samples pretreated with concentrated orthophosphoric acid to remove carbonates, using the dry combustion method on a LiquiTOC II (Elementar Analysensysteme GmbH, Langenselbold, Germany). The chemical composition of the soil samples was analyzed by X-ray fluorescence (XRF) with a wavelength-dispersive XRF spectrometer, ARL 9400 XP (Thermo ARL, Ecublens, Switzerland). The mineralogical composition of the soil samples was analyzed using X-ray diffraction (XRD) with a Bruker AXS D8 θ-θ powder diffractometer (Bruker, Ettlingen, Germany). Further details are provided in Text S2.

2.3. Sorption Experiments

Sorption experiments were conducted using a batch equilibrium technique based on established methods [39,40]. Each soil sample (10 ± 0.1 g, dry mass) was placed into 40 mL borosilicate glass tubes (28 × 95 mm) equipped with PTFE septa. To each tube, 5 mL of 1 M CaCl2 solution and 30 mL of distilled water were added, maintaining a soil-to-solution ratio of 1:3.5 (w/v). An aliquot of the standard PCE solution in methanol (1000 mg L−1) was then injected below the water level to achieve relative concentrations (Cw/S) of 0.015, 0.06, 0.25, 0.42, 0.831, and 1.35. These six points were used to construct the sorption isotherm. Duplicates of each sample were prepared and analyzed under the same experimental conditions. Following spiking, the tubes were shaken on a Laboratory Shaking Machine LT 2 (Kavalierglass, Sazava, Czech Republic) at a temperature range of 20 to 25 °C. The samples were allowed to equilibrate for 24 to 48 h before phase separation, which was achieved by centrifugation at 800 rpm for 3 min using a Jouan C3i Multifunction Centrifuge (Juan GmbH, Berlin, Germany). The extraction method followed EN ISO 10301. PCE concentration was measured using gas chromatography; further experimental parameters and details of the analysis method are provided in Texts S3 and S4.

2.4. Statistical Analysis and Development of Kd Prediction Models

Statistical analyses, including both univariate and multivariate approaches, were performed to identify the soil properties influencing PCE sorption and to develop an accurate sorption model for estimating Kd. The data analysis involved Pearson’s correlation to identify significant variables from the dataset, including a broad set of measured soil parameters. Principal Component Analysis (PCA) reduces the complexity by summarizing the data into a few principal components (PCs) that capture the most variance. PCA helps in visualizing and highlighting the most significant relationships between Kd and other soil properties, making the data easier to interpret and understand. Agglomerative Hierarchical Clustering (AHC) was employed to group soil samples into homogeneous clusters based on similar soil properties. Since soil data often do not meet the normality assumptions required for parametric tests, the Kruskal–Wallis test was used to compare statistically significant differences in soil properties across multiple sample groups without assuming normality. In combination with PCA, AHC, and the Kruskal–Wallis test, Linear Discriminant Analysis (LDA) was applied to identify linear combinations of soil properties that best separate the soil samples and classify them into different categories based on their properties. PCA and LDA also address potential collinearity among soil properties, improving model robustness. Finally, Kd prediction models were developed using linear regression. Linear regressions were performed between individual soil properties and Kd values to identify univariate linear model with the highest coefficients of determination. Subsequently, a multivariate linear regression method was used to construct a multivariate model for the prediction of Kd values using the significant soil properties. Model precision was evaluated using the coefficient of determination (R2) interpreted as the proportion of the variability of the dependent variable explained by the model, the root mean square error (RMSE) such as prediction errors and the mean absolute percentage error (MAPE) [41]. Further details are provided in Text S5.

3. Results and Discussion

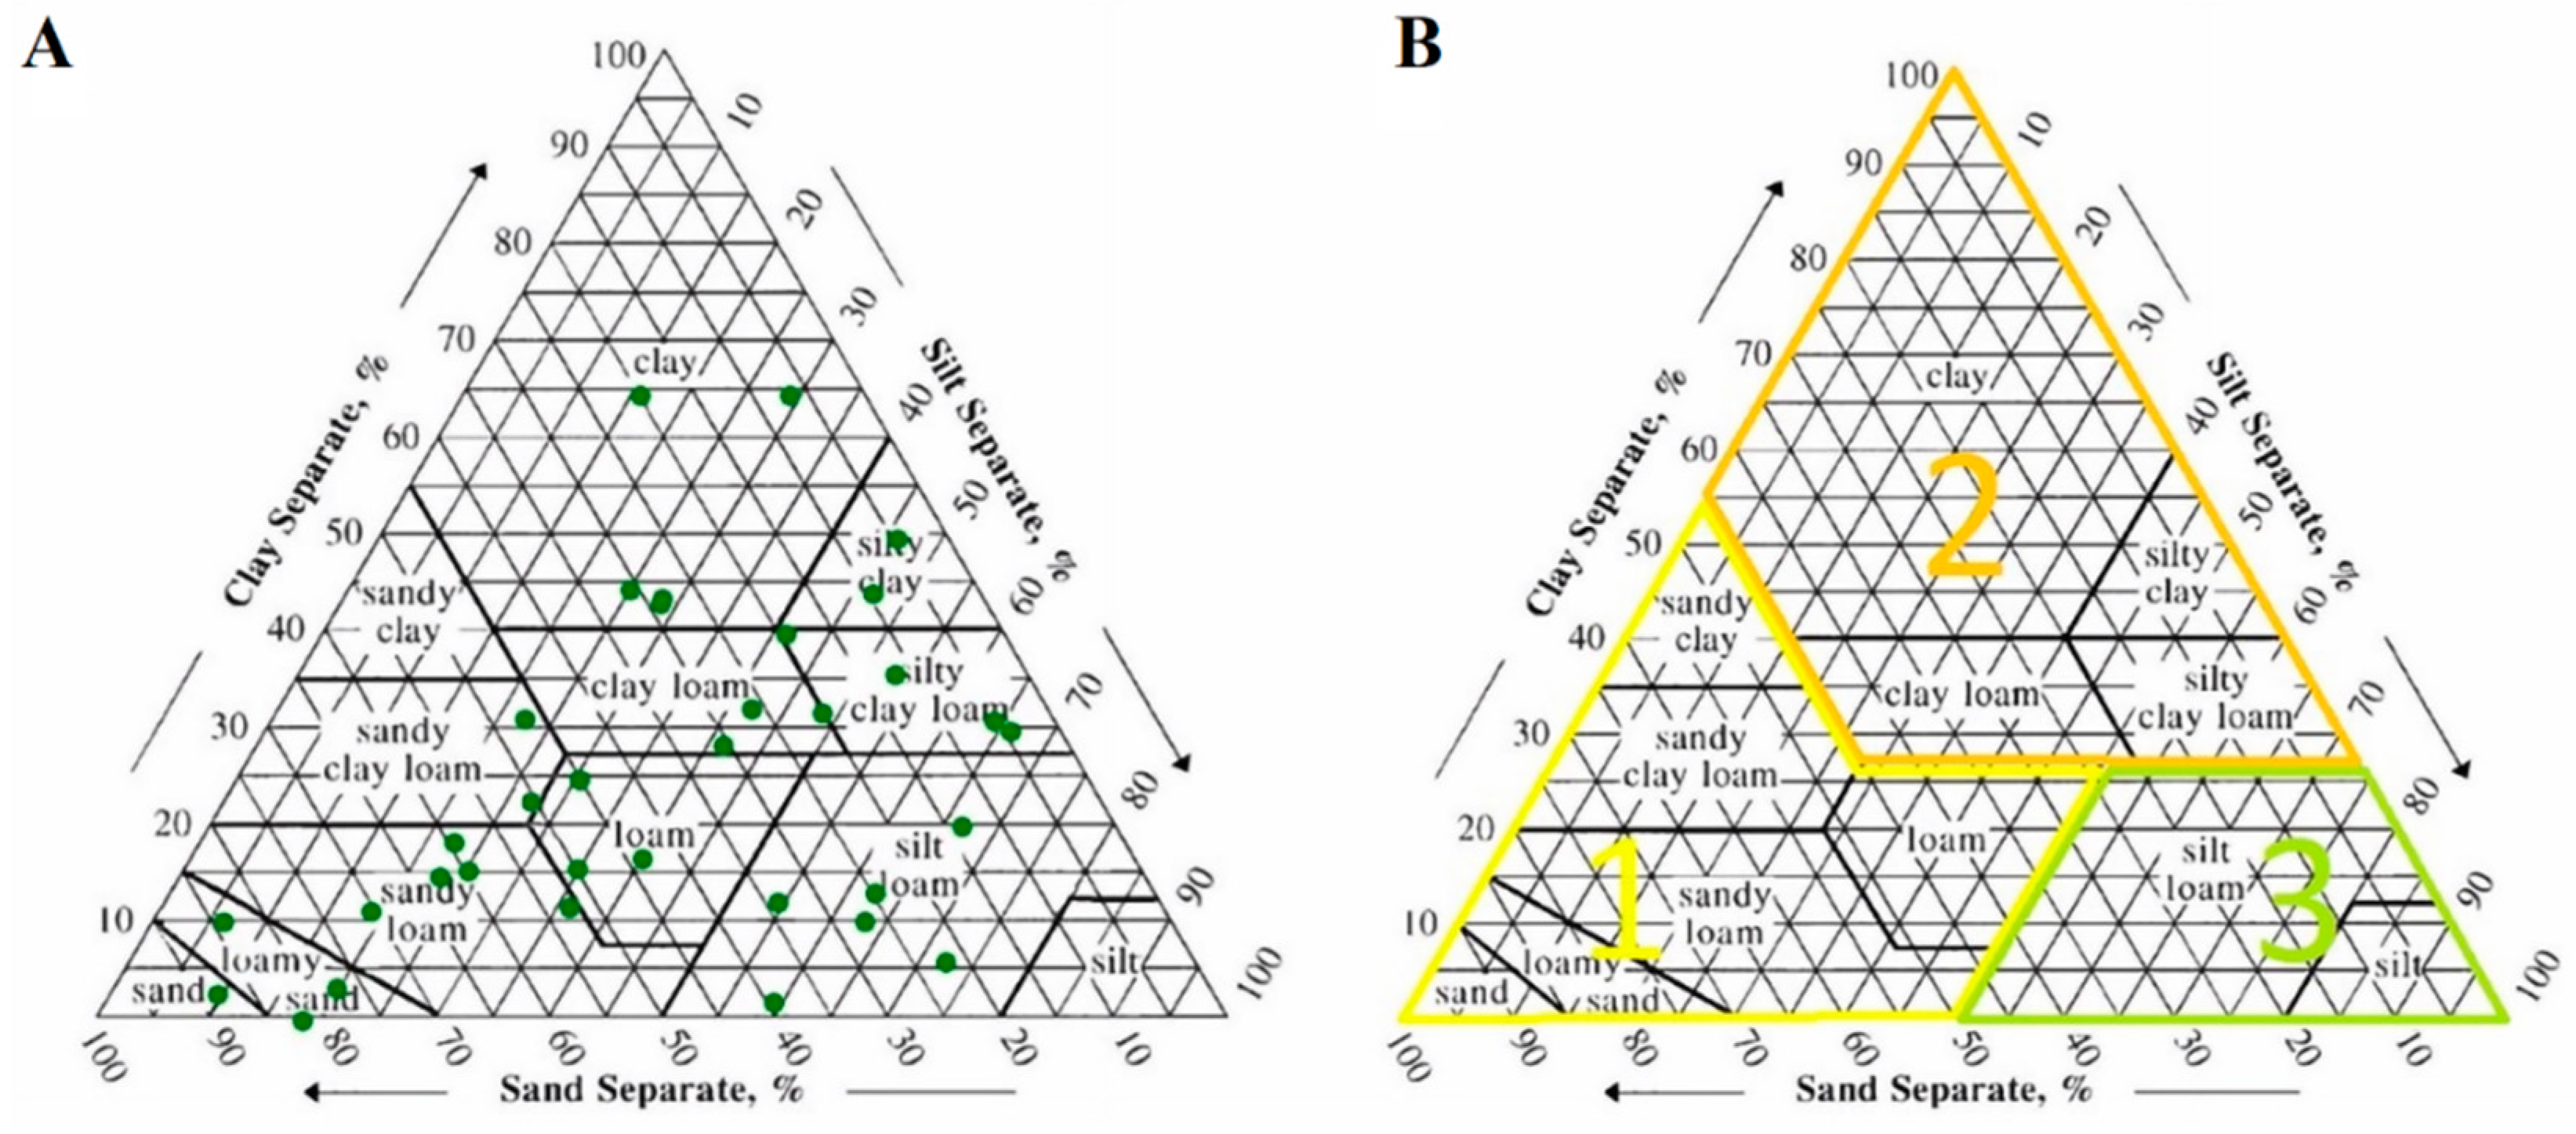
3.1. Characterization of the Soil Properties

Table 1 presents a summary of soil properties for 34 soil samples collected from various sites and depths in the Czech Republic. The main criteria for selecting sample sites were based on expected soil composition from geological map surveys with a special focus on sites with high clay content and low organic matter, site history and accessibility for sampling equipment. Preference was given to areas with minimal agricultural or industrial activity to reduce the risk of contamination from external sources. The surface soil layer was excluded from sampling due to the vegetation cover and expected higher OC content. Most of the collected samples originated from the unsaturated zone. Each sample is defined by its site of origin, sampling depth, soil texture, and a comprehensive set of physical and chemical properties. Clay content varied widely, from as low as 0% to as high as 64.9%, while silt ranged from 5.1% to 71.2%, and sand from 5.2% to 88.9% (w/w). The relative percentages of sand, silt, and clay were used to classify the samples according to the international soil texture classification standard; this system delineates 12 distinct textural classes. These were broadly categorized into two main groups: (i) fine-grained soils, comprising clay, silt loam, and silty clay loam; (ii) and coarse-grained soils, primarily consisting of sand, sandy loam, and loamy sand.
The soil samples exhibit a range of particle densities (2.05–4.09 g cm−3), indicating diverse mineral composition, relatively low bulk densities (0.80–1.43 g cm−3), and high porosity (43.5–67.3%), indicating soils with favorable characteristics for sorption processes. OC levels were generally low across the samples, ranging from ˂0.05% to 0.81% by mass. The samples were collected from both topsoil (˂1.20 m) and deeper soil layers, where higher OC content was expected in the topsoil. However, no significant correlation was observed between depth and OC content, with most samples showing OC concentrations consistent with those typically found in deeper soil layers (corresponding to a fraction of organic carbon (fOC) ˂ 0.005) [3]. The only exceptions were samples 8, 10, 7, and 30, where the fOC values ranged from 0.006 to 0.008. The range of SSA values varied considerably (0.41–64.39 m2 g−1), indicating differences in the sorption capacity of the soils. Additionally, the observed SSA values were generally lower than those typically associated with highly effective sorbents [42]. The elemental composition, particularly Si and Al content, suggests the presence of various clay minerals and metal oxides, which can contribute to sorption through mechanisms such as cation bridging and surface complexation, thereby impacting overall soil properties and potential interactions with contaminants [43,44].
XRD analysis revealed that the soils predominantly comprised quartz, clinochrysotile, muscovite, and various feldspars (including albite, orthoclase, microcline), and zeolites, along with clay minerals such as kaolinite and montmorillonite (Table S1). Fine-grained soils demonstrated a higher abundance of phyllosilicates, particularly clay minerals (kaolinite, montmorillonite, and illite) and muscovite, which are known for their high sorption capacities due to large specific surface areas and cation exchange properties. In contrast, these sorption-active minerals were often absent in coarse-grained soils, suggesting potentially lower sorption capacities in these samples. This mineral distribution pattern aligned with the particle size distribution results, reinforcing the textural classification of the samples.
Before the experiments, all soil samples were analyzed for PCE content. The results indicated that PCE concentrations were below the detection limit, confirming the absence of the compound in all samples.

3.2. Comparison of Measured and Estimated Linear Kd Values of Soil Samples

The distribution of PCE between the solid and liquid phases was characterized using adsorption isotherms. Table 2 provides the comparison of measured and estimated linear Kd values for all samples, along with their respective coefficients of determination (R2) and least squares values. The linear sorption model (Kd = KOC × fOC) was employed to estimate the Kd values in soil samples [45,46]. The measured Kd values for PCE ranged from 0.38 to 2.27 L kg−1 across different soil samples. Lower Kd values were observed in sand-dominated samples, while higher values were associated with clay-rich materials. These findings are consistent with previously reported Kd values for PCE in similar studies [47], highlighting the influence of soil composition on sorption behavior. Although the PCE sorption isotherms were slightly non-linear, a common occurrence in soils with low OC content (<1%) and high clay content, the differences in sum of squares and R2 were minimal. The measured Kd values were generally higher than their corresponding estimated values. This trend suggests that empirical sorption models may underestimate Kd values [48,49]. This indicates that factors other than OC, such as clay content or SSA, might also significantly influence sorption in these soils. A paired sample t-test showed no significant difference between them (t(33) = 1.056, p = 0.299) [50]. While this indicates that the linear predictive model maintains reliability in estimating Kd values, the result from MAPE (45.6) suggests that empirically estimated Kd values may underestimate the sorptive behavior of soils.

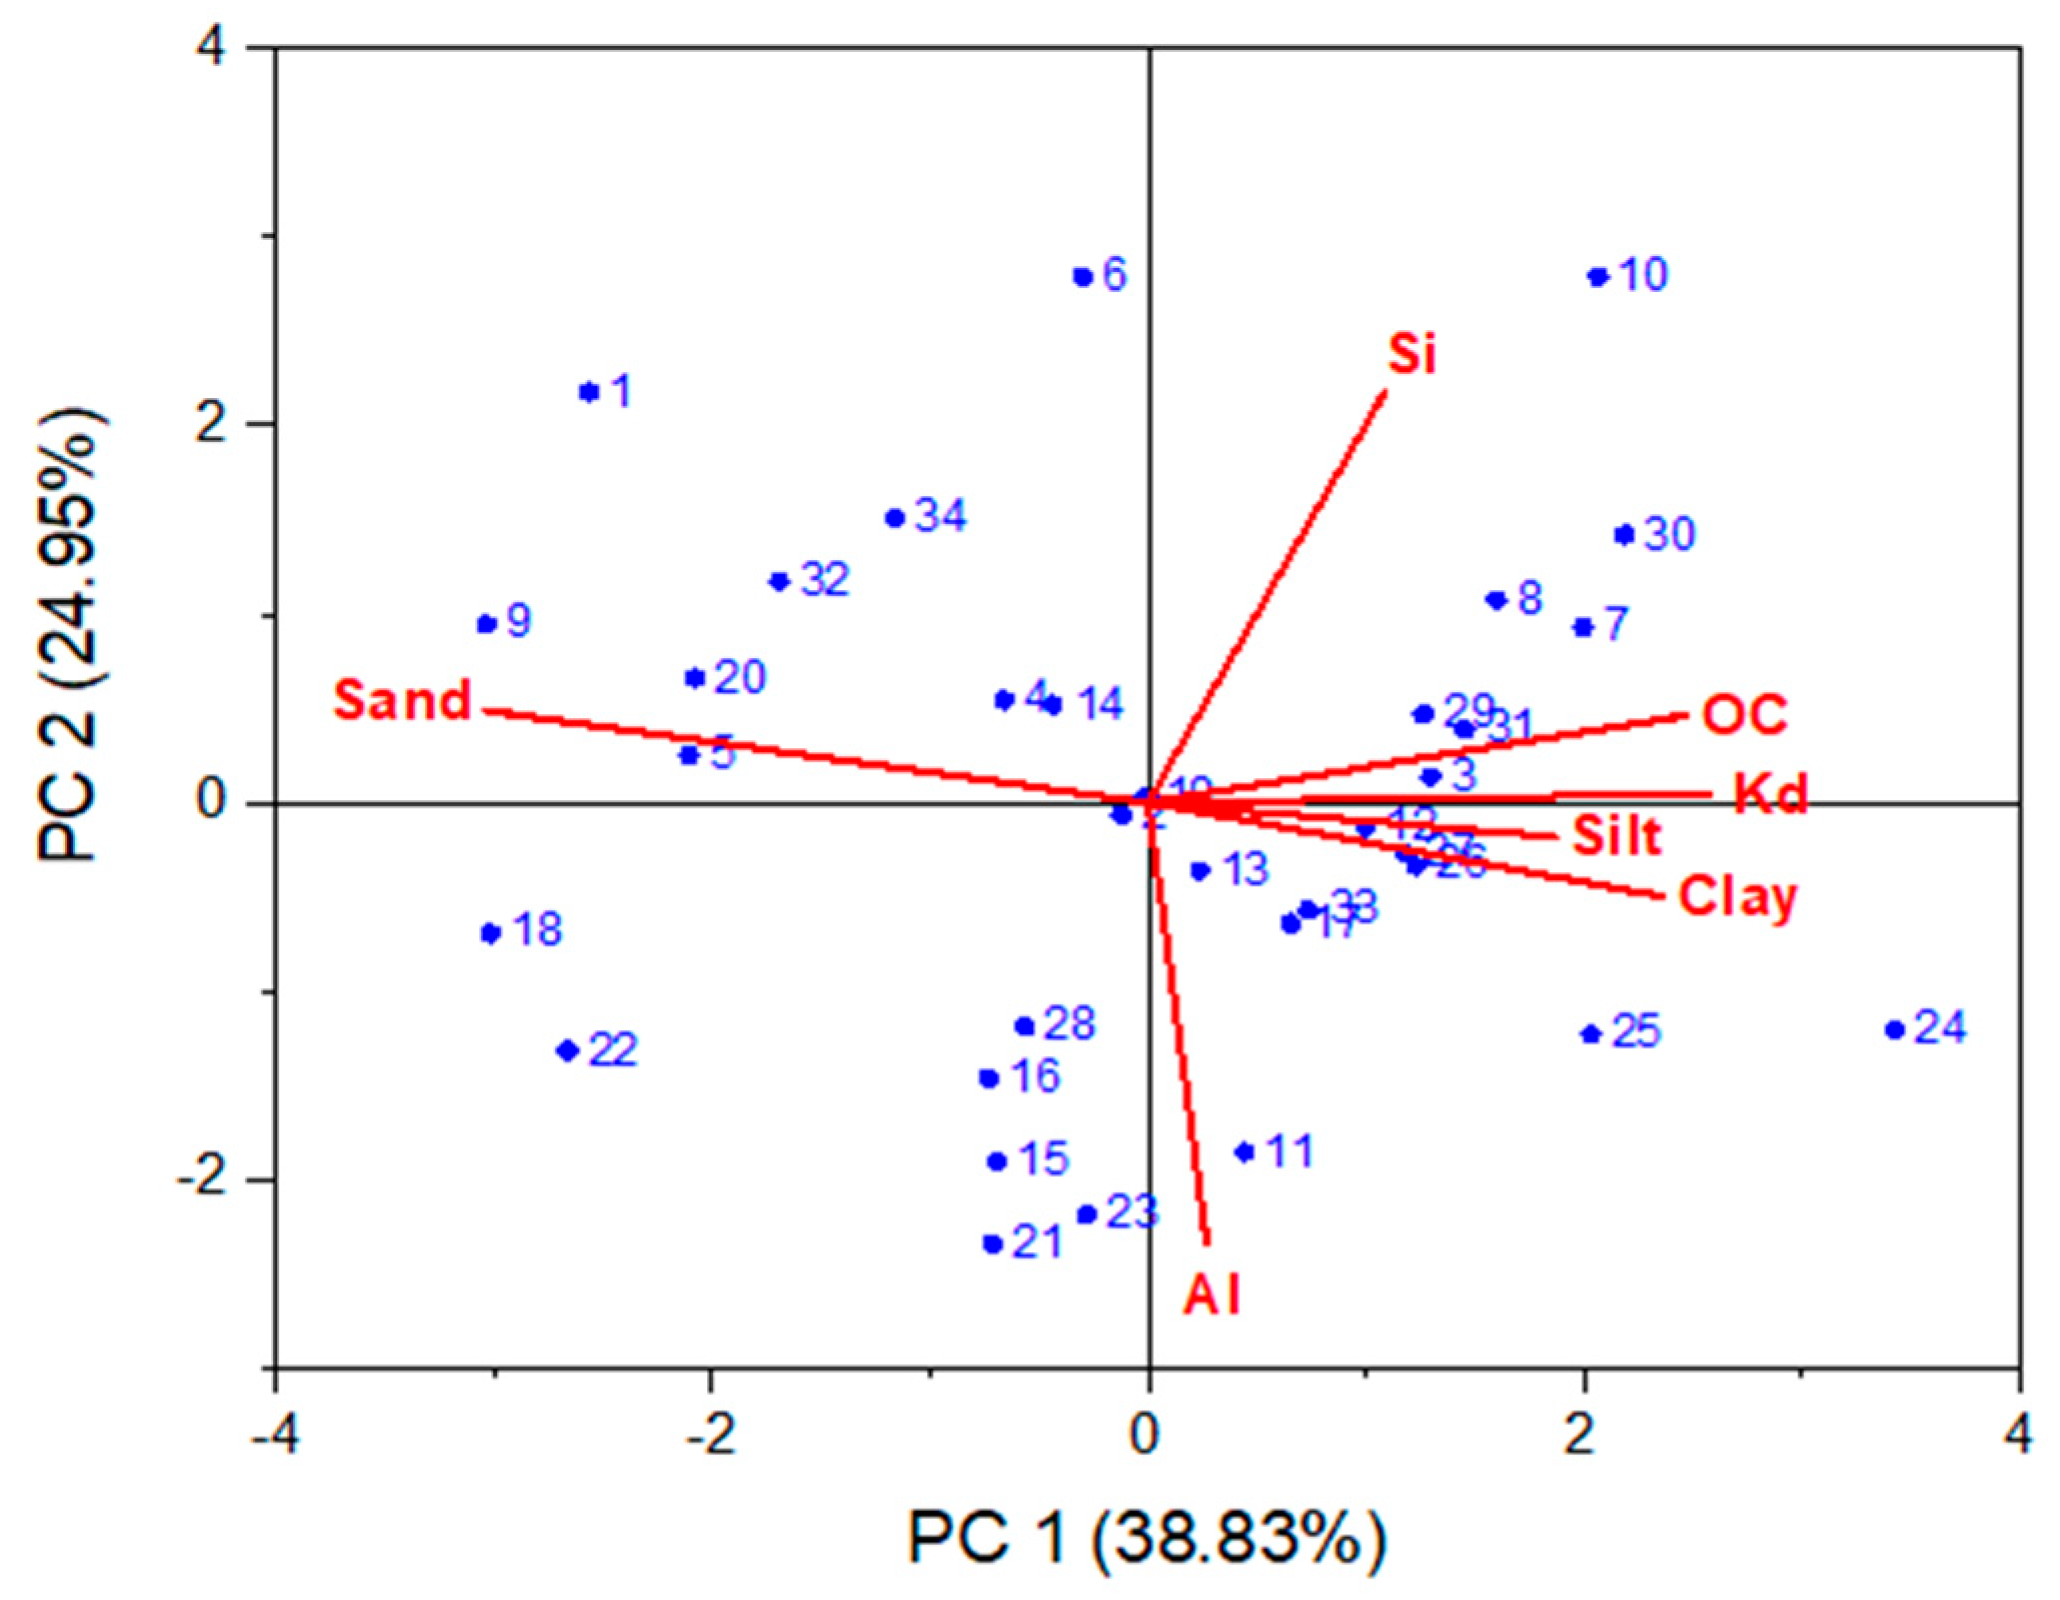
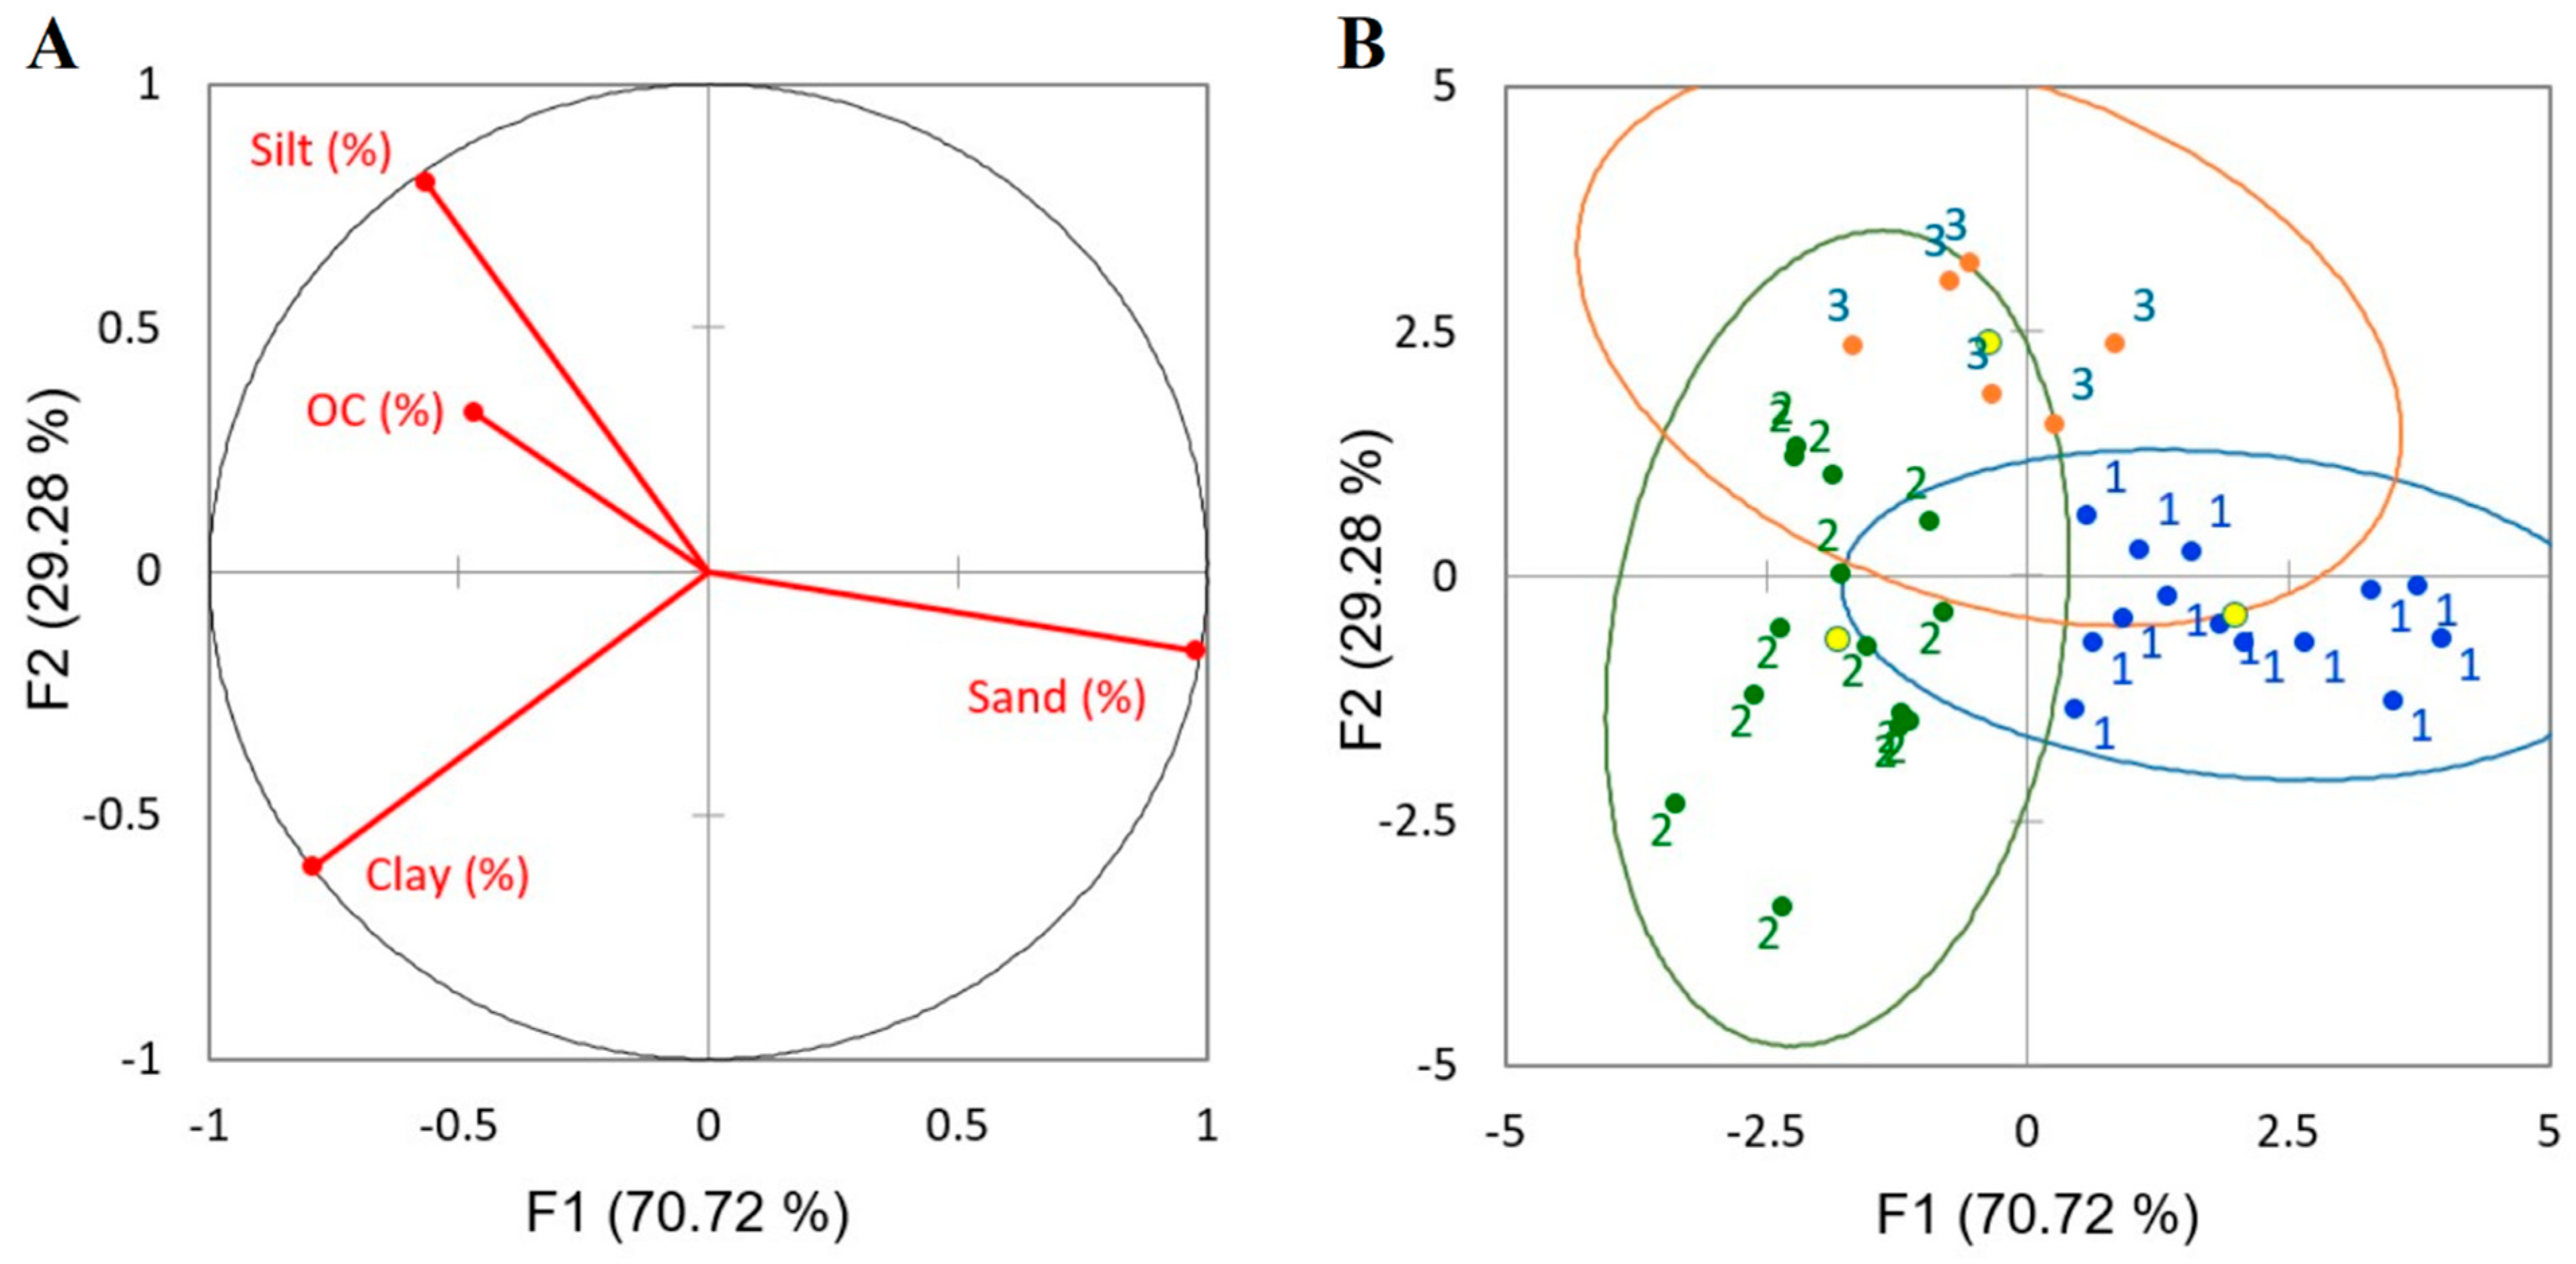
3.3. Statistical Data Analysis

Table 3 presents the descriptive statistics of the input data used for the multivariate analysis. The measured Kd values were generally low, with an overall mean of 0.92 ± 0.46 L kg−1, indicating limited sorption capacity for PCE in these low-organic-carbon soils. The generally narrow range of Kd values (0.38–2.27 L kg−1) suggests a degree of uniformity in sorption behavior among the studied soil samples. The working hypothesis suggested that the observed variations in Kd values were primarily attributable to differences in soil physicochemical properties. This assumption forms the basis for subsequent multivariate analysis to elucidate the specific soil characteristics influencing PCE sorption in these low-organic-carbon environments.
Correlations between soil properties and Kd values were examined to identify the key components governing PCE sorption in soils. Pearson’s correlation tests were conducted, with the null hypothesis evaluated against a stated significance level (α = 0.05). The most relevant properties were OC content, SSA, clay and sand content (Figure 1). Calculated p-values below the significance level (α = 0.05) confirmed the statistical significance of these correlations. Higher values of Pearson’s coefficients for SSA and clay content (0.679 and 0.510, respectively) indicate enhanced PCE sorption in soils with smaller particle sizes and consequently higher surface areas. Kd values showed a positive correlation with OC content (0.614), despite OC levels being <1%. Sand content demonstrated a moderate negative correlation with Kd values (−0.424), indicating reduced PCE sorption capacity in sandy soils. Other soil properties displayed non-significant correlations. Additionally, low Pearson’s correlations were observed between Al content and clay/silt particles (Al/Clay = 0.225; Al/Silt = 0.0173), as well as between Si content and sand particles (Si/Sand = −0.136), indicating no significant relationship between these elemental compositions and particle size distributions.
Since SSA data were only available for 21 samples, PCA was conducted separately on two datasets to ensure a thorough analysis: (i) the first set comprising 34 soil samples with 7 variables (six soil properties and Kd values), and (ii) a second set consisting of 21 soil samples with 9 variables, including SSA and porosity. Further details are provided in Text S5. The optimal number of PCs was determined by eigenvalues of the correlation matrix. In the first PCA analysis, PC1 and PC2 explained 63.77 % of the variance (PC1 38.83%; PC2 24.95%), both with eigenvalues higher than 1.7 (Table S2). Figure 2 presents a biplot combining loading and score plots, illustrating the contribution of original variables to the main components. Proximity between variables in the biplot indicates strong correlations. The PCA results revealed a strong positive correlation between Kd and OC, as well as moderate positive correlations between Kd and both clay and silt content. A negative correlation between Kd and sand content was indicated by an angle close to 180° between their vectors. Si and Al content showed minimal relevance in the PCA model. These findings suggest that OC, clay, and silt content are primary factors governing PCE sorption in the studied soils, while sand content negatively influences sorption, aligning with results from previous studies [45,51,52,53]. In the second PCA analysis, which included SSA and porosity, PC1 and PC2 explained 56.38% of the variance (PC1: 36.84%; PC2: 19.54%), both with eigenvalues higher than 1.7 (Table S3). The results highlighted the contributions of SSA and porosity to PCE sorption in soils. The corresponding biplot is displayed in Figure S1.
AHC was utilized to group samples based on their soil properties and measured Kd values resulting in a dendrogram (Figure S2) with three distinct clusters (green, red, and blue). The green cluster, containing 14 samples, is the most cohesive, while the red and blue clusters contain 6 and 14 samples, respectively. Most mergers occur at low dissimilarity levels (below 5000), but the three clusters remain distinct until around 6400 units, indicating strong between-cluster differences.
Combined with PCA, these analyses revealed a relationship between soil particle size distribution and Kd. The samples in this study were categorized into 10 classes according to the international soil texture classification standard. The soil texture triangle in Figure 3A depicts the relative proportions of sand, silt, and clay particles in the samples. Each soil texture class exhibits unique characteristics, such as water retention, permeability, and pore volume.
As the result of the AHC analysis, soil samples were grouped into three distinct classes of soils, primarily differentiated by their textural characteristics: Class 1 included fine- to coarser-grained soils with predominantly sand particles content (>50%), Class 2 comprised the finest soil types with lower sand particles content (˂50%), and Class 3 consisted of high or predominantly silt (>50%) and small sand particle content (˂50%) (Figure 3B). The resulting clusters showed strong agreement with the traditional sections in the soil textural triangle, validating the effectiveness of the clustering approach.
These findings are consistent with prior research that highlights the relationship between particle size distribution and sorption behavior. The observed classifications enhance the accuracy of sorption models by incorporating textural differences, which influence sorption capacity. This supports the broader understanding of how soil texture impacts the interactions between contaminants and soil particles [22].
The Kruskal–Wallis test was employed to assess the statistical significance of individual soil properties in influencing sample distribution across clusters. The results with Chi-squared (Chi2) values exceeding 5.991 (degrees of freedom (df) = 2) and p-values below 0.05 indicated statistically significant differences across the three clusters. Significant differences (p < α) were observed in OC, clay, silt, and sand content (Table 4). These findings corroborated the initial assumptions derived from PCA and Pearson´s test. Mean values of significant soil properties for each cluster are summarized in Table S4.
LDA elucidated relationships within clusters based on significant soil properties: OC, clay, silt, and sand content (%). Soils in the first class, predominantly sandy, exhibited lower organic carbon content compared to soils in the second and third classes (Table 5). Class 2, which comprised the finest particles, exhibited the highest Kd values, while Class 1, consisting mainly of sandy soils, showed the lowest Kd. This trend aligns with the general principle that smaller particles tend to have higher sorption capacities due to their larger surface area and greater cation exchange capacity [54,55,56,57,58]. Figure 4 shows the correlation of initial variables with two factors. The first factor (F1) accounted for 70.72% of the variance and strongly correlated with sand and clay content; this indicates that these variables are important for distinguishing between groups. Factor 2 (F2) showed strong correlations with silt and clay content (Figure 4A). The score plot with confidence ellipses (Figure 4B) represents each observation on the factor axes, with observations classified based on highest probability of belonging. All observations fell within the 95% confidence ellipses. The confusion matrix summarized the classification of observations into three classes (14, 14, and 6 observations per class, respectively). These results indicate 100% accuracy in discrimination, demonstrating accurate sample discrimination based on four significant parameters (OC, clay, silt, and sand content).

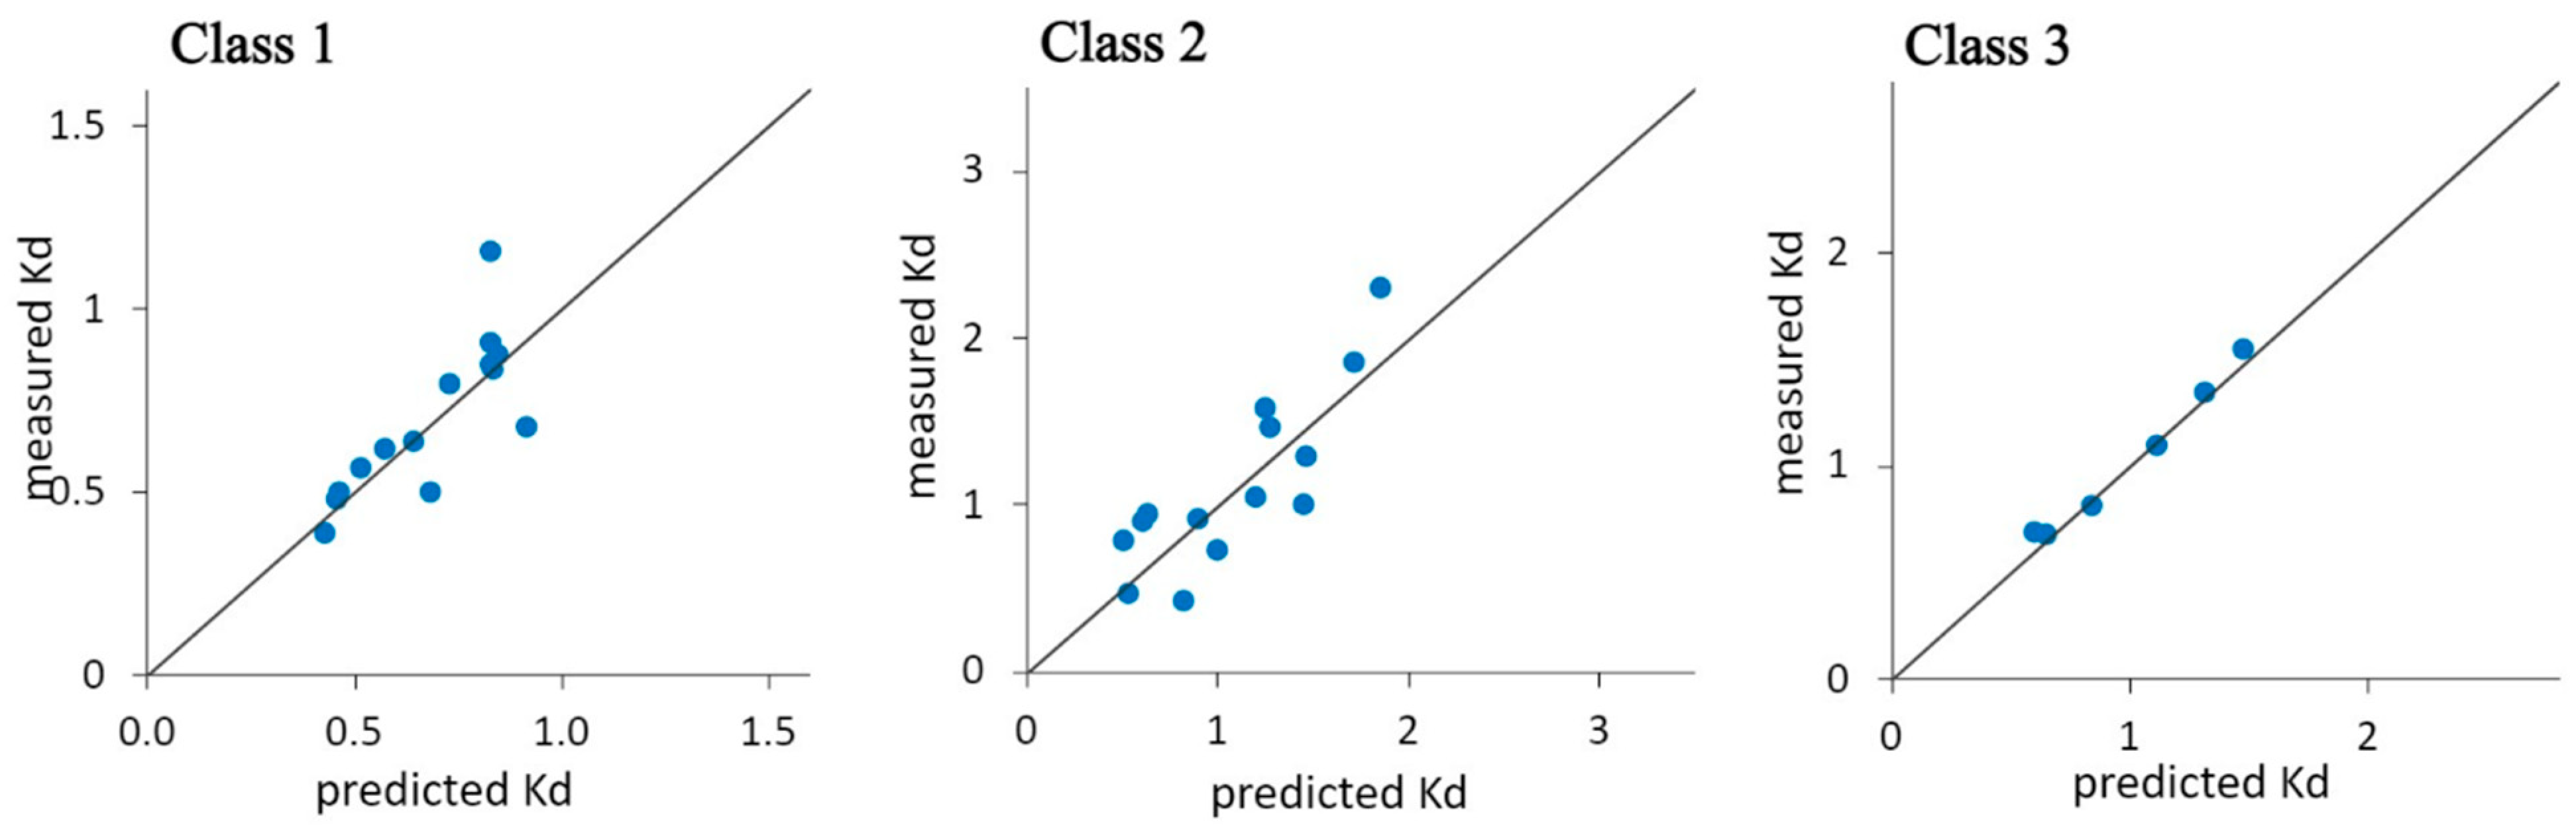
3.4. Univariate and Multivariate Linear Regression

Firstly, the relationship between Kd and individual soil properties was assessed using univariate linear regression, with prediction models summarized in Table 6. Each model was based on 34 observations, except for SSA, which had 21. Significant soil properties such as SSA, OC, clay, silt and sand content were further investigated. The correlation between Kd and SSA showed the highest Pearson’s correlation (0.679, with linear regression indicating statistically significant relationships between Kd and both SSA and OC. SSA accounted for 51.1% of the variability in Kd, while OC contributed 37.8% from Table 6. These results emphasize OC as a crucial factor in PCE sorption, even in soils with OC levels below 1%. SSA is strongly correlated with OC and inversely related to particle size. Despite achieving the best fit through univariate regression, the models exhibited low precision. Although clay and silt content are generally considered important for organic substance sorption, the regression analysis revealed that silt was not statistically significant, displaying the lowest coefficient of determination alongside the highest RMSE and MAPE values.
The second approach utilized multivariate analysis based on the AHC, Kruskal–Wallis, and LDA results. The models were developed by combining significant soil parameters: fOC, fClay, fSilt, fSand, and SSA. Multiple regression consistently achieved higher R2 than univariate linear regression. As with the PCA analysis, multivariate models were applied to two separate datasets. Table 7 summarizes the models for each soil class from Figure 3B (sandy (1), clay particles (2), and silt particles (3)) without including SSA, while models incorporating SSA are presented in Table S5. Multicollinearity, especially among fSand, fSilt, and fClay, was detected using tolerance (<3.0 × 10⁻⁶) and variance inflation factor (VIF) metrics (>3.4 × 10⁵). As a result, silt was excluded from the multivariate models to mitigate multicollinearity. The multivariate models for each class using fOC, fClay and fSand provided better fits than single-variable regression. These models explained 63.6%, 69.8% and 98.5% of the variance in Kd for Classes 1, 2, and 3, respectively. The highest R2 of 98.5% represents excellent fit but should be interpreted cautiously due to the small sample size in that class. Predictions deviated on average by 0.147, 0.329, and 0.07 units from measured Kd values, demonstrating high accuracy with low RMSE and MAPE values.
Figure 5 compares predicted and measured Kd, providing insights into model errors for each soil class. Analyzing the residuals helps identify outliers or samples that the model does not accurately represent. Notably, all residuals fell within the 95% confidence interval, indicating generally accurate predictions with no significant outliers. In Class 1, larger residuals were detected by loam (No. 15, 28) and sandy loam samples (No. 32). Similarly, clay loam soil (No. 7) shows some small residuals in Class 2, likely due to its proximity to the boundaries of the neighboring classes. Loam soils with balanced clay, silt, and sand content suggest areas for potential model improvement and highlight the need for a larger sample set to confirm trends. Additionally, acceptable residuals were observed in samples with higher OC content compared to other samples within the same class, reflecting potential variability in the dataset. These models are applicable to soils with low organic carbon content (<1%, w/w).
When applying the models for Classes 1 to 3 to real soils, it is crucial to assess the accuracy of Kd predictions and their alignment with measured values. A paired sample t-test confirmed that differences were not statistically significant for Class 1 (t(13) = 0.09, p = 0.935), Class 2 (t(13) = −0.07, p = 0.942), and Class 3 (t(5) = 0.25, p = 0.80). Since p-values exceeded the significance level of α = 0.05, the null hypothesis (H0: No differences between measured and predicted Kd values) was not rejected. The necessity of maintaining separate models for each class is reinforced by a t-test for paired differences, which showed significant results when applying the same model to Classes 2 and 3, with p-values below 0.05. This indicates that using distinct models for each class is essential for accurate sorption description. Additionally, although SSA was found to influence sorption, the models developed without SSA remained reliable. This is a valuable finding, as excluding SSA reduces the need for an additional, often costly soil characterization method, making the predictive models more cost-effective without significantly compromising accuracy.
The commonly used prediction model for Kd value, based on the equation Kd = KOC × fOC (Karrickhoff, 1979), was compared to measured Kd values across soil classes. Karickhoff’s model showed high RMSE of 0.400, 0.646, and 0.801, and MAPE values of 45.5, 41.1 and 56.4 for Classes 1, 2, and 3, respectively. The newly developed model demonstrated significantly higher accuracy, clearly indicating that it outperforms Karickhoff’s model for soils with such low organic carbon content.

4. Conclusions

This research utilized an extensive database of low-organic-carbon soil samples from across the Czech Republic to develop reliable sorption models for predicting Kd of tetrachloroethene. Based on the data and analyses conducted, this work classified low-organic-carbon soils into three distinct texture-based classes: loam to sandy, clay, and silty loam, highlighting the significant role of soil texture and composition in modeling contaminant behavior. OC content and SSA were identified as the dominant predictors of Kd, with clay and sand content also contributing significantly to its variability. These findings reinforce the importance of texture-specific modeling for accurately predicting the behavior and transport of PCE in low-OC soils.
Multivariate linear regression models were developed and demonstrated improved predictive accuracy over univariate approaches, explaining substantial variance in Kd values. Statistical tests validated the need for separate models for each soil class, ensuring precise sorption predictions. These models are specifically designed for soils with low OC content (up to 1%) and may not be applicable to soils with higher OC content. Soils with higher OC content were not included in this study, and for such soils, older, simplified models based on fOC are generally more appropriate.
Our research highlights that multivariate regression models are not only effective but also cost-efficient, using affordable inputs and eliminating the need for expensive soil characterization methods. They provide a practical tool for predicting the distribution and transport of contaminants in low-OC soils, supporting both environmental and health risk assessments, while also guiding effective remediation strategies and monitoring at contaminated sites.
While linear models facilitate comparisons across different soil types, they may not fully capture nonlinear sorption behavior, especially under extreme conditions. Nonlinear models could improve accuracy but introduce added complexity, making direct comparisons and evaluations more challenging. Our linear multivariate regression models strikes a balance by providing reliable predictions without this added complexity, making it suitable for a wide range of applications.
Future research could explore the application of these models to other contaminants and soil types, as well as their integration into large-scale environmental monitoring and risk management systems. By refining and expanding these models, we can improve our ability to predict contaminant behavior in diverse soil environments, contributing to enhanced environmental protection and public health outcomes.

Supplementary Materials

The following supporting information can be downloaded at: https://www.mdpi.com/article/10.3390/app142411761/s1, Text S1: Materials and reagents; Text S2: Soil Characterization; Text S3: Experimental parameters of the batch test; Text S4: Analysis method and quality control; Text S5: Statistical analyses; Figure S1: Biplot of PC1 and PC2 axes (56.38% variance explained), 9 variables include porosity and specific surface area (SSA), and 21 observations; Figure S2: Final dendrogram resulting from Agglomerative Hierarchical Clustering (AHC) of used samples into three final clusters; Table S1: Mineralogic composition of investigated soil sample; Table S2: PCA results (7 variables, and 34 observations); Table S3: Second PCA results (9 variables, and 21 observations); Table S4: Kruskal Wallis test, summary statistics of soil properties by cluster; Table S5: Multivariate linear regression models for predicting Kd from SSA, fOC, fClay and fSilt and corresponding goodness-of-fit statistics.

Author Contributions

All authors contributed to the study conception and design. V.R. was responsible for performing the laboratory experiments and conducting the statistical analyses. V.R., J.K. and L.M. drafted the initial version of the manuscript. All authors reviewed and provided critical feedback on subsequent manuscript versions, contributing to the final interpretation of the data. All authors have read and agreed to the published version of the manuscript.

Funding

This work was supported by the grant of specific university research—grant No. A1_FTOP_2024_003.

Institutional Review Board Statement

Not applicable.

Informed Consent Statement

Not applicable.

Data Availability Statement

The data supporting the findings of this study are available from the corresponding author upon reasonable request.

Acknowledgments

The authors extend their sincere gratitude to Miloslav Suchánek, Klára Jindrová, Jiří Hendrych, Simona Randáková, Alice Vagenknechtová, and Lucie Kochánková for their valuable advice and guidance. The graphical abstract was created in BioRender. Mcgachy, L. (2024) BioRender.com/f03s536, accessed on 24 October 2024. The authors acknowledge that ChatGPT (powered by OpenAI’s language model, GPT-4; http://openai.com, accessed on 24 October 2024) was used to improve the English. Editing was performed by the authors.

Conflicts of Interest

The authors declare no conflicts of interest. The funder had no role in the design of the study, in the collection, analysis, or interpretation of data, in the writing of the manuscript, or in the decision to publish the results.

References

  1. Li, Z.; Bowman, R.S. Sorption of Perchloroethylene by Surfactant-Modified Zeolite as Controlled by Surfactant Loading. Environ. Sci. Technol. 1998, 32, 2278–2282. [Google Scholar] [CrossRef]
  2. Lee, Y.-G.; Park, J.-H. Effect of soil organic carbon on sorption and desorption of perchloroethylene in soils. Korean J. Chem. Eng. 2013, 30, 345–350. [Google Scholar] [CrossRef]
  3. Schwarzenbach, R.P.; Gschwend, P.M.; Imboden, D.M. Environmental Organic Chemistry; John Wiley & Sons: Hoboken, NJ, USA, 2016. [Google Scholar]
  4. Zhu, Z.W.; Feng, S.J.; Zheng, Q.T.; Chen, H.X.; Wei, H. Analytical model for the mitigation of VOC vapor with horizontal permeable reactive barrier in the contaminated site considering non-uniform source. Sci. Total Environ. 2024, 948, 174746. [Google Scholar] [CrossRef]
  5. Chiou, C.T.; Porter, P.E.; Schmedding, D.W. Partition Equilibria of Non-Ionic Organic-Compounds between Soil Organic-Matter and Water. Environ. Sci. Technol. 1983, 17, 227–231. [Google Scholar] [CrossRef]
  6. Chiou, C.T.; Peters, L.J.; Freed, V.H. A Physical Concept of Soil-Water Equilibria for Nonionic Organic Compounds. Science 1979, 206, 831–832. [Google Scholar] [CrossRef] [PubMed]
  7. Rutherford, D.W.; Chiou, C.T.; Kile, D.E. Influence of soil organic matter composition on the partition of organic compounds. Environ. Sci. Technol. 1992, 26, 336–340. [Google Scholar] [CrossRef]
  8. Karickhoff, S.W.; Brown, D.S.; Scott, T.A. Sorption of hydrophobic pollutants on natural sediments. Water Res. 1979, 13, 241–248. [Google Scholar] [CrossRef]
  9. Schwarzenbach, R.P.; Westall, J. Transport of Non-Polar Organic-Compounds from Surface-Water to Groundwater—Laboratory Sorption Studies. Environ. Sci. Technol. 1981, 15, 1360–1367. [Google Scholar] [CrossRef]
  10. Young, T.M.; Weber, W.J.J. A distributed reactivity model for sorption by soils and sediments. 3. Effects of diagenetic processes on sorption energetics. Environ. Sci. Technol. 1995, 29, 92–97. [Google Scholar] [CrossRef] [PubMed]
  11. Ball, W.P.; Roberts, P.V. Long-Term Sorption of Halogenated Organic-Chemicals by Aquifer Material. 1. Equilibrium. Environ. Sci. Technol. 1991, 25, 1223–1237. [Google Scholar] [CrossRef]
  12. Pignatello, J.J.; Xing, B. Mechanisms of slow sorption of organic chemicals to natural particles. Environ. Sci. Technol. 1995, 30, 1–11. [Google Scholar] [CrossRef]
  13. Lu, C.; Bjerg, P.L.; Zhang, F.; Broholm, M.M. Sorption of chlorinated solvents and degradation products on natural clayey tills. Chemosphere 2011, 83, 1467–1474. [Google Scholar] [CrossRef]
  14. Itakura, T.; Airey, D.W.; Leo, C.J. The diffusion and sorption of volatile organic compounds through kaolinitic clayey soils. J. Contam. Hydrol. 2003, 65, 219–243. [Google Scholar] [CrossRef] [PubMed]
  15. Jarraya, I.; Fourmentin, S.; Benzina, M.; Bouaziz, S. VOC adsorption on raw and modified clay materials. Chem. Geol. 2010, 275, 1–8. [Google Scholar] [CrossRef]
  16. Bartelt-Hunt, S.L.; Burns, S.E.; Smith, J.A. Nonionic organic solute sorption onto two organobentonites as a function of organic-carbon content. J. Colloid Interface Sci. 2003, 266, 251–258. [Google Scholar] [CrossRef] [PubMed]
  17. Chiou, C.T.; Shoup, T.D. Soil sorption of organic vapors and effects of humidity on sorptive mechanism and capacity. Environ. Sci. Technol. 1985, 19, 1196–1200. [Google Scholar] [CrossRef]
  18. Steinberg, S.M.; Schmeltzer, J.S.; Kreamer, D.K. Sorption of benzene and trichloroethylene (TCE) on a desert soil: Effects of moisture and organic matter. Chemosphere 1996, 33, 961–980. [Google Scholar] [CrossRef]
  19. Smith, J.A.; Chiou, C.T.; Kammer, J.A.; Kile, D.E. Effect of soil moisture on the sorption of trichloroethene vapor to vadose-zone soil at Picatinny Arsenal, New Jersey. Environ. Sci. Technol. 1990, 24, 676–683. [Google Scholar] [CrossRef]
  20. Strenge, D.L.; Peterson, S.R. Chemical Data Bases for the Multimedia Environmental Pollutant Assessment System (MEPAS): Version 1; PNL-7145; Pacific Northwest Laboratory: Richland, WA, USA, 1989. [Google Scholar]
  21. Werth, C.J.; Reinhardt, M. Effects of temperature on trichloroethylene desorption from silica gel and natural sediments. 2. Kinetics. Environ. Sci. Technol. 1997, 31, 3339. [Google Scholar] [CrossRef]
  22. Shapiro, A.M.; Evans, C.E.; Hayes, E.C. Porosity and pore size distribution in a sedimentary rock: Implications for the distribution of chlorinated solvents. J. Contam. Hydrol. 2017, 203, 70–84. [Google Scholar] [CrossRef] [PubMed]
  23. Poe, S.H.; Valsaraj, K.T.; Thibodeaux, L.J.; Springer, C. Equilibrium vapor phase adsorption of volatile organic chemicals on dry soils. J. Hazard Mater 1988, 19, 17–32. [Google Scholar] [CrossRef]
  24. Spohn, M.; Diáková, K.; Aburto, F.; Doetterl, S.; Borovec, J. Sorption and desorption of organic matter in soils as affected by phosphate. Geoderma 2022, 405, 115377. [Google Scholar] [CrossRef]
  25. Schüürmann, G.; Ebert, R.-U.; Kühne, R. Prediction of the sorption of organic compounds into soil organic matter from molecular structure. Environ. Sci. Technol. 2006, 40, 7005–7011. [Google Scholar] [CrossRef] [PubMed]
  26. Ottosen, C.B.; Rønde, V.; McKnight, U.S.; Annable, M.D.; Broholm, M.M.; Devlin, J.F.; Bjerg, P.L. Natural attenuation of a chlorinated ethene plume discharging to a stream: Integrated assessment of hydrogeological, chemical and microbial interactions. Water Res. 2020, 186, 116332. [Google Scholar] [CrossRef] [PubMed]
  27. Cornelissen, G.; Gustafsson, Ö.; Bucheli, T.D.; Jonker, M.T.; Koelmans, A.A.; Van Noort, P.C. Extensive sorption of organic compounds to black carbon, coal, and kerogen in sediments and soils: Mechanisms and consequences for distribution, bioaccumulation, and biodegradation. Environ. Sci. Technol. 2005, 39, 6881–6895. [Google Scholar] [CrossRef]
  28. Wang, G.; Allen-King, R.M.; Choung, S.; Feenstra, S.; Watson, R.; Kominek, M. A Practical Measurement Strategy to Estimate Nonlinear Chlorinated Solvent Sorption in Low f oc Sediments. Groundw. Monit. Remediat. 2013, 33, 87–96. [Google Scholar] [CrossRef]
  29. Zhang, K.; Liu, S.; Wang, S.; Zhao, M.; Jia, J. Health risk assessment and distribution of VOCs during excavation processes for the remediation of contaminated sites. Hum. Ecol. Risk Assess. Int. J. 2019, 25, 2073–2088. [Google Scholar] [CrossRef]
  30. Ma, W.; Hu, J.; Li, J.; Gao, P.; Okoli, C.P.; Wang, P. Distribution, sources, and health risk assessment of VOCs/SVOCs in soils obtained from petrochemical-contaminated sites in Guangzhou, a subtropical coastal megacity in southern China. J. Clean. Prod. 2023, 426, 139198. [Google Scholar] [CrossRef]
  31. Boethling, R.S.; Mackay, D. Handbook of Property Estimation Methods for Chemicals: Environmental and Health Sciences; Lewis Publishers: Boca Raton, FL, USA, 2000; p. 481. [Google Scholar]
  32. ASTM. Standard Test Method for 24-h Batch-Type Measurement of Contaminant Sorption by Soils and Sediments; American Society for Testing and Materials: Philadelphia, PA, USA, 2008. [Google Scholar]
  33. U.S. Environmental Protection Agency. Site Characterization for Subsurface Remediation. EPA/625/4-91/026; Office of Research and Development, U.S. Environmental Protection Agency: Cincinnati, OH, USA, 1991.
  34. Brusseau, M.L.; Jessup, R.E.; Rao, P.S.C. Sorption kinetics of organic chemicals: Evaluation of gas-purge and miscible-displacement techniques. Environ. Sci. Technol. 1990, 24, 727–735. [Google Scholar] [CrossRef]
  35. Ukalska-Jaruga, A.; Bejger, R.; Smreczak, B.; Podlasiński, M. Sorption of organic contaminants by stable organic matter fraction in soil. Molecules 2023, 28, 429. [Google Scholar] [CrossRef]
  36. Kozerski, G.E.; Kim, J.; Durham, J.A.; Townsend, B. Batch equilibrium experiments and modeling reveal weak temperature dependence of cyclic volatile methylsiloxane sorption in soil/sediment organic carbon-water systems. Sci. Total Environ. 2024, 942, 173541. [Google Scholar] [CrossRef] [PubMed]
  37. Zhang, X.; Gao, B.; Creamer, A.E.; Cao, C.; Li, Y. Adsorption of VOCs onto engineered carbon materials: A review. J. Hazard. Mater. 2017, 338, 102–123. [Google Scholar] [CrossRef]
  38. Durán–Álvarez, J.C.; Prado, B.; Ferroud, A.; Juayerk, N.; Jiménez-Cisneros, B. Sorption, desorption and displacement of ibuprofen, estrone, and 17β estradiol in wastewater irrigated and rainfed agricultural soils. Sci. Total Environ. 2014, 473, 189–198. [Google Scholar] [CrossRef] [PubMed]
  39. Roy, W.R. Technical Resource Document: Batch-Type Procedures for Estimating Soil Adsorption of Chemicals; Office of Solid Waste and Emergency Response, US Environmental Protection Agency: Washington, DC, USA, 1992.
  40. OECD. Test No. 106. Adsorption-Desorption using a batch equilibrium method. In OECD Guidelines for the Testing of Chemicals; Organisation for Economic Cooperation and Development Publishing: Paris, France, 2000. [Google Scholar]
  41. Addinsoft. XLSTAT Tutorials and Guides. 2018. Available online: https://www.xlstat.com (accessed on 30 June 2020).
  42. Castaldi, P.; Santona, L.; Enzo, S.; Melis, P. Sorption processes and XRD analysis of a natural zeolite exchanged with Pb2+, Cd2+ and Zn2+ cations. J. Hazard. Mater. 2008, 156, 428–434. [Google Scholar] [CrossRef]
  43. Hong, H.; Liu, C.; Li, Z. Chemistry of soil-type dependent soil matrices and its influence on behaviors of pharmaceutical compounds (PCs) in soils. Heliyon 2023, 9, e22931. [Google Scholar] [CrossRef]
  44. Sassman, S.A.; Lee, L.S. Sorption of three tetracyclines by several soils: Assessing the role of pH and cation exchange. Environ. Sci. Technol. 2005, 39, 7452–7459. [Google Scholar] [CrossRef] [PubMed]
  45. Karickhoff, S.W. Organic Pollutant Sorption in Aquatic Systems. J. Hydraul. Eng. Asce 1984, 110, 707–735. [Google Scholar] [CrossRef]
  46. LaGrega, M.D.; Buckingham, P.L.; Evans, J.C. Hazardous Waste Management; Waveland Press: Long Grove, IL, USA, 2010. [Google Scholar]
  47. Kret, E.; Kiecak, A.; Malina, G.; Nijenhuis, I.; Postawa, A. Identification of TCE and PCE sorption and biodegradation parameters in a sandy aquifer for fate and transport modelling: Batch and column studies. Environ. Sci. Pollut. Res. 2015, 22, 9877–9888. [Google Scholar] [CrossRef]
  48. Allen-King, R.M.; Grathwohl, P.; Ball, W.P. New modeling paradigms for the sorption of hydrophobic organic chemicals to heterogeneous carbonaceous matter in soils, sediments, and rocks. Adv. Water Resour. 2002, 25, 985–1016. [Google Scholar] [CrossRef]
  49. Huang, W.; Yu, Z.; Fu, J. Effects of organic matter heterogeneity on sorption and desorption of organic contaminants by soils and sediments. Appl. Geochem. 2003, 18, 955–972. [Google Scholar] [CrossRef]
  50. Tenny, S.; Abdelgawad, I. Statistical Significance; StatPearls Publishing: Treasure Island, FL, USA, 2017. [Google Scholar]
  51. Allen-King, R.M.; Groenevelt, H.; Warren, C.J.; Mackay, D.M. Non-linear chlorinated-solvent sorption in four aquitards. J. Contam. Hydrol. 1996, 22, 203–221. [Google Scholar] [CrossRef]
  52. Allen-King, R.M.; Groenevelt, H.; Mackay, D.M. Analytical Method for the Sorption of Hydrophobic Organic Pollutants in Clay-Rich Materials. Environ. Sci. Technol. 1995, 29, 148–153. [Google Scholar] [CrossRef] [PubMed]
  53. Cheng, H.; Reinhard, M. Sorption of Trichloroethylene in Hydrophobic Micropores of Dealuminated Y Zeolites and Natural Minerals. Environ. Sci. Technol. 2006, 40, 7694–7701. [Google Scholar] [CrossRef] [PubMed]
  54. Chen, Y.; Hu, C.; Deng, D.; Li, Y.; Luo, L. Factors affecting sorption behaviors of tetracycline to soils: Importance of soil organic carbon, pH and Cd contamination. Ecotoxicol. Environ. Saf. 2020, 197, 110572. [Google Scholar] [CrossRef] [PubMed]
  55. Zhang, Z.Y.; Huang, L.; Liu, F.; Wang, M.K.; Fu, Q.L.; Zhu, J. The properties of clay minerals in soil particles from two Ultisols, China. Clays Clay Miner. 2017, 65, 273–285. [Google Scholar] [CrossRef]
  56. Haberhauer, G.; Pfeiffer, L.; Gerzabek, M.H. Influence of molecular structure on sorption of phenoxyalkanoic herbicides on soil and its particle size fractions. J. Agric. Food Chem. 2000, 48, 3722–3727. [Google Scholar] [CrossRef] [PubMed]
  57. Norman, P.; Nilda, M.A.; Pablo, Z.; Maria, B.V. Effect of clay minerals and organic matter on the Cation Exchange Capacity of silt fraction. J. Plant Nutri. Soil Sci. 2000, 163, 47–52. [Google Scholar]
  58. Li, J.; Kobayashi, T. Investigating the Effects of Long-Term Sorption of Chlorinated Volatile Organic Compounds into Sandy Soils on the Difficulty of Desorption. J. Environ. Eng. 2024, 150, 4023098. [Google Scholar] [CrossRef]
Figure 1. Summary of Pearson’s correlation coefficients and corresponding p-values. The heatmap displays the Pearson’s correlation coefficients for all studied parameters, with positive correlations shown in red and negative correlations in blue. The coefficients range from −1 to 1, where −1 indicates a perfect negative linear relationship, 1 indicates a perfect positive linear relationship, and 0 signifies no linear relationship between the variables.
Applsci 14 11761 g001
Figure 2. Biplot of PC1 and PC2 axes (63.77% variance explained): points represent 34 soil samples, vectors represent seven variables (reps. Kd and six soil properties).
Applsci 14 11761 g002
Figure 3. Soil texture triangles: (A) the relative composition of tested soil samples, (B) three soil texture classes identified through AHC analysis.
Applsci 14 11761 g003
Figure 4. Correlation of loadings and score plot with confidence ellipses: (A) the loading plot represents the correlation between the soil properties in the classes and the discriminant functions, (B) the score plot displays soil samples, and their position indicates their score on the discriminant functions. The confidence ellipses (95%) visualize the separation between groups and the variability within each group.
Applsci 14 11761 g004
Figure 5. Comparison of the measured and predicted Kd values of used samples using the multivariate linear regression models for Classes 1, 2 and 3.
Applsci 14 11761 g005
Table 1. Summary of soil properties.
No.Site of OriginSamp. Depth (m)Soil TextureDistribution of Soil Particles ≤ 2 mmρsρbεElemental CompositionSSA
ClaySiltSandOCSiAl
(%)(%)(%)(g cm−3)(g cm−3)(%)(%)(%)(%)(m2 g−1)
1Chotikov4.30loamy sand10.35.184.62.541.3845.80.1237.676.5217.62
2Vestec2.00silt loam2.058.040.02.691.1557.30.2333.4410.9810.27
3Vestec<0.50silt loam6.171.222.72.541.2052.80.4234.2710.63
4Liberec3.50loam25.029.245.82.581.2153.00.1235.089.2413.64
5Liberec3.00sandy loam11.317.771.02.531.2550.50.0734.2010.7110.52
6Kladno3.00sandy clay loam21.827.350.92.431.0059.10.2540.655.30
7Kladno2.50clay loam32.047.420.62.481.1155.30.8135.188.62
8Kladno3.50silt loam20.265.714.12.391.2547.50.5836.788.63
9Svetla n. S.0.30sand2.88.388.92.621.1157.60.1533.348.480.41
10Kladno0.60clay loam28.640.231.22.521.0060.30.6540.655.5740.81
11N. Bydzov silty clay50.044.85.22.541.2949.30.0631.9713.95
12N. Bydzov silty clay44.345.710.02.591.2053.70.2833.289.296.89
13Litvinov silty clay loam35.851.912.32.531.4343.50.1033.8110.281.56
14Jihlava1.30sandy clay loam31.321.247.52.401.2149.60.2035.689.8926.79
15Jihlava5.00loam16.938.944.22.501.2350.90.3227.9214.0136.96
16Jihlava1.20sandy loam18.421.460.22.561.0559.00.5028.6013.82
17Slany0.30clay43.227.329.52.531.1455.10.3133.2912.0046.02
18Struharov1.90loamy sand< 0.117.382.72.451.2549.00.0729.7311.7510.24
19Jihlava1.50clay loam32.340.826.92.541.1554.70.1430.367.1441.91
20Jihlava7.50sandy loam15.022.063.02.451.0855.8<0.0530.396.1118.46
21Jihlava10silt loam11.852.735.52.411.0556.60.2425.2313.3821.24
22Struharov2.00loamy sand3.518.677.92.511.2550.10.1128.5613.14
23Jihlava1.20silt loam13.361.425.32.611.1157.50.1628.1414.26
24Chomutov clay64.927.97.22.050.8061.00.5033.2513.51
25Chomutov clay64.914.720.42.461.0059.40.3033.6013.7264.39
26Slany clay43.227.329.52.561.2551.20.3733.6211.2846.65
27Chomutov clay44.823.931.32.541.1853.60.4633.8411.43
28Jihlava0.80loam15.733.750.62.421.0855.50.2529.0812.27
29Holesov1.20silty clay loam30.065.05.04.091.3467.30.2635.948.9928.35
30Holesov0.50silt loam10.361.927.82.321.2147.60.8135.807.9913.95
31Holesov0.60silty clay loam31.063.06.02.491.4043.80.3135.709.2716.53
32Holesov6.50sandy loam15.524.260.32.431.3345.20.1035.627.86
33Holesov3.00silty clay40.040.020.02.451.2549.20.2234.2011.8635.81
34Holesov6.00sandy loam11.735.153.22.601.2551.8<0.0536.947.28
Note: Clay, Silt, Sand mean clay, silt, sand particles content in samples (w/w%). ρs, ρb, ε is soil particle density, dry bulk density and porosity. Si and Al mean elemental silicon and aluminum content in samples (w/w%).
Table 2. Measured and estimated linear sorption coefficients Kd.
No.Kd (L kg−1)
Estimated
Linear RegressionNo.Kd (L kg−1)
Estimated
Linear Regression
Kd (L kg−1)
Measured
R2Sum of Sq.Kd (L kg−1)
Measured
R2Sum of Sq.
10.440.49±0.040.99162180.250.47±0.070.946382
20.841.08±0.110.963994190.510.92±0.290.92420
31.521.33±0.200.9541044200.180.63±0.320.97363
40.440.83±0.090.99179210.870.66±0.170.8991262
50.250.61±0.100.971135220.400.56±0.260.973247
60.910.90±0.080.8871455230.580.67±0.060.944710
72.940.98±0.110.9461261241.822.27±0.180.983937
82.110.80±0.070.957994251.091.83±0.320.9214601
90.540.38±0.060.89251261.341.44±0.190.9292203
102.361.55±0.990.877899271.671.26±0.190.976788
110.220.40±0.030.99335280.911.15±0.160.9581056
121.020.71±0.140.8791777290.940.76±0.100.941924
130.360.44±0.040.96241302.941.53±0.120.9611722
140.730.87±0.110.96779311.130.88±0.110.9121781
151.160.67±0.150.973755320.360.49±0.020.99722
161.820.84±0.220.955834330.800.89±0.070.984310
171.131.02±0.100.981170340.180.79±0.070.982289
Table 3. Descriptive statistics of input data.
VariableNumber of
Samples
MeanStandard
Deviation
VarianceMinimumMedianMaximum
Kd (L kg−1)340.920.430.180.380.842.27
OC (%)340.280.210.040.050.250.81
Clay (%)3424.917.2296.80.021.064.9
Silt (%)3436.818.1326.75.134.471.2
Sand (%)3438.324.5598.75.031.288.9
Si (%)3433.413.5112.3225.2333.7140.65
Al (%)3410.272.657.055.3010.4614.26
ρs (g cm−3)342.540.290.092.052.534.09
ρb (g cm−3)341.180.130.020.801.211.43
ε (%)3453.25.429.143.553.367.3
SSA (m2 g−1)2124.217.1289.90.419.964.4
Table 4. Summary of Kruskal–Wallis test and corresponding p-values.
VariablesChi-Squared Valuep-Value
OC8.3940.015
Clay23.362<0.001
Silt19.061<0.001
Sand24.964<0.001
Si0.2180.890
Al0.9760.614
ρs0.4350.813
ρb0.5000.829
ε0.5200.771
SSA3.8890.143
Table 5. Mean values of significant soil properties and descriptive statistics of Kd by class.
OC (%)Clay (%)Silt (%)Sand (%)Kd (L kg−1)
ClassMeanMeanMeanMeanMeanStd. Dev.VarianceMinMedianMax
10.1714.2222.8762.920.690.210.050.380.651.15
20.3441.7839.9918.211.100.530.280.400.952.27
30.4110.6161.8127.581.010.360.130.660.941.53
Table 6. Linear regression for prediction of Kd and goodness-of-fit statistics.
Linear Regression ModelUnits
of x
Standard ErrorObservationsR2RMSEMAPE
InterceptSlope
Kd(PCE) = 0.475 + 0.016 SSAm2 g10.1040.003210.5110.27124.5
K d P C E = 0.556 + 127.6   fOC-0.10129.0340.3780.34328.4
K d P C E = 0.598 + 1.27   fClay-0.1140.38340.2600.37434.1
K d P C E = 0.839 + 0.207   fSilt-0.0940.23340.0080.43339.3
K d P C E = 1.199 0.74   fSand-0.1270.28340.1800.39434.4
Note: fOC, fClay, fSilt and fSand mean mass fraction of clay, silt, sand particles in samples.
Table 7. Multivariate linear regression models for predicting Kd and corresponding goodness-of-fit statistics.
ClassModel
1Kd(PCE) = 1.22 + 34.9fOC + 0.05fClay − 0.94fSand
2Kd(PCE) = −0.74 + 131.5fOC + 2.87fClay + 1.01fSand
3Kd(PCE) = 1.44 + 115.3fOC − 5.37fClay − 1.17fSand
Standard ErrorObservationsR2RMSEMAPE
InterceptX1X2X3
10.4134.960.850.47140.6360.14711.3
20.4146.970.780.95140.6980.32928.8
30.2414.400.750.5560.9850.0703.8
Note: X1, X2, X3 means standard error of slope for variable fOC, fClay and fSand.
Disclaimer/Publisher’s Note: The statements, opinions and data contained in all publications are solely those of the individual author(s) and contributor(s) and not of MDPI and/or the editor(s). MDPI and/or the editor(s) disclaim responsibility for any injury to people or property resulting from any ideas, methods, instructions or products referred to in the content.

