Article

A Multi-Mode Recognition Method for Broadband Oscillation Based on Compressed Sensing and EEMD

1
State Grid Gansu Electric Power Research Institute, Lanzhou 730217, China
2
State Grid Gansu Electric Power Company, Lanzhou 730070, China
3
School of New Energy and Power Engineering, Lanzhou Jiaotong University, Lanzhou 730070, China
4
School of Automation and Electrical Engineering Lanzhou Jiaotong University, Lanzhou 730070, China
*
Authors to whom correspondence should be addressed.
Appl. Sci. 2024, 14(24), 11484; https://doi.org/10.3390/app142411484
Submission received: 28 October 2024 / Revised: 28 November 2024 / Accepted: 7 December 2024 / Published: 10 December 2024
(This article belongs to the Special Issue Power System Security and Stability)

Abstract

:
In power systems, the application of wind power generation equipment and power electronic devices leads to an increased frequency of broadband oscillation events, and the detection of oscillation information becomes extremely difficult, due to the limitations of communication bandwidth and the sampling theorem. To ensure the safety and stability of a power system, this paper presents a new recognition method of broadband oscillation information, which combines compressed sensing (CS) technology and an ensemble empirical mode decomposition (EEMD) algorithm to solve the problem of wideband oscillation recognition. Firstly, the broadband oscillation signal data collected by the phasor measuring unit (PMU) is compressed and sampled by a Gaussian random matrix in the substation, then the low-dimensional data obtained is uploaded to the main station. Secondly, in the main station, the subspace pursuit (SP) algorithm is used to reconstruct the low-dimensional signal; the broadband oscillation signal is recovered without losing the main features of the signal. Finally, we use the EEMD algorithm to decompose the reconstructed signal; the intrinsic mode function (IMF) components containing wideband oscillation information are screened by the energy coefficient, and the wideband oscillation information is identified.

1. Introduction

With the growth of the industrial economy, there is an urgent need to solve the problem of balance between the growing global demand for electric energy and environmental pollution. Therefore, in 2020, China proposed the development goal of “carbon peak, carbon neutrality” energy demand and environmental protection [1]. Wind power generation, as a renewable energy technology, can not only meet the needs of industrial development for electric energy but also help reduce environmental pollution. With increasing global attention turning to wind energy, wind power generation technology has been extensively researched and applied [2].
At present, large-scale wind power generation equipment, high-voltage direct-current transmission, direct-current load, and diversified power electronic devices are widely used in power generation systems [3]. Because the stability and immunity of power electronic equipment depend on complex control technology, dynamic interaction between power electronic equipment and also with the HVDC or alternating current (AC) power grid results in broadband oscillation events with a wider range than the traditional oscillation frequency band in power systems [4]. Different from traditional oscillation in terms of oscillation form and the oscillation mechanism, the traditional oscillation frequency band is mainly concentrated at 0.1–2.5 Hz, and the broadband oscillation frequency band covers the range of several Hertz to thousands of Hertz, which has strong time variability and multi-mode capability, and the causes are complex. In terms of oscillation mechanism, traditional oscillations mainly include low-frequency oscillations led by a generator rotor with generator effect and sub-synchronous resonance/oscillation, led by shafting dynamics. Broadband oscillations mainly include low-frequency oscillations, sub-synchronous oscillations, and super-synchronous oscillations, dominated by power electronic devices, as well as mid-high frequency oscillations [5]. Therefore, in order to reduce the harm of broadband oscillation to the power system, higher demands have been set for the detection and identification of broadband oscillation [6].
The two methods for analyzing broadband oscillation are model-driven and data-driven, the former of which includes analytical calculation [7] and numerical simulation [8]. Due to the time-varying and multi-modal nature of broadband oscillation, the causes are complex, and the model-driven method is limited by the establishment of a system model [9] and the accuracy and stability of numerical simulation [10].
At present, with the continuous development of intelligent algorithms and dynamic monitoring technology, this broadband oscillation issues analysis is based on a large volume of system measurement data collected by the wide area measurement system (WAMS) and the phasor measurement unit (PMU). An artificial intelligence algorithm is used to study the broadband oscillation problem. Therefore, in this analysis of broadband oscillation, the data-driven method can be used without the limitations of a system model and numerical simulation accuracy [11].
This oscillation information detection method, based on PMU, analyzes the data collected by the substation, compares the obtained oscillation parameters with the theoretical values, and finally transmits information about the signal frequency and amplitude to the main station [12]. However, the traditional PMU mainly detects oscillation signals in the range of 45~55 Hz near the power frequency [13]; thus, the traditional PMU cannot meet the requirements of the multi-mode and high-frequency detection of broadband oscillation. A broadband oscillation detection method based on the main station is used to centrally analyze the synchronous phasor data uploaded by PMU substations in the whole network and can detect the propagation and development process of broadband oscillation from a global perspective. Although the broadband oscillation method based on a main station is a popular detection method at present, it is limited by the communication bandwidth and the Nyquist sampling theorem, the main station can only monitor and analyze part of the sub-synchronous oscillation signal with a power frequency below 50 Hz, and it is difficult to effectively monitor the whole wideband. In Ref. [14], autoencoders are used to encode and compress PMU data in the substations of a power system and then identify sub-synchronous oscillations. Although the problem of massive data transmission by communication lines is solved, the existing PMU devices need to be improved. In Ref. [15], an adaptive parameter method using a band-pass filter was used to identify the oscillation information of different frequency bands but did not consider robustness to noise. In Ref. [16], an adaptive variational mode decomposition (VMD) method was used to realize the modal identification of broadband oscillation, composed of five signals with different frequencies in a white-noise environment with an amplitude of 0.2, but this method did not include the sampling and processing of high-frequency signals. In Ref. [17], TimesNet and an Autoformer algorithm were combined for dimensionality reduction and the reconstruction of high-dimensional data obtained after high-frequency sampling. The reconstructed signal after dimensionality reduction was processed by convolutional neural network (CNN) technology with deep learning to realize the recognition and location of wide-band oscillation, but it ignores the problems of CNN, such as high data requirements, making it easy to overfit when training data are insufficient. In Ref. [18], particle swarm optimization (PSO) was applied to calculate the parameters of the VMD algorithm to process broadband oscillation signals; this method has good robustness to noise, but there is no discussion on how to collect and process high-frequency signals. Therefore, when using phasor data in a WAMS main station to detect broadband oscillation, firstly, the problem of data transmission must be solved; namely, how to make the data in the substation efficiently transmitted to the master station. Secondly, it is necessary to decompose the broadband oscillation signal effectively in the main station to remove irrelevant and redundant information. Finally, information on oscillation modes is identified simply and effectively.
To address the difficulty of detecting broadband oscillation in a power system, a multi-mode recognition method for broadband oscillation based on compressed sensing subspace pursuit (CS-SP) and ensemble empirical mode decomposition (EEMD) is put forward in this paper. Firstly, we selected a Gaussian random sampling matrix to compress the broadband oscillation data, which overcomes the problem of Nyquist’s theorem and insufficient data sampling and the transmission of data in the communication bandwidth. Secondly, after the main station received the low-dimensional oscillation data, the subspace pursuit (SP) algorithm was used to reconstruct the compressed low-dimensional data, and the original signal was largely recovered. Finally, the recovery signal was decomposed by EEMD, and a set of the intrinsic mode functions (IMFs) of the oscillating signal were obtained. We calculated each IMF energy coefficient and the excess IMF components were removed. The fast Fourier transform (FFT) method was used to analyze the IMF components containing oscillation mode information, to obtain information on broadband oscillation.
The structure of the remaining sections for the paper is as follows: the sampling and reconstruction for broadband oscillation, based on compressed sensing theory, is introduced in Section 2. In Section 3, EEMD is used to decompose and reconstruct the signal. Section 4 introduces the process of oscillation information identification. In Section 5, the theoretical construction signal and simulation measurement signal were analyzed and compared. Section 5 presents our conclusions.

2. Signal Sampling and Reconstruction Using Compressed Sensing

Compressed sensing is also known as sparse sampling [19]. This theory overcomes the limitations of the Nyquist sampling theorem; that is, it can directly collect a small number of samples containing those important features of the power quality signal with a lower sampling rate and can realize the synchronization of data acquisition and compression, thereby greatly reducing the cost of sampling, storage, and transmission. Therefore, in the broadband oscillation analysis of massive power data, as long as the signal is sparse after being transformed into a certain domain by the sparse transform basis, an unrelated measurement matrix can be used to reduce the dimensionality of the broadband oscillation signal, greatly reducing the transmission amount of oscillation data. After uploading, the original broadband oscillation signal can be reconstructed for dispatching the subsequent center analysis.

2.1. Compressed Sampling of Broadband Oscillation Signal

When the signal is compressible or sparse in the transform domain, an observation matrix that is independent of the sparse transform basis can be used to project the original high-dimensional signal into a low-dimensional space, allowing the original signal to be represented by a small amount of observation data [20]. Therefore, the compression and sampling of broadband oscillation signals mainly involve sparse transform basis selection and the sensing matrix calculation.
(1)
Sparse transformation basis selection. Assuming that the broadband signal of length N is compressible, then, under the sparse matrix Ψ , the coefficient vector θ represents the broadband signal x:
x = i = 1 N θ i Ψ i = θ Ψ
where θ represents the coefficient vector and Ψ represents the sparse matrix.
(2)
Compressing the signal. Assuming that the sparsity of the coefficient vector θ is K (K << N), the measurement matrix Φ can be used to compress the broadband signal; the compressed signal is expressed as:
y = Φ x
where y indicates the compressed signal, and the length is M (M << N); the measurement matrix is unrelated to the sparse matrix Ψ .
(3)
Calculating the sensing matrix. The sensing matrix Θ is obtained by inserting Equation (1) into Equation (2).
y = Φ Ψ θ = Θ θ
According to Equation (3), the sensing matrix Θ is determined by Φ and Ψ . The frequency domain coefficient of the broadband oscillation signal is not 0, only at the oscillation point, so it has a certain sparsity in the frequency domain. The discrete data points are transformed into the frequency domain on a discrete cosine transform (DCT) basis. DCT is expressed as follows:
X ( 0 ) = 1 N X ( k ) = 2 N n = 0 N 1 x ( n ) cos ( n + 0.5 ) π N   ( k = 1 , 2 , , N 1 )
In the reconstruction process of the compressed signal y, a Gaussian random matrix unrelated to the sparse matrix Ψ is selected as the measurement matrix Φ , which follows a normal Gaussian distribution.

2.2. Reconstructing a Signal Based on the Subspace Pursuit (SP) Algorithm

The SP algorithm refers to backtracking sequential coding theory [21], and its basic principle is to re-estimate the credibility of all candidates at each iteration. The focus of the SP algorithm is to determine the generation method of k column vectors in subspace. After determining the correct position of subspace, a non-zero sparse approximation of the signal can be calculated by a pseudo-inverse process [22]. The flow of the SP algorithm is as follows:
(1)
Inputting the compressed signal y and sensing matrix Θ .
(2)
Initializing the residual r 0 = y , candidate vector C 0 = ϕ , and index set γ 0 = ϕ , with iteration number i = 1 . ϕ represents the relevant atoms in the sensing matrix.
(3)
Calculating the candidate vector: C i = abs [ Θ T × r 0 ] . C i represents the absolute value of the inner product of the sensing matrix Θ and residual r 0 .
(4)
Finding the position labels of the K largest elements in the candidate vector C i and updating the index set γ t = sup ( C i 1 | K ) Γ , where the position label is Γ = sup ( C i | K ) .
(5)
Updating the estimated value: x i = Θ γ t × y . Θ γ t represents the pseudo-inverse of the updated sensing matrix Θ γ t .
(6)
Selecting the optimal K sparse elements, x i = ( x i ) k , and updating the residual r i = y Θ × x i .
(7)
If r i 1 2 < r i 2 or i < K ,   x ^ = x i , the loop ends; otherwise, i = i + 1 , and we return to Step (3).
(8)
Outputting the x reconstruction estimate x ^ , residual r .

3. Oscillation Signal Decomposition, Based on the EEMD Algorithm

EEMD is a noise-assisted signal analysis method based on empirical mode decomposition (EMD) [23], which overcomes the mode aliasing problem. EEMD decomposes the original signal with Gaussian white noise many times, so that the signal is automatically decomposed to the appropriate reference scales without subjective calculation [24]. After averaging the decomposition results many times, the noises cancel each other out, satisfying the zero mean of white noise. The final intrinsic mode functions (IMFs) are obtained; the decomposition effect is better than with EMD. EEMD can adaptively decompose signals composed of oscillations at different time scales into modal components of different frequencies, mainly because EEMD has strong robustness to noise, the mode aliasing problem is solved in the signal decomposition process, and the calculation of IMFs does not need to rely on the selection of basis functions. The signal decomposition process of EEMD is as follows.
(1)
Given an original signal x ( t ) , add M times the different levels of white noise to the original signal; the m-th added Gaussian white noise is represented as w m ( t ) , and the signal generated after the m th added white noise is x m ( t ) .
x m ( t ) = x ( t ) + w m ( t )   ( m = 1 , 2 , , M )
(2)
The signal generated after each addition of white noise is decomposed by EMD to obtain a corresponding set of IMFs, after which the signal after the M addition of white noise is expressed as follows:
x m ( t ) = m = 1 M d i , m ( t ) + r m ( t )
Adding white noise to the signal multiple times (m times), d i , m ( t ) stands for the i-th IMF generated after EMD decomposition, while r m ( t ) is the residual term obtained after decomposition.
(3)
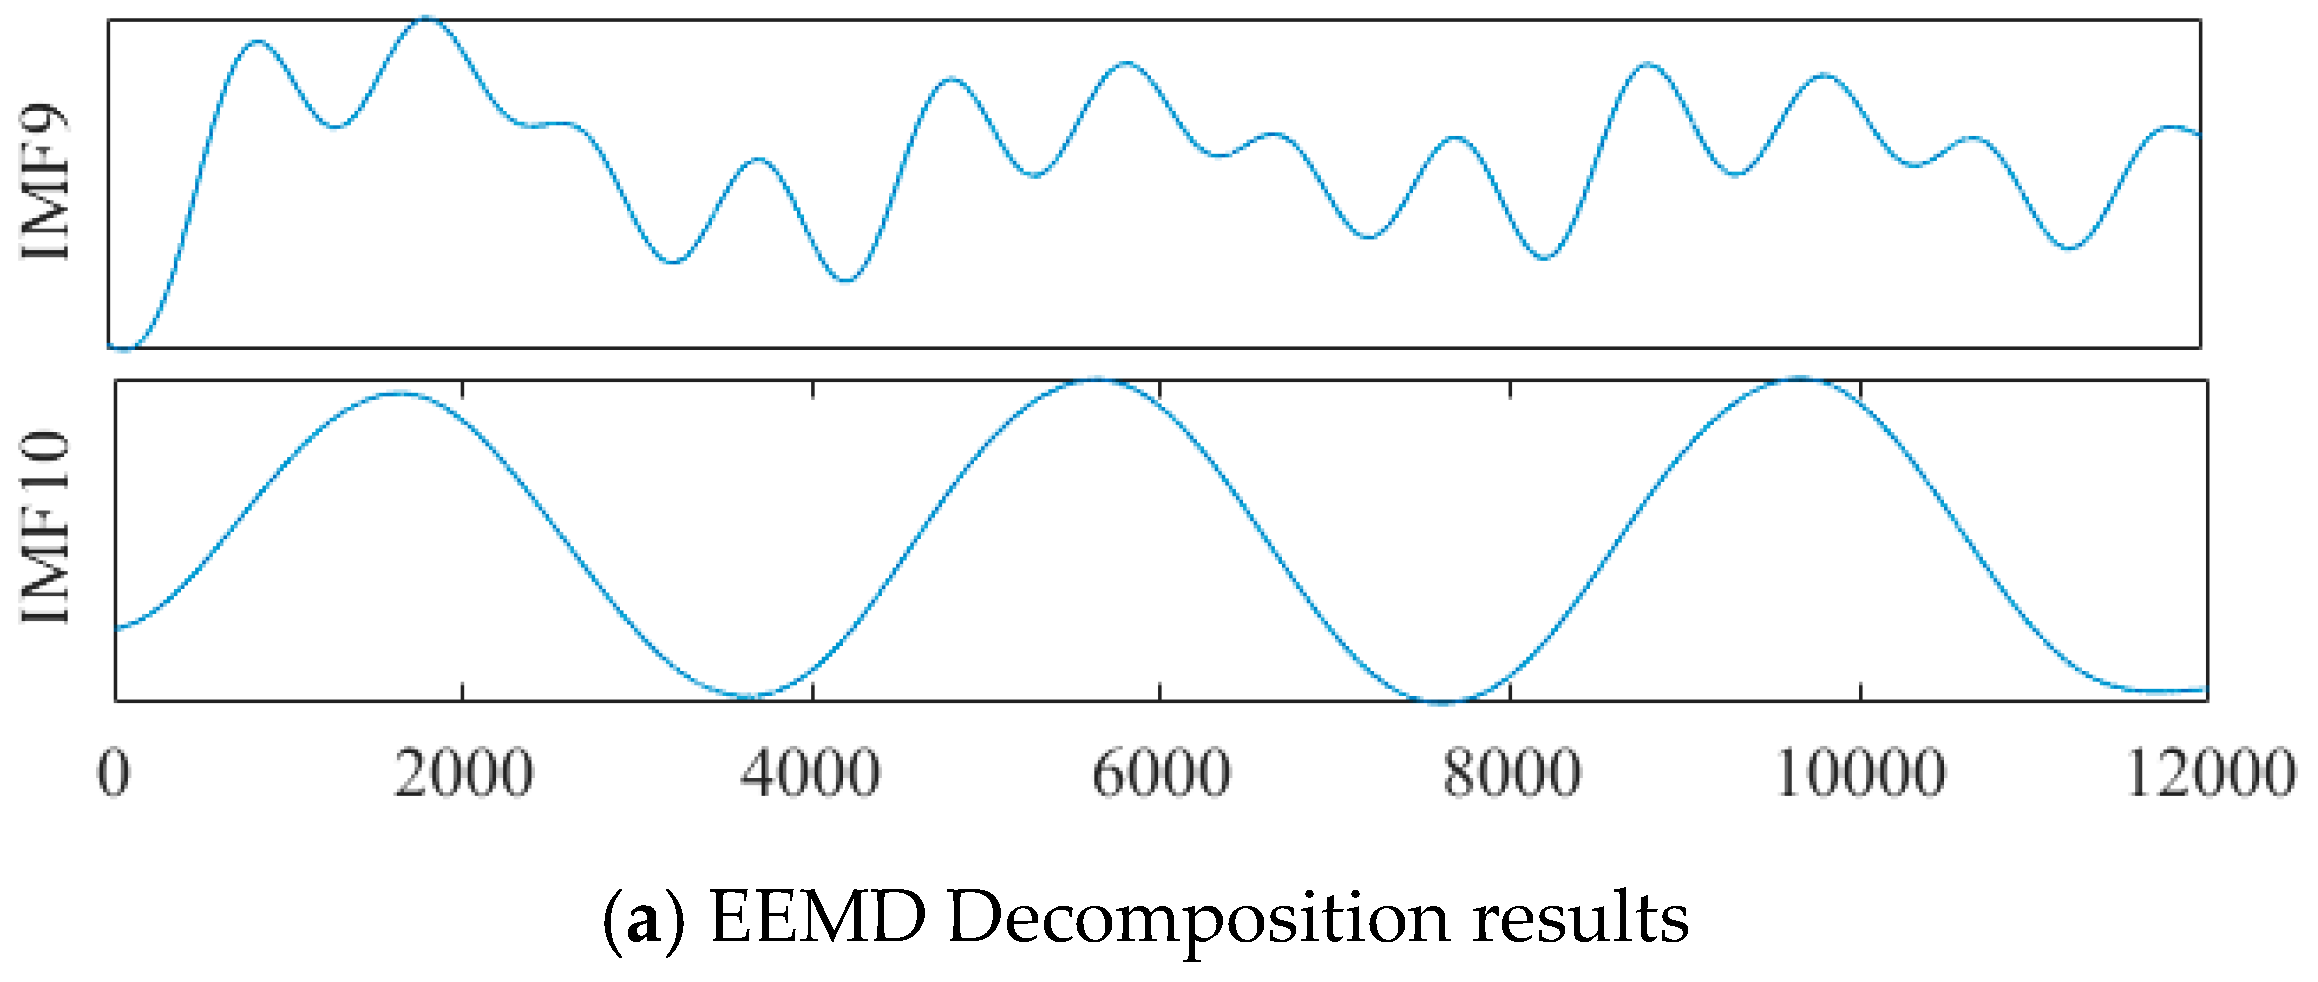
Because the uncorrelated random sequence statistical mean is 0, the above IMF components are averaged to eliminate the impact of multiple additions of white noise on the real IMF components, i.e.,:
d i ( t ) = 1 M m = 1 M d i , m ( t ) r ( t ) = 1 M m = 1 M r m ( t )
where d i ( t ) represents the i th IMF after EEMD decomposition. r ( t ) is the final residual amount obtained after decomposition.

4. Analysis and Comparison of the Results

To prove the accuracy of the abovementioned method, this paper verifies the compression and reconstruction effect of the original broadband oscillation signal and the accuracy of EEMD decomposition of the reconstructed signal, based on the energy coefficient from two aspects: the theoretical model of the multimode broadband oscillation and the simulation test signal.

4.1. Analysis and Comparison, Based on a Theoretical Model

A broadband oscillation signal, consisting of a supersynchronous oscillation and two medium and high-frequency oscillations in addition to the fundamental frequency signal, was constructed. The sampling frequency was 800 Hz, the length of the data was 256, and the theoretical model was constructed as follows.
x ( t ) = 0.85 sin ( 2 π × 50 t ) + 0.2 sin ( 2 π × 75 t ) + 0.5 sin ( 2 π × 200 t ) + 0.6 sin ( 2 π × 400 t )
The SP-based compressed sensing method was used to sample and reconstruct the broadband oscillation signal, and the measurement number M = 30 and the sparsity K = 4 were set. We used the reconstruction error (RE) to measure the compression effect of the compression algorithm on the original data. The smaller the RE, the smaller the gap between the reconstructed data and the original data, and the better the effect of compressed sampling and reconstruction. When the RE = 7.8075 × 10⁻¹⁵, the compressed reconstructed signal is basically consistent with the original signal, as shown in Figure 1, indicating that the proposed compressed sampling and reconstruction algorithm is feasible.
We applied the EEMD to decompose the reconstructed signal. The noise standard deviation was set at 0.2, the test count was 100, and the iterations count was set at 1000. The decomposition results are shown in Figure 2. EEMD decomposes the broadband oscillation signal into a set of IMFs. The IMFs contain different frequency bands, from high to low, of the decomposed signal but the number of IMFs is larger than that of the broadband oscillation mode numbers; thus, it is necessary to eliminate irrelevant IMFs.
Since the energy coefficient of the real mode is larger than that of the false mode, the IMFs containing oscillation information were selected according to each IMF energy coefficient. Table 1 shows the energy coefficient of each IMF; the first three IMFs retain the main information of the oscillation modes, while the rest are irrelevant IMFs that need to be omitted.
Finally, FFT was used to calculate the oscillation information of the first three IMFs. The test results in Figure 3 show that this technique can accurately identify the oscillation frequency.
To prove the robustness of the abovementioned method to noise, white noise at about 30 dB, 25 dB, 20 dB, and 15 dB was added to the constructed signal. The proposed method was used to compress and reconstruct the broadband oscillation signal with different signal-to-noise ratios (SNRs). The reconstruction error between the reconstructed and original signal, as well as the reconstructed signal SNR, were calculated as shown in Figure 4.
With the increase in SNR, the noise component in the signal decreased, the RE after compression and reconstruction also gradually decreased, and the reconstructed SNR increased. When the SNR was 15 dB, the RE was 0.19, and the reconstructed SNR was 19.2044 dB. The proposed compressed sensing algorithm, based on SP, not only has good robustness to noise but also has a good de-noising effect.
Working according to the proposed method, the identification results of the frequency and amplitude of each oscillation mode in signals with different SNRs are shown in Table 2, indicating that the method is feasible in terms of broadband oscillation signal identification.

4.2. Analysis and Comparison Based on Measurement Signals

A wind farm model consisting of six wind turbines was established. Each wind turbine was connected to a 25 kV distribution system through a corresponding transformer and output power to a 120 kV grid through a 30 km 25 kV feeder. The simplified model is shown in Figure 5. It was run in discrete mode with a sampling time of 1 × 10⁻⁵ s and a running time of 0.2 s.
The voltage waveform of 0.02–0.08 s (12,000 points in total) when the broadband oscillation occurred was collected. After compressed sampling by a Gaussian random matrix, it was transmitted to the main station, then the compressed sampled data were reconstructed according to the SP algorithm. Figure 6 shows a comparison between the reconstructed and original signals. The RE was 0.1263, and the basic shape of the original signal was restored.
EEMD was used to decompose the reconstructed signals, and a set of IMFs was obtained. Any irrelevant IMF components were eliminated by the energy coefficient, and IMF components containing broadband oscillation information were retained. Finally, FFT was used to calculate each IMF component. In addition to a 50 Hz fundamental frequency, there was also 150 Hz and 200 Hz medium and high-frequency oscillation information in the measured signal, as shown in Figure 7.

5. Comparison with Advanced Methods

In order to highlight the novelty and superiority of the proposed method, the identification results of frequency and amplitude were compared with several advanced methods, as shown in Table 3.
As Table 3 shows, the method proposed in this paper, CS-SP-EEMD, accurately identifies frequencies in noisy environments. The ABPF method uses an adaptive bandpass filter (ABPF) to identify the frequency accurately, but it does not consider the interference of noise, and the amplitude recognition of each mode has different degrees of error when the amplitude is constant [15]. The IA-VMD method uses the adaptive variational mode decomposition method to identify wideband oscillating signals with five different modes in a white noise environment with an amplitude of 0.2, but there are errors in the frequency and amplitude [16]. Although the PSO-VMD method [17], which uses particle swarm optimization (PSO) to improve VMD, satisfies the robustness to noise criterion, there are also errors in the identification of frequency and amplitude. In addition, the above three methods do not involve the sampling and processing of high-frequency signals.

6. Conclusions

Due to the limitations of communication bandwidth and the Nyquist sampling theorem in data sampling and transmission, the global broadband oscillation in power systems is difficult to detect and identify. A broadband oscillation recognition method based on CS and EEMD is proposed herein. This paper focuses on the compressed sampling and reconstruction of broadband oscillation signals, as well as the EEMD decomposition of reconstructed signals. The results are as follows:
(1)
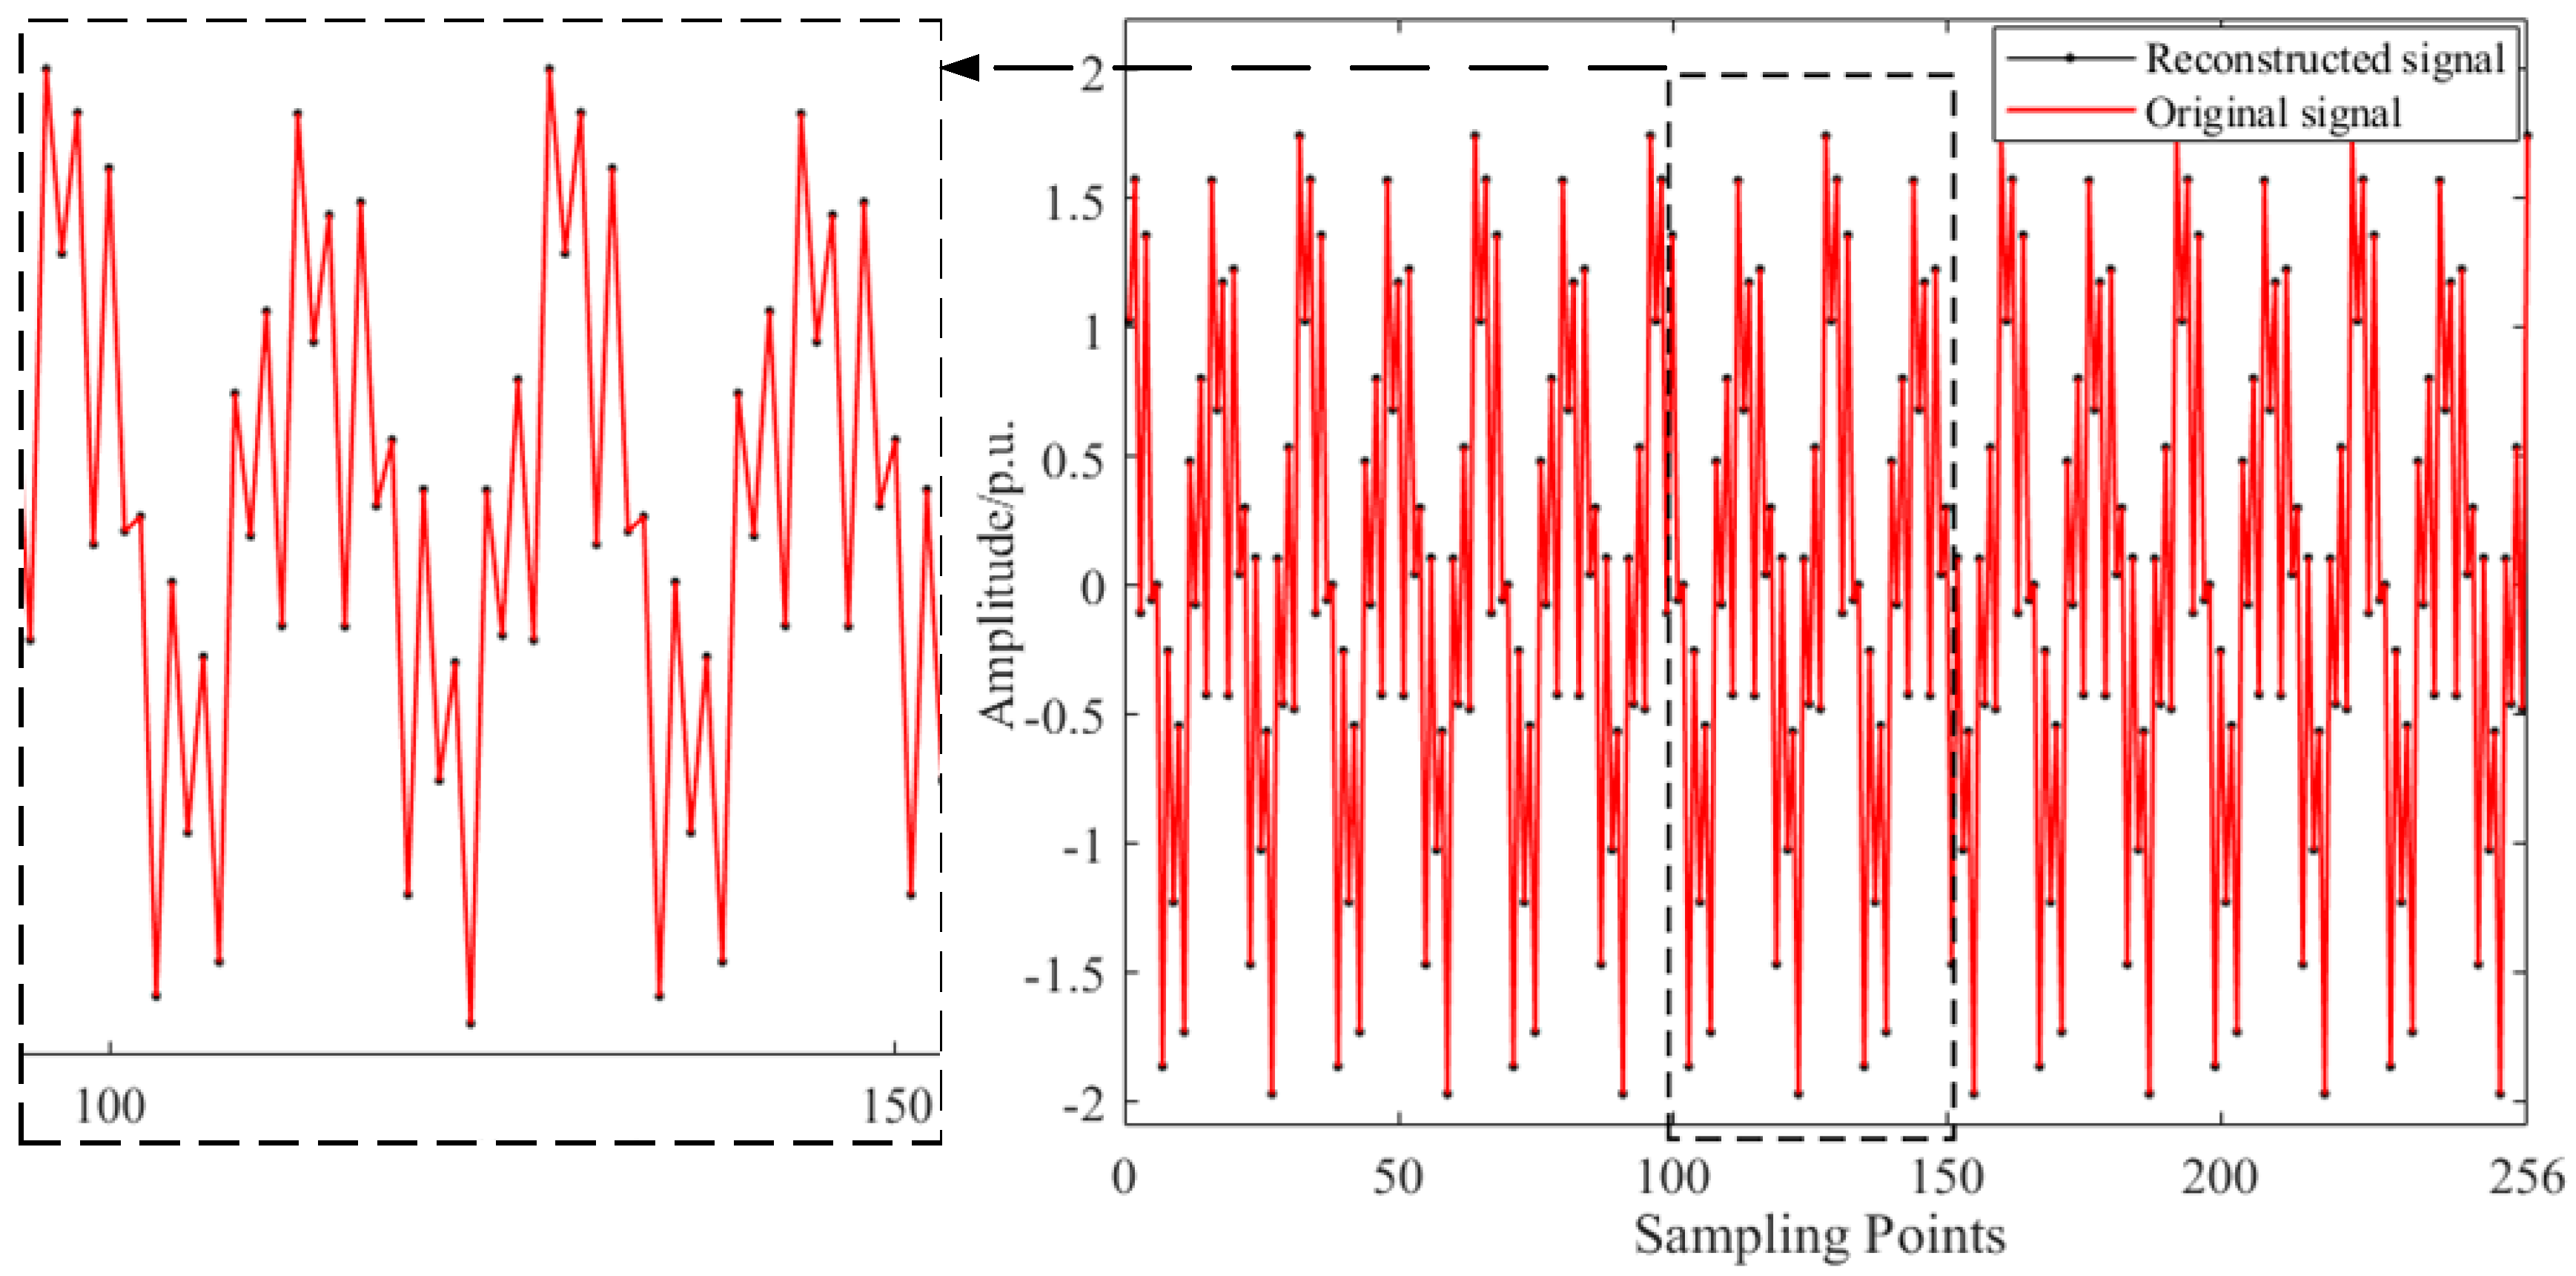
In the substation, due to the limitations of communication bandwidth and transmission rate, the collected broadband oscillation signal cannot be transmitted to the main station. After the original data are converted to low-dimensional data by compressed sampling and are transmitted to the main station, the compressed sampled signal is reconstructed by the SP algorithm. The main station analyzes the reconstructed signal and can identify the original signal oscillation information.
(2)
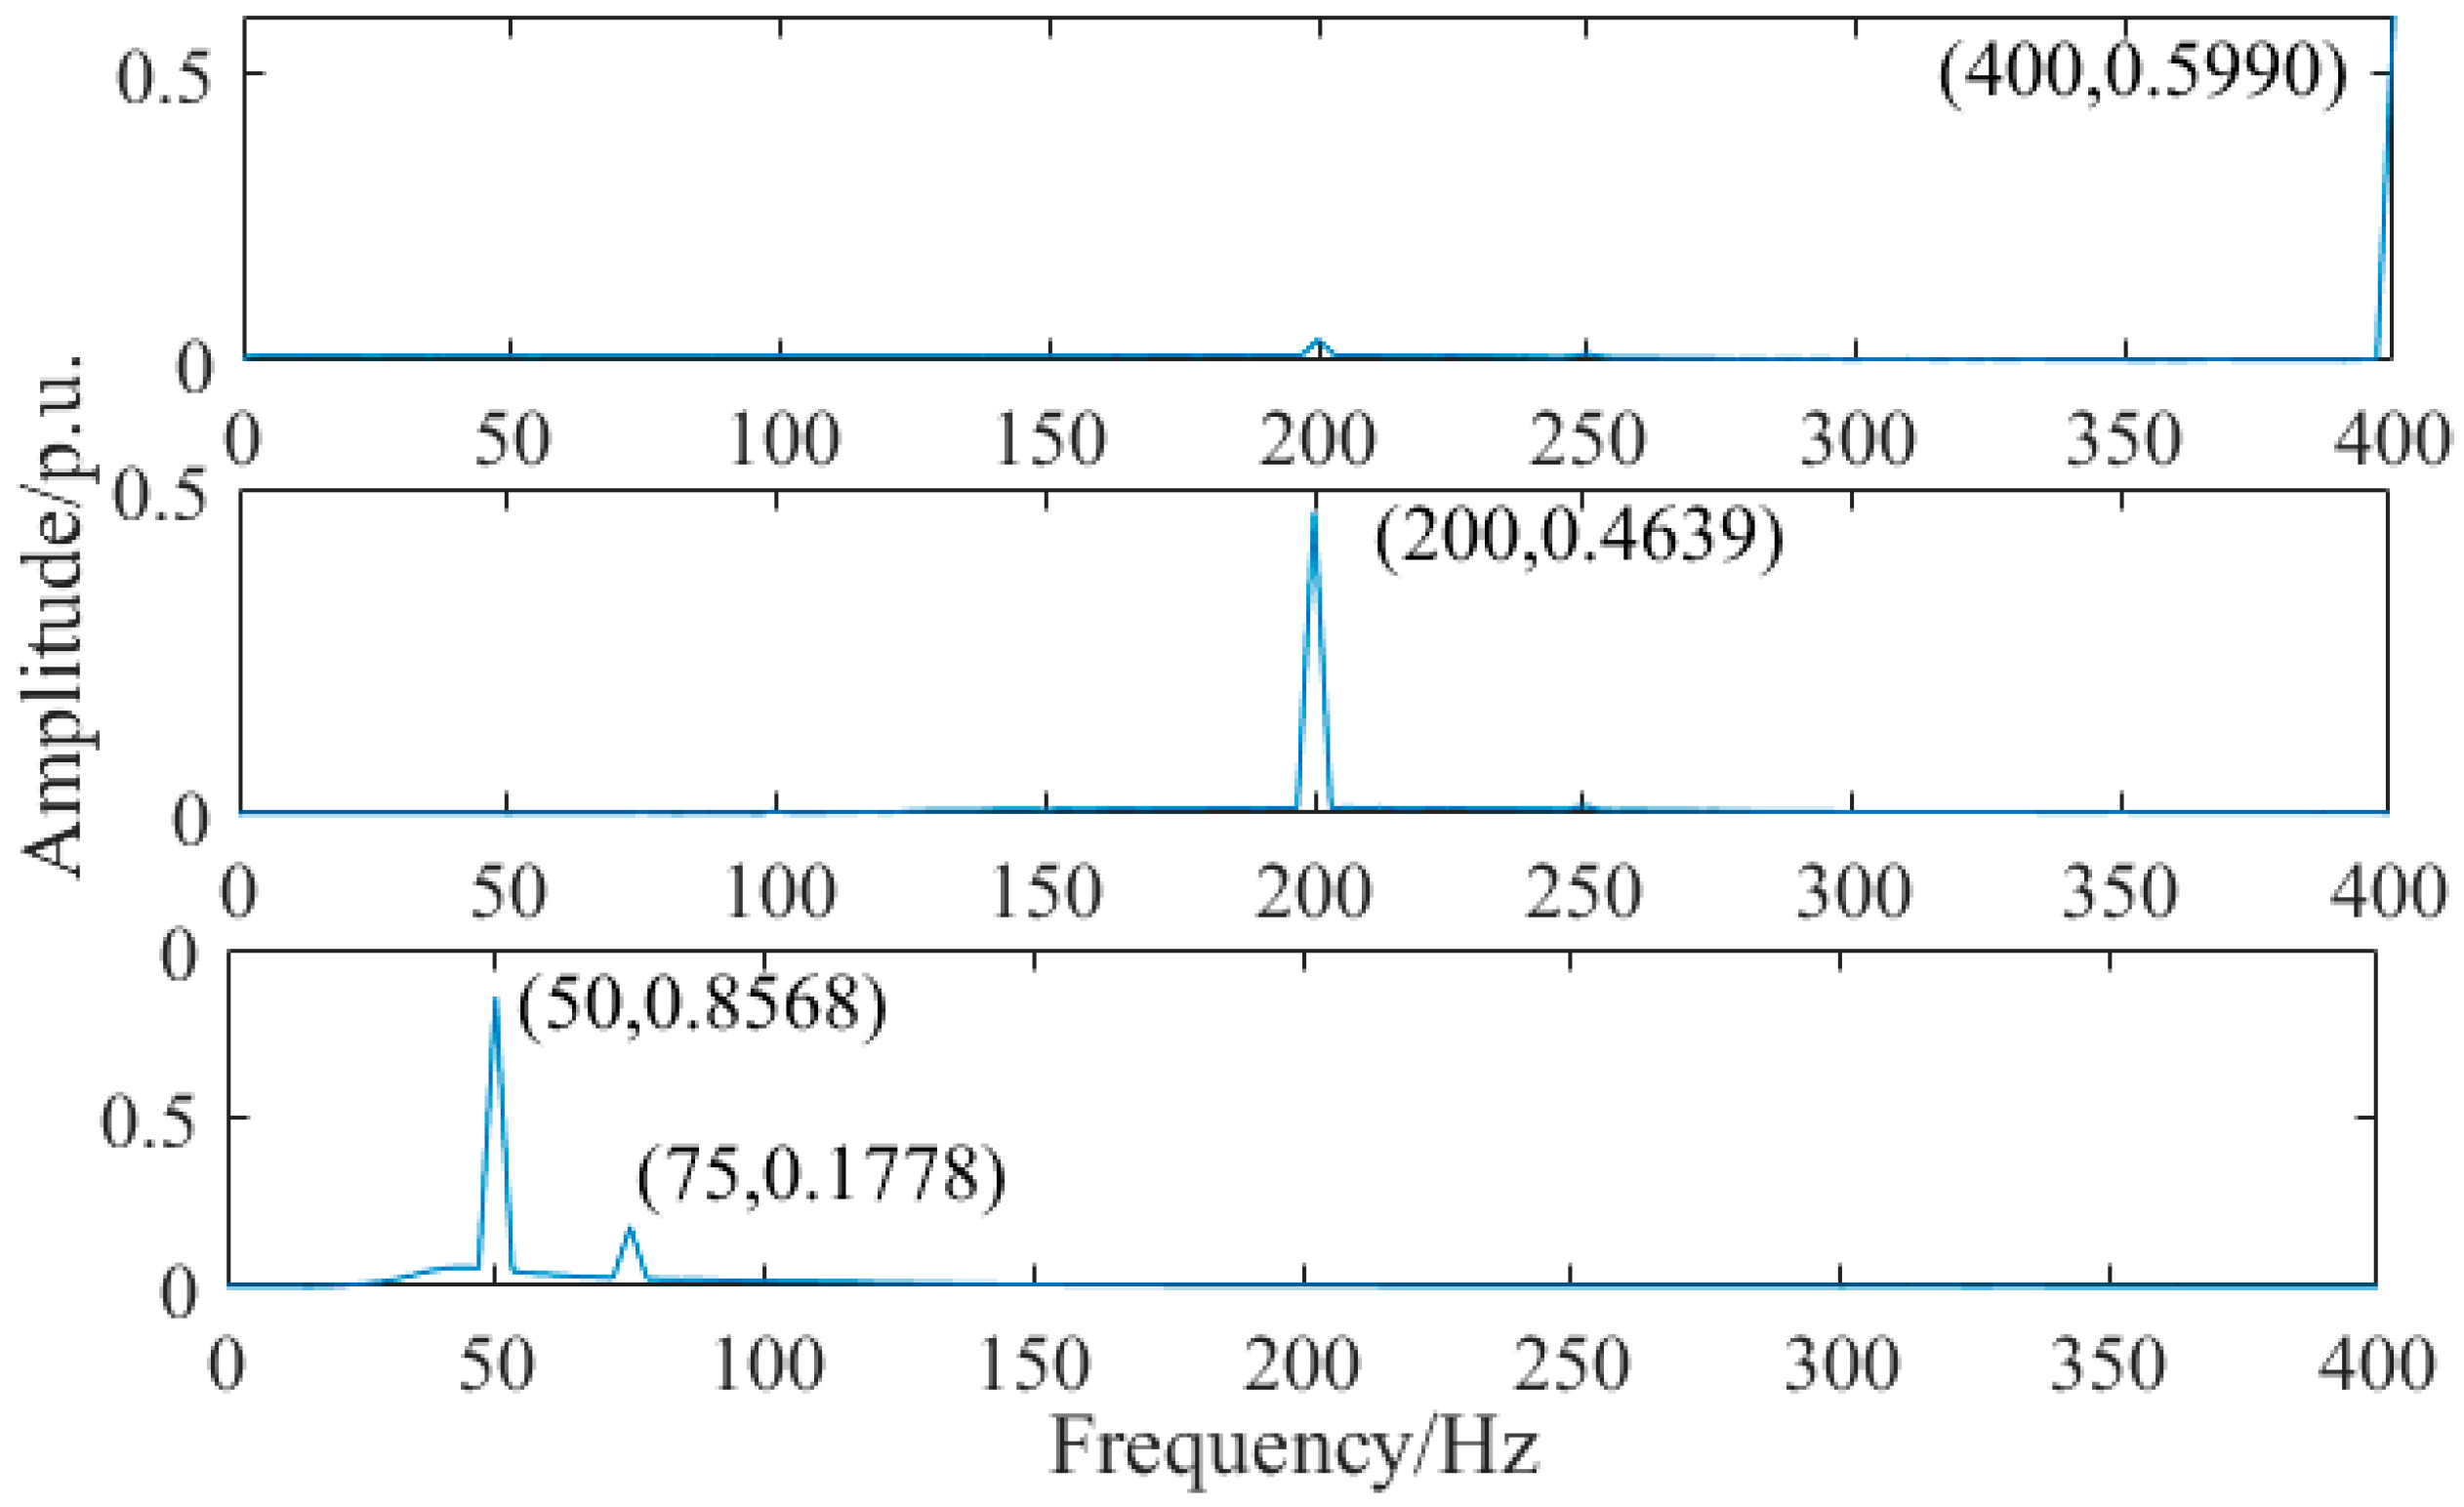
EEMD is performed on the reconstructed signal to generate a set of IMFs containing false components, and IMF components containing oscillation information are screened out using the energy coefficient. Finally, the information on broadband oscillation is accurately calculated by FFT.
In this paper, the method is verified by the construction signal and the simulated measurement signal. Under different SNRs, the wideband oscillating signal is compressed, sampled, and reconstructed effectively, the original oscillation information is retained, and the reconstructed signal’s SNR is improved. The results show that the mentioned compressed sampling reconstruction algorithm is robust to noise and has a good denoising effect. EEMD can adaptively decompose the reconstructed signal, eliminate the false IMF component, and only retain the IMF component containing oscillation information, which shows the effectiveness and accuracy of the proposed broadband oscillation identification method.
In the field of oscillation detection and its identification in power systems, it is essential to accurately identify the oscillation information, and the importance of fast calculation speed cannot be ignored. This can ensure that the power system can respond to oscillation immediately, and effectively avoid the risk of worsening the instability caused by the response delay. Conversely, if the calculation speed is slow, when the oscillation is detected and the alarm is triggered, the instability may have already spread, and the effectiveness of subsequent response measures will be greatly reduced. Therefore, in-depth exploration and the optimization of computing speed are crucial to improve the level of the power system when handling oscillation problems, which will also become a core topic in future work, to be enriched and strengthened in subsequent research.
In addition, integration of the proposed method with other monitoring systems is also an important research direction, especially regarding modern intelligent monitoring systems, which often involve the fusion and real-time processing of multiple sensor data. The potential for integration with existing monitoring systems can be considered in terms of data compatibility and system integration. In terms of data compatibility, the proposed signal reconstruction technology can remove noise, improve signal quality, and significantly improve data availability when combined with multiple sensors. In terms of system integration, the monitoring system needs multi-source data fusion and collaboration. This technology can process and integrate signals from different devices or sensors to improve global monitoring capabilities, especially in terms of integrating with large-scale monitoring systems. This method can achieve good compression and the reconstruction of big data. These are also problems that need further study.

Author Contributions

Conceptualization, J.G.; Methodology, J.G. and H.X.; Software, H.X. and Y.Y.; Validation, Y.Y.; Formal analysis, J.G.; Investigation, H.X. and Y.Y.; Resources, J.G.; Data curation, J.G.; Writing—original draft, J.L.; Writing—review & editing, J.L.; Visualization, H.N.; Supervision, H.N.; Project administration, H.D.; Funding acquisition, H.D. All authors have read and agreed to the published version of the manuscript.

Funding

This research was funded by the Technology Project of State Grid Co., Ltd., Gansu Province, China, grant number 522722240004.

Informed Consent Statement

Not applicable.

Data Availability Statement

The original contributions presented in the study are included in the article; further inquiries can be directed to the corresponding author.

Conflicts of Interest

Author Honglei Xu was employed by the company State Grid Gansu Electric Power Company. The remaining authors declare that the research was conducted in the absence of any commercial or financial relationships that could be construed as a potential conflict of interest.

References

  1. Yang, L.; Li, G.; Zhang, Z.; Ma, X.; Zhao, Y. Operations & maintenance optimization of wind turbines integrating wind and aging information. IEEE Trans. Sustain. Energy 2021, 12, 211–221. [Google Scholar]
  2. Ren, Z.; Verma, A.S.; Li, Y.; Teuwen, J.J.; Jiang, Z. Offshore wind turbine operations and maintenance: A state-of-the-art review. Renew. Sustain. Energy Rev. 2021, 144, 110886. [Google Scholar] [CrossRef]
  3. Chen, L.; Xu, S.; Sun, H.; Bi, J.; Song, R.; Yi, J.; Guo, Q. A Survey on Wide-frequency Oscillation for Power Systems with High Penetration of Power Electronics. Proc. CSEE 2021, 41, 2297–2310. [Google Scholar]
  4. Lyu, J.; Cai, X.; Molinas, M. Frequency domain stability analysis of MMC-based HVDC for wind farm integration. IEEE J. Emerg. Sel. Top. Power Electron. 2016, 4, 141–151. [Google Scholar] [CrossRef]
  5. Xu, Q.; Ma, Z.; Li, P.; Jiang, X.; Wang, C. A Refined Taylor-Fourier Transform with Applications to Wideband Oscillation Monitoring. Electronics 2022, 11, 3734. [Google Scholar] [CrossRef]
  6. Ma, N.; Xie, X.; Tang, J.; Chen, L. Wide-area measurement and early warning system for wide-band oscillation in “double-high” power systems. J. Tsinghua Univ. (Sci. Technol.) 2021, 61, 5. [Google Scholar]
  7. Zhang, D.; Wang, Y.; Hu, J.; Ma, S.; He, Q.; Guo, Q. Impacts of PLL on the DFIG-based WTG’s electromechanical response under transient conditions: Analysis and modeling. CSEE J. Power Energy Syst. 2016, 2, 30–39. [Google Scholar] [CrossRef]
  8. Zong, H.; Lyu, J.; Wang, X.; Zhang, C.; Zhang, R.; Cai, X. Grey box aggregation modeling of wind farm for wideband oscillations analysis. Appl. Energy 2021, 283, 116035. [Google Scholar] [CrossRef]
  9. Ma, N.; Xie, X.; He, J.; Wang, H. Review of broadband Oscillation in Renewable and Power Electronics Highly Integrated Power Systems. Proc. CSEE 2020, 40, 15. [Google Scholar]
  10. Wang, W.; Zhu, Y.; Liu, C.; Dong, P.; Hu, T.; Li, B.; Li, Y.; He, F.; Zhang, Y. Realization of Electromagnetic Real-time Simulation of Large-scale Grid Based on HYPERSIM. Power Syst. Technol. 2019, 43, 4. [Google Scholar]
  11. Xu, Y.; Liu, H.; Cheng, Y. Key Influencing Factors on Propagation of Sub-Synchronous Oscillations in AC and DC Grids. Mod. Electr. Power 2024, 41, 219–229. [Google Scholar]
  12. Maheswari, M.; Vanitha, N.S.; Loganathan, N. Wide-Area Measurement Systems and Phasor Measurement Units; Springer: Cham, Switzerland, 2020; pp. 105–126. [Google Scholar]
  13. Xu, S.; Liu, H.; Bi, T. Reference value measurement algorithms for PMU field test and calibration. Proc. CSEE 2020, 40, 3452–3461. (In Chinese) [Google Scholar]
  14. Cui, H.; Feng, S.; Chen, J.; Ye, Y.; Tang, Y.; Lei, J. Wide-area location method of wide-band oscillations based on autoencoder and long short-term memory network. Autom. Electr. Power Syst. 2022, 46, 194–201. [Google Scholar]
  15. Zhong, T.; Yang, H.; Sun, C.; Liu, C.; Chen, J. Adaptive Band-Pass Filter and VMD-Esprit Based Multi-Mode Monitoring Method for Broadband Electromagnetic Oscillation in “Double High” Power Systems. Energies 2023, 16, 3110. [Google Scholar] [CrossRef]
  16. Liu, F.; Lin, S.; Chen, C.; Liu, K.; Zou, R.; Sidorov, D. Identification of Mode Shapes Based on Ambient Signals and the IA-VMD Method. Appl. Sci. 2021, 11, 530. [Google Scholar] [CrossRef]
  17. Guo, C.; Yang, L.; Dai, J.; Chen, B.; Yin, K.; Dai, J. A New Method for the Analysis of Broadband Oscillation Mode of New Energy Stations. Symmetry 2024, 16, 278. [Google Scholar] [CrossRef]
  18. Yan, H.; Tai, K.; Liu, M.; Wang, Z.; Yang, Y.; Zhou, X.; Zheng, Z.; Gao, S.; Wang, Y. A Method for Locating Wideband Oscillation Disturbance Sources in Power Systems by Integrating TimesNet and Autoformer. Electronics 2024, 13, 3250. [Google Scholar] [CrossRef]
  19. Chen, Y.; Liu, Z. The power quality detection and synchrophasor measurement based on compressive sensing. Optik 2023, 272, 169922. [Google Scholar] [CrossRef]
  20. Sun, Y.; Chen, J.; Liu, Q.; Liu, B.; Guo, G. Dual-path attention network for compressed sensing image reconstruction. IEEE Trans. Image Process. 2020, 29, 9482–9495. [Google Scholar] [CrossRef]
  21. Bertsimas, D.; Johnson, N.A.G. Compressed sensing: A discrete optimization approach. Mach. Learn. 2024, 113, 6725–6764. [Google Scholar] [CrossRef]
  22. Ju, M.; Zhao, M.; Han, T.; Liu, H.; Xu, B.; Liu, X. A novel subspace pursuit of residual correlation step algorithm for distributed compressed sensing. Signal Process. 2023, 202, 108747. [Google Scholar] [CrossRef]
  23. Liang, J.; Zhang, K. A Robust Fault Diagnosis Scheme for Converter in Wind Turbine Systems. Electronics 2023, 12, 1597. [Google Scholar] [CrossRef]
  24. Liang, J.; Zhang, K.; Al-Durra, A.; Zhou, D. A novel fault diagnostic method in power converters for wind power generation system. Appl. Energy 2020, 266, 114851. [Google Scholar] [CrossRef]
Figure 1. Comparison between the reconstructed signal and original signal.
Applsci 14 11484 g001
Figure 2. EEMD decomposition results of the reconstructed signal.
Applsci 14 11484 g002
Figure 3. FFT results for the first three IMFs.
Applsci 14 11484 g003
Figure 4. The effect of compression and reconstruction for different SNRs.
Applsci 14 11484 g004
Figure 5. Simplified model for a power generation system composed of six wind turbines.
Applsci 14 11484 g005
Figure 6. Comparison of the broadband oscillation signal with a reconstructed signal.
Applsci 14 11484 g006
Figure 7. The identification results for the measurement signal.
Applsci 14 11484 g007aApplsci 14 11484 g007b
Table 1. The energy coefficient of each IMF.
IMFiIMF1IMF2IMF3IMF4IMF5IMF6IMF7IMF8
Energy coefficient0.36230.10920.39510.74 × 10−44.02 × 10−54.42 × 10−53.57 × 10−41.56 × 10−6
Table 2. Recognition results of broadband oscillation signals with different SNR signals.
Oscillation ModeOscillation InformationTheoretical ValueIdentification Result
(15 dB/20 dB/25 dB/30 dB)
Mode 1Frequency/Hz5050/50/50/50
Amplitude/p.u.0.850.8291/0.8958/0.8573/0.8547
Mode 2Frequency/Hz7575/75/75/75
Amplitude/p.u.0.20.1775/0.1860/0.1814/0.1743
Mode 3Frequency/Hz200200/200/200/200
Amplitude/p.u.0.450.4912/0.4262/0.4771/0.4534
Mode 4Frequency/Hz400400/400/400/400
Amplitude/p.u.0.60.5725/0.6260/0.5761/0.6016
Table 3. Comparison with the existing methods.
MethodsFrequency and ErrorAmplitude and ErrorRobustness to Noise
CS-SP-EEMD50, 75, 200, 400 (0, 0, 0, 0)0.85, 0.2, 0.45, 400
(0.539%, 7.0%, 5.28%, 4.33%)
15 dB–30 dB
ABPF1.5, 25, 300, 400 (0, 0, 0, 0)5, 5, 5, 5
(1.312%, 1.988%, 2.228%, 2.228%)
---
IA-VMD0.68, 1.95, 26.58, 21.94, 93.42
(0, 1.55%, 0.90%, 0.46%, 0.45%)
1.46, 2, 0.49, 0.22, 0.32, 0.2
(6.16%, 0, 2.04%, 9.09%, 0)
White noise with an amplitude of 0.2
PSO-VMD28, 50, 72, 150
(0.0614%, 0.0066%, 0.0125%, 0.036%)
45, 25, 18.5, 8.5
(2.8337%, 0.2691%, 4.2087%, 10.302%)
5 dB–20 dB
Disclaimer/Publisher’s Note: The statements, opinions and data contained in all publications are solely those of the individual author(s) and contributor(s) and not of MDPI and/or the editor(s). MDPI and/or the editor(s) disclaim responsibility for any injury to people or property resulting from any ideas, methods, instructions or products referred to in the content.

