
Influence of Particulate Matter and Carbon Dioxide on Students’ Emotions in a Smart Classroom


Abstract
1. Introduction
1.1. Particulate Matter and Carbon Dioxide
1.2. Importance of Monitoring and Regulation
1.3. Health Effects
1.4. Cognitive Effects
1.5. Effects on Emotions and Mental Health
2. Materials and Methods
2.1. Participants
2.2. Type of Study
2.3. Experimental Procedure
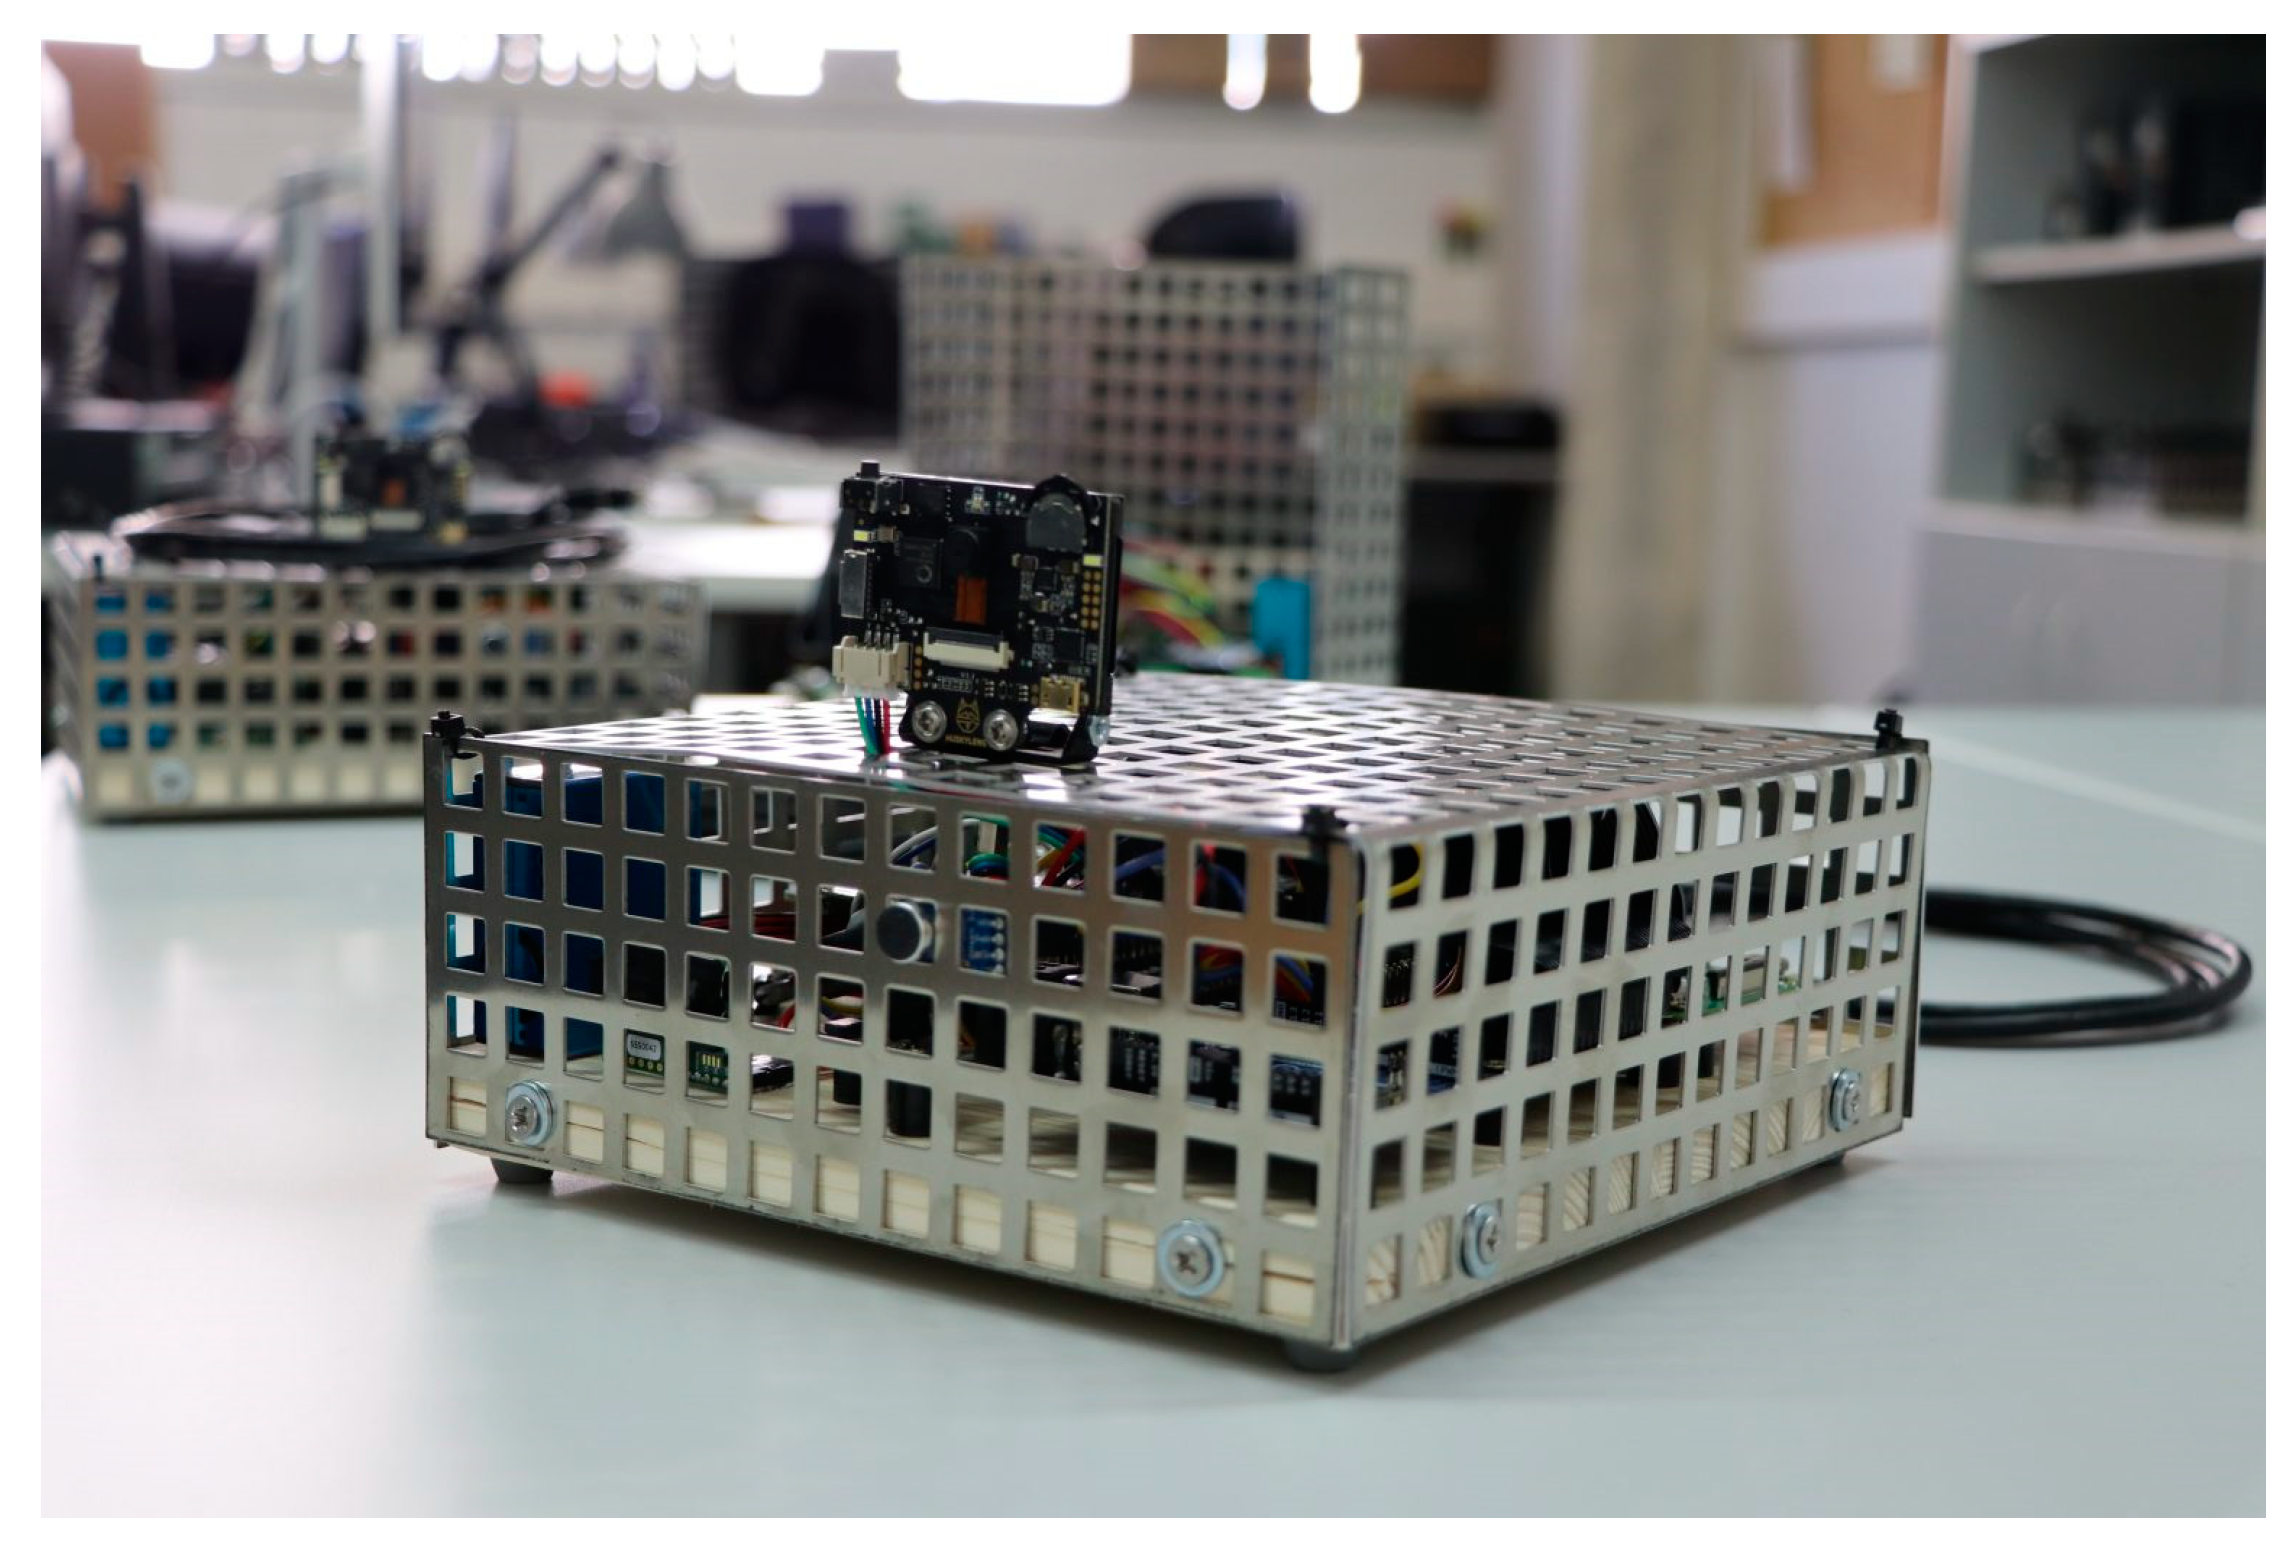
- Classroom setting: The environmental monitoring kit was placed in the classroom, strategically positioned near the entrance to measure key environmental parameters, including CO2 concentration and PM (PM1, PM2.5, and PM10). The device recorded data every 10 min throughout the school day.
- Emotion data collection: During class sessions, a laptop equipped with a camera was used to capture students’ facial expressions. The camera was positioned to cover as many students as possible within its field of view. Videos were recorded and later processed using a custom Python version 3.11.1 code to detect faces and analyze emotions through the Python Facial Expression Analysis Toolbox (Py-Feat) version 0.3.4.
- Data synchronization: Environmental data from the ACTUA-096 kit and emotion data from the facial recognition system were synchronized and stored in a database. This allowed for the analysis of the relationship between environmental conditions and students’ emotions.
- Data analysis: The collected data were then analyzed to identify correlations between the environmental factors and students’ emotions, and to develop regression models that could predict emotional responses based on the environmental variables.
2.4. Emotion Recognition Data Collection
2.5. Environmental Kit Data Collection
2.6. Data Analysis
3. Results
4. Discussion
5. Conclusions
Author Contributions
Funding
Institutional Review Board Statement
Informed Consent Statement
Data Availability Statement
Acknowledgments
Conflicts of Interest
References
- Brink, H.W.; Loomans, M.G.L.C.; Mobach, M.P.; Kort, H.S.M. Classrooms’ Indoor Environmental Conditions Affecting the Academic Achievement of Students and Teachers in Higher Education: A Systematic Literature Review. Indoor Air 2021, 31, 405–425. [Google Scholar] [CrossRef] [PubMed]
- Mogas-Recalde, J. Resum de la tesi doctoral «Smart Classrooms i l’adveniment de la Quarta Revolució Industrial: Anàlisi dels factors clau per al disseny d’aules intel·ligents». UTE Teach. Technol. Univ. Tarracon. 2021, 1, 61. [Google Scholar] [CrossRef]
- Catalina, T.; Ghita, S.A.; Popescu, L.L.; Popescu, R. Survey and Measurements of Indoor Environmental Quality in Urban/Rural Schools Located in Romania. Int. J. Environ. Res. Public Health 2022, 19, 10219. [Google Scholar] [CrossRef]
- Vasile, V.; Catalina, T.; Dima, A.; Ion, M. Pollution Levels in Indoor School Environment-Case Studies. Atmosphere 2024, 15, 399. [Google Scholar] [CrossRef]
- Schraufnagel, D.E. The health effects of ultrafine particles. Exp. Mol. Med. 2020, 52, 311–317. [Google Scholar] [CrossRef]
- Ragazzi, M.; Rada, E.C.; Zanoni, S.; Passamani, G.; Dalla Valle, L. Particulate matter and carbon dioxide monitoring in indoor places. Int. J. Sustain. Dev. Plan. 2017, 12, 1032. [Google Scholar] [CrossRef]
- World Health Organization. WHO Global Air Quality Guidelines: Particulate Matter (PM2.5 and PM10), Ozone, Nitrogen Dioxide, Sulfur Dioxide and Carbon Monoxide; World Health Organization: Geneva, Switzerland, 2021.
- EN 16798-1:2019; Energy Performance Of Buildings—Ventilation for Buildings—Part 1: Indoor Environmental Input Parameters for Design and Assessment of Energy Performance of Buildings Addressing Indoor Air Quality, Thermal Environment, Lighting and Acoustics—Module M1-6. European Committee for Standardization (CEN): Brussels, Belgium, 2019.
- Kapalo, P.; Domnita, F.; Bacoţiu, C.; Spodyniuk, N. The Impact of Carbon Dioxide Concentration on the Human Health—Case Study. J. Appl. Eng. Sci. 2018, 8, 61–66. [Google Scholar] [CrossRef]
- Madureira, J.; Paciência, I.; Pereira, C.; Teixeira, J.P.; Fernandes, E.O. Indoor air quality in Portuguese schools: Levels and sources of pollutants. Indoor Air 2016, 26, 526–537. [Google Scholar] [CrossRef]
- Gao, N.; Marschall, M.; Burry, J.; Watkins, S.; Salim, D.F. Understanding occupants’ behaviour, engagement, emotion, and comfort indoors with heterogeneous sensors and wearables. Sci. Data 2022, 9, 261. [Google Scholar] [CrossRef] [PubMed]
- ASHRAE Technical Committee 9.7. Design Guidance for Education Facilities: Prioritization for Advanced Indoor Air Quality; ASHRAE: Peachtree Corners, GA, USA, 2023. [Google Scholar]
- 2905:2023; Environmental Claim Validation Procedure for Indoor Air Quality (IAQ) Sensor Performance. UL Envi-ronment: Northbrook, IL, USA, 2023.
- Zemitis, J.; Bogdanovics, R.; Bogdanovica, S. The study of CO2 concentration in a classroom during the COVID-19 safety measures. E3S Web Conf. 2021, 246, 01004. [Google Scholar] [CrossRef]
- Marchini, T. Redox and inflammatory mechanisms linking air pollution particulate matter with cardiometabolic derangements. Free Radic. Biol. Med. 2023, 209, 320–341. [Google Scholar] [CrossRef]
- Falcon-Rodriguez, C.I.; Osornio-Vargas, A.R.; Sada-Ovalle, I.; Segura-Medina, P. Aeroparticles, Composition, and Lung Diseases. Front. Immunol. 2016, 20, 3. [Google Scholar] [CrossRef]
- Norbäck, D.; Nordström, K. An experimental study on effects of increased ventilation flow on students’ perception of indoor environment in computer classrooms. Indoor Air 2008, 18, 293–300. [Google Scholar] [CrossRef]
- Deng, S.; Lau, J.; Wang, Z.; Wargocki, P. Associations between illness-related absences and ventilation and indoor PM2.5 in elementary schools of the Midwestern United States. Environ. Int. 2023, 176, 107944. [Google Scholar] [CrossRef]
- Shaughnessy, R.J.; Haverinen-Shaughnessy, U.; Nevalainen, A.; Moschandreas, D. A preliminary study on the association between classroom ventilation rates and student performance. Indoor Air 2006, 16, 465–468. [Google Scholar] [CrossRef]
- Clements-Croome, D.J. Measurements of CO2 levels in a Classroom and its effect on the performance. In Proceedings of the CIBSE ASHRAE Technical Symposium, Imperial College, London, UK, 18–19 April 2012. [Google Scholar]
- Bogdanovica, S.; Zemitis, J.; Bogdanovics, R. The Effect of CO2 Concentration on Children’s Well-Being during the Process of Learning. Energies 2020, 13, 6099. [Google Scholar] [CrossRef]
- Cedeño Laurent, J.G.; MacNaughton, P.; Jones, E.R.; Young, A.S.; Bliss, M.S.; Flanigan, S.; Vallarino, J.; Chen, L.; Cao, X.; Allen, J.G. Associations between acute exposures to PM2.5 and carbon dioxide indoors and cognitive function in office workers: A multicountry longitudinal prospective observational study. Environ. Res. Lett. 2021, 16, 094047. [Google Scholar] [CrossRef]
- Wargocki, P.; Porras-Salazar, J.A.; Contreras-Espinoza, S.; Bahnfleth, W. The relationships between classroom air quality and children’s performance in school. Build. Environ. 2020, 173, 106749. [Google Scholar] [CrossRef]
- Colasanti, A.; Esquivel, G.; Schruers, K.; Griez, E. On the psychotropic effects of carbon dioxide. Curr. Pharm. Des. 2012, 18, 5627–5637. [Google Scholar] [CrossRef]
- Li, Y.; Guan, D.; Yu, Y.; Wen, X.; Chen, W.; Wang, S.; Zhang, X.; Liu, Z. A psychophysical measurement on subjective well-being and air pollution. Nat. Commun. 2019, 10, 5473. [Google Scholar] [CrossRef]
- Shan, S.; Ju, X.; Wei, Y.; Wang, Z. Effects of PM2.5 on People’s Emotion: A Case Study of Weibo (Chinese Twitter) in Beijing. Int. J. Environ. Res. Public Health 2021, 18, 5422. [Google Scholar] [CrossRef]
- Kulebanova, S.; Prodanova, J.; Dedinec, A.; Sandev, T.; Wu, D.; Kocarev, L. Media Sentiment on Air Pollution: Seasonal Trends in Relation to PM10 Levels. Sustainability 2024, 16, 6513. [Google Scholar] [CrossRef]
- Szyszkowicz, M.; Zemek, R.; Colman, I.; Gardner, W.; Kousha, T.; Smith-Doiron, M. Air Pollution and Emergency Department Visits for Mental Disorders among Youth. Int. J. Environ. Res. Public Health 2020, 17, 4190. [Google Scholar] [CrossRef]
- Ng, M.; Gerstorf, D.; Conroy, D.E.; Pincus, A.L.; Ram, N. Affective Sensitivity to Air Pollution (ASAP): Person-specific associations between daily air pollution and affective states. PLoS ONE 2024, 19, e0307430. [Google Scholar] [CrossRef]
- Cakmak, S.; Dales, R.; Blanco, C. Does emotional health influence susceptibility to the physiologic effects of air pollution on adults. Sustain. Dev. Plan. 2016, 11, 537–545. [Google Scholar] [CrossRef]
- Carton, E. Assessing the effect of a classroom IEQ on student satisfaction, engagement and performance. E3S Web Conf. 2023, 396, 01052. [Google Scholar] [CrossRef]
- Llurba, C.; Fretes, G.; Palau, R. Pilot study of real-time Emotional Recognition technology for Secondary school students. Interact. Des. Arch. 2022, 52, 61–80. [Google Scholar] [CrossRef]
- Fretes, G.; Llurba, C.; Palau, R. Influence of teaching activities, environmental conditions and class schedules on teacher stress measured with a smartwatch: A pilot study. J. Technol. Sci. Educ. 2023, 13, 775–787. [Google Scholar] [CrossRef]
- Batista, E.; Huera-Huarte, F.J.; Martínez-Ballesté, A.; Rosell-Llompart, J.; Solanas, A. El Projecte ACTUA: Investigant la Transmissibilitat Dels Virus Respiratoris a Les Aules; Llar Digital: Valencia, Spain, 2023; ISBN 978-84-127552-2-0. [Google Scholar]
- Batista, E.; Villanova, O.; Rosell-Llompart, J.; Huera-Huarte, F.J.; Martínez-Ballesté, A.; Solanas, A. On the Deployment of Low-Cost Sensors to Enable Context-Aware Smart Classrooms. In Applications in Electronics Pervading Industry, Environment and Society LNEE; Springer: Berlin/Heidelberg, Germany, 2023; Volume 1036, pp. 333–338. [Google Scholar] [CrossRef]
- Wang, Z. How Frequent Should We Measure the Indoor Thermal Environment? Build. Environ. 2022, 222, 109464. [Google Scholar] [CrossRef]
- Oh, S.; Song, S. Detailed Analysis of Thermal Comfort and Indoor Air Quality Using Real-Time Multiple Environmental Monitoring Data for a Childcare Center. Energies 2021, 14, 643. [Google Scholar] [CrossRef]
- Longares, J.M.; Mselle, B.D.; Gutiérrez Galindo, J.I.; Ballestín, V. Dynamic Indoor Environmental Quality Assessment in Residential Buildings: Real-Time Monitoring of Comfort Parameters Using LoRaWAN. Energies 2024, 17, 5534. [Google Scholar] [CrossRef]
- Yu, X.; Li, Z.; Zang, Z.; Liu, Y. Real-Time EEG-Based Emotion Recognition. Sensors 2023, 23, 7853. [Google Scholar] [CrossRef]
- Moreno-Moreno, P.; Palau, R. Guía de diseño de Smart Classrooms basada en condiciones ambientales. Rev. Interuniv. Investig. Tecnol. Educ. 2023, 14, 138–158. [Google Scholar] [CrossRef]
- Palau, R.; Mogas, J. Systematic literature review for a characterization of the smart learning environments. In Propuestas Multidisciplinares de Innovación e Intervención Educativa; Cruz, A.M., Aguilar, A.I., Eds.; Universidad Internacional de Valencia: Valencia, Spain, 2019; pp. 55–71. [Google Scholar]


| Category | CO2 Concentration (Above Outdoor, ppm) | CO2 Concentration (Absolute Values, ppm) | Temperature (°C) |
|---|---|---|---|
| 1st (High Quality) | 550 | 1030 | 21–23 |
| 2nd (Moderate Quality) | 800 | 1280 | 20–24 |
| 3rd (Low Quality) | 1350 | 1830 | 19–25 |
| Sensor | Manufacturer | Variable | Unit | Accuracy |
|---|---|---|---|---|
| SCD30 | Sensirion (Stäfa, Switzerland) | Temperature | °C | ±(0.4 °C + 0.023 × (T [°C]—25°C)) |
| SCD30 | Sensirion | Concentration of carbon dioxide | ppm | ±(30 ppm + 3% MV) b |
| PMS5003 | Plantower (Shenzhen, China) | Concentration of PM (PM1, PM2.5, PM10) | μg/m3 | ±10% between 100–500 μg/m3 |
| Durbin–Watson | |||||||||||
|---|---|---|---|---|---|---|---|---|---|---|---|
| Model M1 1 | R | R2 | Adjusted R2 | RMSE | R2 Change | df1 | df2 | p | Autocorrelation | Statistic | p |
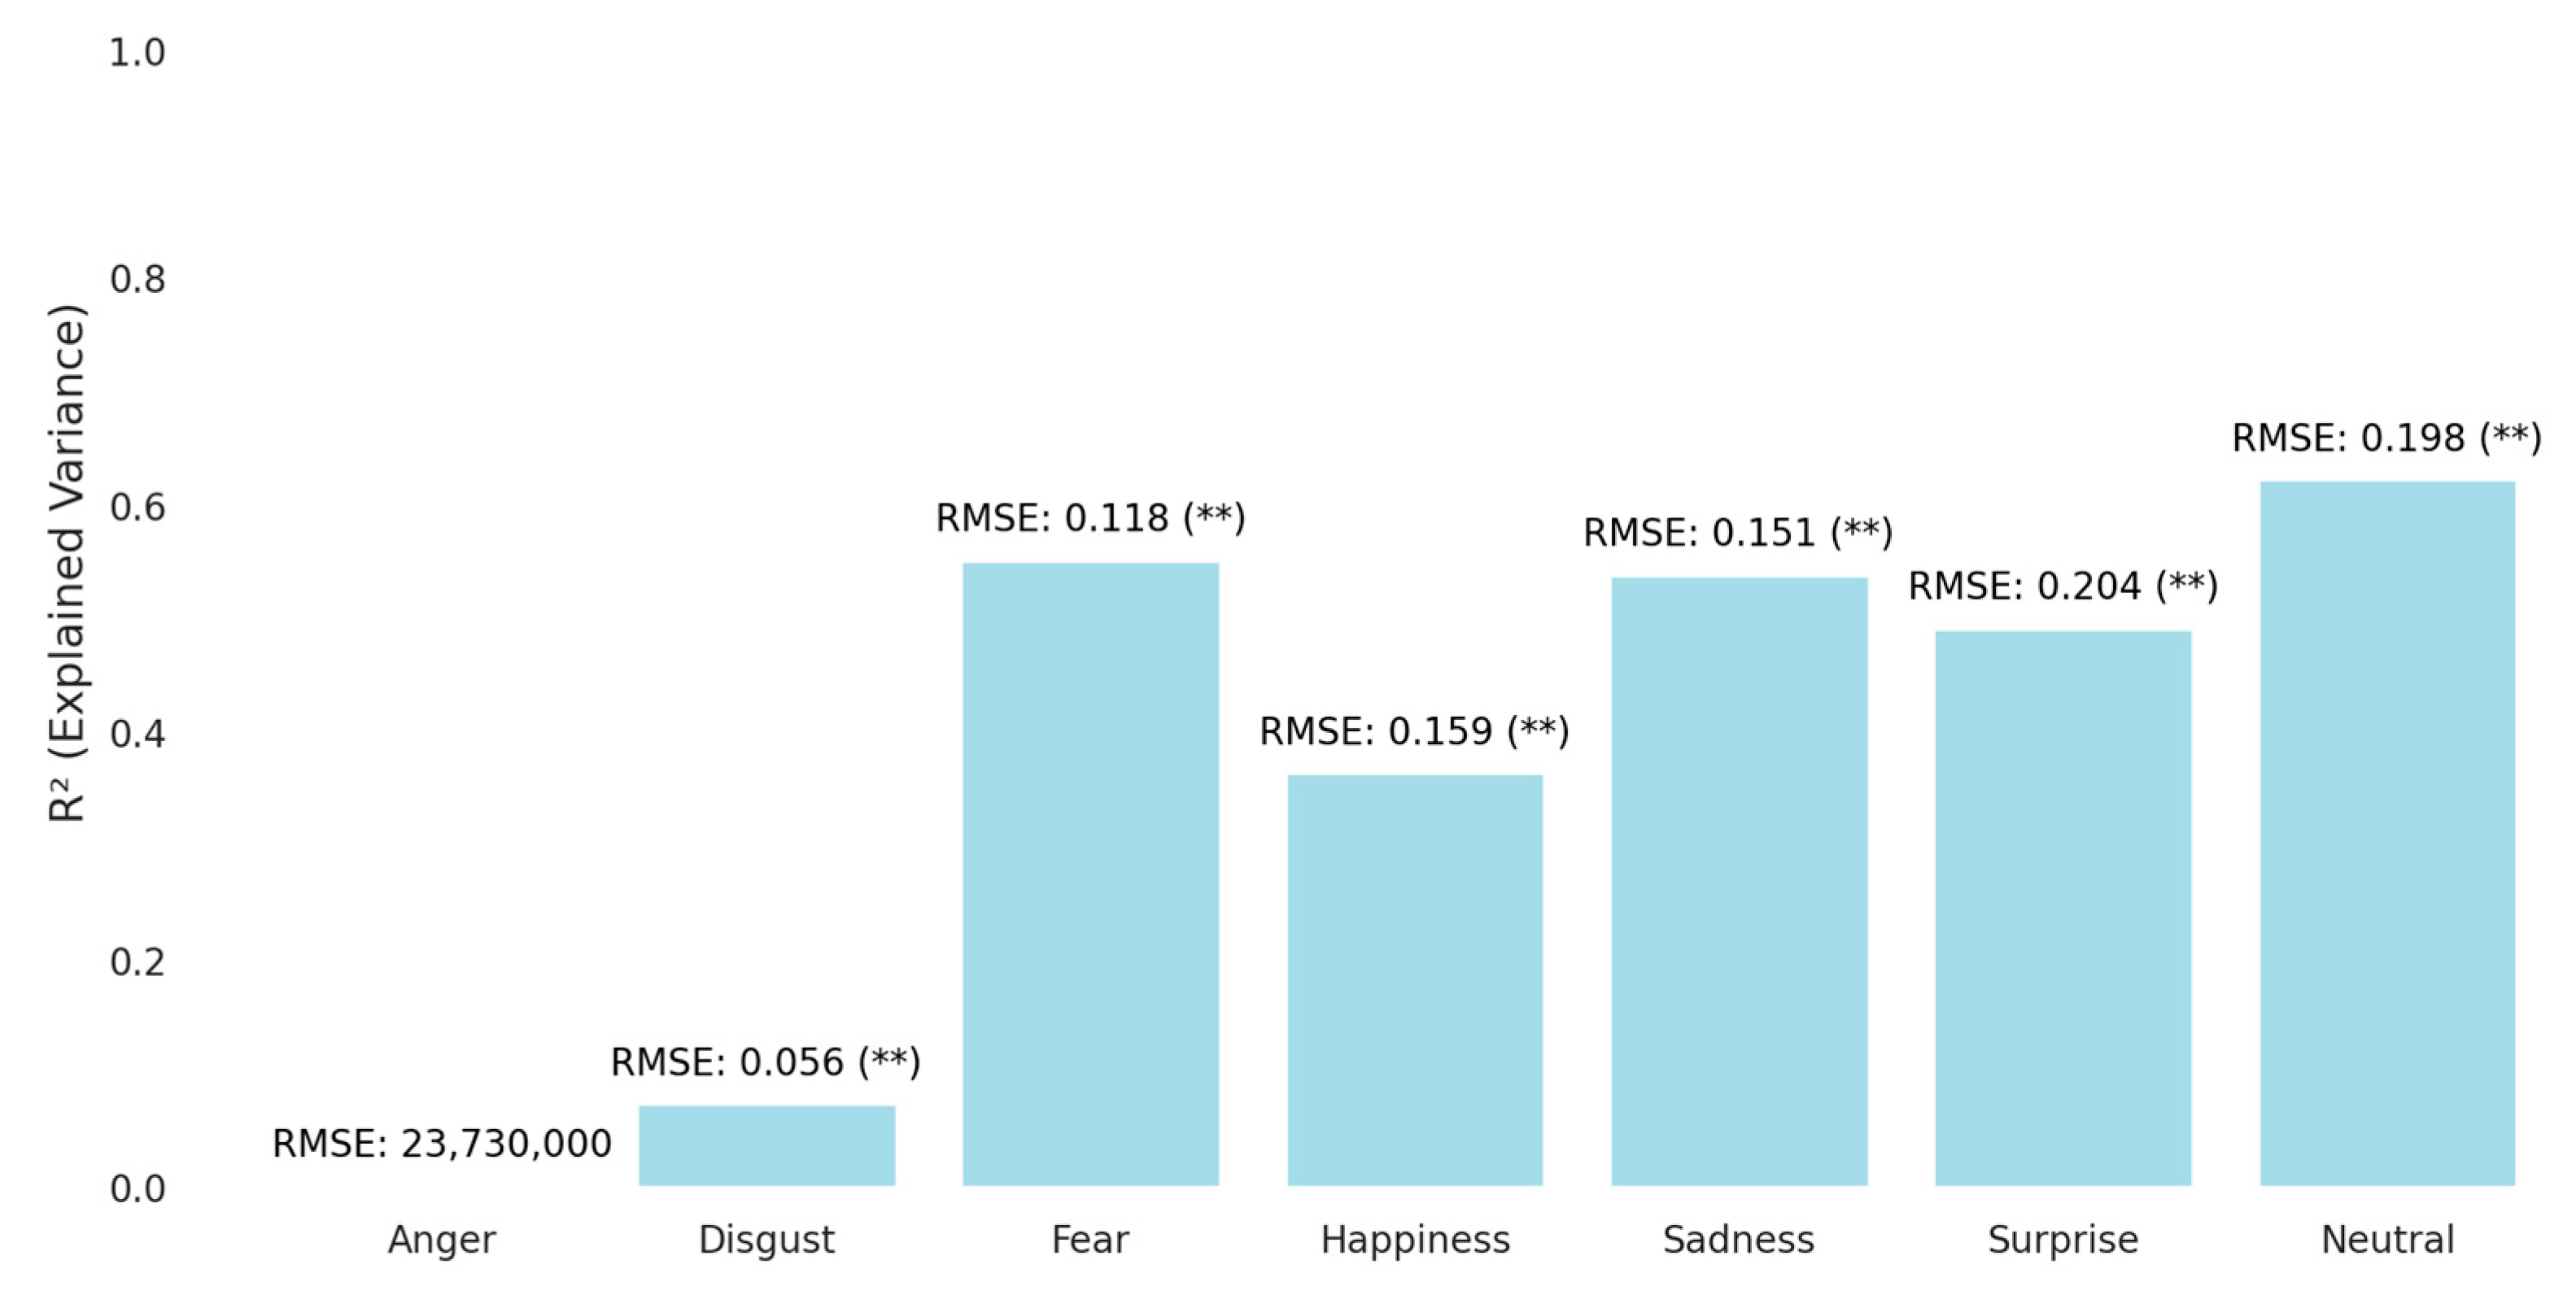
| Anger | 0.014 | 0.000 | −0.000 | 2.373 × 10⁷ | 0.000 | 7 | 24,435 | 0.661 | −2.045 × 10⁻⁴ | 2.000 | 0.995 |
| Disgust | 0.270 | 0.073 | 0.072 | 0.056 | 0.073 | 7 | 24,450 | <0.001 | 0.020 | 1.960 | 0.001 |
| Fear | 0.742 | 0.551 | 0.551 | 0.118 | 0.551 | 7 | 24,449 | <0.001 | 0.075 | 1.849 | <0.001 |
| Happiness | 0.603 | 0.364 | 0.364 | 0.159 | 0.364 | 7 | 24,450 | <0.001 | 0.042 | 1.917 | <0.001 |
| Sadness | 0.734 | 0.538 | 0.538 | 0.151 | 0.538 | 7 | 24,450 | <0.001 | 0.116 | 1.769 | <0.001 |
| Surprise | 0.701 | 0.491 | 0.491 | 0.204 | 0.491 | 7 | 24,450 | <0.001 | 0.072 | 1.857 | <0.001 |
| Neutral | 0.789 | 0.622 | 0.622 | 0.198 | 0.622 | 7 | 24,450 | <0.001 | 0.068 | 1.865 | <0.001 |
| Predictor | Disgust | Fear | Happiness | Sadness | Surprise | Neutral |
|---|---|---|---|---|---|---|
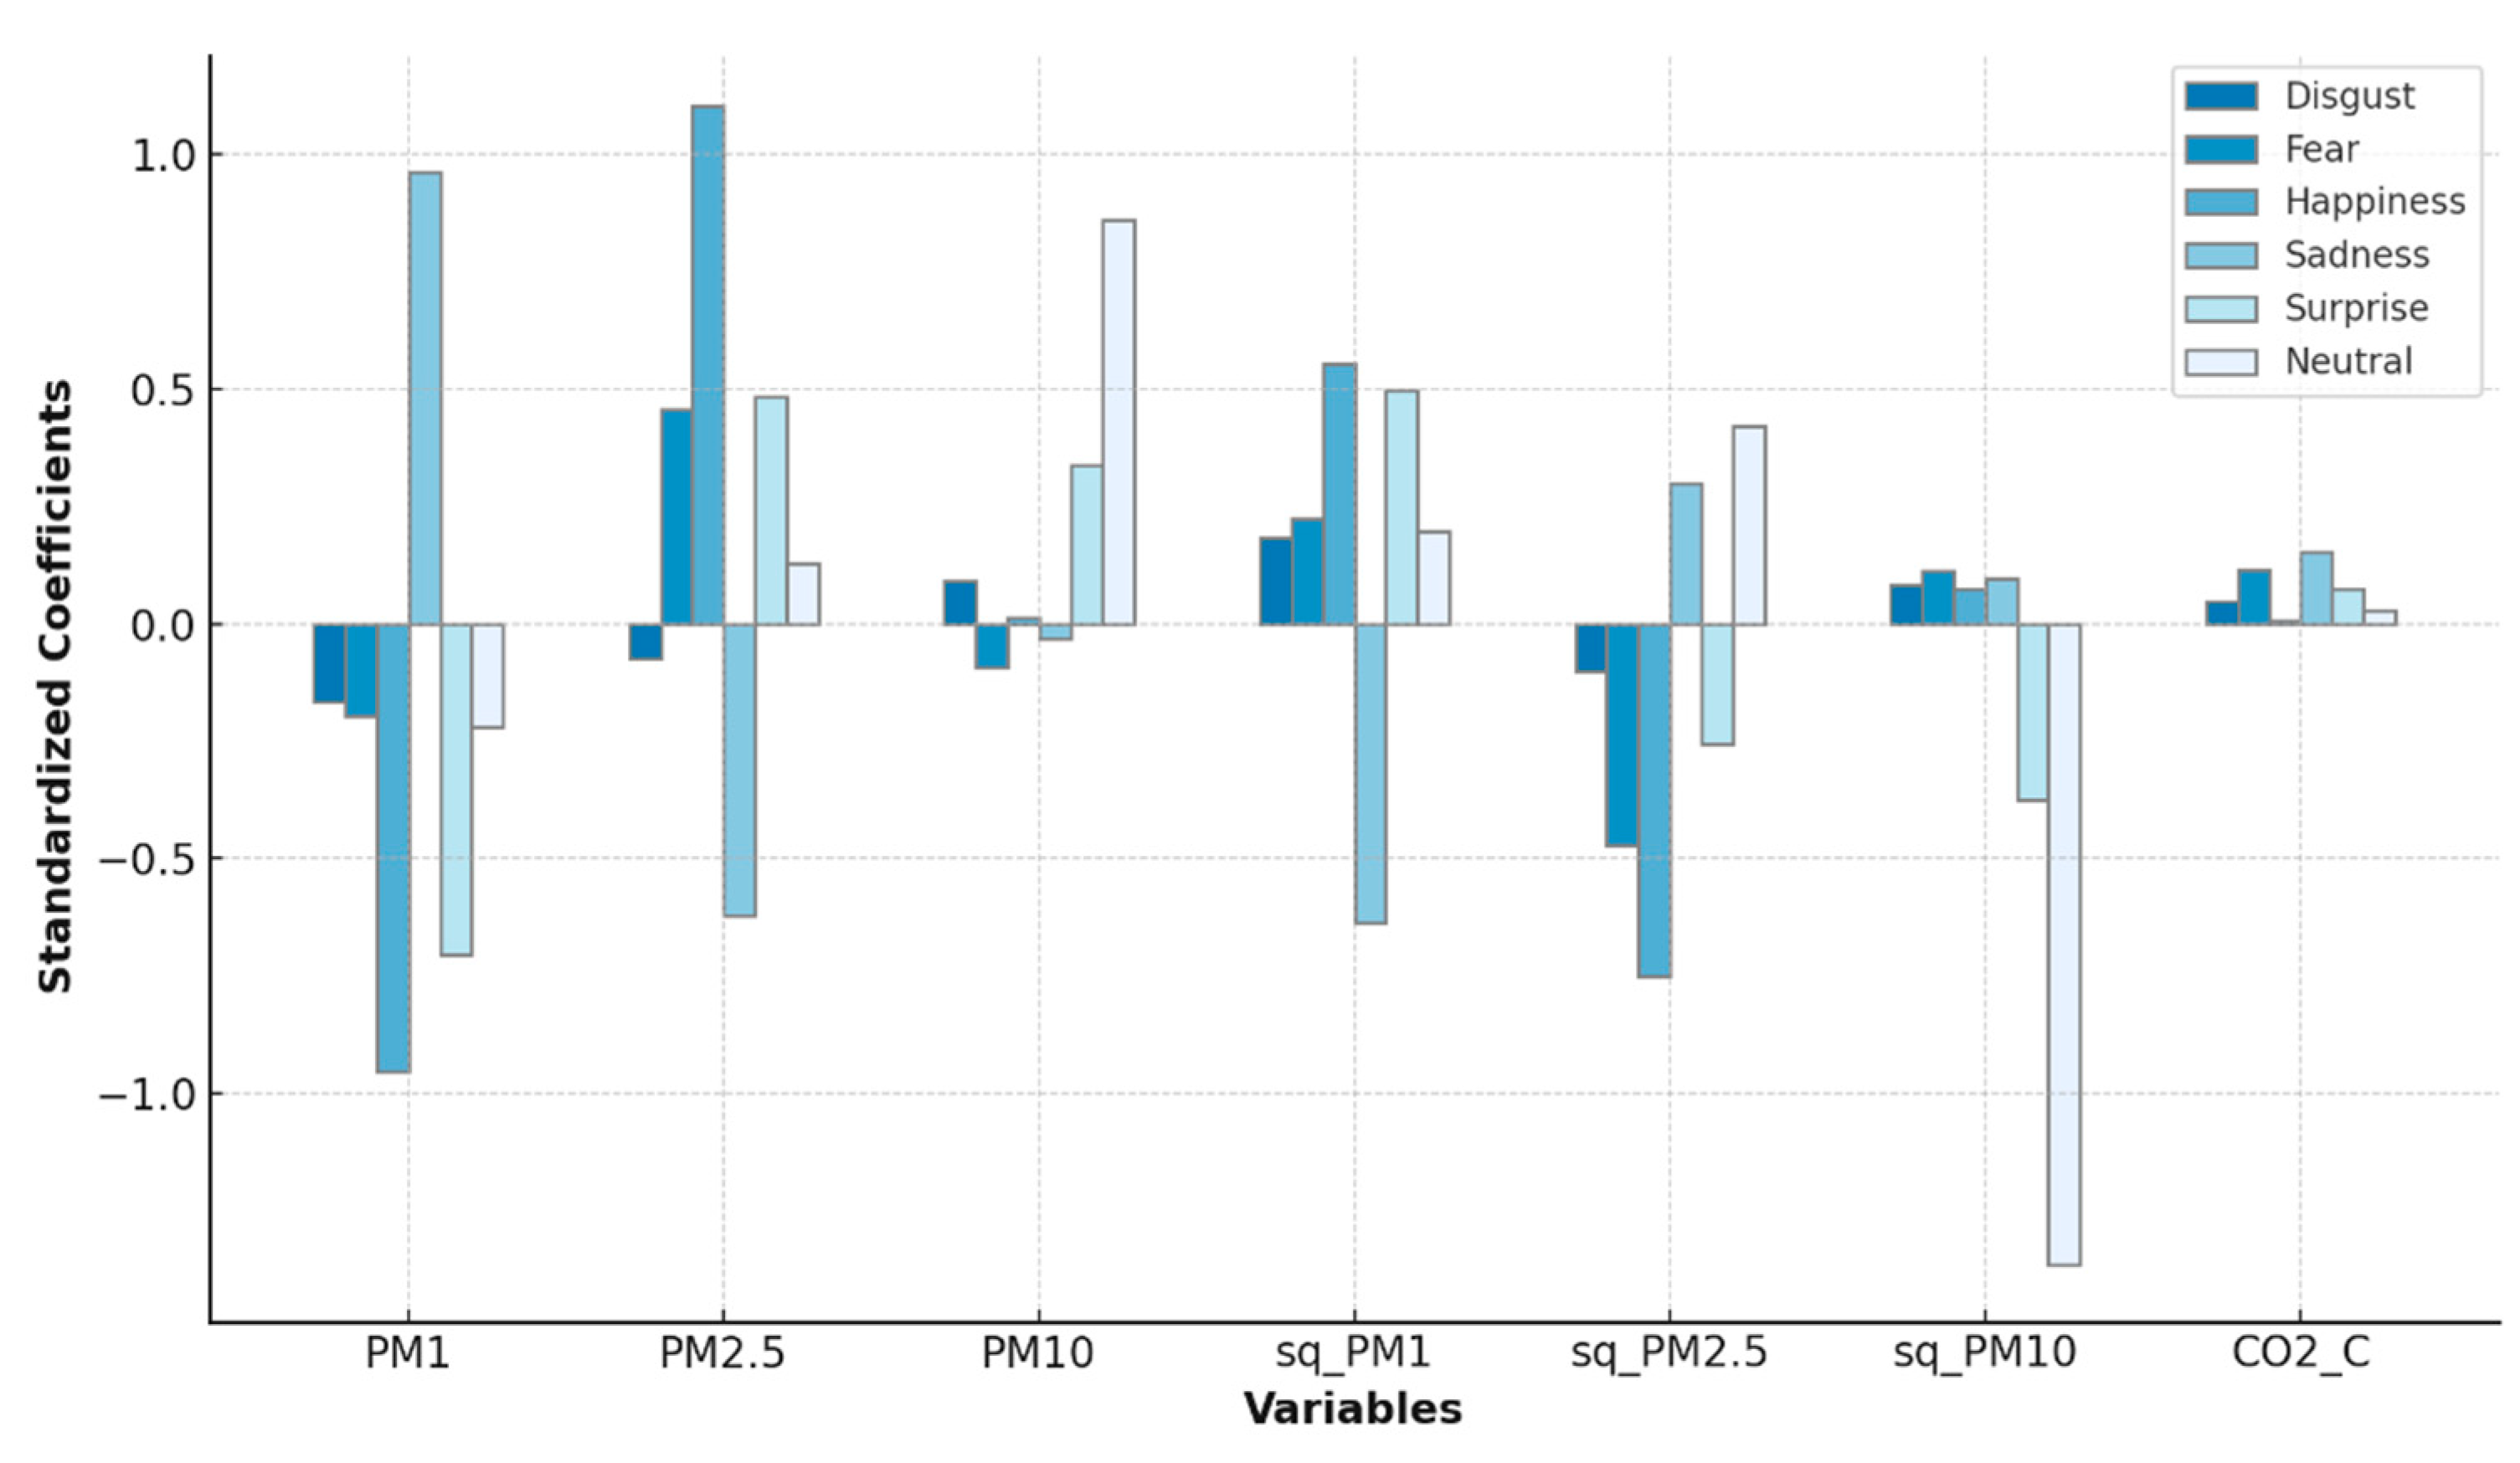
| PM1 | −0.166 | −0.195 | −0.954 | 0.961 | −0.705 | −0.220 |
| (0.033) | (0.013) | (<0.001) | (<0.001) | (<0.001) | (0.004) | |
| PM2.5 | −0.075 | 0.455 | 1.102 | −0.620 | 0.483 | 0.128 |
| (0.461) | (<0.001) | (<0.001) | (<0.001) | (<0.001) | (0.206) | |
| PM10 | 0.091 | −0.092 | 0.012 | −0.031 | 0.337 | 0.858 |
| (0.207) | (0.207) | (0.869) | (0.664) | (<0.001) | (<0.001) | |
| sq_PM1 | 0.182 | 0.224 | 0.552 | −0.636 | 0.496 | 0.197 |
| (0.007) | (0.001) | (<0.001) | (<0.001) | (<0.001) | (0.003) | |
| sq_PM2.5 | −0.101 | −0.473 | −0.750 | 0.298 | −0.256 | 0.421 |
| (0.239) | (<0.001) | (<0.001) | (<0.001) | (0.003) | (<0.001) | |
| sq_PM10 | 0.083 | 0.112 | 0.074 | 0.095 | −0.374 | −1.364 |
| (0.231) | (0.108) | (0.280) | (0.172) | (<0.001) | (<0.001) | |
| CO2 | 0.048 | 0.115 | 0.007 | 0.152 | 0.075 | 0.029 |
| (<0.001) | (<0.001) | (0.180) | (<0.001) | (<0.001) | (<0.001) |
Disclaimer/Publisher’s Note: The statements, opinions and data contained in all publications are solely those of the individual author(s) and contributor(s) and not of MDPI and/or the editor(s). MDPI and/or the editor(s) disclaim responsibility for any injury to people or property resulting from any ideas, methods, instructions or products referred to in the content. |
© 2024 by the authors. Licensee MDPI, Basel, Switzerland. This article is an open access article distributed under the terms and conditions of the Creative Commons Attribution (CC BY) license (https://creativecommons.org/licenses/by/4.0/).
Share and Cite
Fretes, G.; Llurba, C.; Palau, R.; Rosell-Llompart, J. Influence of Particulate Matter and Carbon Dioxide on Students’ Emotions in a Smart Classroom. Appl. Sci. 2024, 14, 11109. https://doi.org/10.3390/app142311109
Fretes G, Llurba C, Palau R, Rosell-Llompart J. Influence of Particulate Matter and Carbon Dioxide on Students’ Emotions in a Smart Classroom. Applied Sciences. 2024; 14(23):11109. https://doi.org/10.3390/app142311109
Chicago/Turabian StyleFretes, Gabriela, Cèlia Llurba, Ramon Palau, and Joan Rosell-Llompart. 2024. "Influence of Particulate Matter and Carbon Dioxide on Students’ Emotions in a Smart Classroom" Applied Sciences 14, no. 23: 11109. https://doi.org/10.3390/app142311109
APA StyleFretes, G., Llurba, C., Palau, R., & Rosell-Llompart, J. (2024). Influence of Particulate Matter and Carbon Dioxide on Students’ Emotions in a Smart Classroom. Applied Sciences, 14(23), 11109. https://doi.org/10.3390/app142311109