Article

Seismic Resilience of CRC- vs. RC-Reinforced Buildings: A Long-Term Evaluation

1
Department of Civil and Environmental Engineering, Ben-Gurion University of the Negev, P.O. Box 653, Beer Sheva 8410501, Israel
2
Department of Civil Engineering, Sami Shamoon College of Engineering, 84 Jabotinsky, St. Ashdod 7724505, Israel
3
Department of Civil Engineering, Ariel University, Ariel 4070000, Israel
4
Department of Civil Engineering, Institute of Technology, 8 Thelma St, West Perth, WA 6005, Australia
*
Author to whom correspondence should be addressed.
Appl. Sci. 2024, 14(23), 11079; https://doi.org/10.3390/app142311079
Submission received: 25 September 2024 / Revised: 18 November 2024 / Accepted: 22 November 2024 / Published: 28 November 2024
(This article belongs to the Special Issue Seismic and Energy Retrofitting of Existing Buildings)

Abstract

:
Corrosion-induced degradation in concrete and reinforced concrete (RC) structures, often initiated within the first few decades of their lifespan, significantly challenges seismic resistance. While existing research tools can assess performance, they fall short in predicting changes in seismic resistance resulting from alterations in the core properties of RC structures. To bridge this gap, we introduce a numerical seismic resistance prediction method (SRPM) specifically designed to predict changes in the seismic resistance of structures, including those reinforced with carbon-fiber-reinforced polymer (CFRP), known for its non-corrosive properties. This study utilizes classical models to estimate corrosiveness and employs these models alongside section strength predictions to gauge durability. The nonlinear static pushover analysis (POA) model is implemented utilizing SAP-2000 and Response-2000 software. A comparative analysis between steel-reinforced and carbon-fiber-reinforced polymer concrete (CRC) structures reveals distinct differences in their seismic resistance over time. Notably, steel-reinforced structures experience a significant decrease in their ability to dissipate seismic energy, losing 54.4% of their capacity after 170 years. In contrast, CFRP-reinforced structures exhibit a much slower degradation rate, with only 25.5% reduction over the same period. The discrepancy demonstrates CFRP’s superior durability and ability to maintain structural integrity in the face of seismic stresses.

1. Introduction

The durability of corroding reinforced concrete (RC) structures is initially high, largely owing to the protective concrete cover [1,2,3,4,5]. However, this durability gradually decreases over time due to environmental conditions, material quality, and ongoing corrosion processes [4,5,6]. Moreover, the long-term bond strength in reinforced concrete members with significantly corroded reinforcing bars shows a progressive decrease [6,7,8]. The area of reinforcement bars decreases over time, further compounding the issue [9]. High levels of corrosion can lead to cracking components, while lower levels may not result in cracking, as discussed by [10,11]. The lateral loads were distributed according to the structure’s first mode, and an effective strategy for managing corrosion involves addressing it at its onset. Thus, identifying damage initiation is crucial for timely intervention [12]. The severe damage caused by corrosion to the structural durability of buildings has been documented by Bohni [13]. The insights from their work emphasize the complexity of corrosion effects on RC structures and the necessity for innovative solutions to ensure long-term structural safety and functionality. Zhou et al. [14] examined the combination of carbon-fiber-reinforced polymer (CFRP) with steel bars to enhance flexural behavior and counteract the negative effects of corrosion on steel. In addition, Kabashi et al. and Musavi [8,15] highlighted the constant bond coefficient of concrete beams reinforced with CFRP bars compared to varying behaviors with steel bars, suggesting that alternative reinforcement such as with CFRP can enhance concrete strength.
Recent research provided diverse insights into the effects of corrosion on the seismic performance of RC structures and the potential benefits of using fiber-reinforced polymers (FRPs) for structural enhancement. For instance, Yisen Guo [16] evaluated the seismic performance of corroding RC bridge columns, while Musavi [15] provided insight into using FRPs to strengthen and enhance the performance of bridges. Additionally, Garcia, Hajirasouliha, and Pilakoutas [17] explored seismic enhancing behaviors in variable RC frames strengthened with CFRP composites and further underscored the role of these materials in enhancing structural integrity.
Capozucca and Cerri [18] explored the effect of corrosion reinforcement in the compressive zone on reducing seismic resistance. The work of Otieno et al. [18] explored the negative phenomena associated with corrosion rates in RC structures. Several works investigated how corrosion affects the seismic response of existing RC structures, designed according to various standards; the results of this study could be used to improve capacity over the years. The work of Zheng et al. [18] used experimental data and a numerical model to predict the performance ratio differences in the seismic behavior of RC beams in an artificial corrosion environment. Furthermore, Toumpanaki, Lees, and Terrasi [19] presented an analytical predictive model for the long-term bond performance of CFRP tendons in concrete. Finally, a study by Brrto et al. [9] examined the residual capacity after the attack of degradation phenomena and highlighted the negative impact of the corrosion on the seismic resistance of the tested structure.
The work of Wu et al. [20] examined the durability of FRP bars in an alkaline concrete environment over eight years, which resulted in essential insights into FRP durability under such conditions. Further insights were given by Lukasz Sadowski and Mehdi Nikoo [21], who developed a model to predict corrosion density and assess concrete performance. Sanz, Planas, and Sancho [22] identified distinct impacts of corrosion on steel bars, noting the detrimental effects on the bond strength between steel and concrete, which reduces component performance. Despite these contributions, there remains a gap in the literature regarding the seismic analysis and comparative assessment of RC structures versus CFRP structures. This work aims to bridge existing gaps by analyzing seismic resistance and comparing the performance of traditional RC structures with those reinforced with carbon-fiber-reinforced polymer (CFRP). Earthquake resistance is evaluated using the Dissipation Energy Method (DEM), beginning with an in-depth evaluation of a frame throughout various stages of its service life. This analysis is conducted via pushover analysis (POA) using SAP 2000, which extends the assessment over the structure’s lifespan to explore the capacity of bending frames to withstand seismic forces. This methodology is supported by the work of Valente and Milani [23,24], who applied both time history and pushover analyses to predict large-scale structural capacities. Their findings were further substantiated by experimental testing, demonstrating the validity of these nonlinear methods. Similarly, authors like Sokołowski et al., Kotynia, and Lasek have utilized nonlinear behavior in their research [25,26,27], underscoring these techniques’ widespread acceptance and application in structural engineering.
This study then focuses on the ductility of the structures, using specific equations to analyze the actual seismic capacities when reinforced with either steel or CFRP. A detailed comparison of energy dissipation through elastic and plastic energies at various life stages shows the long-term effects of these reinforcement methods on seismic resilience.
The DEM model is critical in this research, assessing a structure’s energy absorption and dissipation capacities subjected to seismic loads. This model helps to map the structural response from its original state to potential future conditions. Furthermore, the seismic resistance prediction method (SRPM) builds upon the findings from the DEM, integrating data across various periods to deepen the understanding of material degradation and the evolution of residual properties. This integrative approach quantifies energy dissipation throughout the structure’s lifetime, introducing the seismic resistance capacity factor (RCF) concept to measure seismic resilience quantitatively. In addition to employing the DEM and SRPM models, this study is supported by recent research findings that emphasize the effectiveness of CFRP reinforcement.
This study significantly extends the findings of our previous work, which identified crucial factors that enhance the ductility ratio of sections reinforced with carbon-fiber-reinforced polymer (CFRP), as detailed in our earlier research [22].
This reinforcement has proven highly effective under seismic conditions. This enhanced framework builds upon our prior findings and provides deeper insight into the structural dynamics and longevity of buildings designed to endure seismic events. Our initial investigations focused on the section-level analysis of structures created with CFRP; however, this work has now expanded to include a comparative study at the structural level of existing buildings, assessing their resilience and performance over time.
Further, the amount of energy a structure can dissipate at any given point in its lifespan serves as a crucial numerical indicator of its functional performance in future periods, up to its eventual demolition. This quantitative measure is vital, providing critical insights into the structure’s capacity to manage and mitigate energy during seismic events or other dynamic stresses. The ability of a structure to dissipate a high amount of energy suggests improved safety and stability, which in turn extends its service life and reduces potential risks associated with structural failure.
The distinct contribution of this research lies in our ability to assess residual durability in structures quantitatively. This approach offers a measurable, data-driven basis for understanding the long-term performance and integrity of construction materials and methods. We have successfully quantified residual durability by employing advanced modeling and analytical techniques, demonstrating a significant advancement in how structural engineering can approach durability assessments. This comprehensive analysis framework effectively integrates the evaluation of energy dissipation capabilities and the quantification of residual durability, thereby enhancing the predictive accuracy of our models and ensuring that our structural designs are robust and sustainable.

2. Methodology

In this section, we introduce a novel methodology for assessing the earthquake resistance of the building over an extended period. Our approach is divided into two primary stages, focusing on structures reinforced with conventional steel and those reinforced with CFRP. The methodology aims to capture the changes in material properties due to corrosion and other factors affecting both types of structures. The resistance assessment benefits from the DEM, which quantifies the structure’s resistance ratio through the comparison of dissipation energies across different testing periods. This process generates a series of ratios that, over time, are used to construct a predictive curve for seismic resistance. The second stage replicates the first but examines structures reinforced with CFRP to assess the impact of non-corrosive reinforcement on seismic resistance under identical geophysical conditions. This stage follows the same procedural steps as outlined for RC structures, with adaptations to account for the different mechanical properties of CFRP, as depicted in Figure 1. This methodology is grounded in established scientific principles and validated modeling techniques that comprehensively analyze structures reinforced with conventional RC and CFRP.
Objective: The primary goal of this work is to evaluate how corrosion affects the mechanical properties of both RC and CRC structures.
This objective is achieved by adopting predictive models/equations that can replicate the long-term changes in these properties due to corrosion. The methodology includes the following steps:
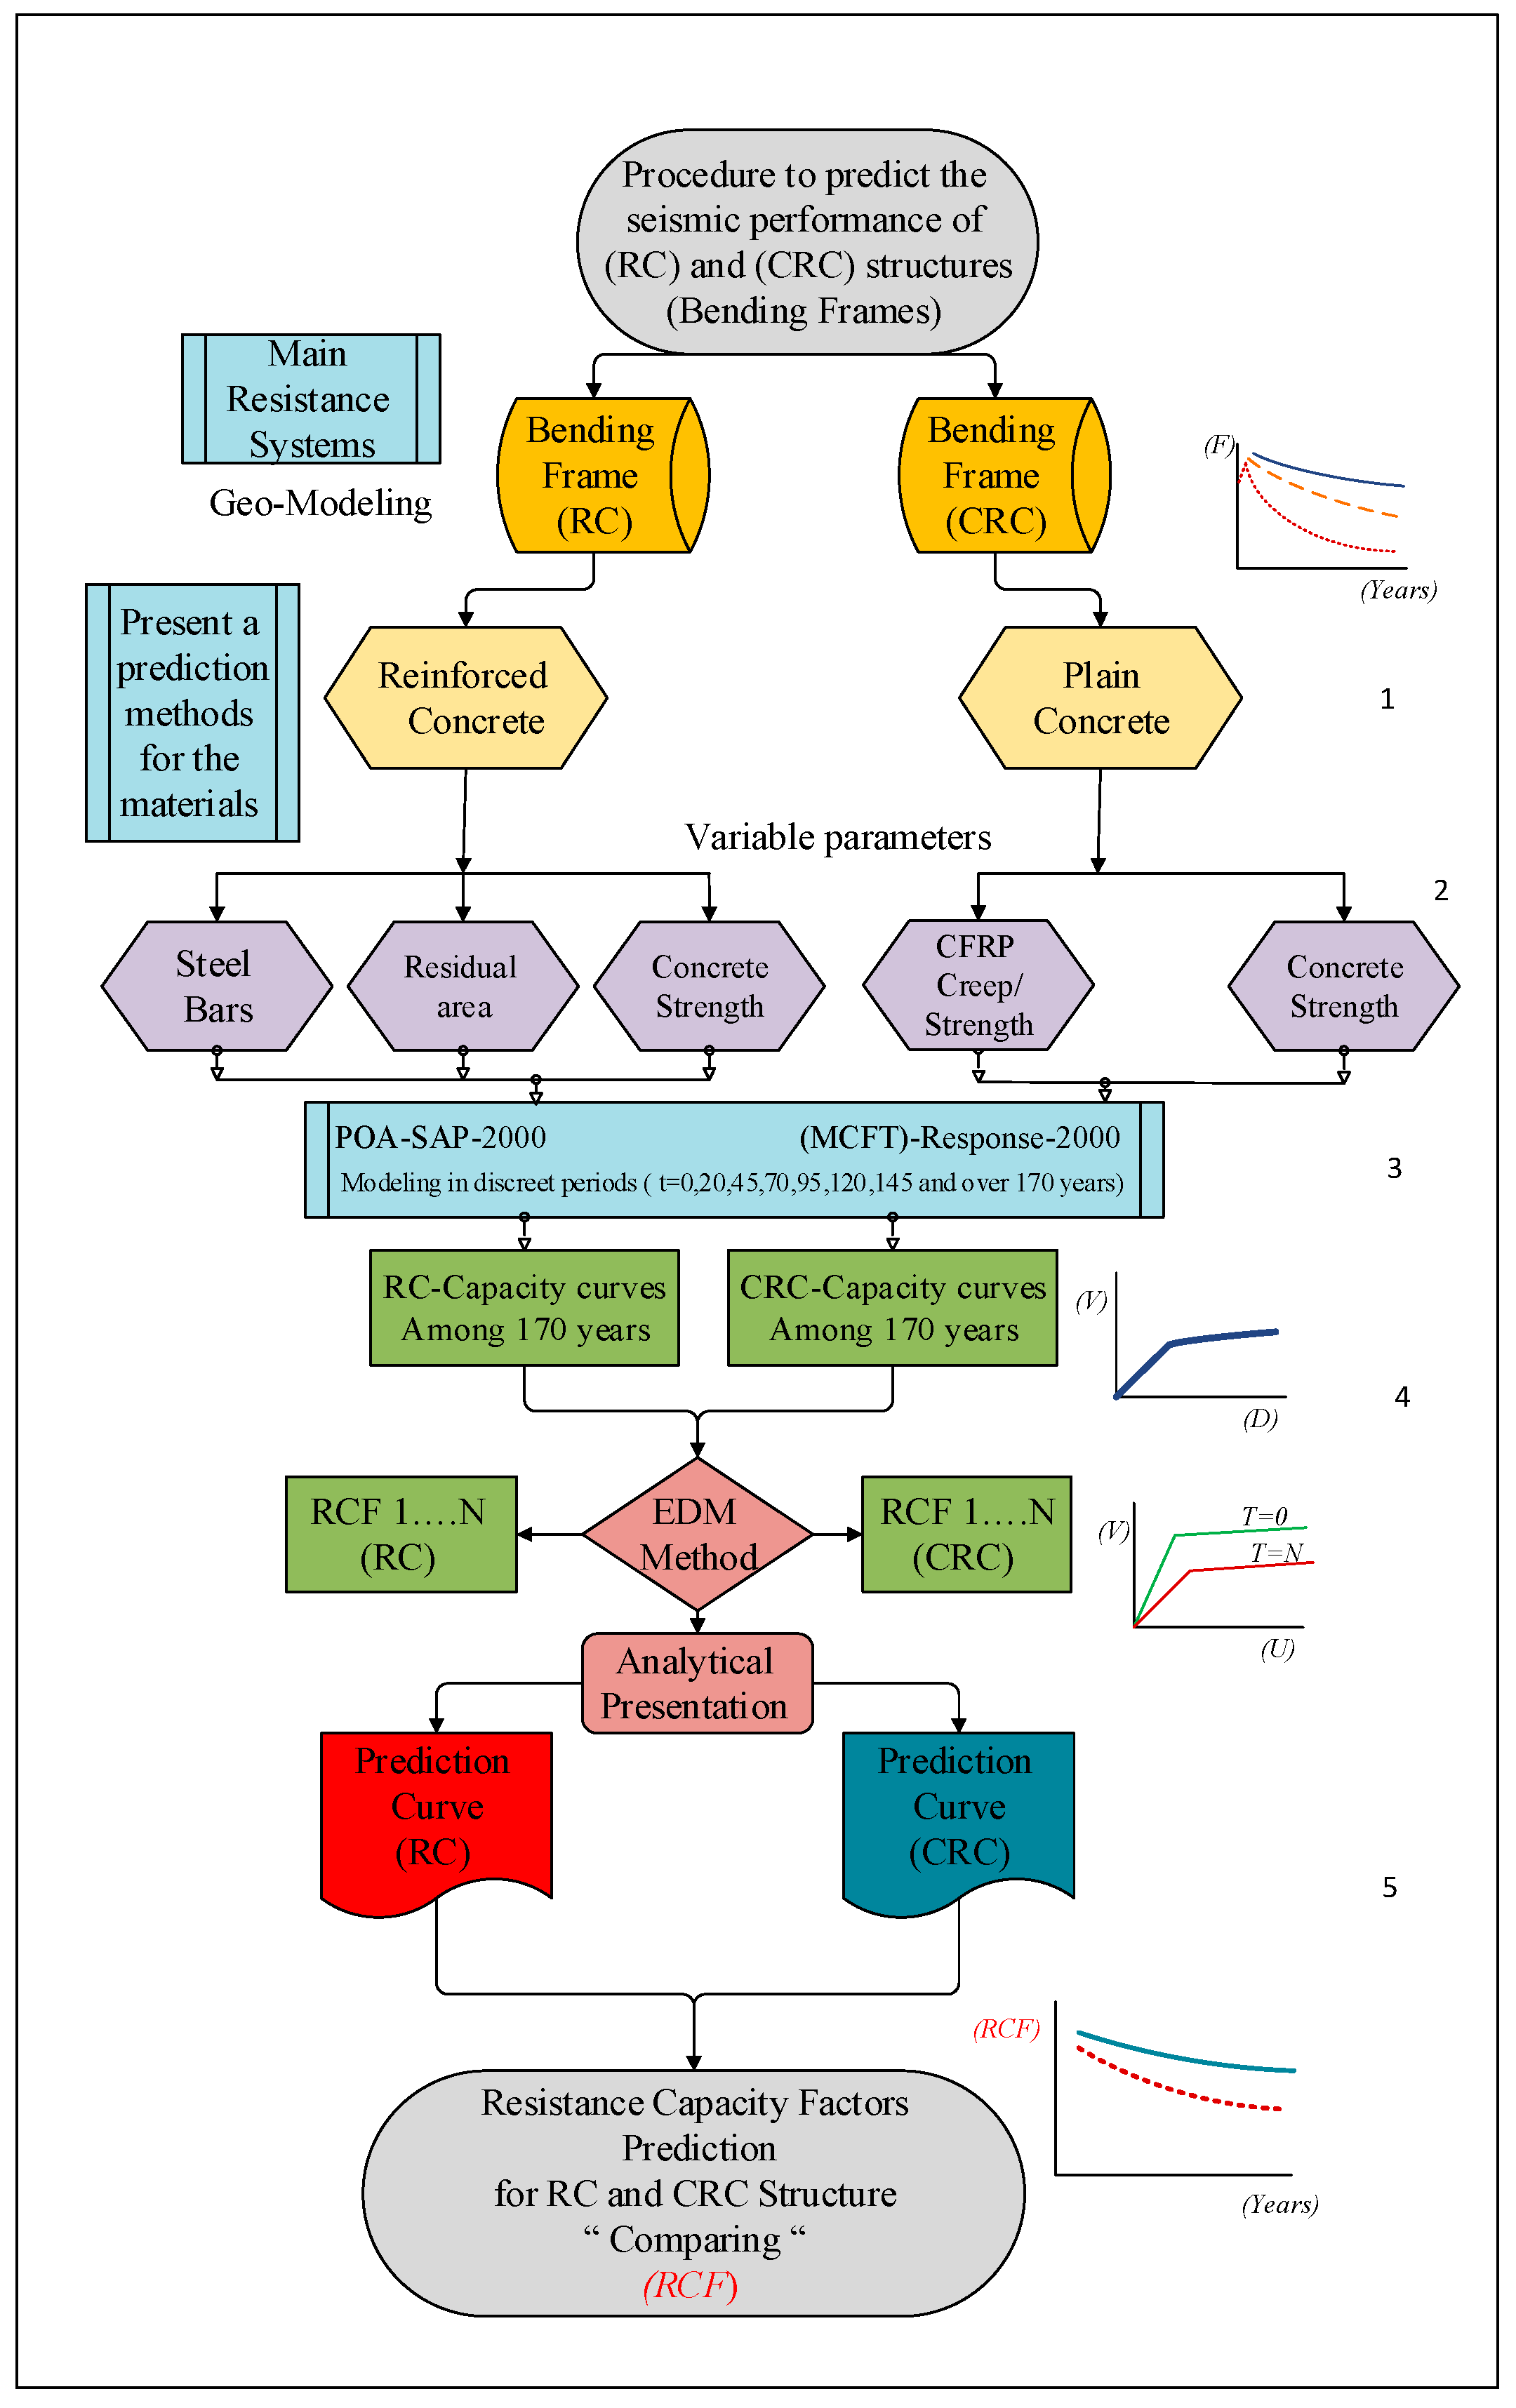
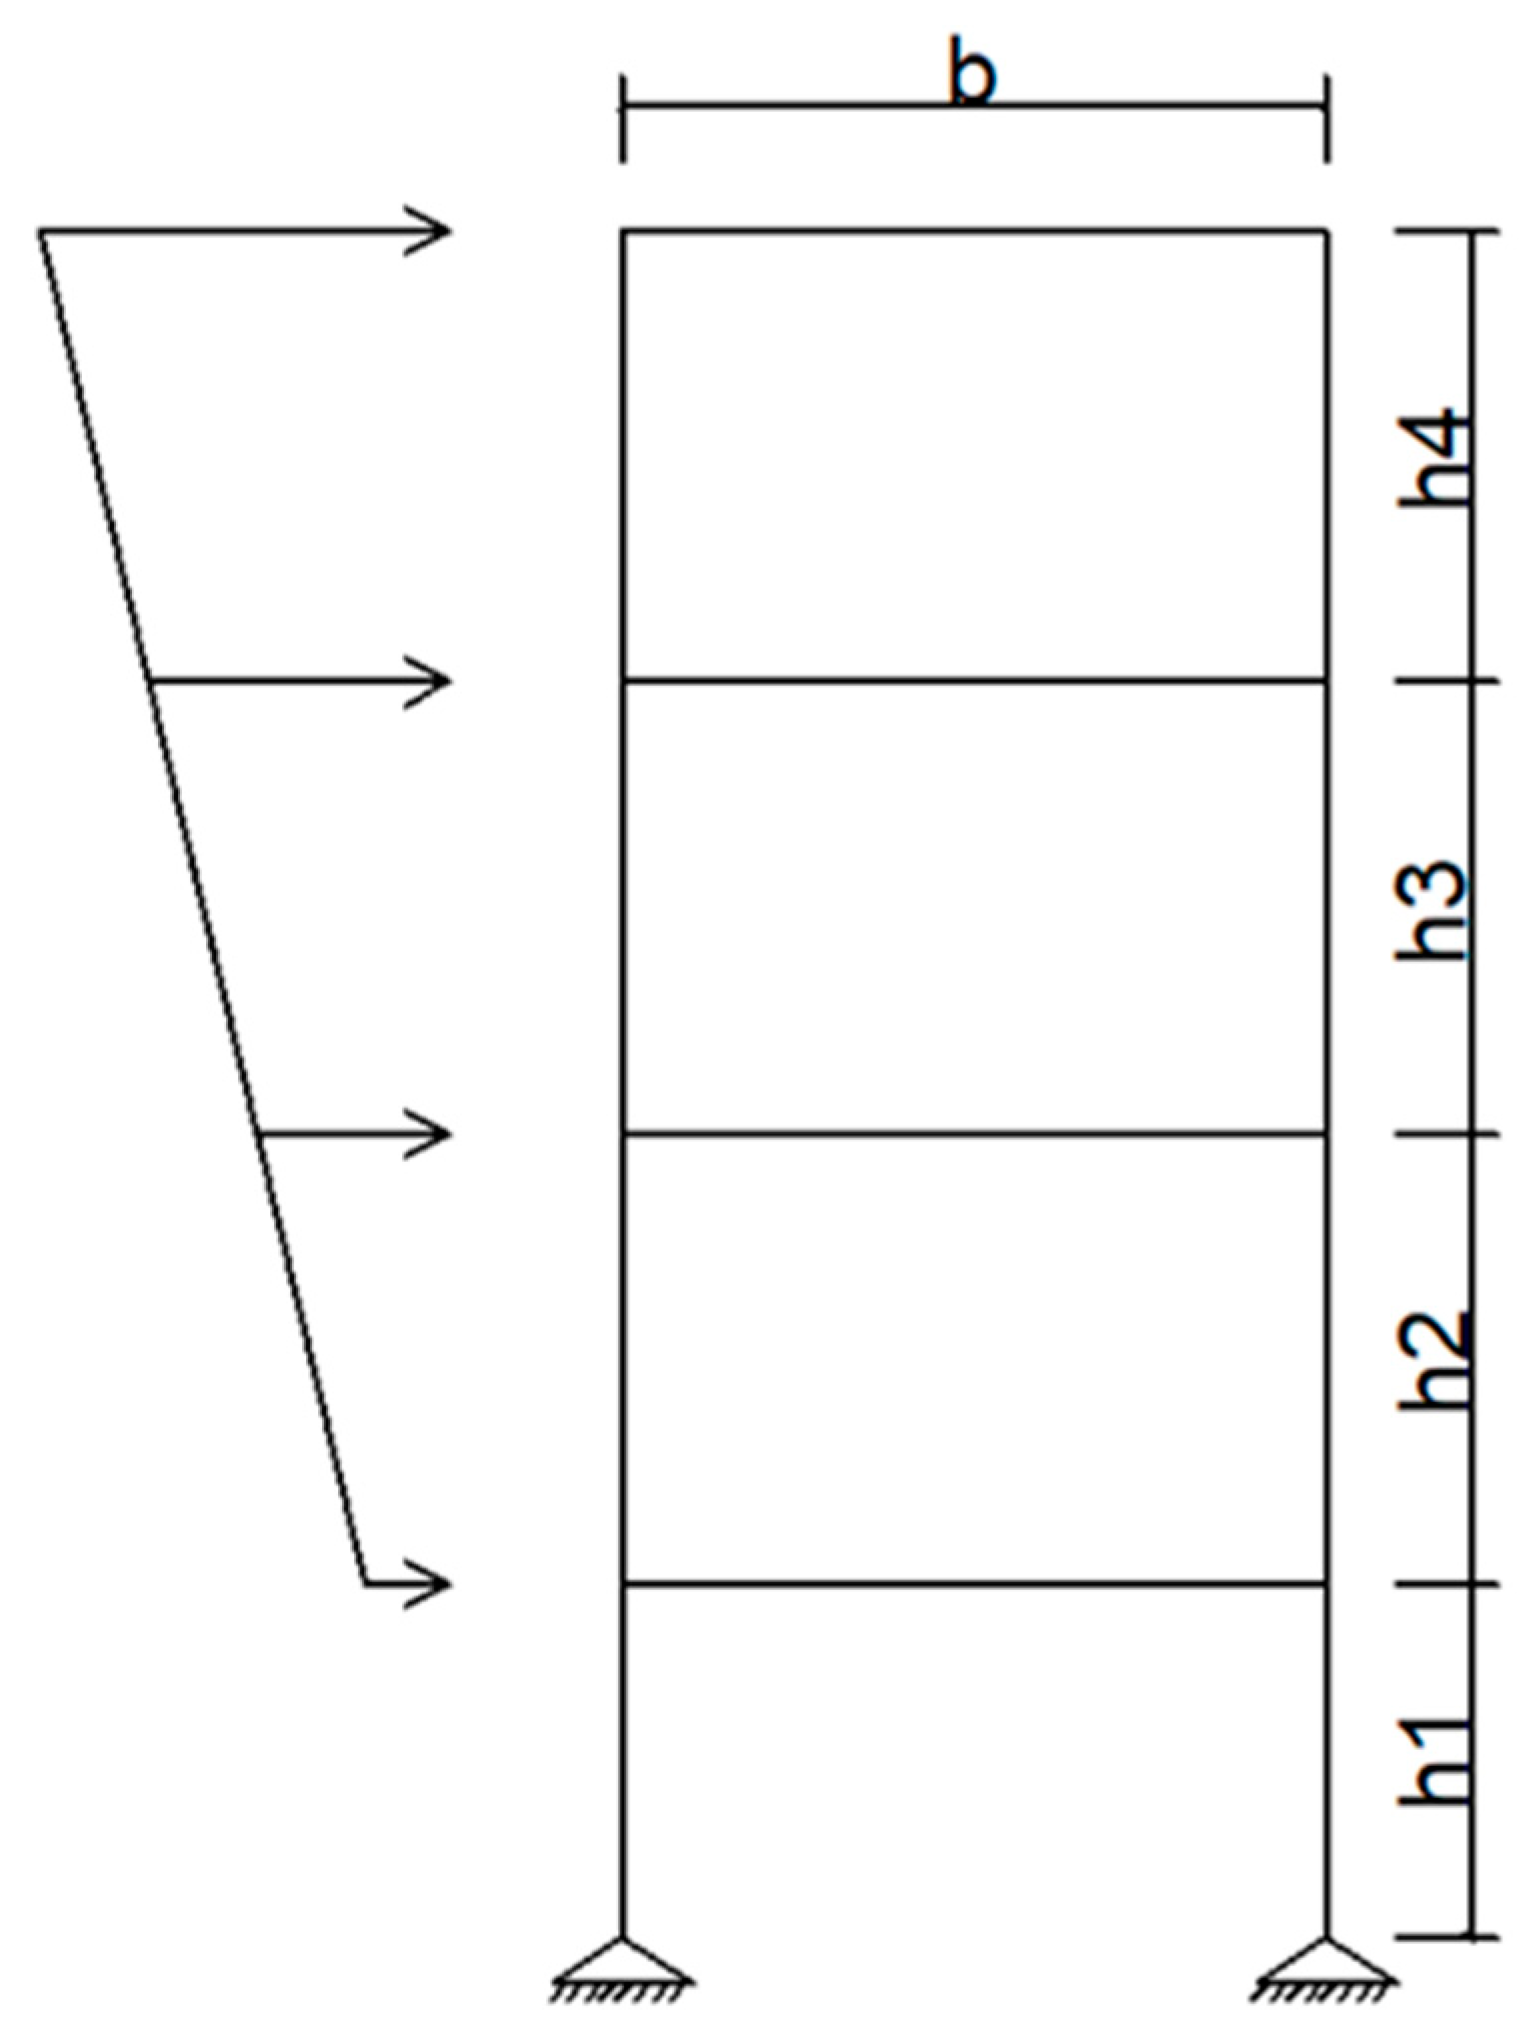
  • We begin by generating detailed geometric models of the structural frames.
  • Identification of the parameters likely to deteriorate due to corrosion, including the steel reinforcement area, the residual cross-section area, the strength and elastic modulus of both reinforced and plain concretes, as well as the residual strength of the CFRP. These parameters are critical as they directly impact the structural integrity and load-bearing capacity of RC and CRC structures. The identified parameters are then used as input for the models so that the simulations are performed in discreet periods throughout the structure’s expected lifetime.
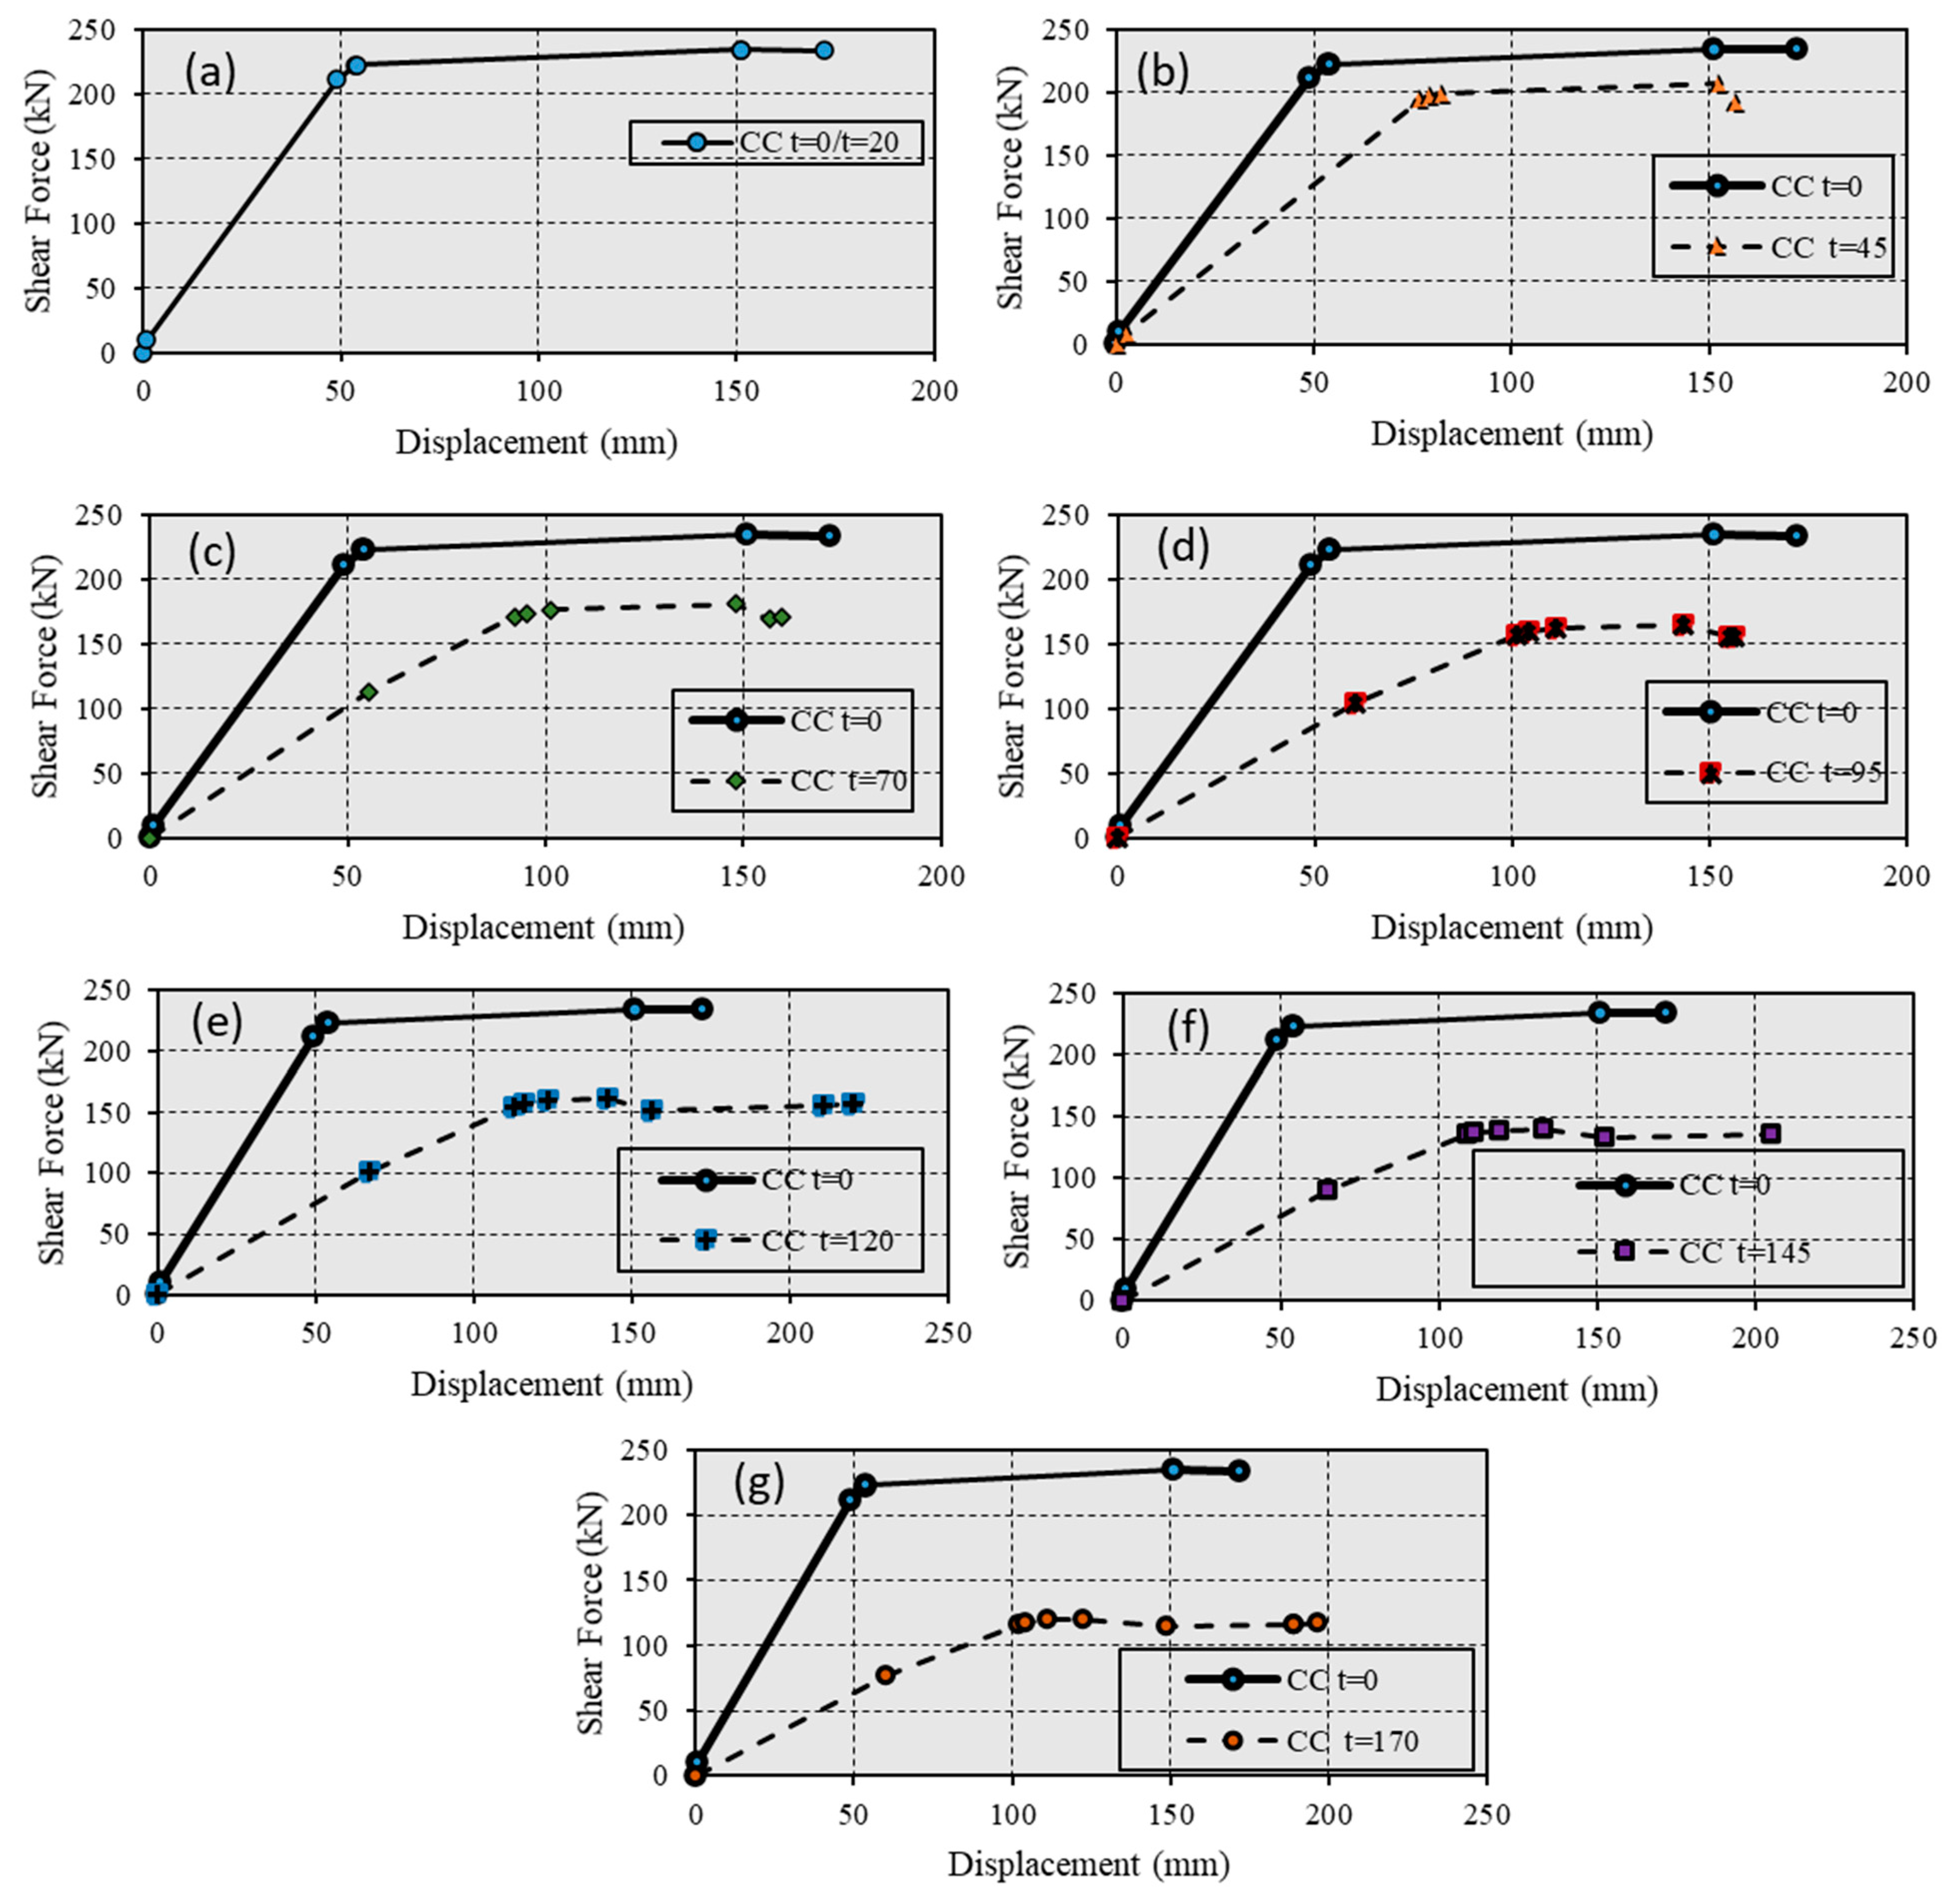
  • Simulation of both structures utilizing the POA technique with SAP2000 ver. 17 [28] and Response2000 ver. 1.9.6. beta [29] models to evaluate the response to lateral seismic loads. These simulations utilize the parameters defined in the first step. The analysis yields load–displacement curves for the following step.
  • The simulations generate load–displacement curves, which are then used to calculate dissipation energy ratios. This step is pivotal as it allows us to determine the energy dissipation at any selected time, providing insights into the resilience of the structure and its effectiveness in dissipating seismic energy.
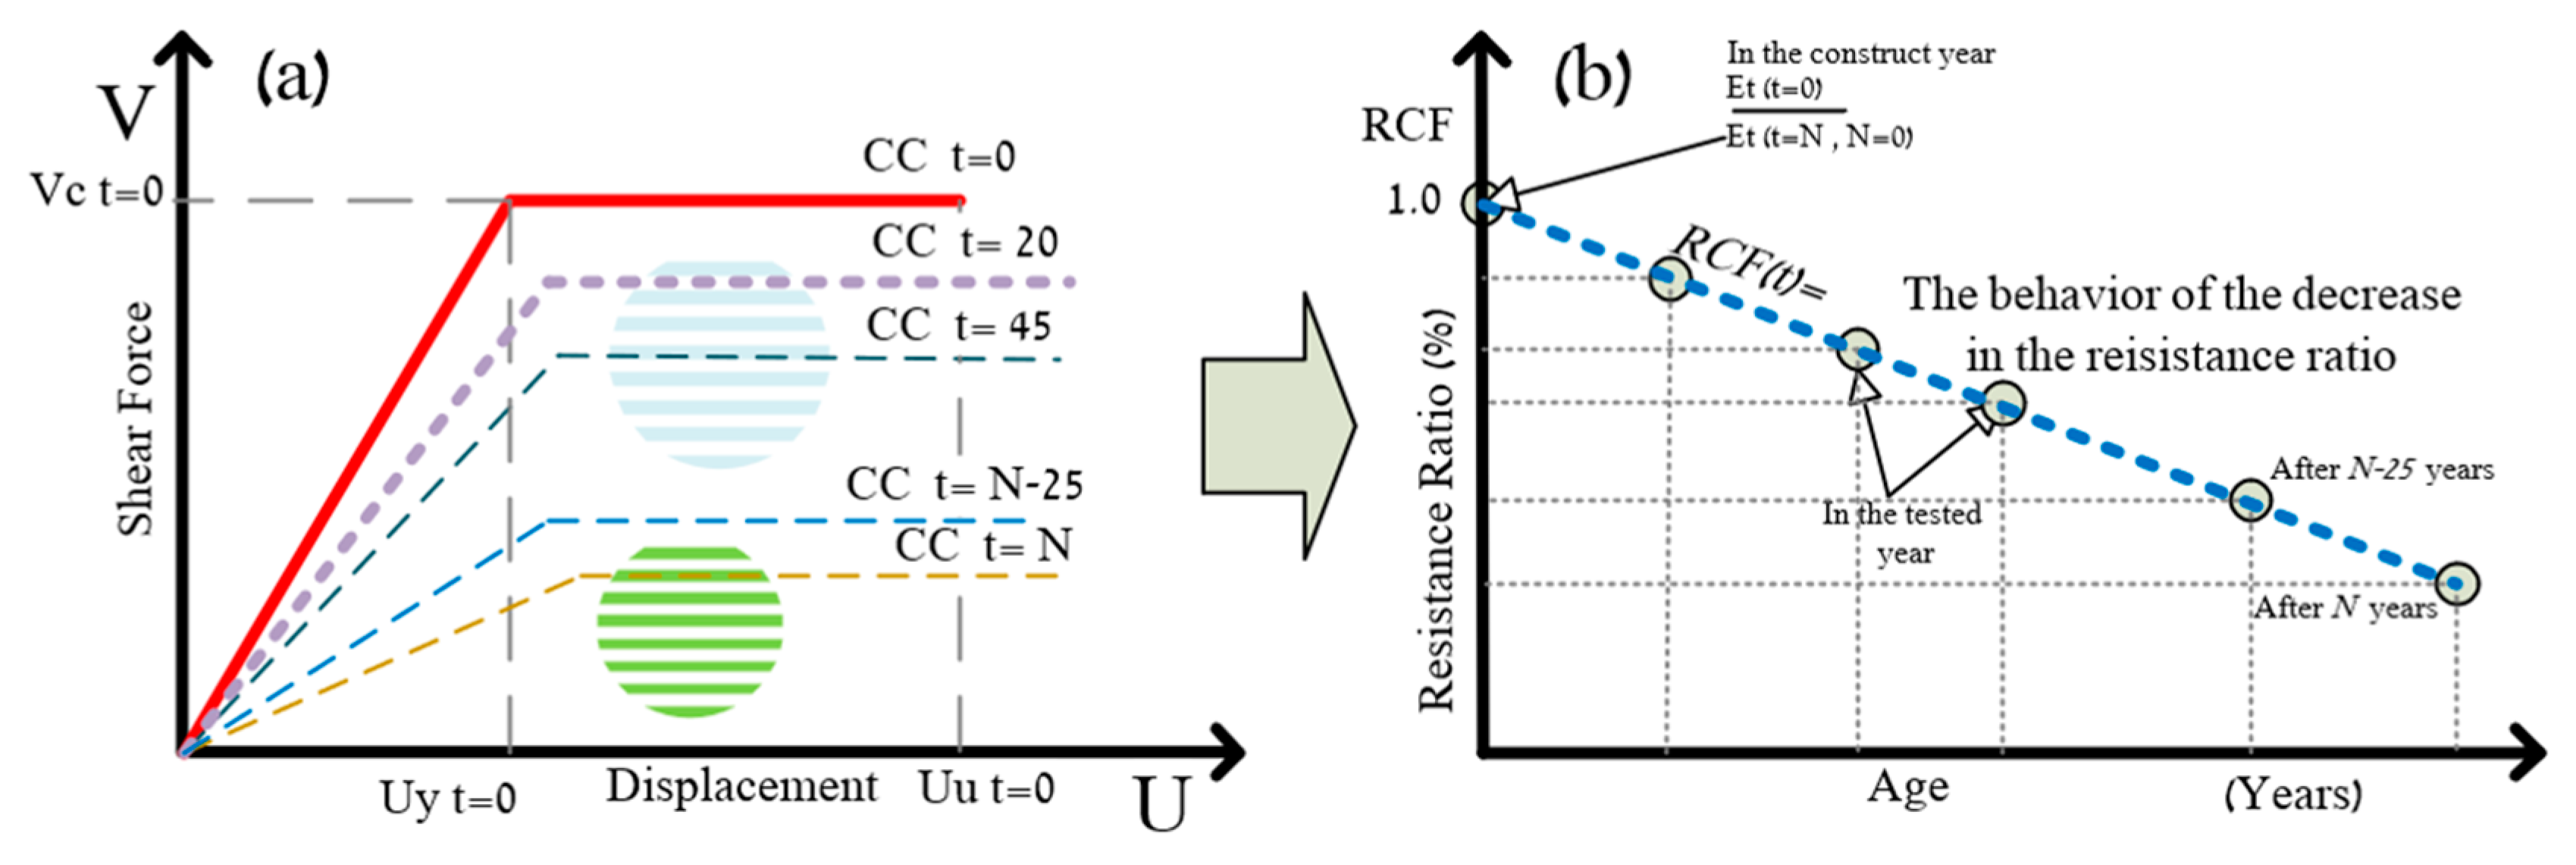
  • The energy values obtained from integrating the load–displacement curves for each specified age interval (e.g., t = 20, …, t = N) are compared with the structure’s non-corrosive state at t = 0. The resulting ratio, the RCF, quantitatively measures the structure’s ability to dissipate energy relative to its original condition. This factor is crucial for understanding how corrosion impacts structural resilience and durability, highlighting the long-term effects of environmental and material degradation on structural integrity.
  • The main innovation of this methodology lies in its potential to enhance the motivation for using CFRP as a reinforcement material in concrete structures. This is due to CFRP’s superior performance in terms of seismic resistance, particularly over long periods, compared to conventional steel-reinforced concrete.

3. Prediction of Material Properties

In this section, we examine the degradation mechanisms affecting various concrete types: plain concrete, steel-reinforced concrete, and CFRP-reinforced concrete. Given that CFRP is a non-corrosive material, we assume that CFRP-reinforced concrete exhibits degradation behavior similar to that of plain concrete, distinct from the corrosion-related issues observed in steel-bar-reinforced structures.
The predictive methods utilized in this study, developed to forecast the degradation behaviors of these concrete types, have been rigorously validated through both experimental tests and numerical analyses. This comprehensive validation ensures that the predictions made about the degradation of these materials are robust and reliable, providing valuable insights into the long-term performance and maintenance needs of various concrete infrastructures.

3.1. Normal-Strength Plain Concrete

Here we focus on the deterioration processes affecting plain concrete structures. While it is known that the degradation of non-reinforced concrete is generally less pronounced compared to that of reinforced concrete, owing largely to the absence of steel reinforcement, which eliminates the risk of corrosion-induced spalling and cracking, the material is not impervious to chemical damage. Among the spectrum of chemical attacks that concrete may face, sulfate attack has emerged as a particularly prevalent threat. Sulfate attack occurs when sulfate ions, commonly present in soil and groundwater, or as byproducts of industrial emissions, penetrate concrete and react with its components, especially the calcium aluminate hydrates in the cement. This reaction leads to the formation of expansive minerals like ettringite and gypsum, which can cause the concrete to crack. This form of chemical degradation is of particular concern in environments with high sulfate concentrations, such as areas near industrial plants, coastal regions, or areas with sulfate-rich soils.
Significant research efforts have been made to predict the long-term compressive strength (fcu(t)). A notable example is the study by Yao et al. [30], which empirically estimated the long-term compressive strength of concrete in a moist environment characterized by 67% air humidity. Their findings, as demonstrated in Equations (1)–(5) provide essential insights into concrete resilience under such conditions.
f c u t = μ f t 1.645 · σ t t ,
where µf(t) and σf(t) denote the mean value and standard deviation of concrete compressive strength after a specific period t, measured in years; these parameters are crucial in statistical models for quantifying and understanding the variability and reliability of concrete strength over time, as presented in Equations (2) and (3):
μ f t = ξ ( t ) ·   μ 0 ,
σ f t = η t ·   σ 0 ,
where µ0 and σ0 denote the mean value and standard derivation of concrete compressive strength at 28 days (where t = 0), respectively. ξ(t) and (t) are functions of time that modify the mean and standard deviation over time, respectively, given as
ξ t = 1.2488 e 0.0347 ln t 0.3468 2 ,
η t = 0.0143 t + 1.6024 ,
To predict the long-term tensile strength of concrete with compressive strength, Yao et al. [30] recommend an exponential function. The function provides the relationship between the compressive strength and the tensile strength (fts(t)) of concrete over time, as depicted in Equation (6).
f t s = 1.02 · f c u 0.36 ,
Figure 2 schematically illustrates the changing trends in compressive and tensile strengths of plain concrete as time progresses under standard conditions.
Diab et al. [31] present a method of estimating the evolution of strength in unreinforced concrete over time, emphasizing the influence of sulfate content on different concrete mixtures. This model stands out due to its comprehensive examination of how varying levels of sulfate impact concrete durability and structural service life. For our research, we focus on a concrete mixture with the standard sulfate concentration to study its expansion and reduction in compressive strength as time progresses. Our selected mix comprises 300 kg/m3 cement content, 1% Mg2+ sulfate ions, 0.2% C3A (tricalcium aluminate), and a water-to-cement ratio (W/C) of 0.6. The changes in compressive strength and expansion, as drawn by the Diab et al. model, are depicted in Figure 3, providing the resulting concrete deterioration due to sulfate attack over time.

3.2. Steel Reinforcement Bars

To determine the changes in the properties of steel reinforcement over time, particularly concerning its residual area due to corrosion, we utilize the expiration proposed by Berto et al. [9]. This expiration assumes that the corrosion current density remains consistent across a set of n reinforcing bars of identical diameter, all equally affected by corrosion. The model allows the users to determine the cross-sectional area of these reinforcing bars at any given time t (years) through a series of equations (Equations (7)–(9)). This framework enables calculating the reduction in diameter of a corroding reinforcing bar after a specific duration, thereby providing a quantitative measure of the impact of corrosion on the structural behavior.
t = 0 2 P X = 0 2 i c o r r k · t t i n ,
where ∅(t) (mm) denotes the residual diameter, ∅0 (mm) denotes the initial diameter of the steel, given time t (years) after corrosion initiation, tin (years) denotes the time for corrosion to initiate on the rebar surface, and Px (mm) denotes the average value of attack penetration. Px specifically refers to the decrease in the radius of the reinforcing bar due to corrosion; see Equation (8).
P X ( m m / y e a r )   = 2 i c o r r ( μ A / c m 2 ) · t p ( y e a r s ) ,
Finally, Equation (9) is employed to determine the residual area of steel reinforcement affected by corrosion.
A S t = n · π 0 2 i c o r r k · t t i n 2 4 ,
where tp = (ttin) denotes the “propagation time”, which is the duration in years after the onset of corrosion. tin is defined from Equations (1)–(5) and found to be 20 years, indicating that the corrosive effects on the steel reinforcement begin 20 years after the construction has been completed. This delay accounts for the time it takes for corrosive substances to penetrate the concrete cover and reach the reinforcing steel, where the corrosion process is initiated. The factor k = 0.0116 is used as a conversion factor to translate the corrosion current density icorr (μA/cm2) into a rate of steel loss in mm/year.
Figure 4 presents the trend in the reduction ratio of the reinforcement area for n = 3, each with a diameter of 16 mm. This reduction ratio is calculated based on the predictive model discussed earlier, considering the effects of corrosion over time, specifically after the corrosion initiation period tin and during the propagation time tp.
R A A % = 0.2585 · t ,           t > 20   y e a r s
An R-squared value of 0.9988 was obtained, showing a high level of predictive accuracy. It should be noted that we assumed that the mechanical properties of steel do not deteriorate over years, as presented in Table 1.

3.3. Bonding Strength

In this study, we assume that the reinforcement bars are bent and anchored deeply within the concrete, ensuring long-term anchorage. This bent configuration enhances the bond between the steel and concrete, providing additional mechanical interlock that increases resistance to slippage, even when bond strength is compromised by degradation or corrosion [6,7,8,9].
For simplicity, we did not account for the reduction in bond strength due to corrosion in our modeling. However, it is essential to note that, even with bent bars deeply embedded, the bond strength between the concrete and steel remains critical for overall structural performance. If corrosion weakens the surrounding concrete, the effective bond reduces over time, which limits the structure’s ability to transfer loads efficiently. While the mechanical interlock of bent bars offers some protection, a significant reduction in bond strength can still lead to localized failures and cracking. This unbonded behavior affects stress distribution, leading to deeper and more localized cracking that may result in sudden failures, particularly under dynamic or seismic loads.

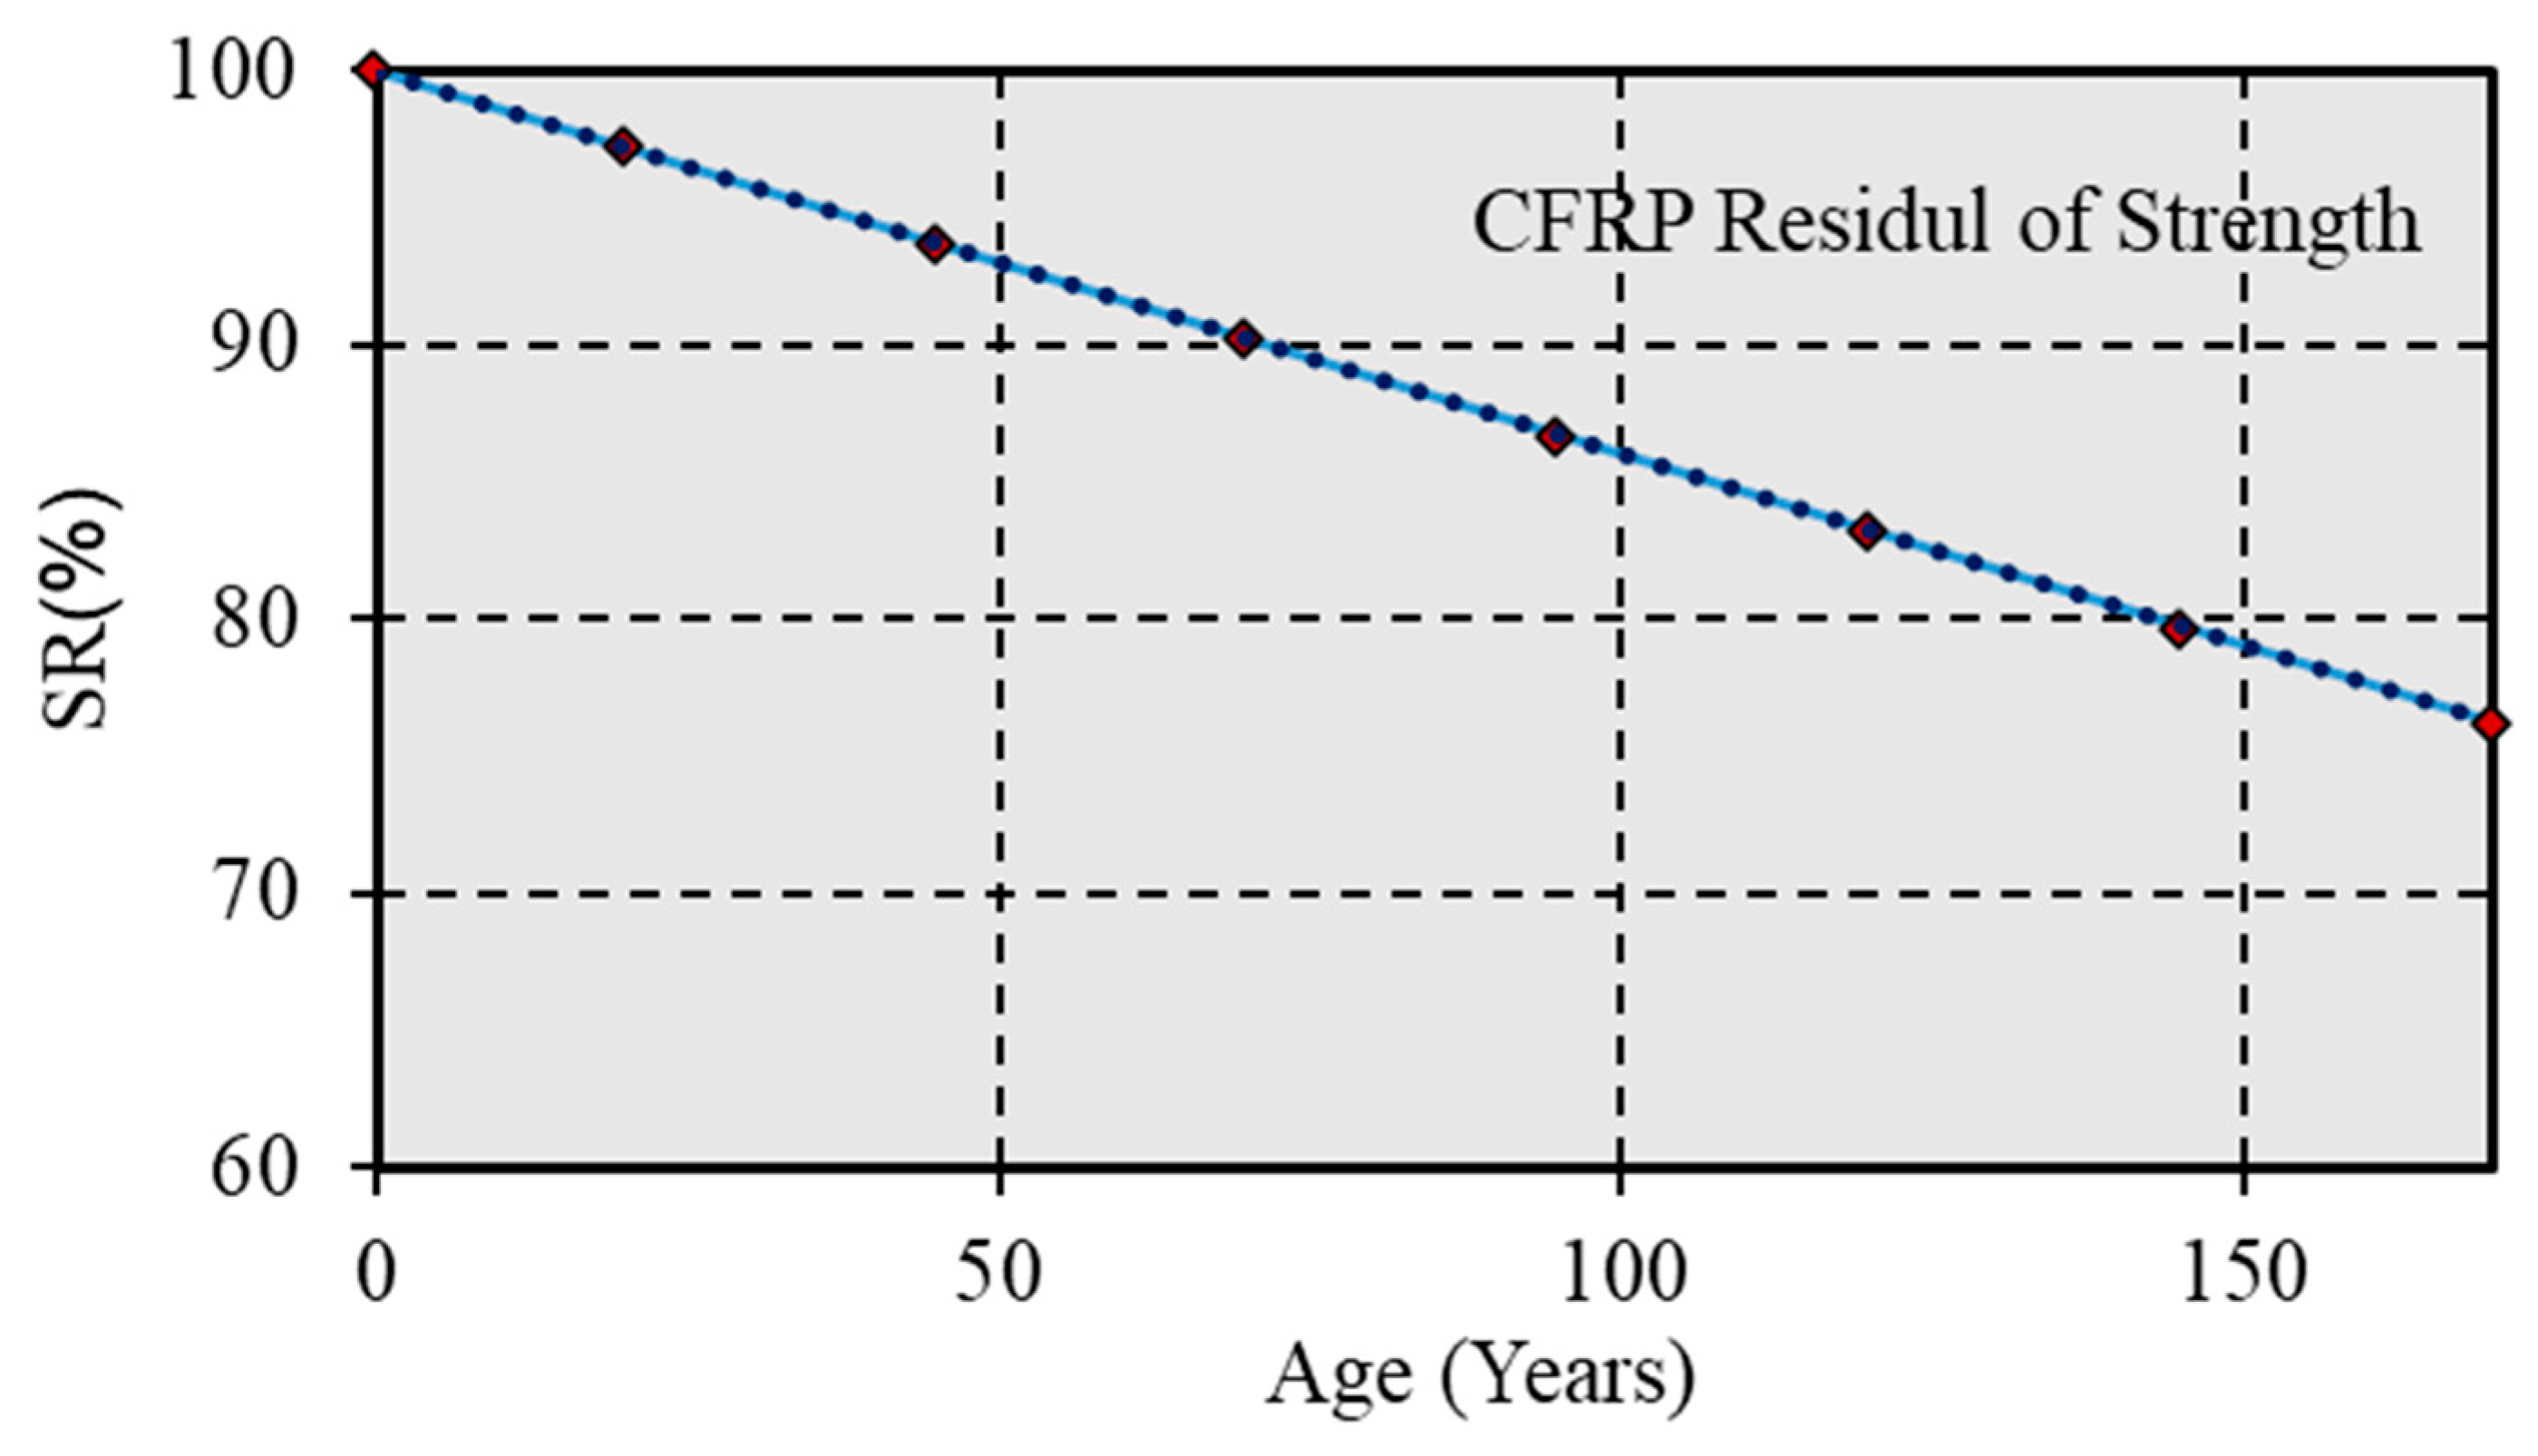
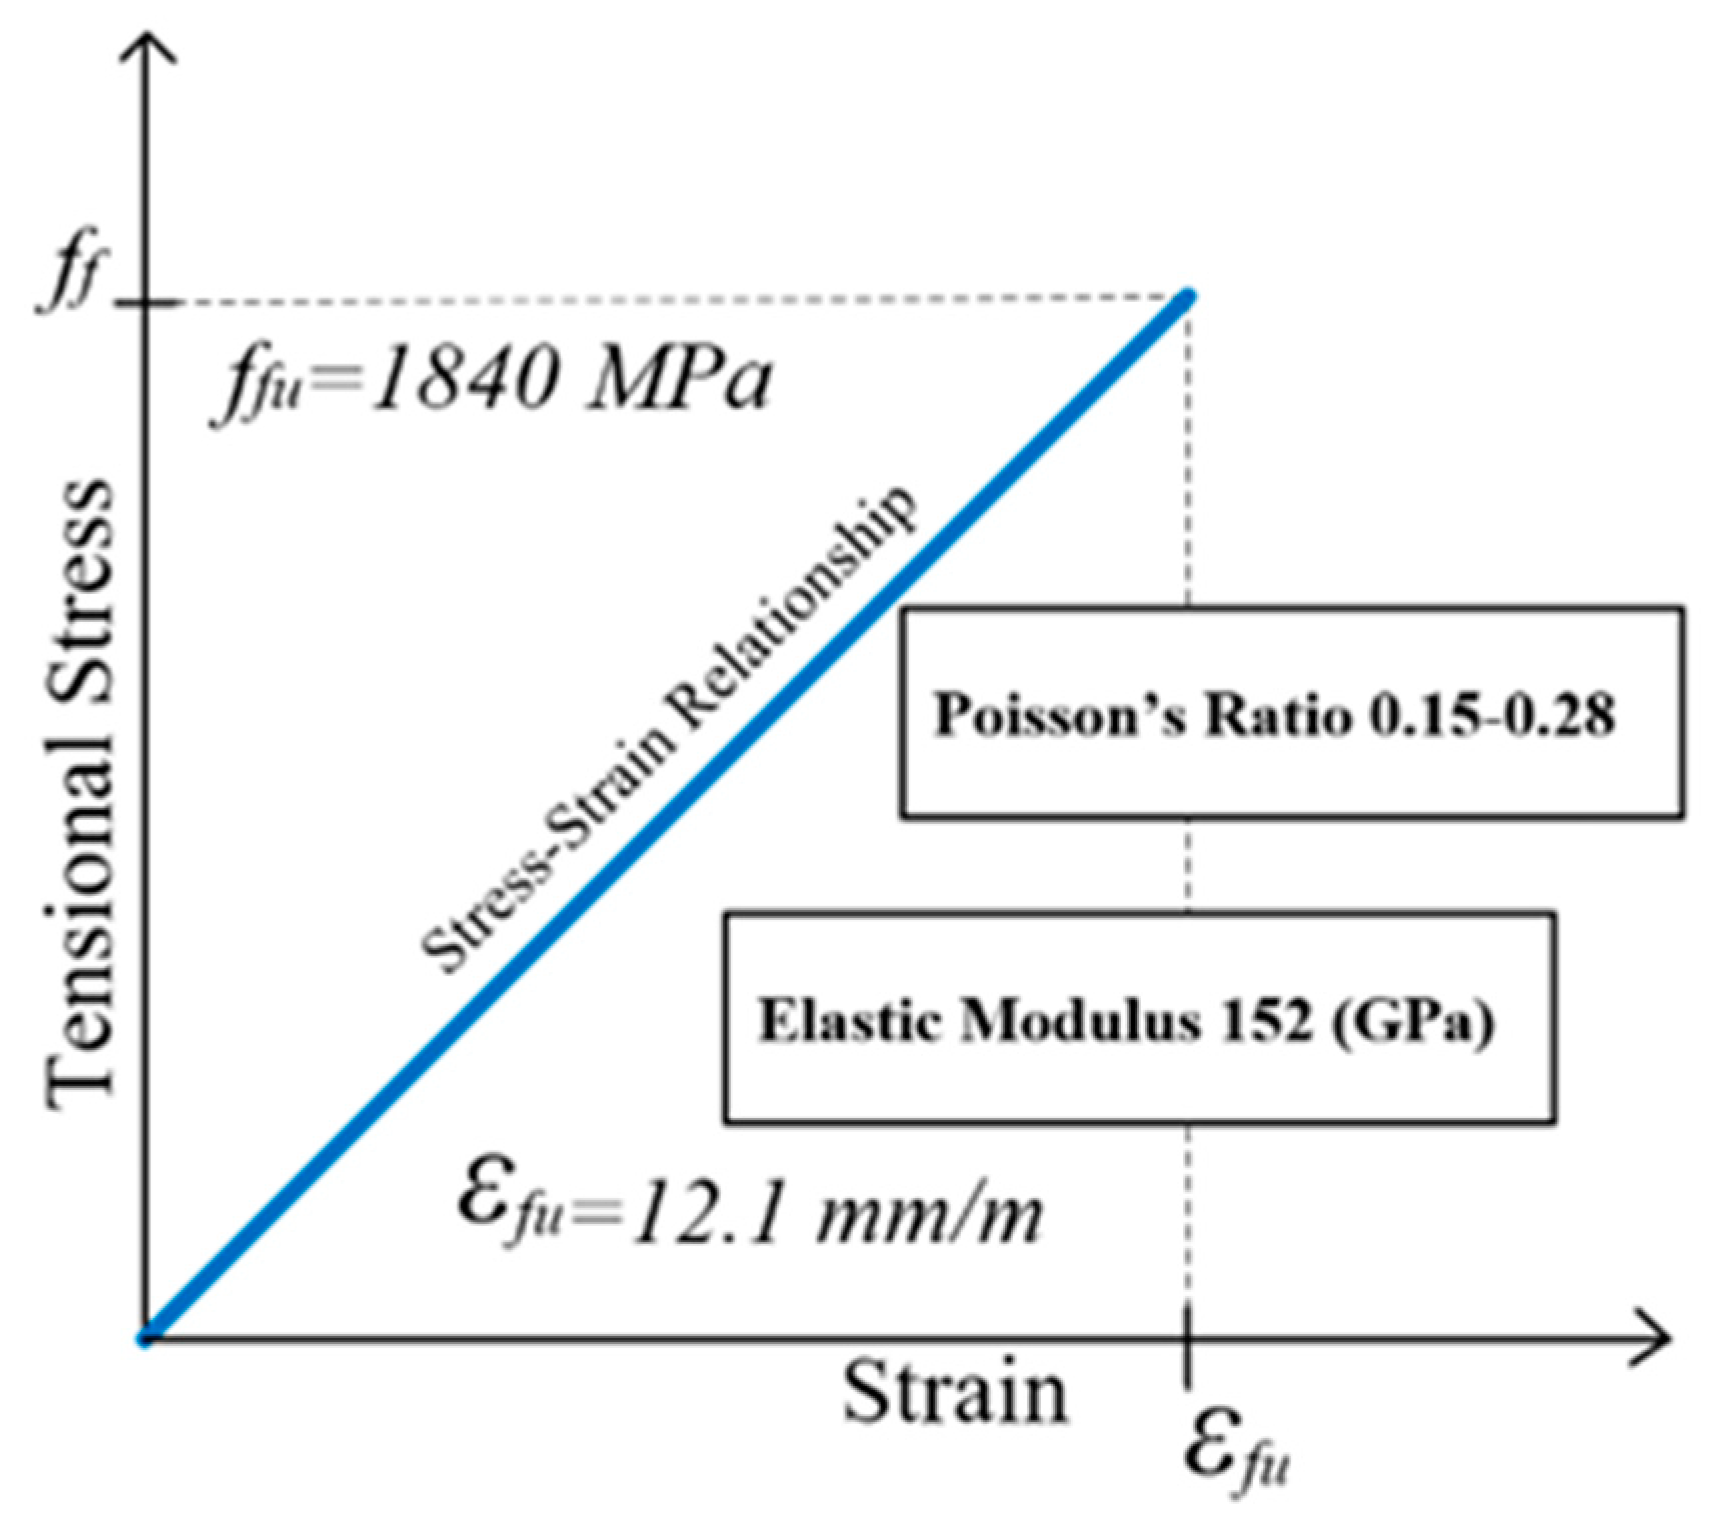
3.4. CFRP Reinforcement Bars

The findings showed a linear relationship between the creep rupture strength of CFRP bars and the logarithm of time, for durations extending up to nearly 100 h. This extrapolation can be found in [32] for the long-term durability and reliability of CFRP as a reinforcing material in construction applications. Figure 5 shows the relationship between the residual strength (SR) of CFRP (as a percentage) and the age of the material (years).
The slope of the trend line is 0.14, signifying a yearly decrease in residual strength of 0.14%. The graph shows that after approximately 50 years, the SR is at 93%, and predictions extend this trend to suggest that the residual strength will decrease to slightly below 80% by year 150. Figure 5 represents the decrease in strength over time, emphasizing the durability of CFRP reinforcement over extended periods. Such insights influence design and maintenance decisions for long-term infrastructure planning.

3.5. Reinforced Concrete

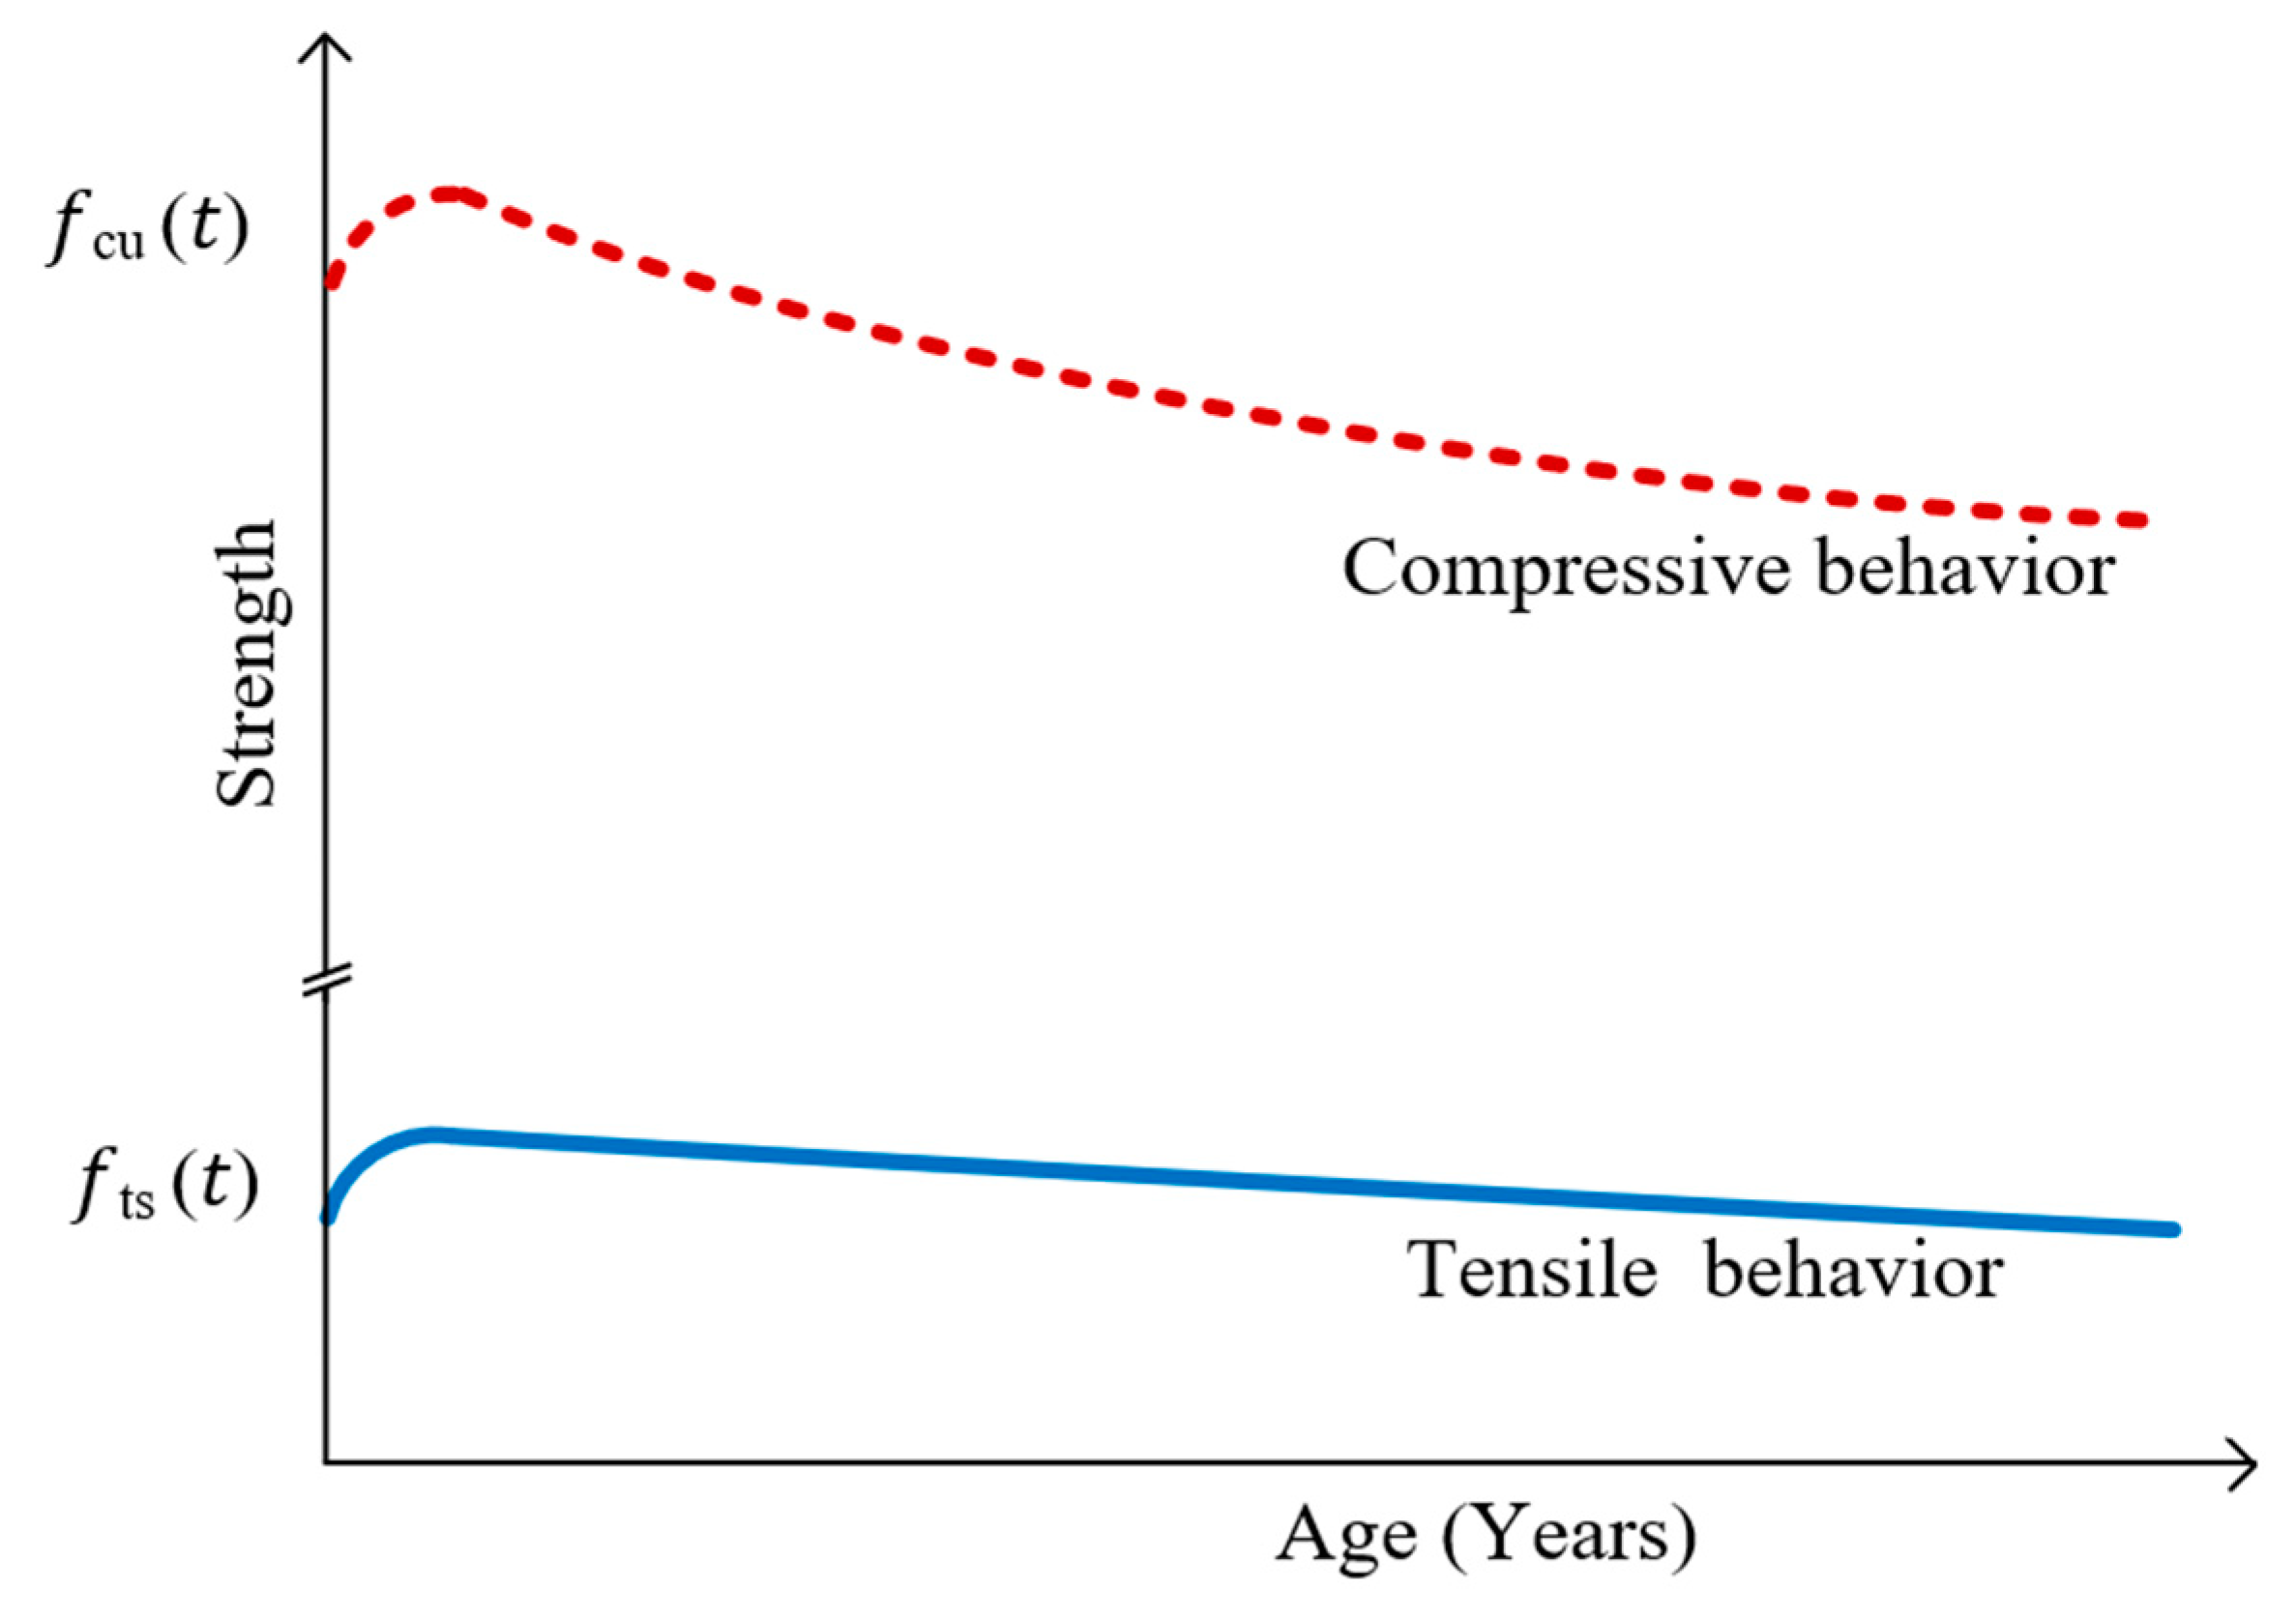
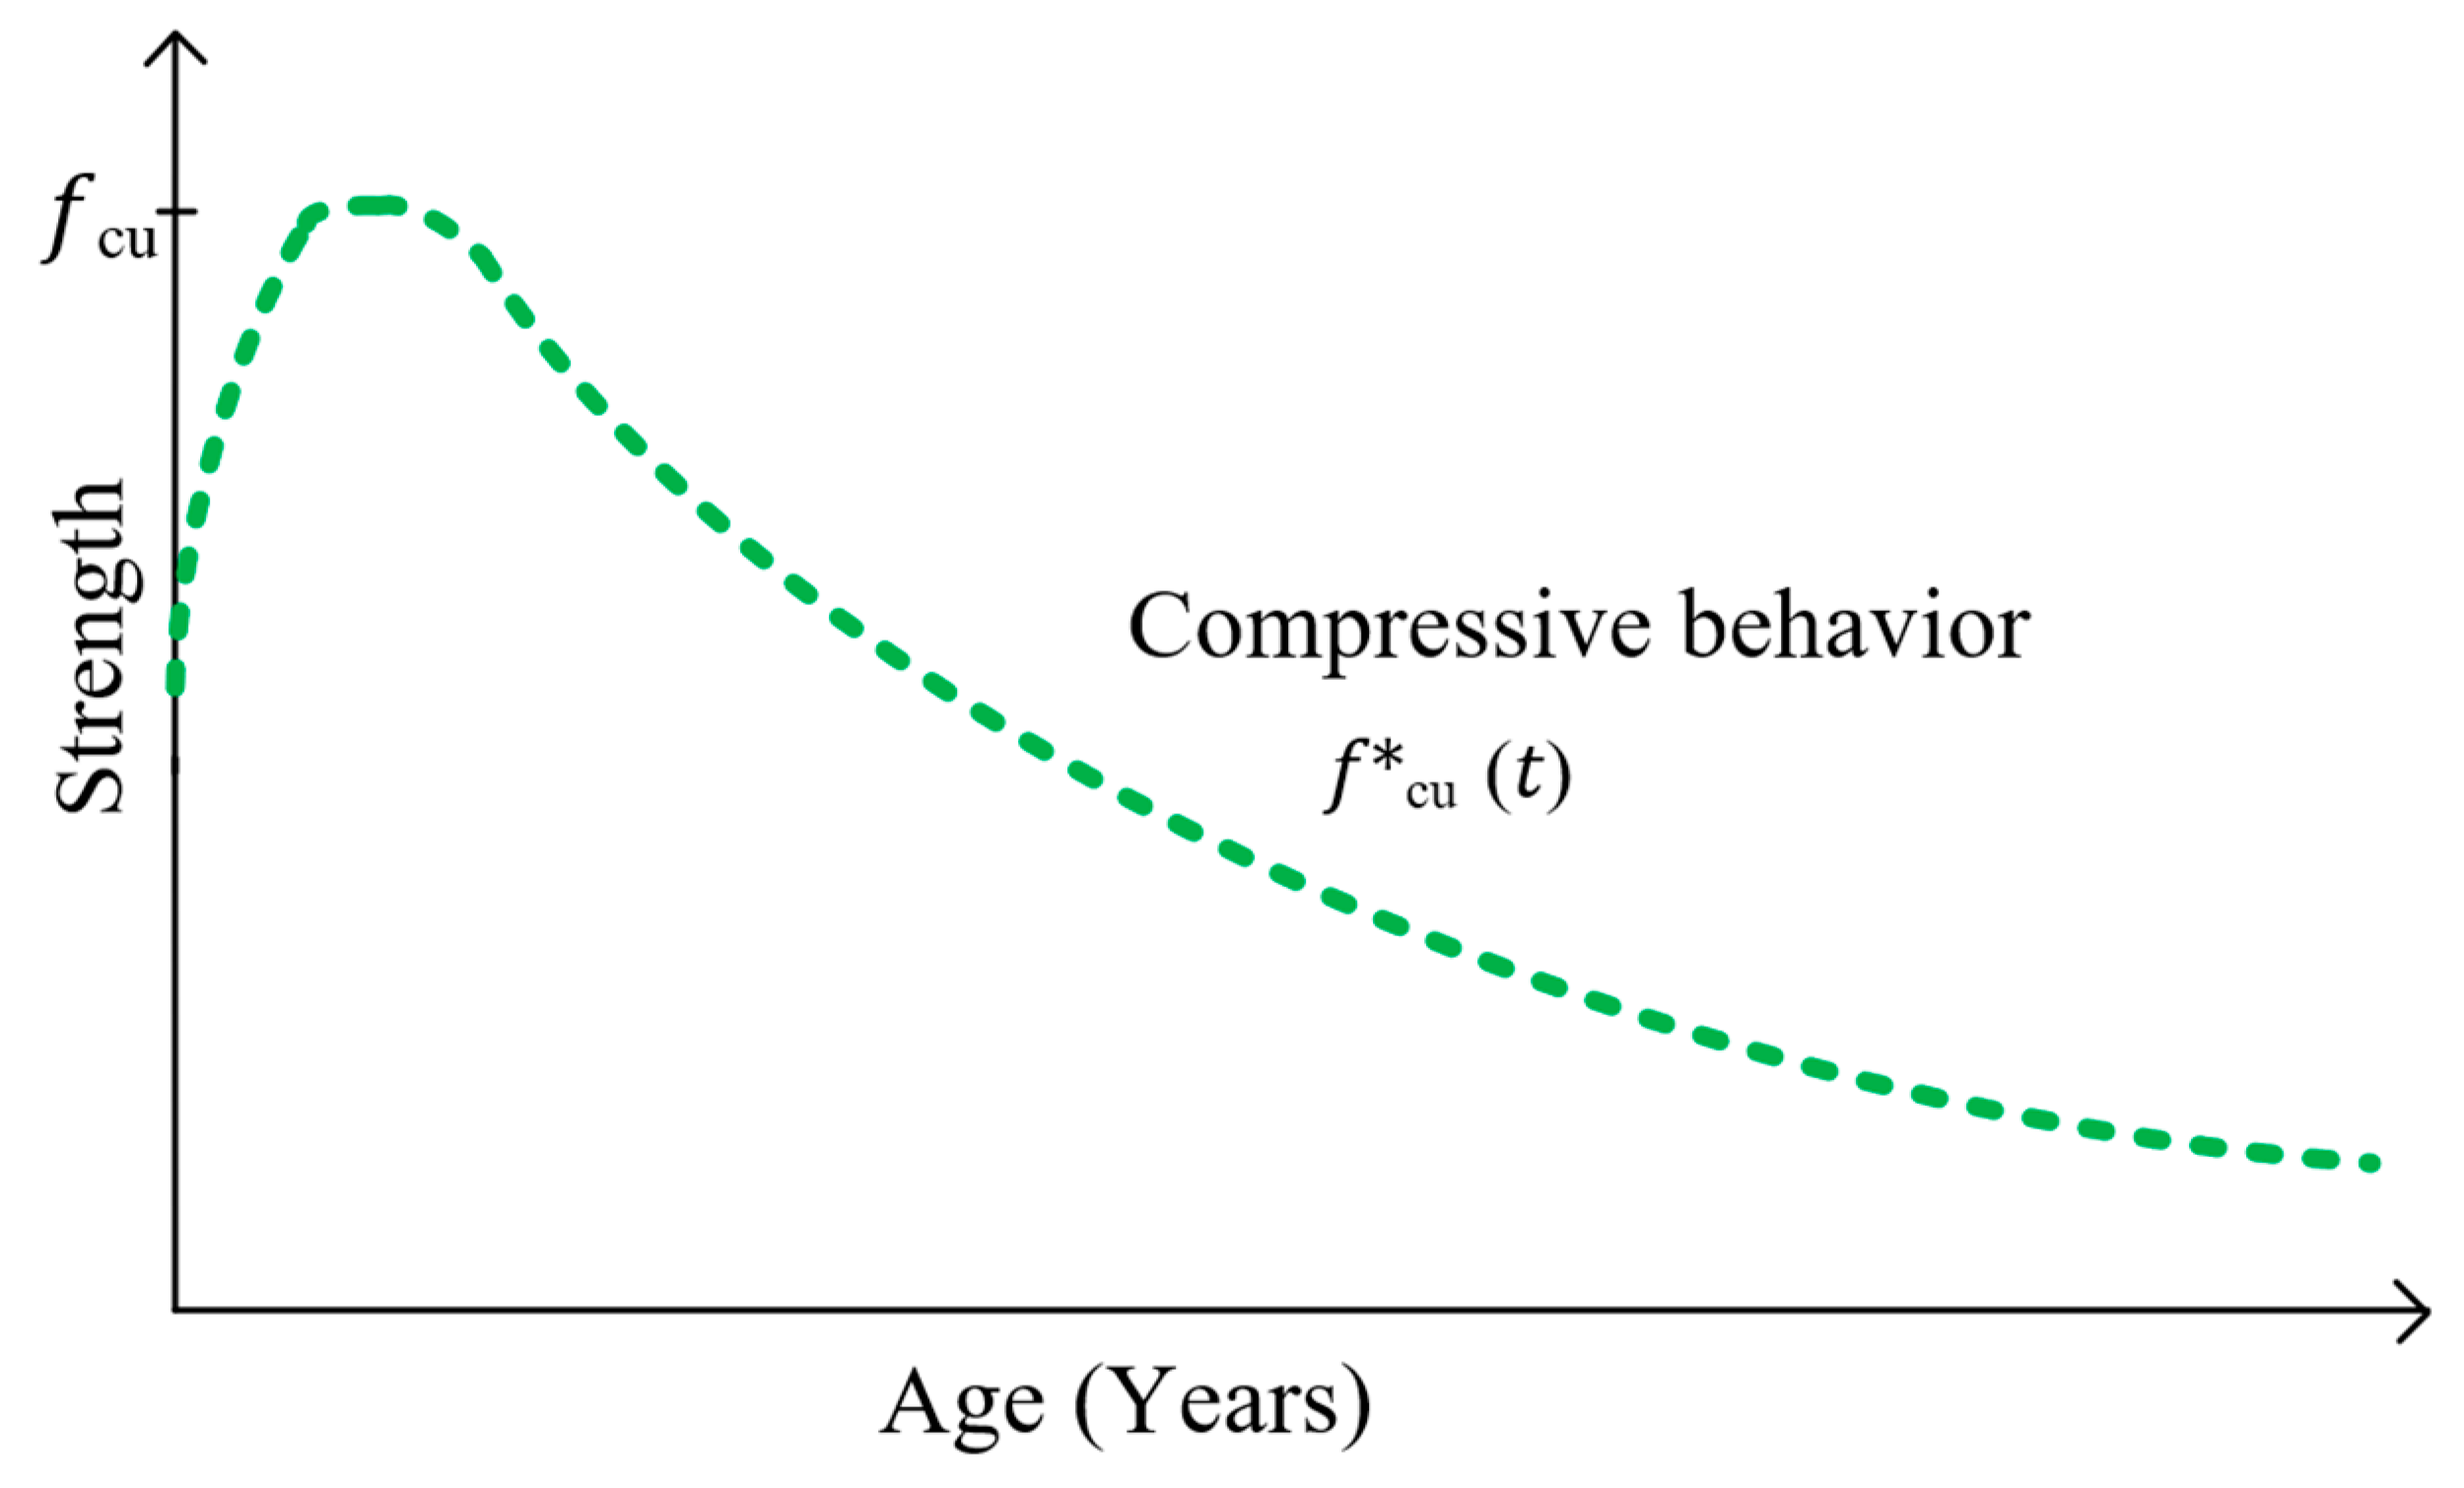
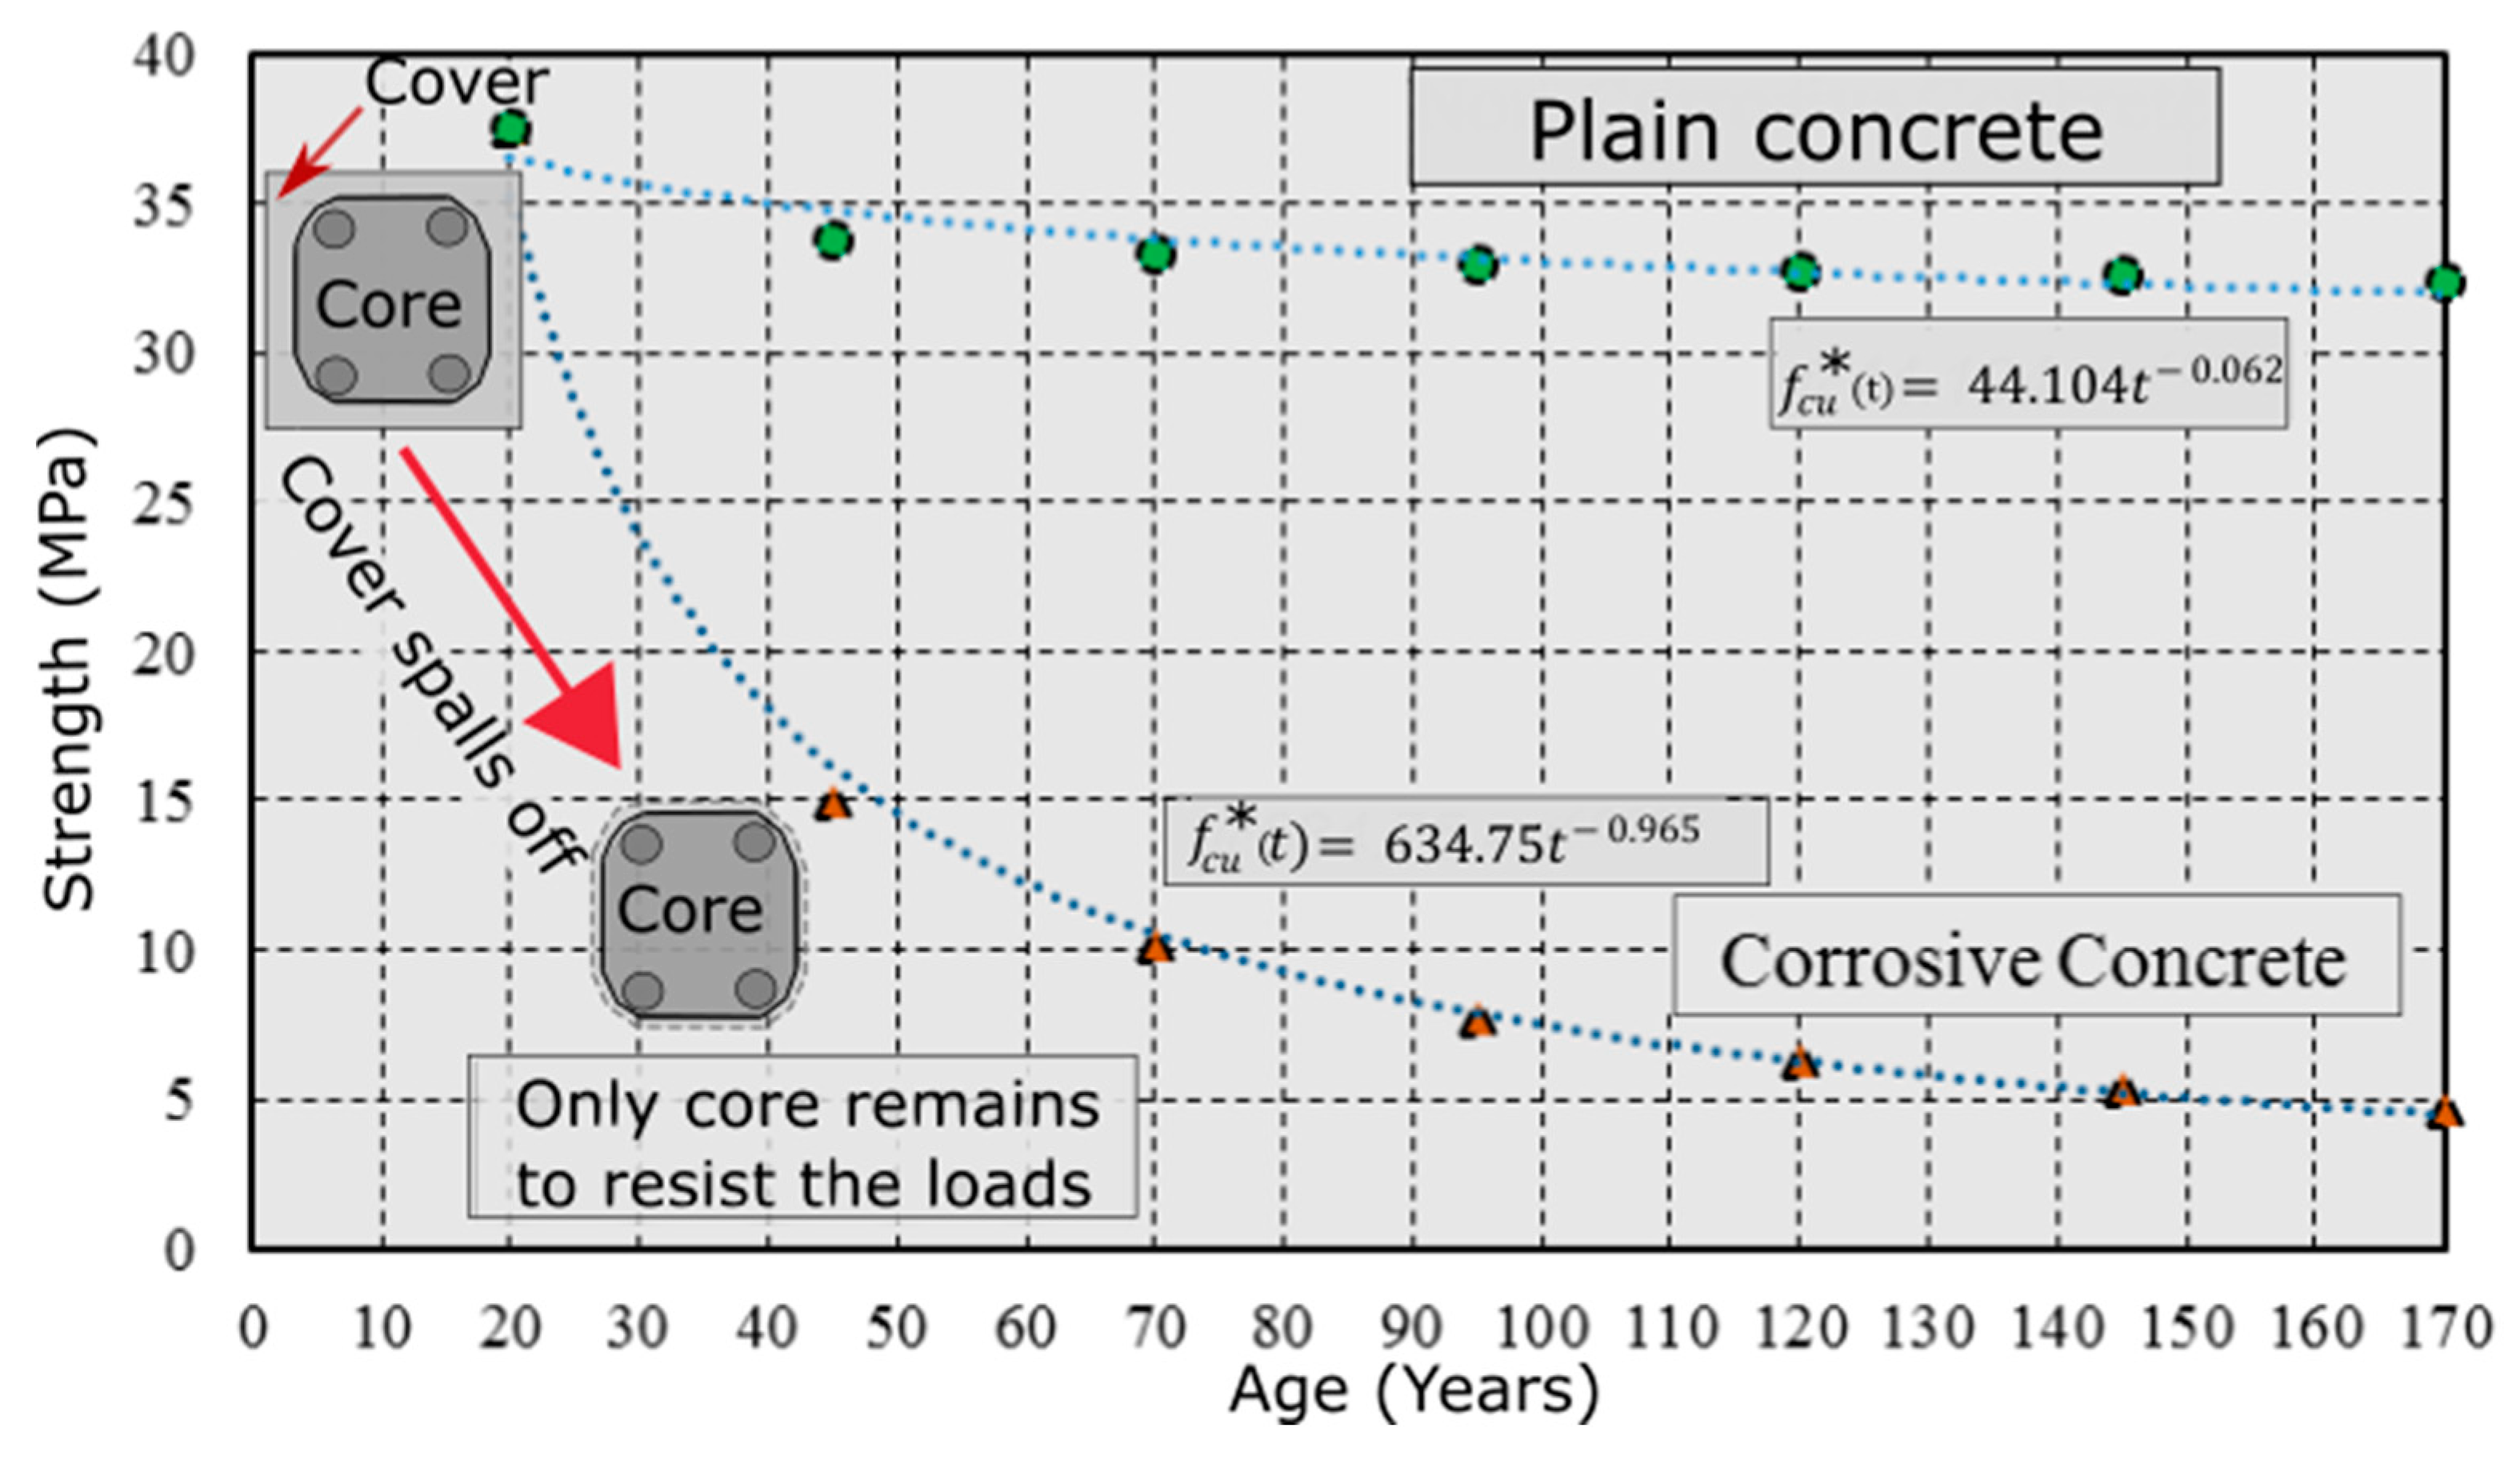
3.5.1. Concrete Compressive Strength

This section explores the phenomenon of corrosion penetration and its subsequent impact on the compressive strength, stiffness, and ductility of RC elements. It is worth noting, as highlighted by Drago Saje [33,34], that the influence of steel bar creep on the compressive strength of RC elements is relatively small, especially when compared to the creep of CFRP, which significantly affects both compressive strength and ductility.
The focus of this section is primarily on reducing compressive strength as a fundamental cause of deterioration in concrete structures. Addressing this critical issue involves the exploration of methodologies to accurately predict the compressive strength of corroded concrete, with specific emphasis on RC beams. Herein, we adopted an empirical equation highlighted in the studies by Di Sarno and Pugliese [4], as presented in Equation (11).
β = f c u * ( t ) f c u = 1 1 + k · 2 π X · n b a r s b · ε c 2 ,
where f c u * ( t ) denotes the entire cross-section of the corroded compressive strength, fcu denotes the uncorded compressive strength, k is a variable, where setting k as 0.1 refers to medium rebar corrosion levels, X denotes the corrosion penetration length, b the width of the cross-section, ε c 2 the strain at the peak, and nbars the number of steel reinforcements in the compressive zone.
The research conducted by Di Sarno and Pugliese [4] emphasizes the critical need to accurately reflect the reductions in compressive strength to areas specifically impacted by corrosion. These areas ensure that estimations of the structural capacity loss remain accurate and grounded in the actual extent of corrosion damage. This methodology helps prevent the underestimation of a structure’s remaining load-bearing capability. Figure 6 shows the differential in compressive strength reduction across various sections.
Carbonation penetration in reinforced concrete structures is a time-dependent process that intensifies with concrete aging [35,36]. This carbonation process is notably more rapid in concrete of lower strength, where the porosity tends to be higher, facilitating the ingress of carbon dioxide. The adverse effect of carbonation on concrete strength is significant, as it not only reduces the alkalinity of the concrete, thereby endangering the protective oxide layer on the reinforcing steel, but also directly impacts the concrete’s structural durability. Equations (12)–(15) quantify the relationship between the depth of carbonation penetration and its detrimental effects on the concrete’s compressive strength:
X = K · t   ,
where X denotes the depth of corrosion penetration measured in (mm) and K denotes the carbonation coefficient (mm/year-1/2). K quantifies the rate at which carbonation progresses through the concrete over time, and t denotes the exposure time to CO2 (years).
In the study conducted by Monteiro et al. [35], the compressive strength of concrete was meticulously computed and subsequently utilized to estimate the carbonation coefficient, as presented in Equation (13).
K = 847 f c u * 1.435 ,
The research conducted by Di Sarno and Pugliese [4] significantly advanced the understanding of concrete durability by establishing a correlation that links the ultimate strength of concrete to its age, considering the varying diffusion rate K of carbon. Their work recognized that the diffusion rate of carbon increases as the concrete’s strength decreases over time, highlighting a critical aspect of concrete aging and deterioration. In our analysis, we evaluated this relationship by integrating Equations (11)–(13), which collectively help define the compressive strength (fcu). This relationship is explicitly expressed through Equations (14a) and (14b).
f c u = f c u * t + γ · t ·   f c u * 0.435 t ,
log ( f c u * t ) = log f c u γ / 0 . 565 ,
where γ denotes the mean value, which is explicitly displayed in Equation (15).
γ = 0.2 π · 847 · n b a r s   b · ε c 2 ,
Figure 7 presents a schematic illustration of the trend in decreasing concrete strength over time due to corrosion, and was generated based on the study by Ismail, Muhammad, and Ismail [37].

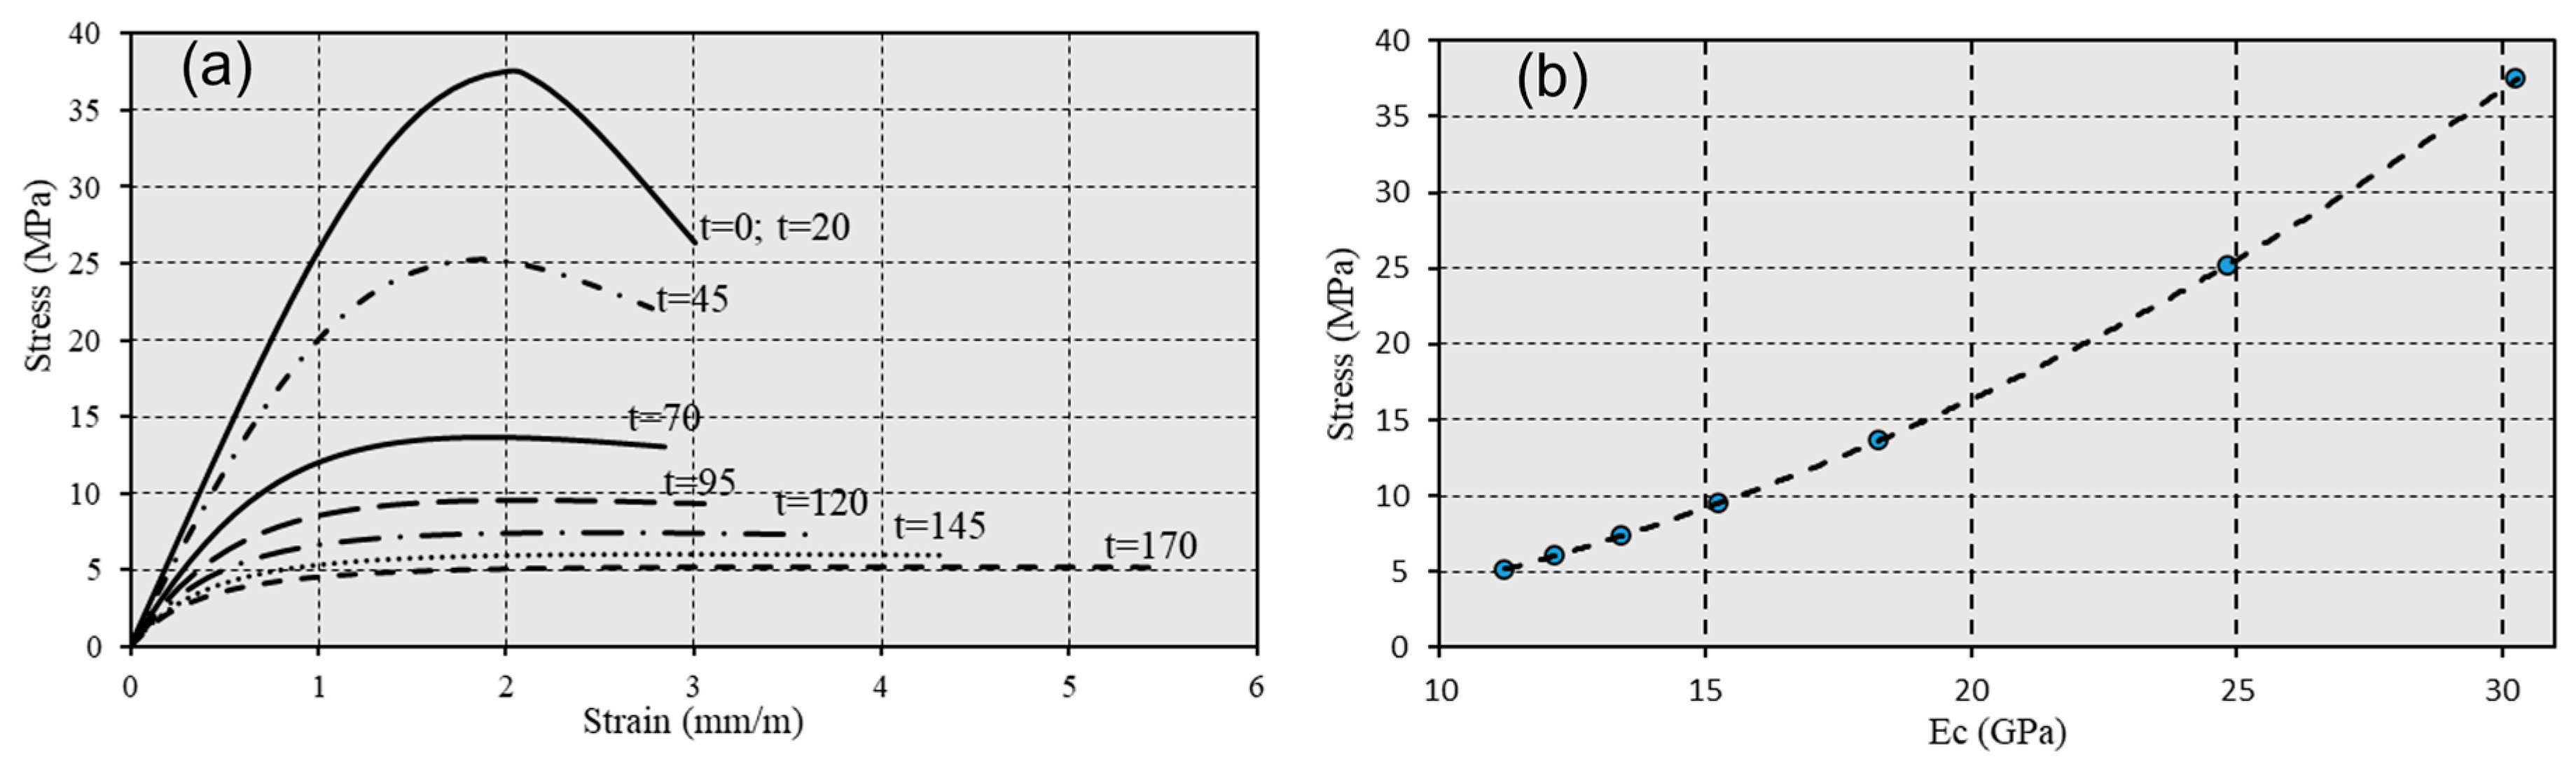
3.5.2. Concrete Elastic Modulus

Change in the modulus of elasticity is a fundamental property indicative of the concrete’s degradation level. This degradation significantly dictates the seismic resilience of structures by influencing their capacity to absorb and dissipate energy during earthquakes. In this study, the reduction in modulus of elasticity over time is addressed by incorporating our previous calculations of compressive strength reduction into Equations (16)–(18), outlined in Eurocode 2. Eurocode 2 [38] provides a detailed quantitative approach to establish the correlation between the modulus of elasticity and the concrete’s strength.
To calculate the initial tangent modulus of elasticity, Eci, the variation modulus required, can be determined using Equation (16).
E c i = 2.15 · 10 4 · f c u + 8 10 1 3
The plastic strain is obtained by reducing Eci, as specified in Equation (17).
E c = 0.85 · E c i
The variation in the modulus of elasticity over time can be estimated using Equation (18), which incorporates the modified modulus of elasticity Ec into the calculation.
E c ( t ) = E c · f c u * ( t ) / f c u 1 / 2
A stress–strain curve was generated based on Equations (16)–(18), and the compressive strength, fcu, was determined from Equation (14), as illustrated in Figure 8a. Additionally, we depicted the degraded modulus of elasticity as a function of time (years) to demonstrate the long-term response.
The compressive strength and modulus of elasticity depicted in Figure 8 are comprehensively compiled in Table 2 and Table 3.

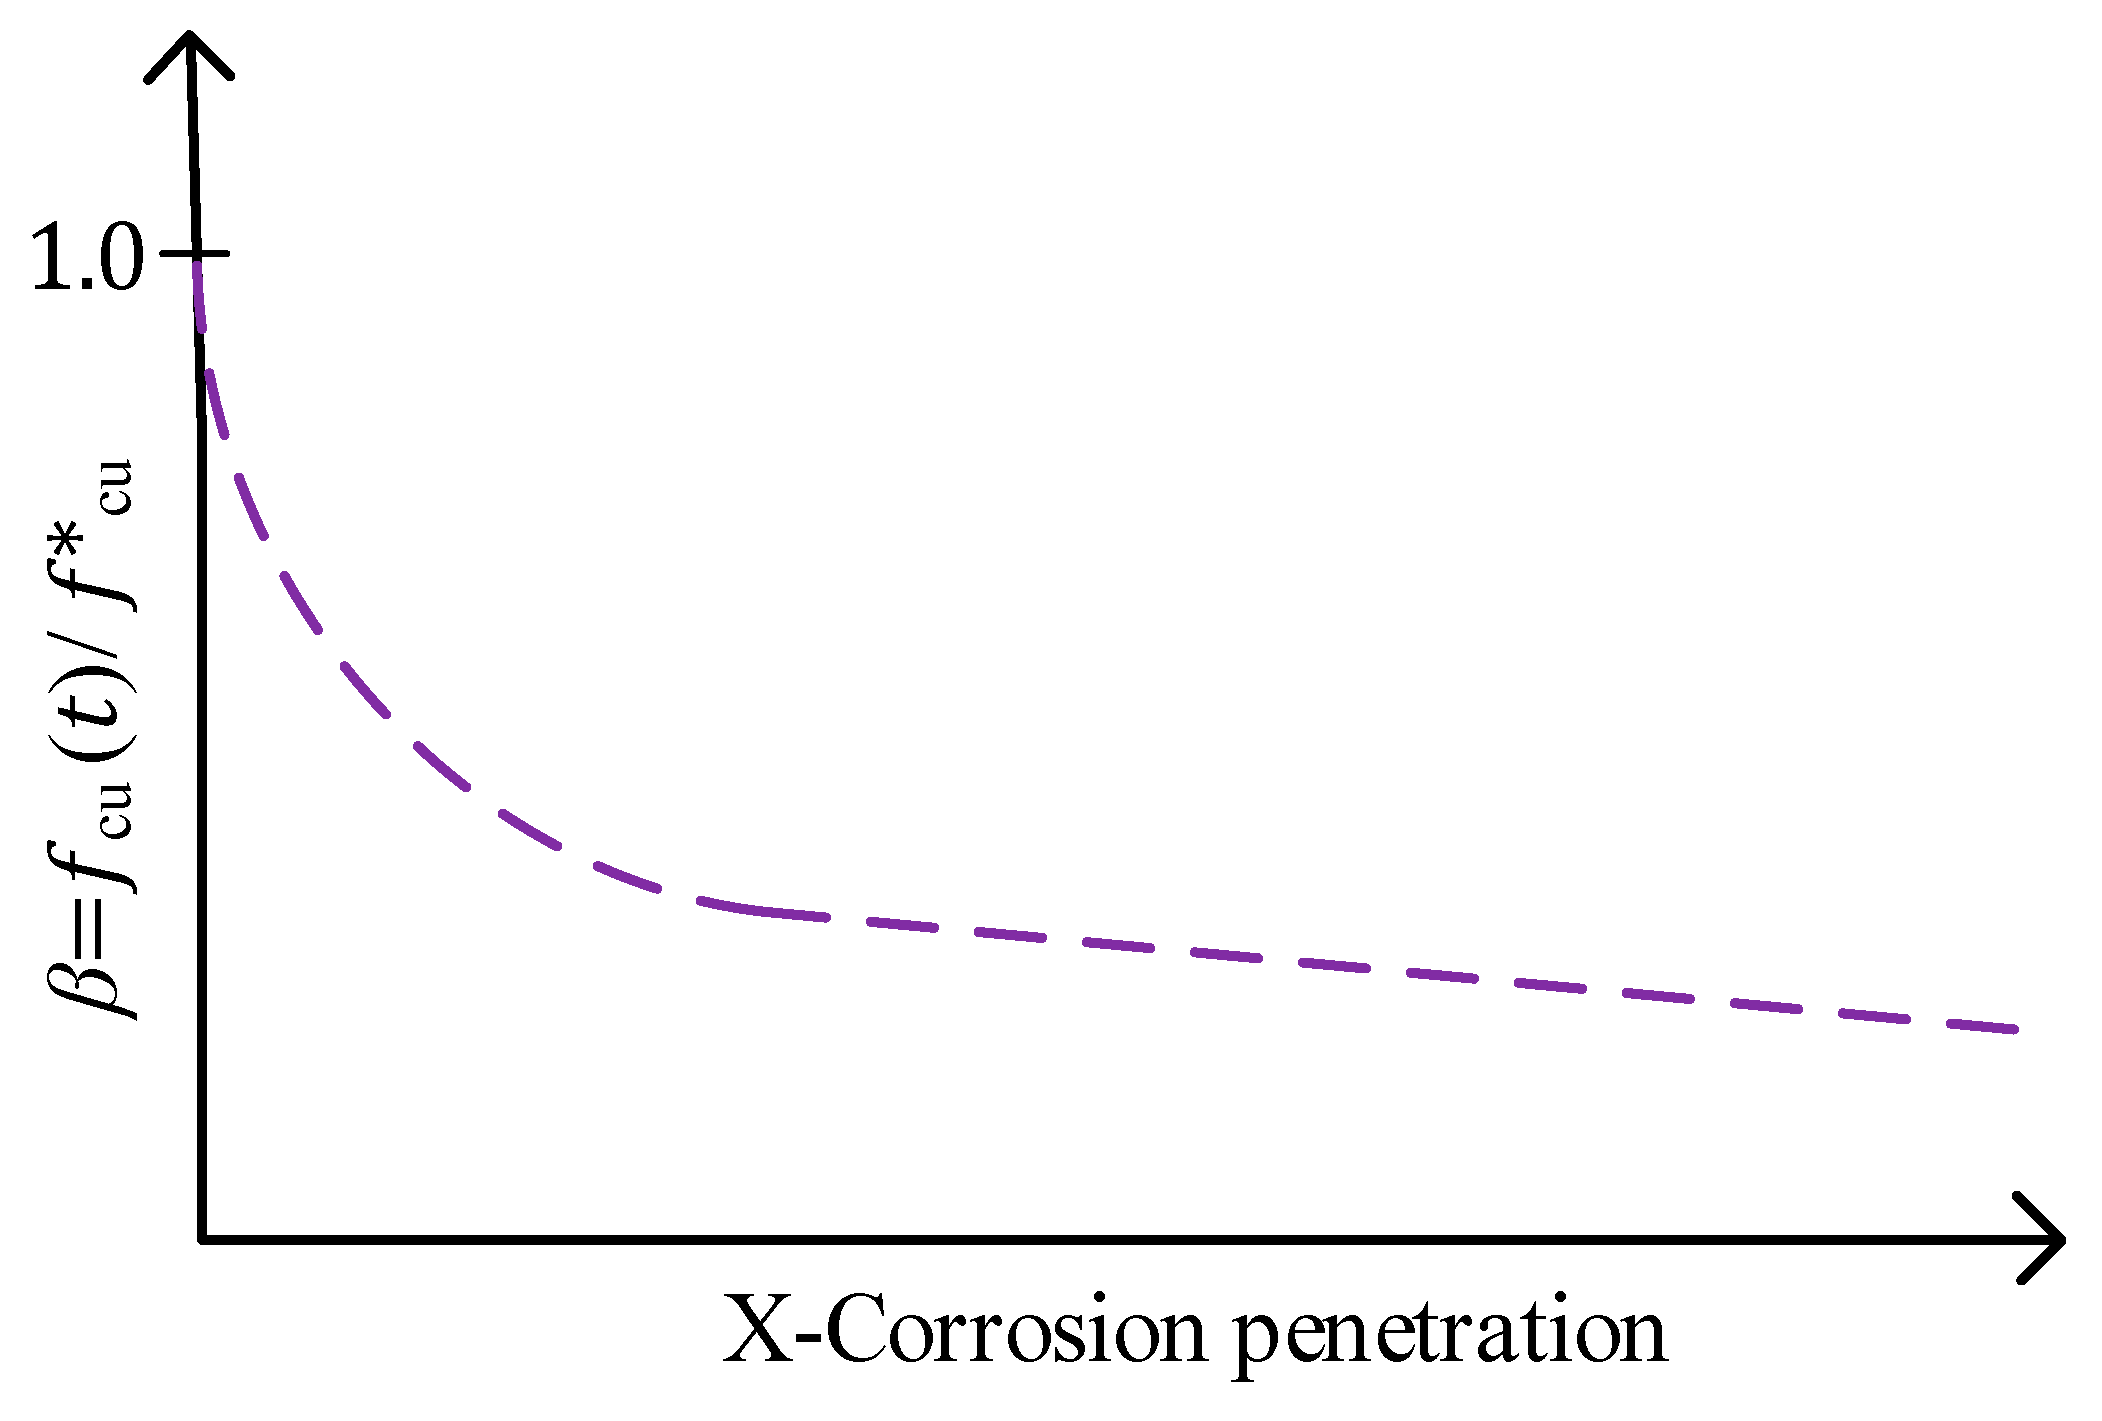
3.5.3. Reduction in Cross-Sectional Area Due to Corrosion-Induced Cover Cracking

In this section, we defined the effect of corrosion on cracking and the relationship between corrosion and erosion of the section and residual areas over the years at influenced times. The structure remains unaffected by corrosion for the first twenty years (t = 0 to t = 20 years), as the cover protects the steel reinforcement from corrosive substances. This period is in line with CO2 and chloride ion diffusion models [39,40], suggesting that these substances do not reach the steel-to-concrete interface in sufficient quantities to initiate corrosion within this timeframe. However, by the twenty-year mark (t = 20 years), diffusion processes enable CO2 and chloride ions to penetrate the protective barrier and reach the steel–concrete interface where they initiate the corrosion process. This moment marks a critical shift, leading to the gradual erosion of the protective cover as corrosion advances. From t = 20 to t = 40 years, the build-up of corrosion products causes increasing pressure on the surrounding concrete, triggering cracking, especially in the tension areas. By the end of this period (t = 40 years), the structure exhibits full concrete cover cracking. The experimental results and empirical equations presented by Lu, Zhao, and Jin [41] and by Lu, Yang, and Liu [42] provide a comprehensive picture of the long-term effects of corrosion on RC structures. These findings, as presented in Equations (19)–(21), provide a method of estimating the timeline for concrete cover cracking. These equations depend on the initial concrete cover depth, corrosion rate, and the water–cement ratio.
i c o r r t = 1 = [ 37.80 1 W / C 1.64 ] / c
where w/c denotes the water–cement ratio within the concrete mix and c denotes the reinforcement-free cover, referring to the thickness of the concrete layer that protects the reinforcement steel from exposure to corrosive substances.
To define the corrosion rate over the years, we utilized the methodology presented by Lu and Liu [42]. More specifically, we adopted their recommendation of the time-dependent corrosion rate icorr, starting at t0 = 20 years.
i c o r r t = [ i c o r r t = 1 · 0.85 t t 0 ] 0.30
By adhering to the Khaled and Maadawy guidelines, one can determine and predict when the cover will fully spall, resulting in reduced cross-sectional area. This approach, as detailed by El Maaddawy and Soudki [6], allows for the calculation of the timeline, using the corrosion rate icorr measured in (10–4 g/cm2/day) (1 μA/ cm2 = 249 g/m2/day), utilizing Equation (21).
t c r = 0.602 · d ( 1 + 2 c d ) i c o r r 0.85
Beyond tcr days, when spalling of the cover occurs, the cross-sectional area is recalculated without the protective cover.
In plain (non-reinforced) concrete, the corrosion phenomena described in this section are not present. Instead, a carbonation process occurs, as detailed in the study by Al-Ameeri et al. [43]. This carbonation phenomenon does not lead to cracking of the cover, thereby preserving the effective cross-sectional area of the concrete for many years.

4. Predictive Analysis of Seismic Capacity Resistance

This section examines the ductility of the selected structure as outlined in Equation (22), which involves the evaluation of the actual seismic capacity using steel and CFRP reinforcement methods. For the purpose of characterizing the chosen structure with its shallow foundation, the structural frame was modeled with pinned support conditions at the base. The capacity was assessed across the structure’s lifespan (0–175 years) for both reinforced structures. The amounts of elastic and plastic energies that could be dissipated at any given time were quantified per Equation (23). The values at each time interval were then compared to the original values. The comparative analysis of these energy values enabled the definition of the ratio of the energies as the seismic resistance capacity factor, detailed in Equation (24). This comprehensive approach provided a deeper understanding of the structure’s ability to withstand seismic forces over an extended period by highlighting the long-term effects of different reinforcement materials on seismic resilience.
The presented frame in Figure 9 refers to conceptual of a rigid resistance frame. In the case study, a real frame from a benchmark structure was chosen.

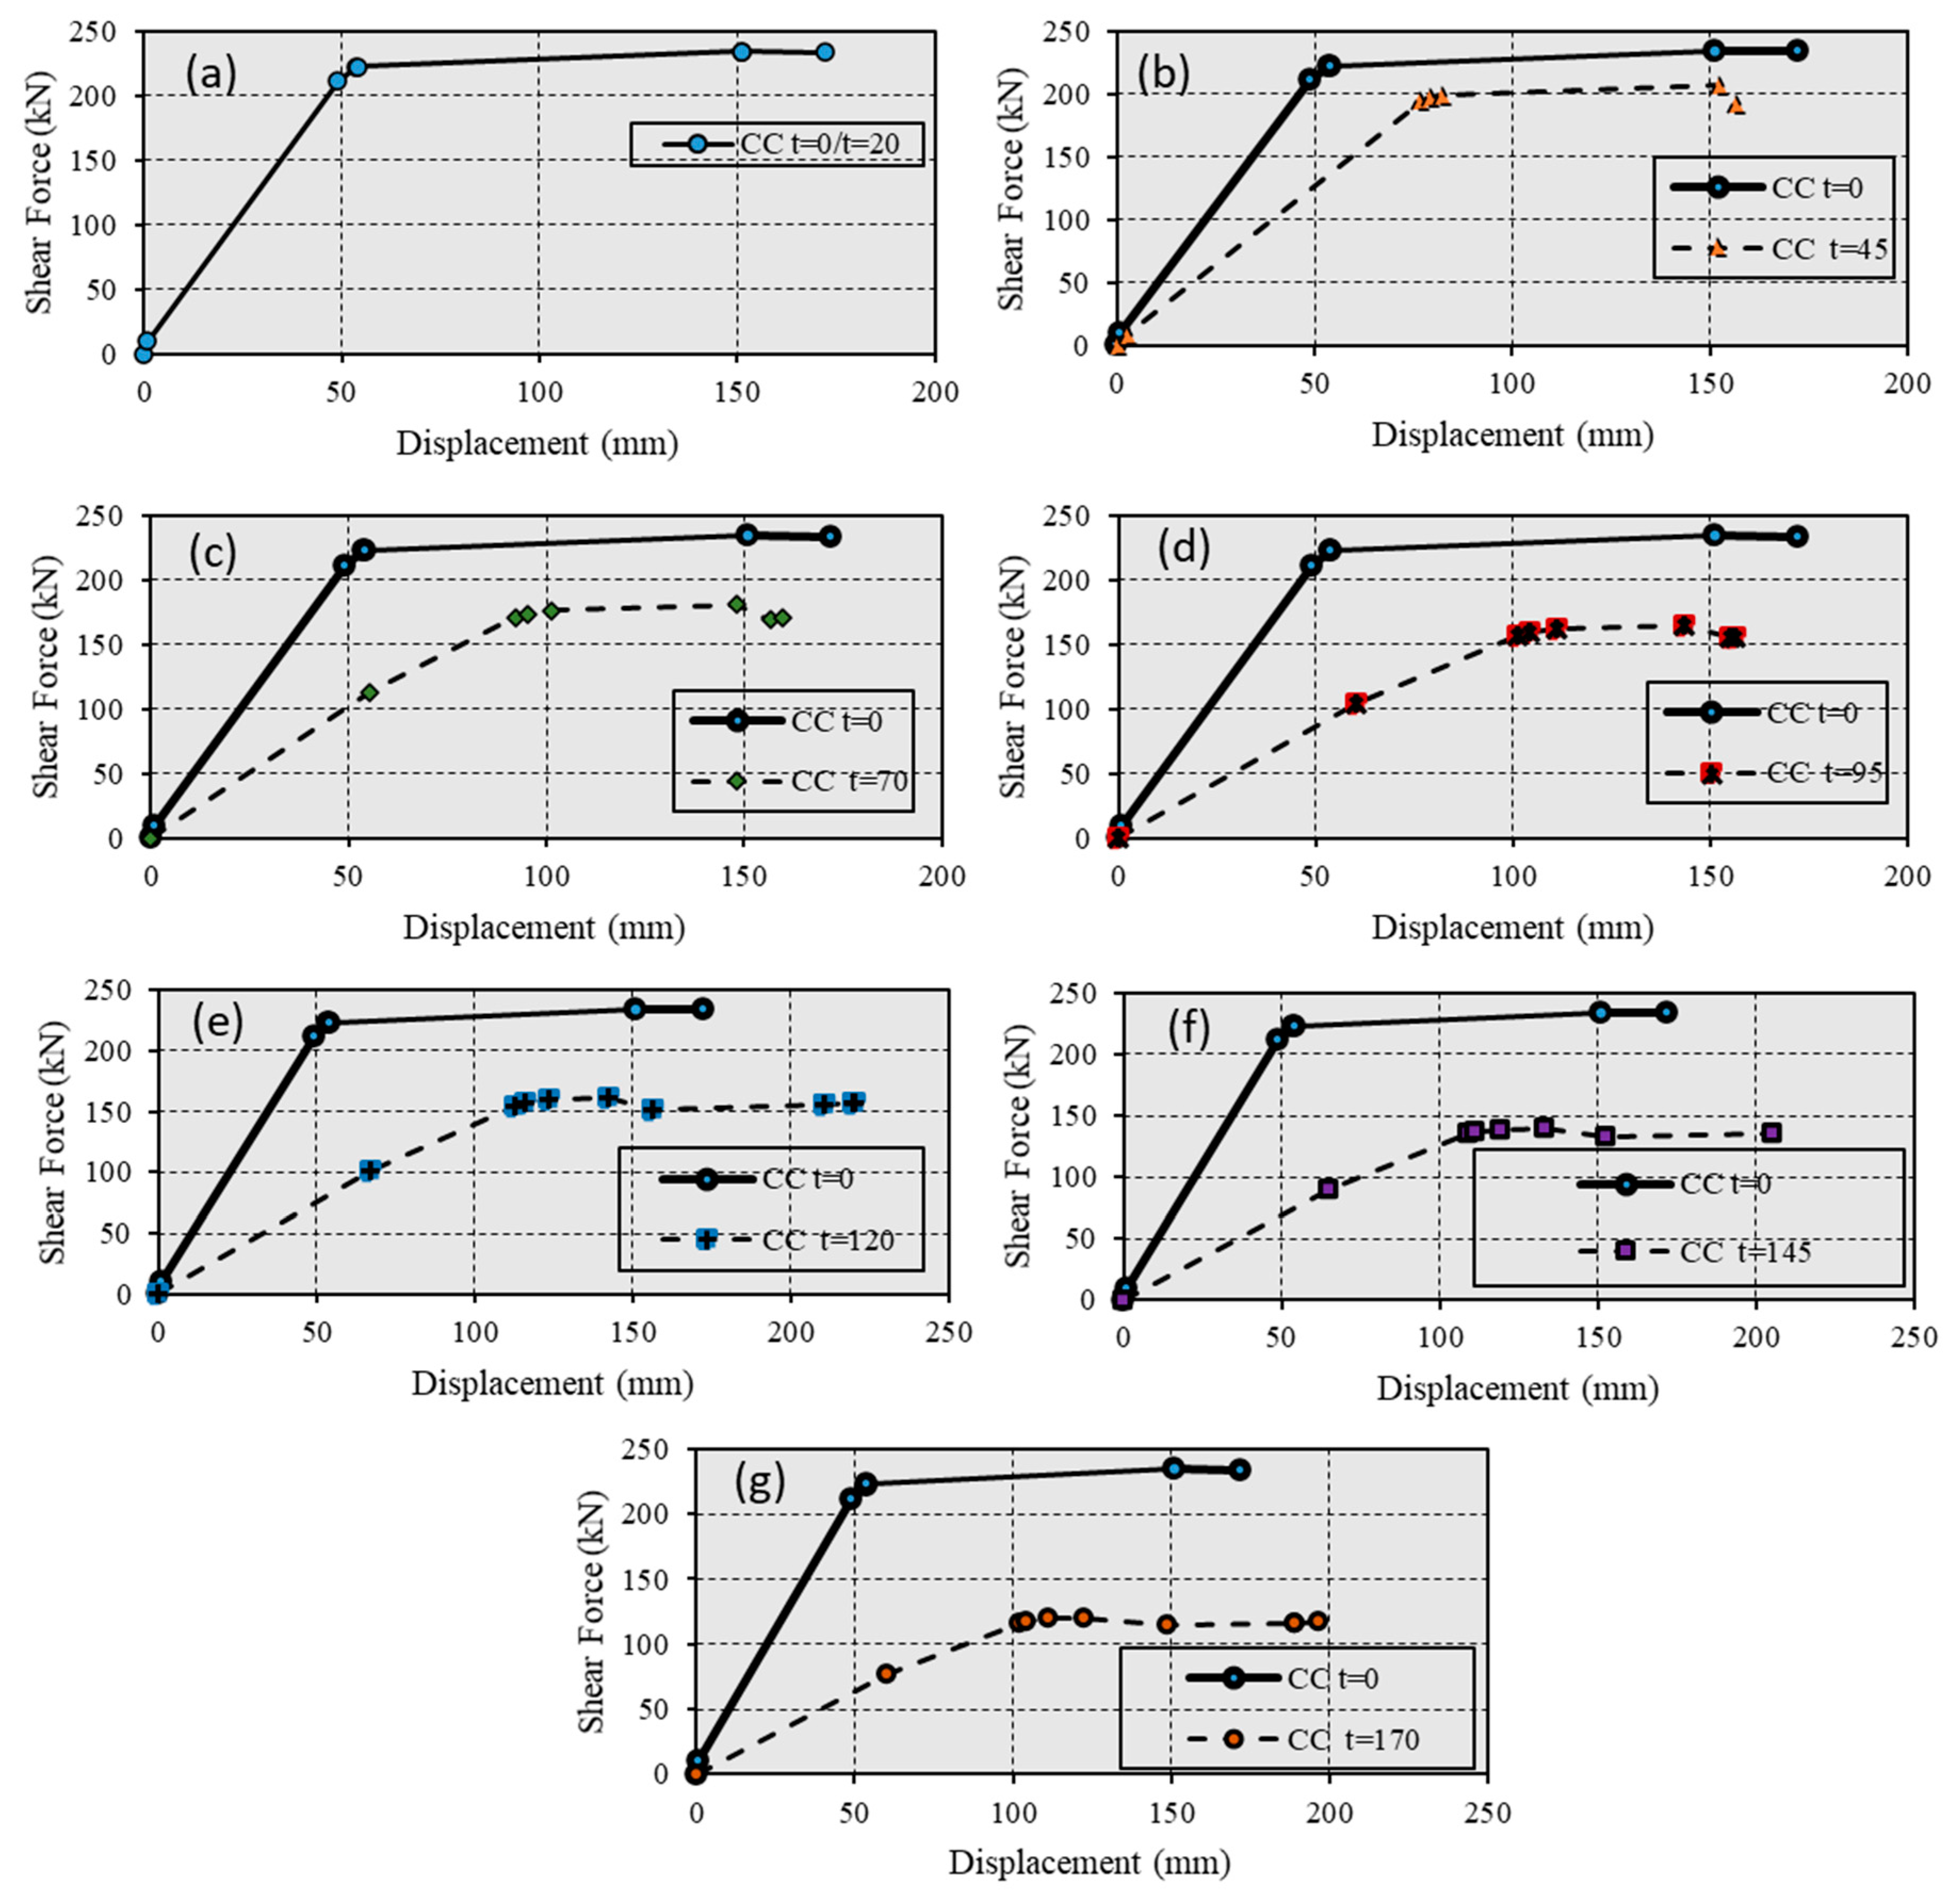
4.1. Pushover Analysis

The nonlinear static pushover analysis (NSPA) was employed to compute the capacity curves for the tested structures using SAP-2000, Version 10.07, a commercially available software [28] based on guidelines from FEMA-273 and FEMA-356 [44,45]. The model of the tested frame included all relevant features of the existing structure, along with the properties of members and joints used in previous modal analysis as presented in the studies [46,47,48].
The NSPA was conducted using the following steps: First, the structural model of the building was developed in SAP-2000, with the geometry, member properties, material characteristics, and support conditions defined, initially without incorporating pushover data. Next, we established the properties and acceptance criteria for pushover hinges based on the maximum stress occurring in either the compressive or tensile zones of the sections experiencing maximum bending. The yield strength of the RC sections, denoted as Fy, was determined and presented in Table 1 and Table 2. Our approach assumed that plastic hinges could form only at the frame’s joints, as no concentrated loads were applied.
The analysis was initiated by applying gravity loads to establish the structure’s initial conditions. Following this, lateral loads were assigned during the pushover loading phase, commencing from the final conditions set by the gravity load case. These lateral loads were incrementally increased and distributed in line with the structure’s first mode of free vibration. This setup simulates earthquake conditions by applying loads in a triangular pattern, which effectively models the step-by-step lateral displacement of the frame in one direction. To ensure the analysis faithfully represented the building’s expected seismic performance, maximum and minimum load steps, incremental event loads, and deformation tolerances were meticulously selected by the guidelines provided in [1].
The model incorporated failure criteria for all joints and the structural members’ moment and shear capacity. As the lateral loads increased incrementally, elements began to yield sequentially, altering the frame’s stiffness as new plastic hinges formed. The displacement at the roof was chosen as the control point for the NSPA, and the resulting capacity curves were generated by plotting the base shear against the roof displacement.

4.2. DEM Analysis

The Dissipation Energy Method (DEM) is employed in our study as a critical analytical approach to evaluate the energy dissipation capacity of structures subjected to seismic loading. This method critically assesses how much energy a structure can absorb and dissipate through inelastic deformation without significant damage or structural failure. The method quantifies the total energy a structure can dissipate during seismic events without reaching failure. This method includes both elastic (recoverable) and plastic (permanent) deformations, which are critical for assessing the structure’s ductility and energy absorption capabilities.
The core objective of using DEM in our analysis is to determine the ductility, resilience, and overall seismic performance of the examined structures. The quantification of seismic resistance—or the lack thereof—is fundamentally derived from the amount of energy a structure can dissipate. This approach aligns with models rigorously verified and published in FEMA guidelines. The utility and verification of these models have also been demonstrated in seminal research by Moab and Igor [48], providing a solid foundation for their application in our work.
In the DEM framework, ductility is specifically quantified using a metric that relates the ultimate displacement a structure can endure to its yielding displacement. This relationship is mathematically expressed in Equation (22). By integrating this methodological approach, our pushover analysis precisely measures the structure’s capacity to withstand and adapt to seismic forces, thereby yielding valuable insights into its structural integrity and safety:
μ = U u U y
High ductility signifies that a structure exhibits a greater capability to dissipate energy. In the context of concrete components (CC), the total dissipated energy (Et) includes both elastic (Esc) and plastic (Epc) energy contributions, as delineated in Equation (23):
E t = 0 U u C C U d U = E s c + E p c
The DEM analysis generates two distinct curves. The first curve, termed CC t = 0, maps the structure’s response from a classical POA at the initial time of t = 0 years, representing the non-degraded state. The subsequent curve (CC t = N) represents the structure’s shear capacity based on its lateral capacity at a future point in time. Figure 10 provides a schematic visualization of these principles.

4.3. Seismic Resistance Prediction Method (SRPM) Overview

The SRPM utilizes the results of DEM to analyze structural behavior across various periods, as illustrated in Figure 10. This figure shows the curves representing progressive material degradation and structural property evolution over time. The analysis integrates the curves defined in Equation (23) for each curve’s incremental time steps at t = N. This integration enables quantification of the energy dissipated by the structure at various stages throughout its lifetime. The analytical process then estimates the ratio of future energy dissipation, E (t = N, N + 1, N +...) to the initial energy dissipation E(t = 0)), as outlined in Equation (24). This approach, discussed in works [47,49], emphasizes the importance of understanding and quantifying energy dissipation when assessing the seismic resilience of structures.
R C F ( t ) = E t t = N E t t = 0
The ratios between the results presented in Figure 10 are shown in Figure 11a were converted into a new presentation as shown in Figure 11b. In this figure, the X-axis represents the age of the structure, while the Y-axis displays the RCF.
The curve in Figure 11b shows a linear long-term trend of the resistance factor, indicating how the structure’s ability to resist seismic forces changes over time. This tendency is quantified by Equation (25).
R C F t = a t + 1
where α denotes the slope of the trend line; this value can vary depending on the initial conditions of the building environment and materials, as mentioned in Section 3.

5. Case Study

The proposed assessment procedure is distinguished by its reliance on the structural characteristics of the examined structure and the geo-seismic context of its location, rendering it a versatile tool unrestricted by specific structural types or seismic scenarios. Nevertheless, the outcomes of the assessment are highly contingent on the particular tests conducted. For instance, a structure in a seismically active region is anticipated to exhibit a lower resistance and performance ratio than an identical structure in an area with a lower likelihood of earthquakes. This decreasing resistance factor emphasizes the need for more conservative seismic design requirements and potentially higher costs for retrofitting.
To demonstrate the practical application of our methodology and validate its capability to evaluate the earthquake resilience of existing and new constructions, we applied it to a frame-type scheme, as illustrated in Figure 12. This application includes calculating resistance ratios and exploring alternative construction scenarios incorporating non-corrosive design principles. Furthermore, we assess the effectiveness of the DEM across various stages of the structure’s lifespan, employing both steel and CFRP reinforcements. These materials were chosen due to their extensive documentation in scientific research and their significant applicability in engineering practices.
The benchmark structure selected for this study was based on the comprehensive real-world analysis conducted by Moab and Igur [48], which involved investigating 18 existing buildings. This choice ensures that our findings are grounded in practical realities and reflect the complexities of actual structural behavior under seismic stress.

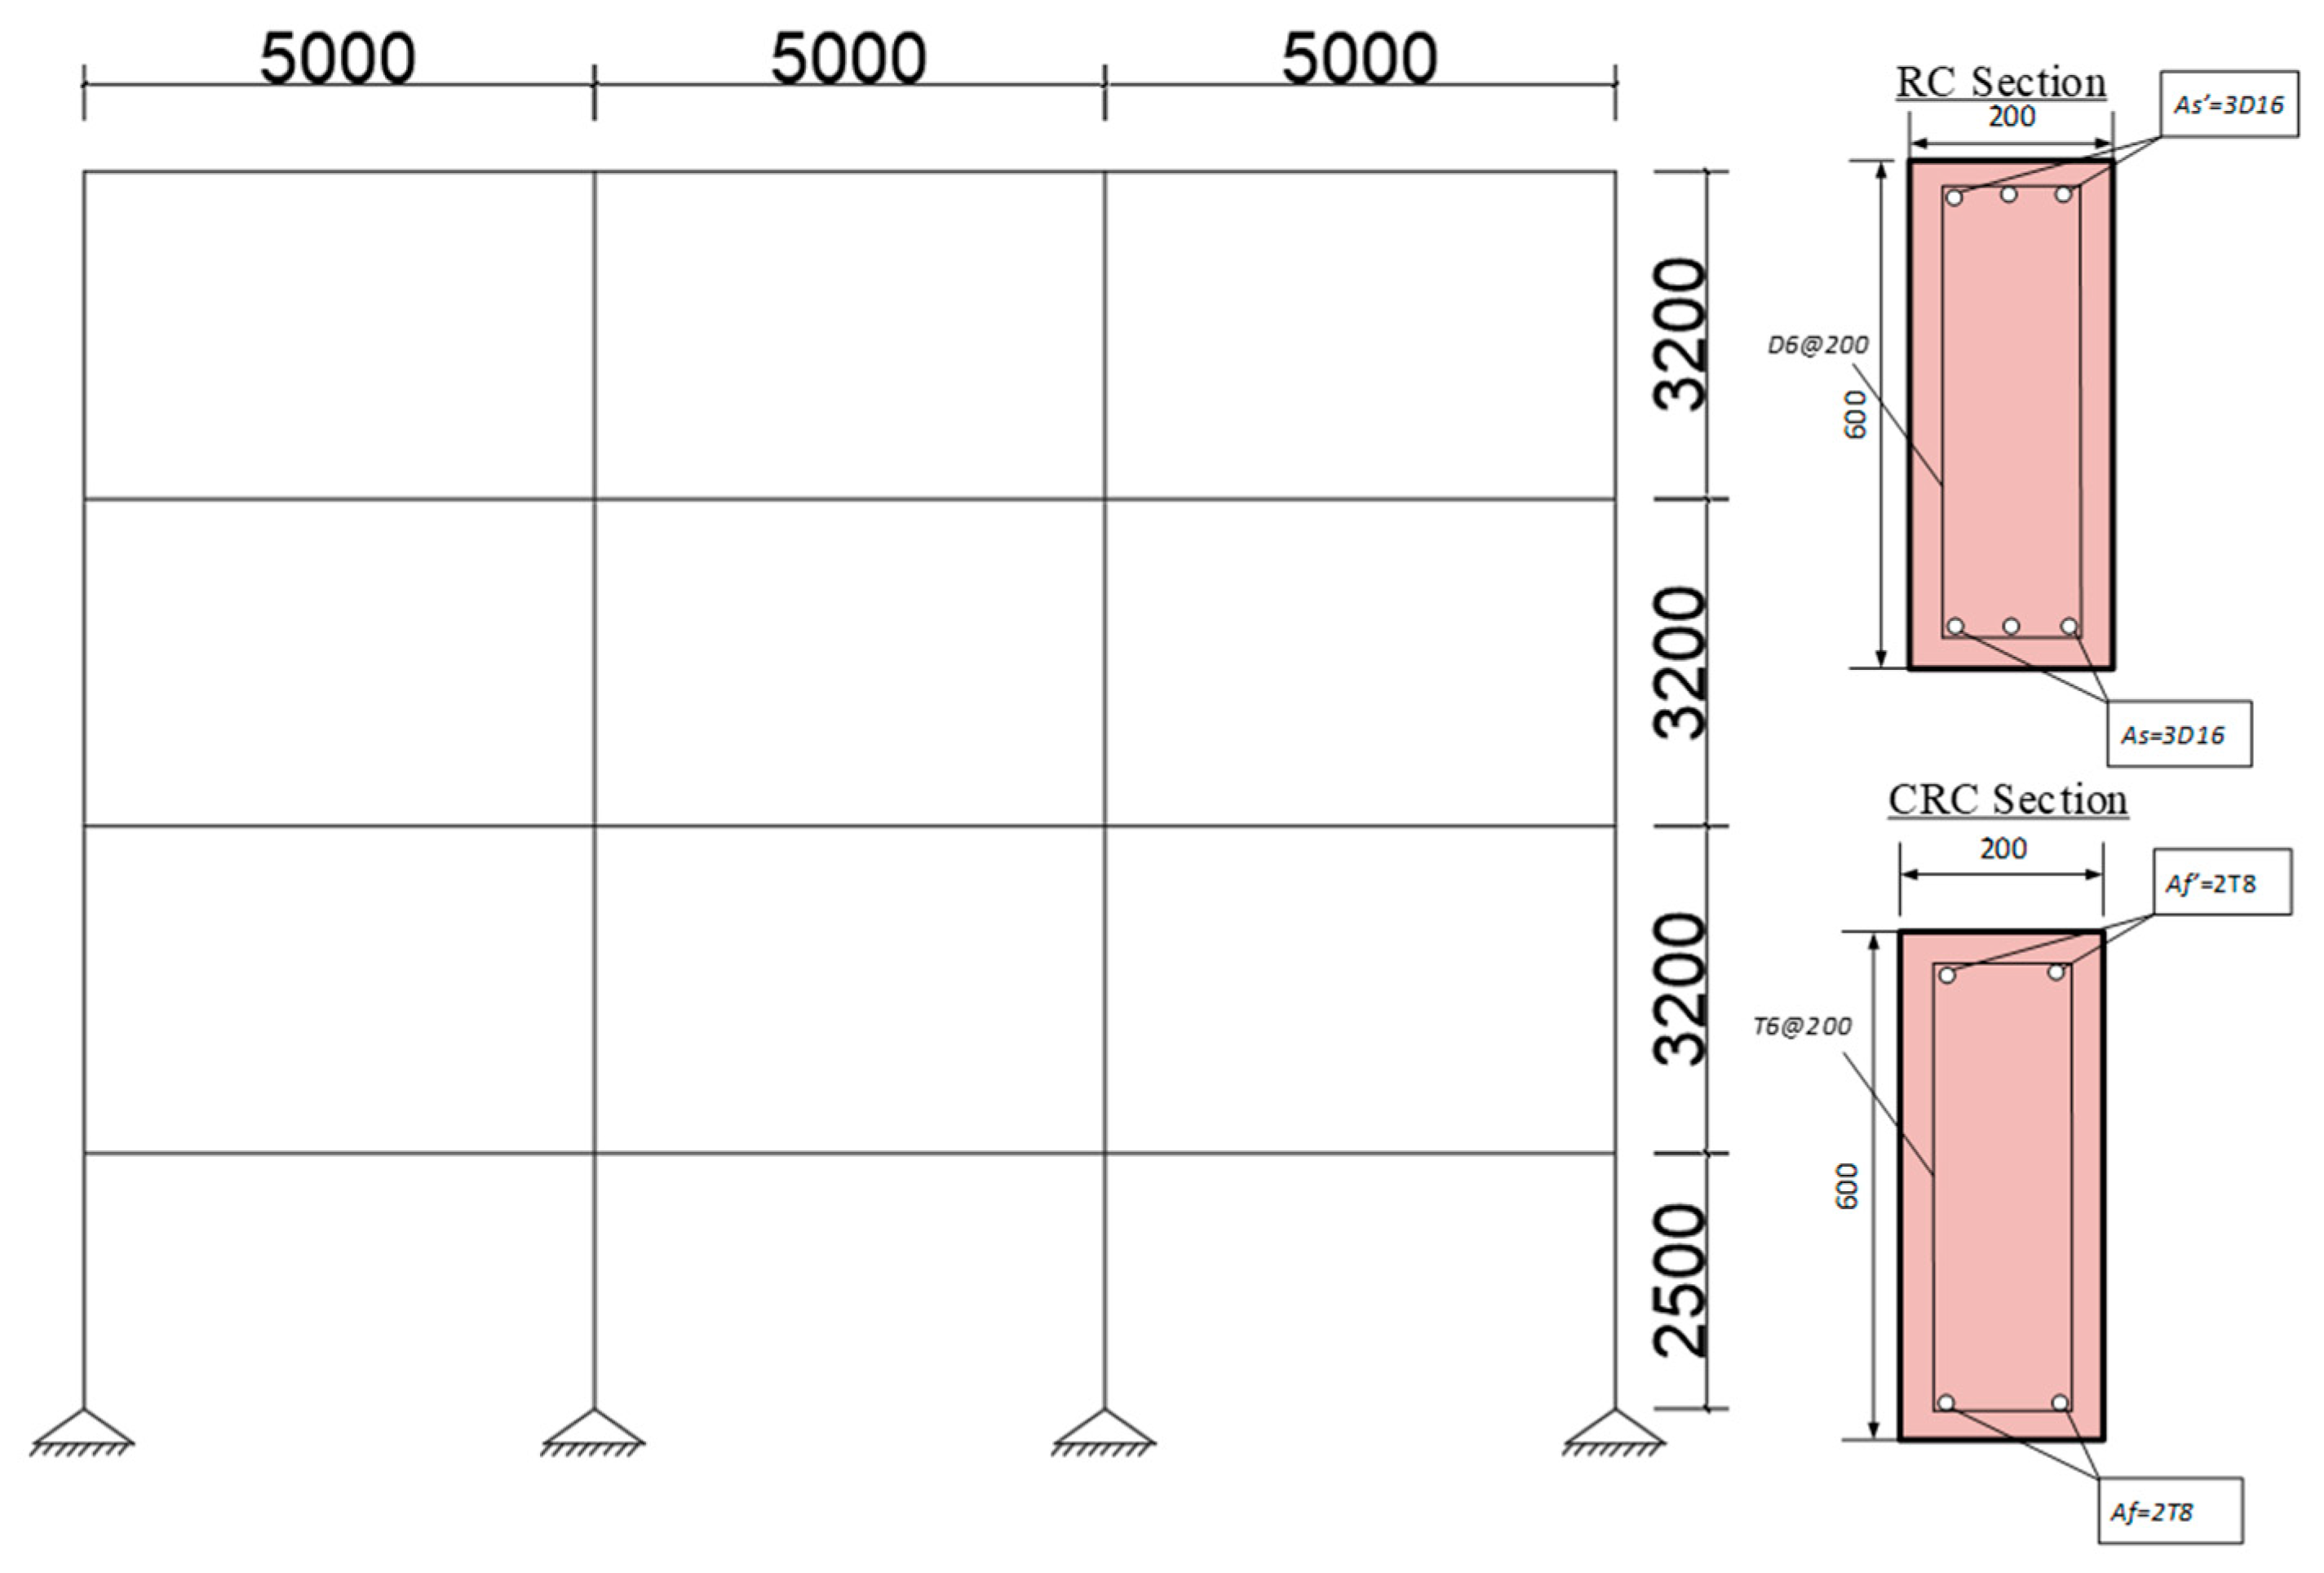
5.1. Overview of the Case Study

Our investigation focuses on an existing four-story building in Tel Aviv, within the West Israel district, which serves as a case study for our structural assessment. The building’s structural design is schematically illustrated in Figure 12. Although the building was primarily engineered to withstand gravity loads, its ability to resist seismic forces is limited due to the lack of seismic design principles in the construction standards at the time of its development. Nevertheless, the building exhibits a certain level of seismic resistance due to its structural framework of beams and columns. The scheme includes continuous beams with negative reinforcement at support points and overlapping reinforcement at column joints. The layout includes four frames per direction, with 5 m spans, resulting in a total floor area of 15 m × 15 m, where the total height is 12.1 m. The structure consists of beams and columns with cross-sectional dimensions of 200 × 600 mm. The beams support a dead load of 30 kN/m and a live load of 9.0 kN/m. Furthermore, the fundamental period of the structure is calculated to be 2.07 s, as illustrated in Figure 12.
Initially, we analyzed the building’s capacity to withstand seismic forces using a procedure as presented in Section 4, aiming to evaluate the performance of its stability system before the onset of corrosion—a process typically initiated around 20 years post-construction. Subsequent analyses were carried out 20, 45, 70, 95, 120, 145, and finally 170 years post-construction, to gauge the structure’s resistance against seismic loads across its lifespan. The findings indicated a decrease in the building’s ability to effectively sustain earthquake loads over time.
The changes in the properties of the material constituting the sections of the case structure are grounded on the models proposed in Section 3. These alterations are systematically documented in Table 2 and Table 3, which detail the material properties at each time point, alongside the pertinent parameters.

5.2. Modeling the Case Study

We modeled the scheme shown in Figure 12, integrating two reinforcement materials: one model reinforced with steel and the other with CFRP. We then performed a pushover analysis based on FEMA principles and tracked the development of plastic hinges throughout the analysis.

5.2.1. CFRP REBARS

CFRP is characterized by its high strength and lightweight nature, making it particularly effective in enhancing the load-carrying capacity, stiffness, and ductility of concrete structures. The mechanical properties of CFRP used in our modeling were derived from the data [50] and are presented in Figure 13.

5.2.2. STEEL BARS

As mentioned earlier, the second model was reinforced with steel bars, and the properties used for it are presented in Table 1.
The assumption in this study is that the mechanical properties of the steel bars remain constant over the years.

5.3. Long-Term Evolution of Section Properties

The properties of the degraded material, determined as described in Section 3, are presented in Table 2 and Table 3 for RC and CRC, respectively. These properties were used as inputs for numerical modeling, which we performed at discrete intervals throughout the structure’s extended service life.
For a clear distinction and comparison between the two trends, the data from Table 2 and Table 3 are presented in Figure 14.
Figure 14 shows that the plain concrete experienced a moderate decrease in strength, while the strength of RC was significantly impacted by corrosion.
The residual strength of the plain concrete and the RC in this case structure is quantified, respectively, by Equations (26) and (27):
f c u * t = 44.104 t 0.062
f c u * t = 634.75 t 0.965

5.4. RC Structure Analysis and Results

Pushover analysis of the RC structure at the selected ages shows the reduction in shear force capacity compared to the capacity at t = 0 years (Figure 15a–g) and highlights the impact of material degradation and corrosion over time on the structural capacity.
The ultimate capacity ratio (UCR) is outlined in Equation (28):
U C R = C u   t = N   C u   t = 0
where Cu t = N denotes the ultimate capacity at the tested year t = N and Cu t = 0 denotes the ultimate capacity at t = 0, prior to any corrosive activity.
The yielding displacement ratio (YDR) is detailed in Equation (29):
Y D R = D y   t = N   D y     t = 0
where Du t = N is the yield displacement at the tested year t = N and Dy t = 0 denotes the yield displacement at t = 0 before the onset of any corrosive activity.
Specifically, Figure 15a captures the structure’s capacity at the initial time t = 0 and again at t = 20 years; the similarity between these periods is represented by a single line. Figure 15b displays the capacity at t = 45 years compared to t = 0 and shows that the UCR decreased by 18.0% and the YDR increased by 56% compared to the structure that was not subjected to corrosion. Figure 15c shows the capacity at t = 70 years alongside the initial capacity curve, with a UCR decrease of 27.0% and a YDR increase of 87.8%. Continuing this sequence, Figure 15d shows a UCR decrease of 33.40% and a YDR increase of 106.0% within 95 years of construction. Figure 15e shows a UCR decrease of 33.10% and a YDR increase of 129.40% at t = 120 years. Figure 15f displays a UCR decrease of 41.80% and a YDR increase of 121.7% at t = 145 years. Finally, Figure 15g shows the capacity curve of the 170-year-old structure, with a UCR decrease of 50% and a YDR increase of 108.0%. Each figure demonstrates the progressive change in structural capacity over time, highlighting the long-term effects of material degradation and environmental stress. The variations in UCR and YDR over the years provide a precise quantitative measure of the degradation, presented in Figure 16.
The curves displayed in Figure 16 demonstrate that the ultimate capacity of the structure decreases over time due to the effects of corrosion. In addition, the structure experiences larger displacements upon yielding. This trend highlights a reduction in the ductility level of the structure as well as a decrease in its elastic stiffness, indicating progressive deterioration of structural integrity and resilience under seismic loads.

5.5. Analysis of CRC Structures

Pushover analysis of CRC structures of the same age as those selected for the RC analysis is summarized in Figure 17a–g. These figures illustrate the reduction in shear force capacity compared to the initial capacity at t = 0 years, highlighting the impact of aging and material degradation on the structural integrity of CRC structures over time.
Figure 17a shows the structure’s capacity at the initial time t = 0. Figure 17b presents the capacity at t = 20 years, with a UCR decrease of 2.80% and a YDR increase of 1% relative to t = 0. Figure 17c presents the capacity at t = 45 years, with a UCR decrease of 6.60% and a YDR increase of 3.64%. Figure 17d details the capacity at t = 70 years, indicating a UCR decrease of 10.0% and a YDR increase of 4.2%. Figure 17e displays the capacity at t = 95 years, showing a UCR decrease of 13.50% and a YDR increase of 11.10%. Figure 17f displays the capacity at t = 120 years, with a UCR decrease of 18.6% and a YDR increase of 9.7%. Figure 17g outlines the capacity at t = 145 years, which displays a UCR decrease of 20% and a YDR increase of 9.2%. Finally, Figure 17g presents the capacity curve at t = 170 years, with a UCR decrease of 23.8% and a YDR increase of 8.8%. Each figure demonstrates how the structural capacity evolves as the CFRP-reinforced structure ages and highlights the long-term effectiveness of CFRP reinforcement in maintaining structural integrity under changing conditions. The variations in UCR and YDR over the years are presented in Figure 18, which shows the degradation and adaptive responses of the structure.
The curves in Figure 18 show that with time, there is only a minor decrease in the ultimate capacity, and the structure experiences slight displacements upon yielding each year. This pattern indicates that the ductility level of the structure and its elastic stiffness are largely preserved, showcasing the effectiveness of CRC reinforcement in maintaining structural integrity and resilience over extended periods.
The outcomes from the analyses of both the RC and CRC structures are presented in Figure 19.
The trend illustrating the decrease in ratios over the years for both types of structures can be calculated based on Equations (30) and (31):
R C F C R C = 0.0015 t + 1       t > 0
R C F R C = 0.0032 t       t > 20   y e a r s W h e n : 0 < t < 20   y e a r s R C F = 1

5.6. Case Study Summary

After the mechanical properties of the materials comprising the case structure were analyzed and the predictive models detailed in Section 3 were refined, extensive analyses were conducted at various stages of the structure’s lifespan. Capacity curves were generated for each analysis point. When compared to the initial capacity (t = 0), it was evident that the structure’s ability to dissipate seismic energy diminished significantly over time. Specifically, in the RC structure, there was a dramatic decrease in energy dissipation capacity, indicated by a slope of 0.0032. Conversely, the CRC structure exhibited a more moderate decrease, with a slope of 0.0015, illustrating variations in durability and resilience between different reinforcement materials.

6. Conclusions

This study provided crucial insights into the durability and seismic performance of reinforced concrete structures under corrosive conditions and led to several important conclusions:
  • Our findings indicate that CRC-reinforced structures exhibit higher shear capacity than those reinforced with traditional steel. This conclusion is supported by the comparative analysis of shear tests performed across various sample structures, as detailed in Section 4.
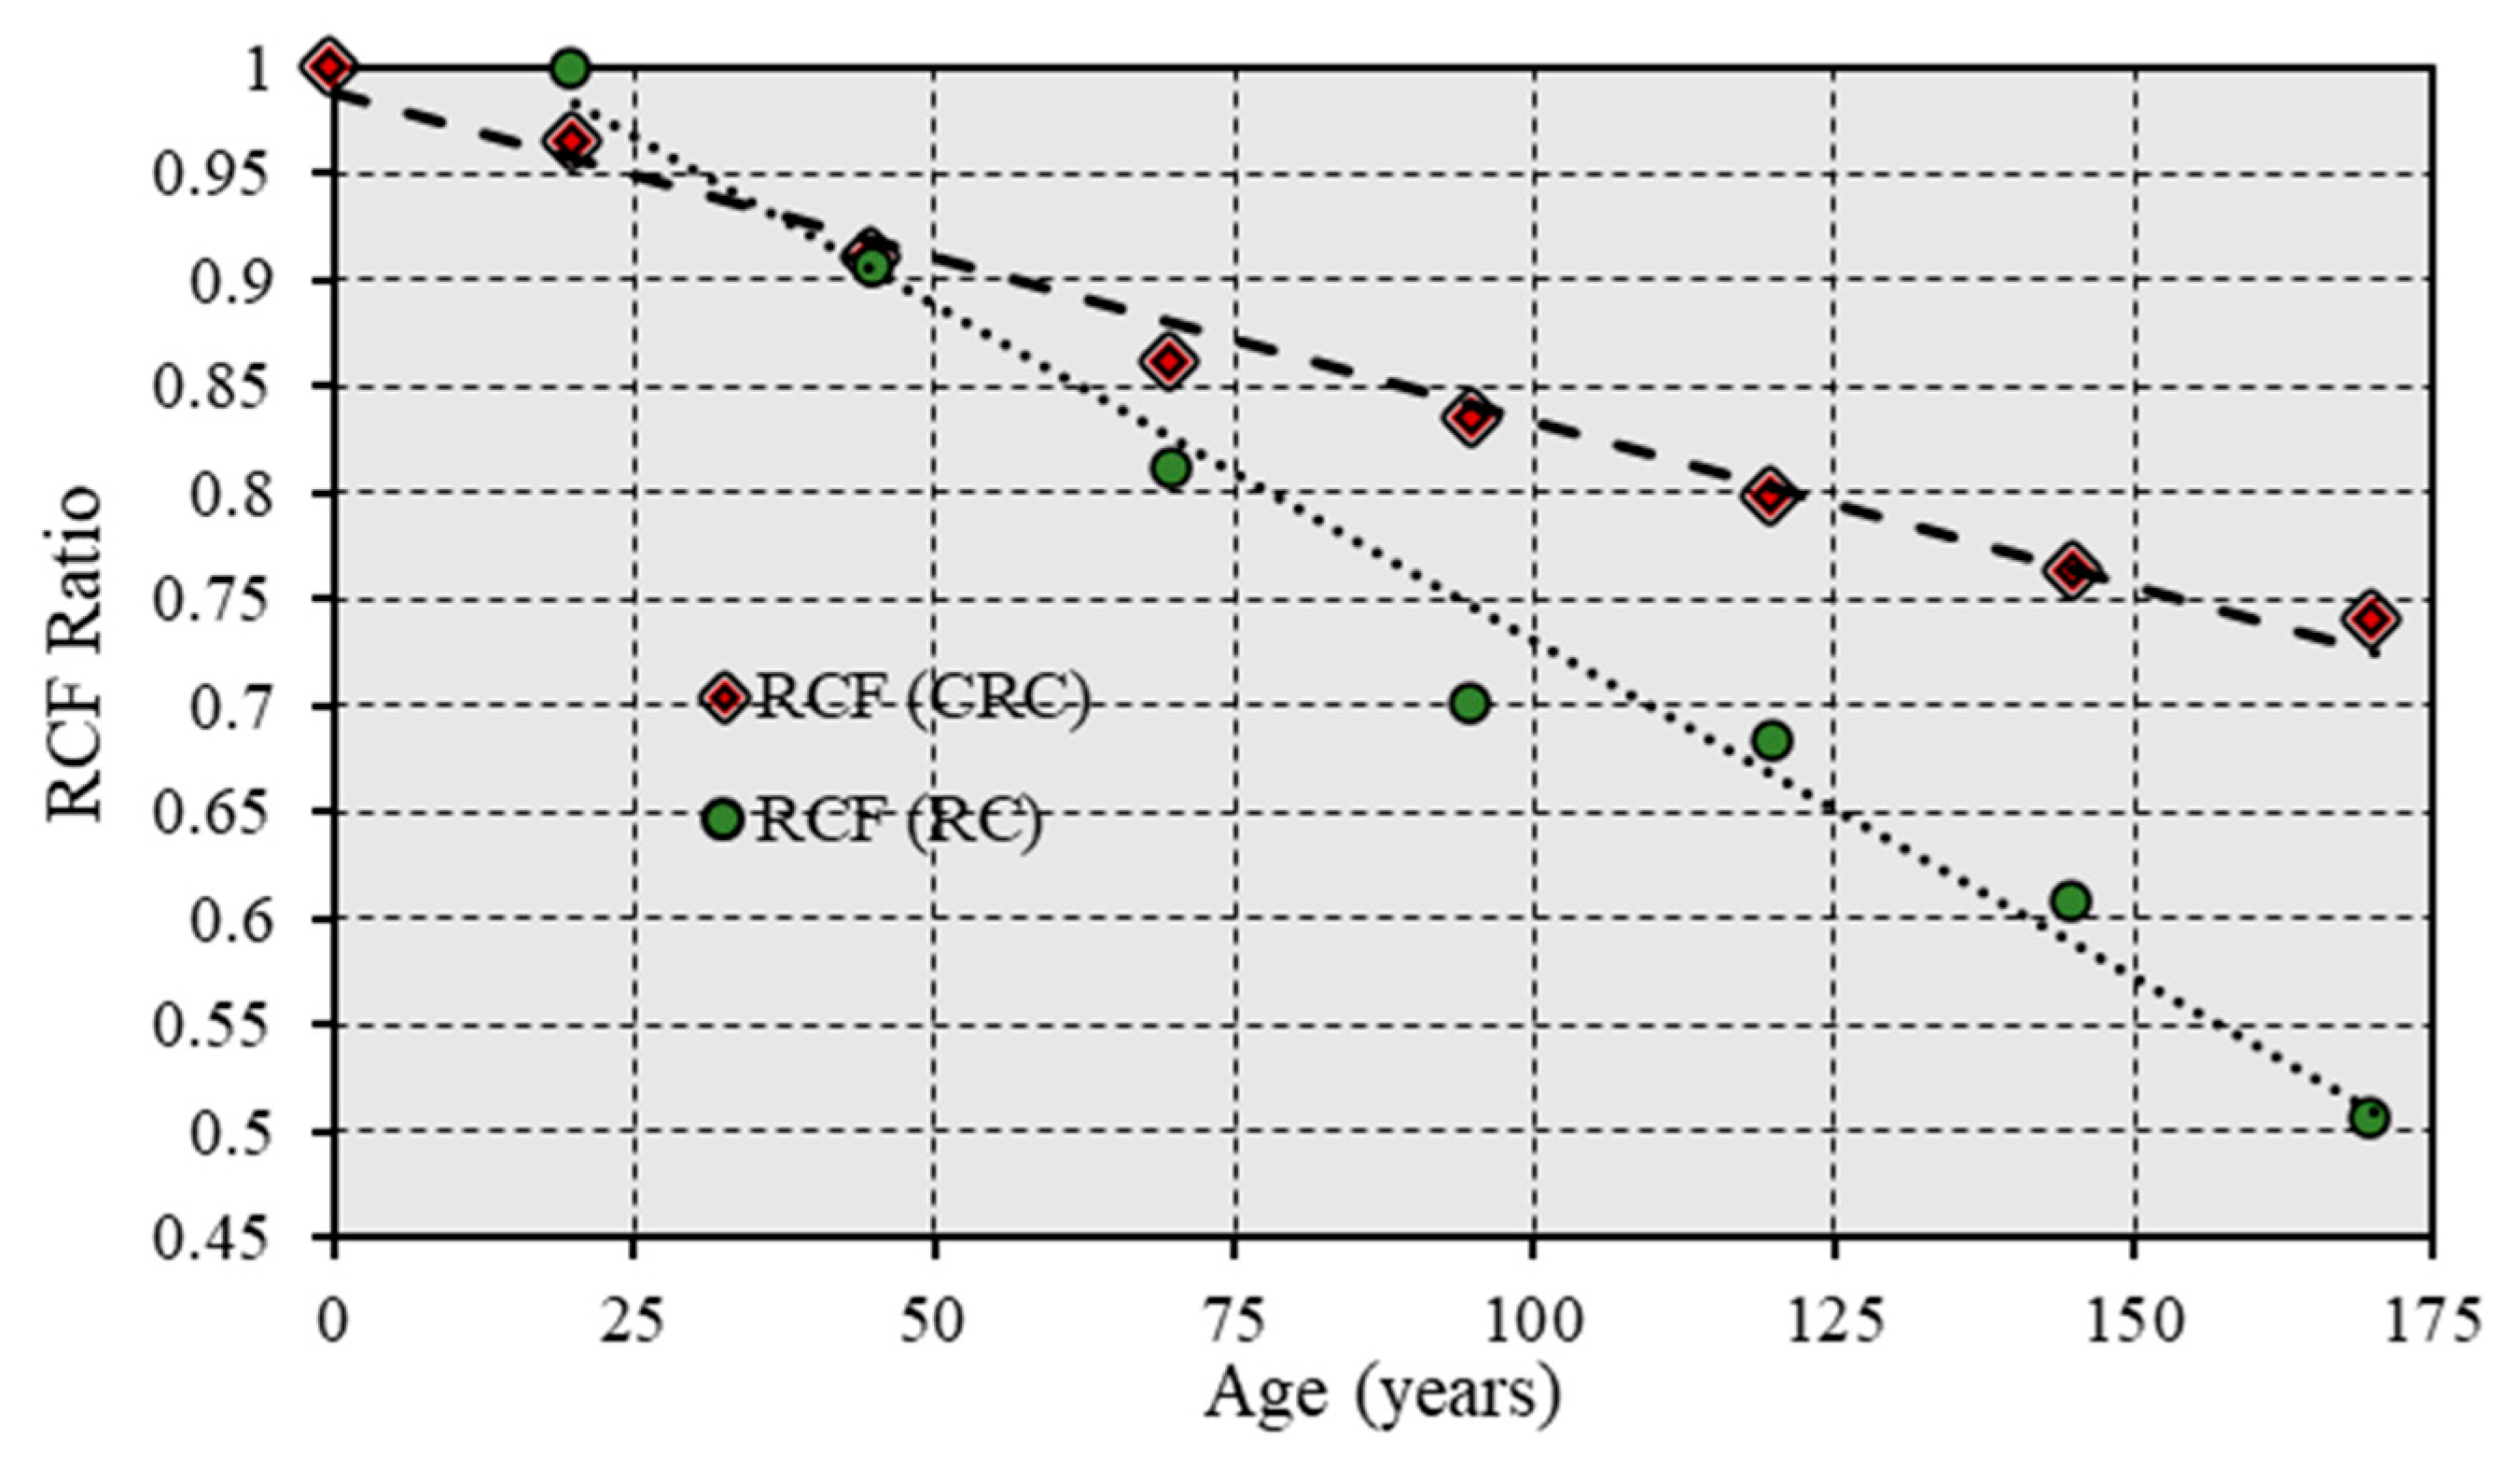
  • Steel and RC show a steep decrease in their ability to dissipate seismic energy over time, losing 54.4% of their capacity after 170 years, compared to a 25.5% loss in CRC structures. This observation is based on the long-term degradation analysis presented in Section 5, highlighting CRC’s resilience against environmental wear and tear.
  • The significant reduction in the RCF for RC structures is attributed to a 10% reduction in the concrete cross-sectional area, a 38% decrease in the steel reinforcement area, and an 84% reduction in concrete strength. These factors, thoroughly analyzed in Section 5.4, reflect the critical impact of material degradation on overall structural integrity.
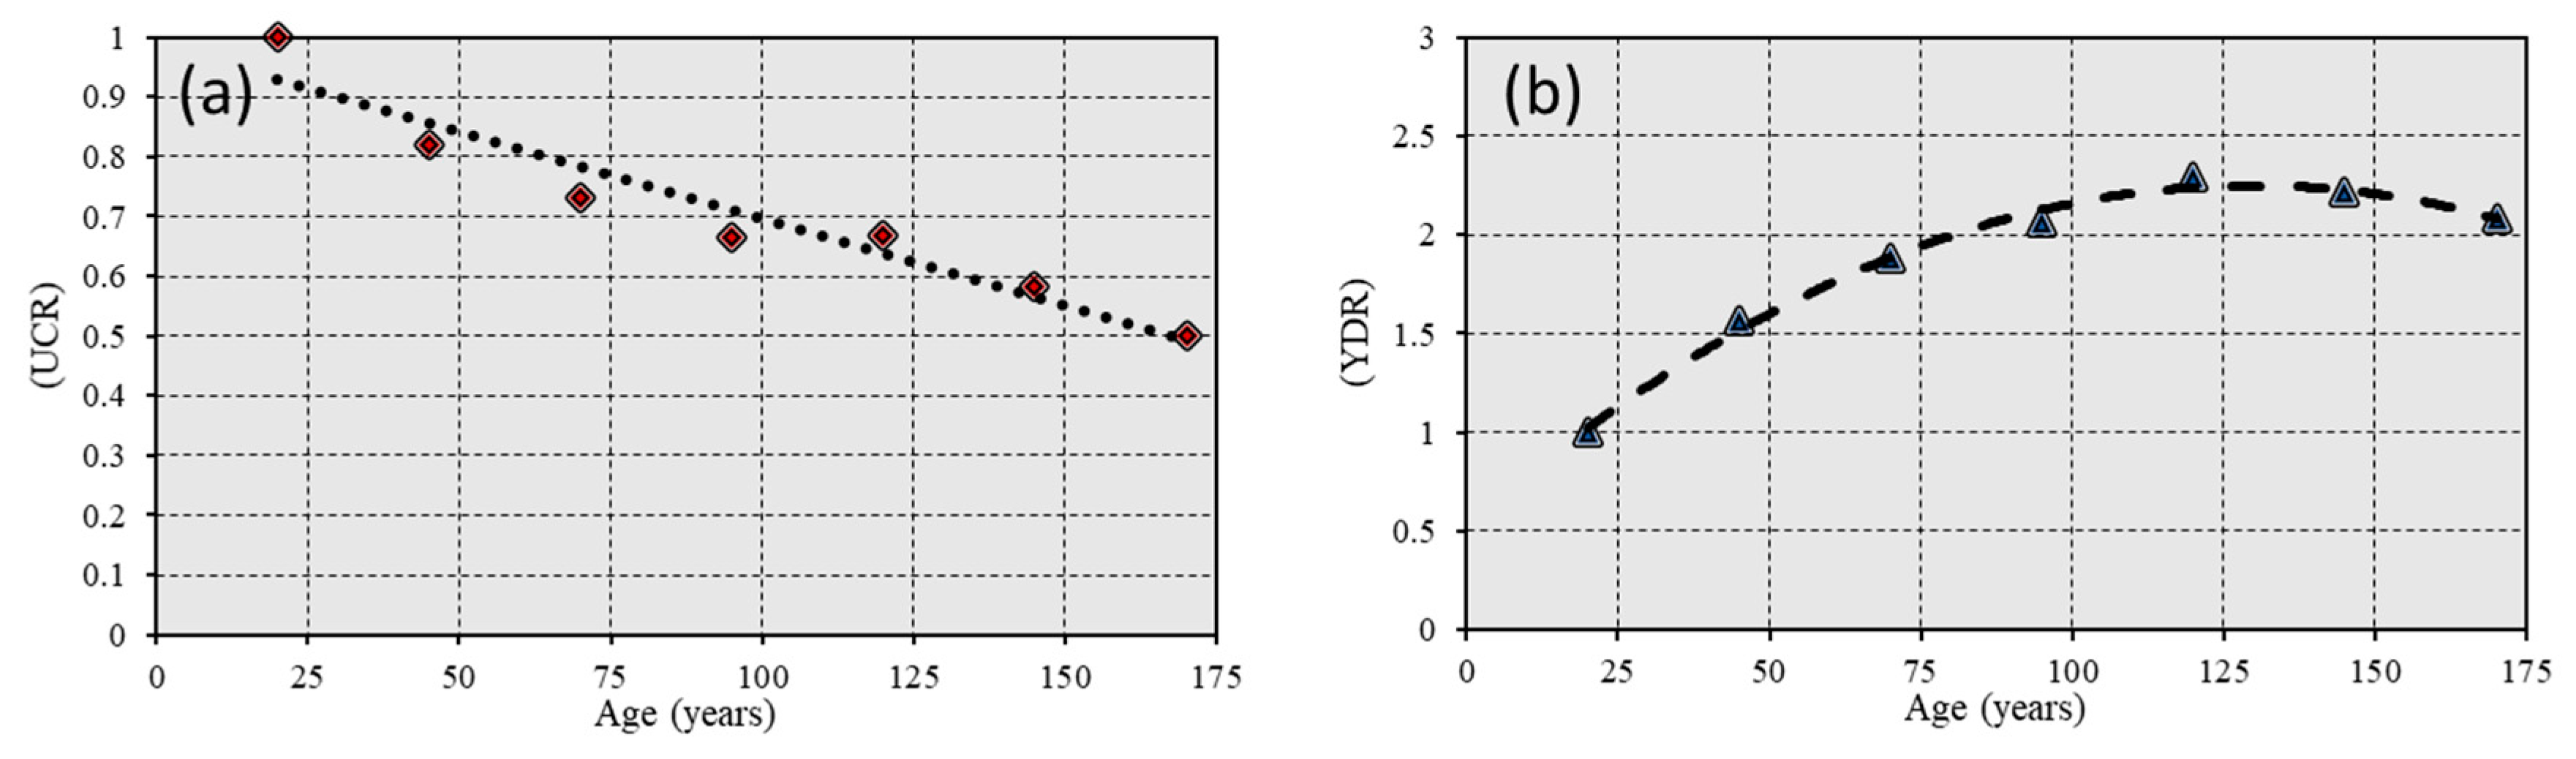
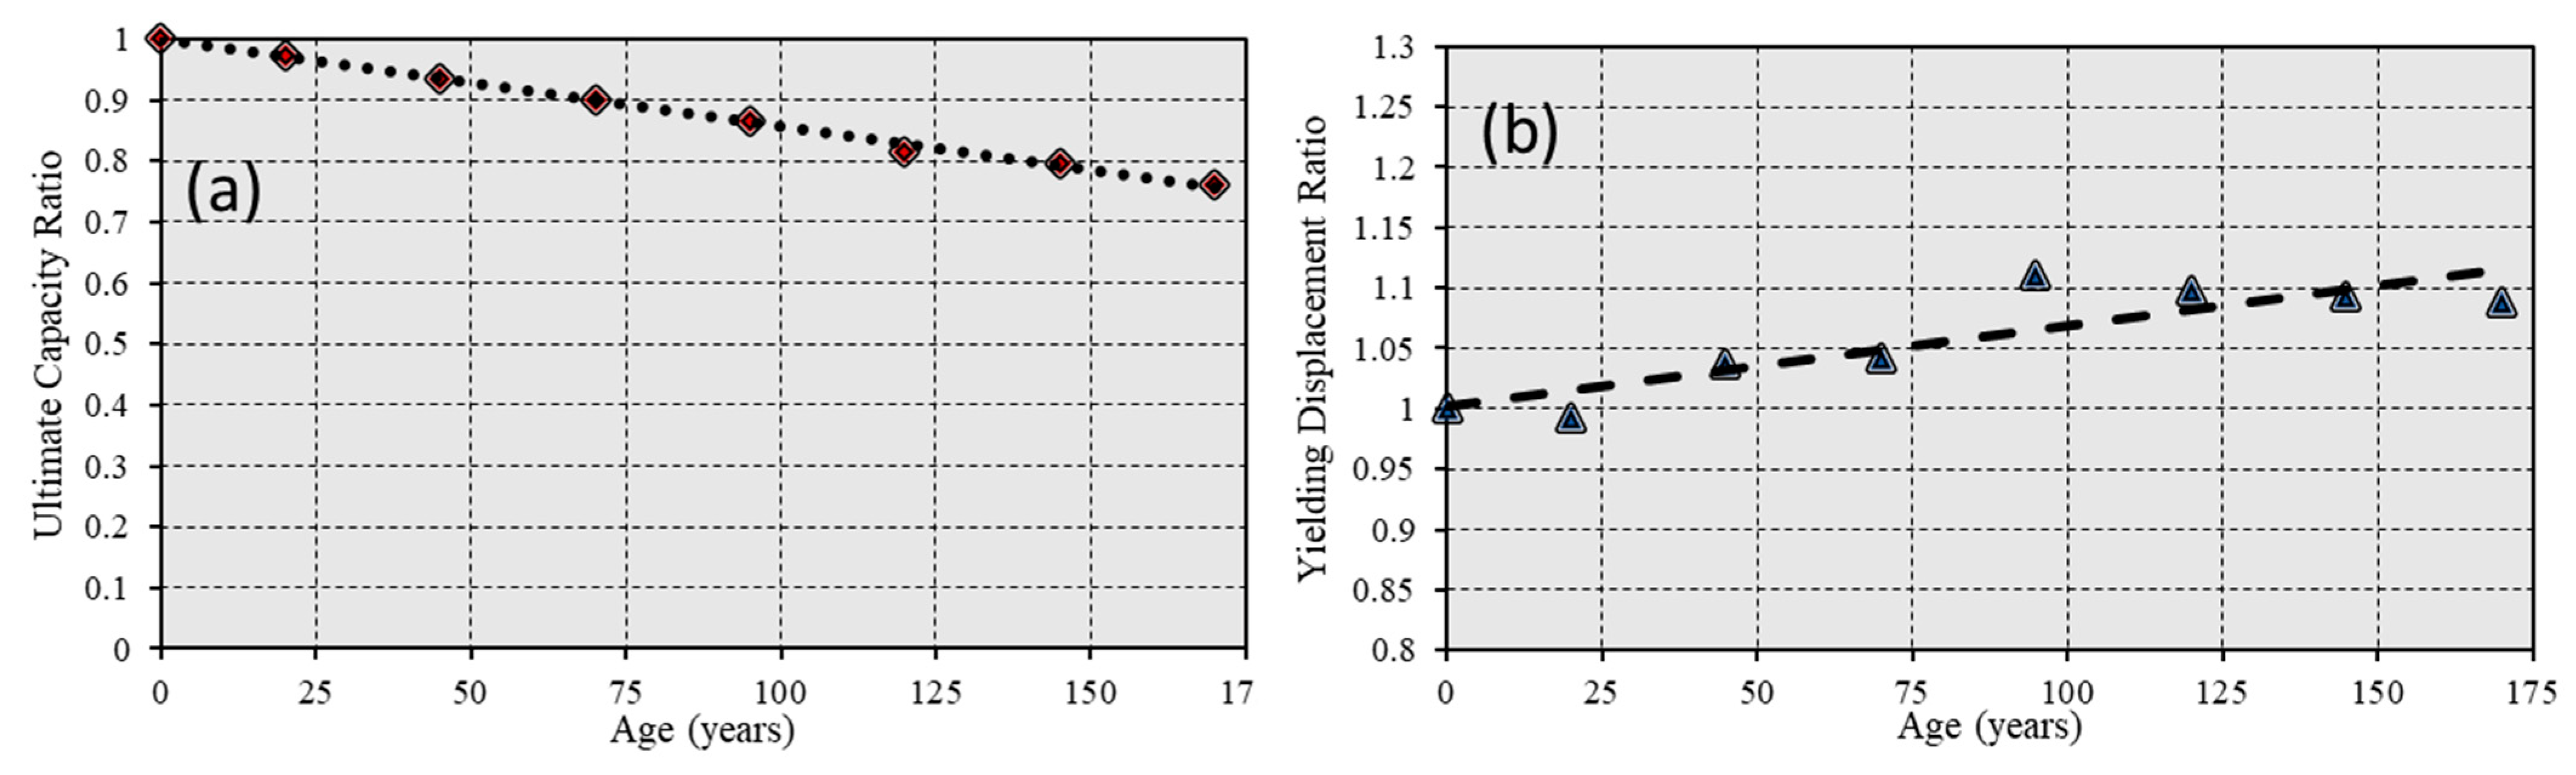
  • In contrast to RC, CRC structures maintain a consistent ultimate capacity and minimal variation in yield displacements over time, as elaborated in Section 5.4. This consistency in performance enhances their suitability for long-term applications in environments prone to corrosion.
  • The decrease in the RCF for the RC structures is primarily attributed to three significant factors:
    10% due to the reduction in the concrete cross-sectional area;
    38% due to the decrease in the cross-sectional area of the steel reinforcement;
    84% due to the reduction in concrete strength. This large percentage reflects the critical impact of material degradation on the overall structural integrity.
  • The use of CFRP shows potential in corrosive environments and is particularly suited for buildings with low seismic sensitivity and areas with low seismic risk, as explored in Section 4 and Section 5. This suitability is based on the comprehensive cost and material analysis conducted.
  • The level of residual seismic resistance in existing buildings can be quantitatively measured, providing a more precise understanding of a structure’s longevity and safety, as demonstrated through the application of the developed predictive model in Section 5.4.
In conclusion, the developed predictive model proves effective for the quantitative assessment of both existing and new buildings at various stages of their lifespan. This adaptable methodology allows for the evaluation of different building types and the comparison of retrofit scenarios. It highlights the benefits of using non-corrosive materials, such as CFRP, as a sustainable solution for maintaining long-term structural integrity. Future studies should integrate the seismic performance philosophy and consider the influence of infill and shear walls to analyze structural behavior under seismic loads and assess cost-effectiveness comprehensively. Additionally, we will incorporate the reduction in bonding strength into our modeling approach for RC members, which was initially omitted to simplify the simulation process, as discussed in Section 4. In future work, we will account for the progressive bond degradation and its impact on stress redistribution. This modification will be integrated into our modeling approach by introducing plastic hinges at the loading stages where they would develop, considering a degraded interface layer between the concrete and reinforcement.

Author Contributions

Conceptualization, M.M., G.L.S., I.S. and E.G.; methodology, M.M., G.L.S., I.S. and E.G.; software, M.M.; validation, M.M., G.L.S., I.S. and E.G.; formal analysis, M.M.; investigation, M.M.; resources, G.L.S. and E.G.; data curation, M.M., G.L.S., I.S. and E.G., writing—original draft preparation, M.M., G.L.S., I.S. and E.G.; writing—review and editing, G.L.S., I.S. and E.G.; visualization, M.M.; supervision, G.L.S., I.S. and E.G.; project administration, G.L.S., I.S. and E.G. All authors have read and agreed to the published version of the manuscript.

Funding

This research received no external funding.

Institutional Review Board Statement

Not applicable.

Informed Consent Statement

Not applicable.

Data Availability Statement

The original contributions presented in the study are included in the article, further inquiries can be directed to the corresponding author.

Conflicts of Interest

The authors declare no conflicts of interest.

References

  1. Abosrra, L.; Ashour, A.F.; Youseffi, M. Corrosion of Steel Reinforcement in Concrete of Different Compressive Strengths. Constr. Build. Mater. 2011, 25, 3915–3925. [Google Scholar] [CrossRef]
  2. Šavija, B.; Luković, M.; Hosseini, S.A.S.; Pacheco, J.; Schlangen, E. Corrosion Induced Cover Cracking Studied by X-Ray Computed Tomography, Nanoindentation, and Energy Dispersive X-Ray Spectrometry (EDS). Mater. Struct. 2015, 48, 2043–2062. [Google Scholar] [CrossRef]
  3. Šavija, B.; Luković, M.; Pacheco, J.; Schlangen, E. Cracking of the Concrete Cover Due to Reinforcement Corrosion: A Two-Dimensional Lattice Model Study. Constr. Build. Mater. 2013, 44, 626–638. [Google Scholar] [CrossRef]
  4. Di Sarno, L.; Pugliese, F. Numerical Evaluation of the Seismic Performance of Existing Reinforced Concrete Buildings with Corroded Smooth Rebars. Bull. Earthq. Eng. 2020, 18, 4227–4273. [Google Scholar] [CrossRef]
  5. Sherzer, G.L.; Ye, G.; Schlangen, E.; Kovler, K. The Role of Porosity on Degradation of Concrete under Severe Internal and External Brine Attack in Confined Conditions. Constr. Build. Mater. 2022, 341, 127721. [Google Scholar] [CrossRef]
  6. El Maaddawy, T.; Soudki, K. A Model for Prediction of Time from Corrosion Initiation to Corrosion Cracking. Cem. Concr. Compos. 2007, 29, 168–175. [Google Scholar] [CrossRef]
  7. Chung, L.; Jay Kim, J.H.; Yi, S.T. Bond Strength Prediction for Reinforced Concrete Members with Highly Corroded Reinforcing Bars. Cem. Concr. Compos. 2008, 30, 603–611. [Google Scholar] [CrossRef]
  8. Kabashi, N.; Këpuska, A.; Krasniqi, E.; Avdyli, B. Bond Coefficient Kb of Concrete Beams Reinforced with GFRP, CFRP, and Steel Bars. Civ. Eng. J. 2021, 7, 1235–1243. [Google Scholar] [CrossRef]
  9. Berto, L.; Vitaliani, R.; Saetta, A.; Simioni, P. Seismic Assessment of Existing RC Structures Affected by Degradation Phenomena. Struct. Saf. 2009, 31, 284–297. [Google Scholar] [CrossRef]
  10. Berto, L.; Caprili, S.; Saetta, A.; Salvatore, W.; Talledo, D. Corrosion Effects on the Seismic Response of Existing Rc Frames Designed According to Different Building Codes. Eng. Struct. 2020, 216, 110397. [Google Scholar] [CrossRef]
  11. Otieno, M.B.; Alexander, M.G.; Beushausen, H.D. Corrosion in Cracked and Uncracked Concrete—Influence of Crack Width, Concrete Quality and Crack Reopening. Mag. Concr. Res. 2010, 62, 393–404. [Google Scholar] [CrossRef]
  12. Stewart, M.G.; Mullard, J.A. Spatial Time-Dependent Reliability Analysis of Corrosion Damage and the Timing of First Repair for RC Structures. Eng. Struct. 2007, 29, 1457–1464. [Google Scholar] [CrossRef]
  13. Bohni, H. Corrosion in Reinforced Concrete Structures; Related Titles from Woodhead s Materials Engineering List; Woodhead Publishing: Cambridge, UK, 2005; ISBN 185573768X. [Google Scholar]
  14. Zhou, Y.; Zheng, Y.; Sui, L.; Hu, B.; Huang, X. Study on the Flexural Performance of Hybrid-Reinforced Concrete Beams with a New Cathodic Protection System Subjected to Corrosion. Materials 2020, 13, 234. [Google Scholar] [CrossRef]
  15. Musavi, S.A. Reinforcement of Weakened Concrete Beams Using Cfrp Composites. Int. J. 2023, 6, 732–737. [Google Scholar]
  16. Guo, Y. Assessing the Seismic Performance of Corroding RC Bridge Columns. Master’s Thesis, Oregon State University, Corvallis, OR, USA, 2011. [Google Scholar]
  17. Garcia, R.; Hajirasouliha, I.; Pilakoutas, K. Seismic Behaviour of Deficient RC Frames Strengthened with CFRP Composites. Eng. Struct. 2010, 32, 3075–3085. [Google Scholar] [CrossRef]
  18. Capozucca, R.; Cerri, M.N. Influence of Reinforcement Corrosion-in the Compressive Zone-on the Behaviour of RC Beams. Eng. Struct. 2003, 25, 1575–1583. [Google Scholar] [CrossRef]
  19. Toumpanaki, E.; Lees, J.M.; Terrasi, G.P. Analytical Predictive Model for the Long-Term Bond Performance of CFRP Tendons in Concrete. Compos. Struct. 2020, 250, 112614. [Google Scholar] [CrossRef]
  20. Wu, W.; He, X.; Yang, W.; Dai, L.; Wang, Y.; He, J. Long-Time Durability of GFRP Bars in the Alkaline Concrete Environment for Eight Years. Constr. Build. Mater. 2022, 314, 125573. [Google Scholar] [CrossRef]
  21. Sadowski, L.; Nikoo, M. Corrosion Current Density Prediction in Reinforced Concrete by Imperialist Competitive Algorithm. Neural Comput. Appl. 2014, 25, 1627–1638. [Google Scholar] [CrossRef]
  22. Maidi, M.; Sherzer, G.L.; Gal, E. Enhancing Ductility in Carbon Fiber Reinforced Polymer Concrete Sections: A Multi-Scale Investigation. Comput. Concr. 2024, 33, 385–398. [Google Scholar] [CrossRef]
  23. Valente, M. Seismic Upgrading Strategies for Non-Ductile Plan-Wise Irregular R/C Structures. Procedia Eng. 2013, 54, 539–553. [Google Scholar] [CrossRef]
  24. Valente, M.; Milani, G. Alternative Retrofitting Strategies to Prevent the Failure of an Under-Designed Reinforced Concrete Frame. Eng. Fail. Anal. 2018, 89, 271–285. [Google Scholar] [CrossRef]
  25. Sokołowski, P.; Bąk-Patyna, P.; Bysiec, D.; Maleska, T. Experimental Test of Reinforced Timber of FRCM-PBO with Pull-Off Adhesion Method. Materials 2022, 15, 7702. [Google Scholar] [CrossRef] [PubMed]
  26. Carlos, D.A.; Henrique, N.J.; Maria, C.H.; Maria, B.A. Bending Strength of Timber Beams Rehabilitated with Reinforced Epoxy Mortar Plates. J. Struct. Eng. 2008, 134, 792–800. [Google Scholar] [CrossRef]
  27. Seręga, S.; Kotynia, R.; Lasek, K. Numerical Modelling of Preloaded RC Beams Strengthened with Prestressed CFRP Laminates. Eng. Struct. 2018, 176, 917–934. [Google Scholar] [CrossRef]
  28. SAP-2000 SAP2000; Three Dimensional Static and Dynamic Finite Element Analysis and Design of Structures, Analysis Reference, Version 17. Computer and Structures, Inc.: Berkeley, CA, USA, 2017. Available online: https://www.csiamerica.com/products/sap2000 (accessed on 21 November 2024).
  29. Response-2000 Reinforced Concrete Sectional Analysis Using the Modifed Compression Field Theorty 2000. Available online: http://www.hadrianworks.com (accessed on 21 November 2024).
  30. Yao, W.; Jiang, S.; Fei, W.; Cai, T. Correlation between the Compressive, Tensile Strength of Old Concrete under Marine Environment and Prediction of Long-Term Strength. Adv. Mater. Sci. Eng. 2017, 2017, 251842. [Google Scholar] [CrossRef]
  31. Diab, A.M.; Elyamany, H.E.; Abd Elmoaty, A.E.M.; Shalan, A.H. Prediction of Concrete Compressive Strength Due to Long Term Sulfate Attack Using Neural Network. Alex. Eng. J. 2014, 53, 627–642. [Google Scholar] [CrossRef]
  32. ACI 440.1R-15 CNR-DT 200 R1/2012; Guide for the Design and Construction of Externally Guide for the Design and Construction of Externally Bonded FRP Systems for Strengthening Existing Structures Materials, RC and PC Structures, Masonry Structures. Consiglio Nazionale delle Ricerche: Rome, Italy, 2015.
  33. Saje, D.; Bandelj, B.; Šušteršič, J.; Lopatic, J.; Saje, F. Shrinkage and Creep of Steel Fiber Reinforced Normal Strength Concrete. J. Test. Eval. 2013, 41, 959–969. [Google Scholar] [CrossRef]
  34. Monteiro, I.; Branco, F.A.; De Brito, J.; Neves, R. Statistical Analysis of the Carbonation Coefficient in Open Air Concrete Structures. Constr. Build. Mater. 2012, 29, 263–269. [Google Scholar] [CrossRef]
  35. Bertolini, L. Steel Corrosion and Service Life of Reinforced Concrete Structures. Struct. Infrastruct. Eng. 2008, 4, 123–137. [Google Scholar] [CrossRef]
  36. Ismail, M.; Muhammad, B.; Ismail, M.E.G. Compressive Strength Loss and Reinforcement Degradations of Reinforced Concrete Structure Due to Long-Term Exposure. Constr. Build. Mater. 2010, 24, 898–902. [Google Scholar] [CrossRef]
  37. Eurocode 2 Design of Concrete Structures; European Committee for Standardization: Lausanne, Switzerland, 1992; 250p.
  38. Tuutti, K. Corrosion of Steel in Concrete. Ph.D. Thesis, Swedish Cement and Concrete Research Institute, Lund University, Stockholm, Sweden, 1982. [Google Scholar]
  39. Broomfield, J.P. Corrosion of Steel in Concrete, 3rd ed.; Broomfield, J.P., Ed.; CRC Press: London, UK, 2023; ISBN 9781003223016. [Google Scholar]
  40. Song, S.; Wang, G.; Min, X.; Duan, N.; Tu, Y. Experimental Study on Cyclic Response of Concrete Frames Reinforced by Steel-CFRP Hybrid Reinforcement. J. Build. Eng. 2021, 34, 101937. [Google Scholar] [CrossRef]
  41. Lu, C.; Yang, J.; Liu, R. Probability Model of Corrosion-Induced Cracking Time in Chloride-Contaminated Reinforced Concrete. In Proceedings of the International Conference on Durability of Concrete Structures, ICDCS 2016, Shenzhen, China, 30 June–1 July 2016; pp. 309–314. [Google Scholar] [CrossRef]
  42. AL-Ameeri, A.; Rafiq, M.I.; Tsioulou, O. Influence of Cracks on the Carbonation Resistance of Recycled Aggregate Concrete. In Proceedings of the fib Symposium, Lisbon, Portugal, 14–16 June 2021; pp. 422–431. [Google Scholar]
  43. FEMA-356; Prestandard and Commentary for the Seismic Rehabilitation of Buildings. FEMA: Washington, DC, USA, 2000; 518p.
  44. Shapiro, D.; Rojahn, C.; Reaveley, L.D.; Smith, J.R.; Morelli, U. NEHRP Guidelines and Commentary for the Seismic Rehabilitation of Buildings. Earthq. Spectra 1997, 435, 1–435. [Google Scholar] [CrossRef]
  45. Hakim, R.A.; Alama, M.S.; Ashour, S.A. Seismic Assessment of RC Building According to ATC 40, FEMA 356 and FEMA 440. Arab. J. Sci. Eng. 2014, 39, 7691–7699. [Google Scholar] [CrossRef]
  46. Maidi, M.; Shufrin, I. Evaluation of Existing Reinforced Concrete Buildings for Seismic Retrofit through External Stiffening: Limit Displacement Method. Buildings 2024, 14, 2781. [Google Scholar] [CrossRef]
  47. Beneldjouzi, M.; Remki, M.; Kehila, F. Displacement-Based Methodology for Seismic Analysis of a Retrofitted Substandard Low-Rise RC Building Using Conditional Mean Spectra. Iran. J. Sci. Technol. Trans. Civ. Eng. 2023, 48, 2847–2873. [Google Scholar] [CrossRef]
  48. Chopra, A.K. Dynamics of Structures: Theory and Applications to Earthquake Engineering, 4th ed.; Pearson: London, UK, 2012; ISBN 1292249188. [Google Scholar]
  49. Chopra, A.K.; Goel, R.K. Chopra-Goel-Capacity Demand Driagram Methods Based on Inelastic Design Spectrum-1999.Pdf. Earthq. Spectra 1999, 15, 637–656. [Google Scholar] [CrossRef]
  50. CSA S806-12; Design and Construction of Building Structures with Fibre-Reinforced Polymer. Canadian Standards Association: Toronto, ON, Canada, 2012; 198p.
Figure 1. Methodology framework.
Applsci 14 11079 g001
Figure 2. Predicted long-term compressive and tensile strengths for plain concrete.
Applsci 14 11079 g002
Figure 3. The predictive expansion and loss of compressive strength (X top refers to compressive strength degradation) of concrete over time (X bottom relates to time), analyzed by Diab et al. [31].
Applsci 14 11079 g003
Figure 4. Correlation between time and the expansion of corrosion, alongside the consequent reduction in steel reinforcement area, based on the predictive equations presented in [9].
Applsci 14 11079 g004
Figure 5. The trend of CFRP SR over time, highlighting the linear decrease in material strength, as provided by [32].
Applsci 14 11079 g005
Figure 6. The reduction coefficient for concrete compressive strength as a function of corrosion penetration, as reported by Di Sarno and Pugliese [4].
Applsci 14 11079 g006
Figure 7. Predicted long-term compressive strength of corrosive concrete.
Applsci 14 11079 g007
Figure 8. Predicted long-term behavior of corrosive concrete: (a) stress–strain curve; (b) modulus of elasticity.
Applsci 14 11079 g008
Figure 9. Basic presentation of a reinforced concrete bending frame for POA with a triangular pattern.
Applsci 14 11079 g009
Figure 10. DEM procedure through three key representations: (a) the initial shear capacity curve of the structure at the beginning of its lifespan, (b) the capacity curve at N years, and (c) two distinct periods together.
Applsci 14 11079 g010
Figure 11. Theoretical seismic resistance prediction method. (a) Shear capacity curves for the same structure across various ages. (b) Trend of decrease in resistance factors.
Applsci 14 11079 g011
Figure 12. Case frame geometry: this illustration showcases the beams and columns, highlighting the longitudinal reinforcement within the cross-sections.
Applsci 14 11079 g012
Figure 13. Mechanical properties of the CFRP reinforcement [50].
Applsci 14 11079 g013
Figure 14. Long-term loss of strength of RC and CRC concretes.
Applsci 14 11079 g014
Figure 15. Interaction of capacity curves for an RC structure over time. Comparison at CC t = 0 to (a) t = 20, (b) t = 45, (c) t = 70, (d) t = 95, (e) t = 120, (f) t = 145, and (g) t = 170 years.
Applsci 14 11079 g015
Figure 16. Trends in seismic performance of a case RC structure over time: (a) UCR; (b) YDR.
Applsci 14 11079 g016
Figure 17. Interaction of capacity curves for a CRC structure over time. At (a) t = 0, t = 20, (b) t = 45, (c) t = 70, (d) t = 95, (e) t = 120, (f) t = 145, and (g) t = 170 years.
Applsci 14 11079 g017
Figure 18. Trends in seismic performance of a case CRC structure over time. (a) UCR and (b) YDR.
Applsci 14 11079 g018
Figure 19. RCF prediction curves for RC and CRC structures.
Applsci 14 11079 g019
Table 1. Mechanical properties of steel reinforcement bars.
PropertiesUltimate Strain (mm/m)Yield Strength (MPa)Ultimate Strength (MPa)Elastic Modulus (GPa)
Steel bars7276414200
Table 2. Properties of RC cross-sections.
Age
(Years)
As (mm2)As’ (mm2)f*cu (MPa)Ec (GPa)Residual Cover—Top/Bottom (mm)
0602.88602.8837.5030.2830
20602.88602.8837.5030.2830
45559.96342559.9634225.2424.850
70518.63129518.6312913.6718.280
95478.8836478.88369.5515.280
12440.72035440.720357.4013.450
145404.14155404.141556.0712.190
170369.14719369.147195.1711.240
Table 3. Properties of CRC cross-sections.
Age
(Years)
As (mm2)As’ (mm2)f*cu (MPa)Ec (GPa)Residual Cover—Top/Bottom (mm)
0100.48100.4837.5030.2830
2097.6665697.6665637.5030.2830
4594.1497694.1497633.7528.7330
7090.6329690.6329633.1228.4630
9587.1161687.1161633.0028.4030
12083.5993683.5993632.7828.3130
14580.0825680.0825632.6328.2530
17076.5657676.5657632.4828.1830
Disclaimer/Publisher’s Note: The statements, opinions and data contained in all publications are solely those of the individual author(s) and contributor(s) and not of MDPI and/or the editor(s). MDPI and/or the editor(s) disclaim responsibility for any injury to people or property resulting from any ideas, methods, instructions or products referred to in the content.

